Abstract
Coconut holds significant importance as a fruit and oilseed crop in tropical and subtropical regions. However, low-temperature (LT) stress has caused substantial reductions in yield and economics and impedes coconut production, therefore constraining its widespread cultivation and utilization. The appropriate application of potassium (K) has the potential to enhance the cold tolerance of crops and mitigate cold damage, but the regulatory mechanisms by which K improves coconut adaptability to cold stress remain poorly understood. Transcriptome and metabolomic analyses were performed on coconut seedlings treated with LT (5 °C) and room temperature (25 °C) under various K conditions: K0 (0.1 mM KCL), KL (2 mM KCL), KM (4 mM KCL), and KH (8 mM KCL). Correlation analysis with physiological indicators was also conducted. The findings indicated that K absorption, nutrient or osmotic regulation, accumulation of substances, photosynthesis, hormone metabolism, and reactive oxygen species (ROS) clearance pathways played crucial roles in the adaptation of coconut seedlings to LT stress. LT stress disrupted the homeostasis of hormones, antioxidant enzyme activity, chlorophyll, K, and the regulation of nutrients and osmolytes. This stress also leads to the downregulation of genes and metabolites related to K transporters, hormone metabolism, transcription factors, and the metabolism of nutrients and osmolytes. Applying K helped maintain the homeostasis of hormones, antioxidant enzyme activity, chlorophyll, K, and the regulation of nutrients and osmolytes, promoted the removal of ROS, and reduced malondialdehyde, consequently diminishing the damage caused by LT stress to coconut seedlings. Furthermore, the comprehensive analysis of metabolomics and transcriptomics highlighted the importance of carbohydrate metabolism, biosynthesis of other secondary metabolites, amino acid metabolism, lipid metabolism, and ABC transporters in K’s role in improving coconut seedlings’ tolerance to LT stress. This study identified the pivotal biological pathways, regulatory genes, and metabolites implicated in K regulation of coconut seedlings to acclimate to LT stress.
1. Introduction
Low temperature (LT) is a major environmental stressor significantly impacting plant growth, development, quality, and geographic distribution [1,2]. Cold stress inhibits enzyme activity and photosynthesis, leading to reactive oxygen species (ROS) accumulation, oxidative damage, and membrane instability [3]. Generated both as signaling molecules and as by-products of aerobic metabolism, ROS activate signal-transduction pathways, including those of plant hormone signals, affecting gene expression. Excessive ROS is neutralized by enzymes such as superoxide dismutase (SOD), catalase (CAT), peroxidase (POD), and ascorbic acid POD (APX) [4]. Activation of SOD and accumulation of soluble sugars (SS) and low-molecular-weight substances are key adaptations [5,6], which help clear ROS and mitigate osmotic pressure [7]. Under cold stress, there is a notable increase in protective substances like SS and soluble proteins (SPr) observed across various plants [8]. Studies have documented significant increases in SS in plants such as citrus [9], red spruce [10], and coconut [8] under cold stress. The amino acid proline (Pro) plays a crucial role in stabilizing ROS, maintaining membrane integrity, and enhancing cold resistance [11]. Abscisic acid (ABA), a plant hormone, is pivotal in stabilizing membrane structures, regulating stomatal movements, and managing osmotic stress by controlling the expression of stress-related genes [12], with its exogenous application shown to benefit Magnolia liliiflora [13] and apple [14]. Auxin (IAA), an endogenous hormone, significantly affects plant growth and stress responses, acting through the IAA signaling pathway involving ARF and IAA response proteins (SAUR, ARGOS, IAA, PIN, AUX, and LAX) [15]. Emerging evidence also highlights the role of jasmonic acid (JA) in enhancing plant cold tolerance [16].
Plant gene expression responses to LT stress are key strategies for mitigating cold damage [17]. Over the past two decades, numerous components of cold response signaling pathways have been isolated and characterized, including messenger molecules like Ca2+, Ca2+-related protein kinases, and key transcription factors (TFs) [18]. The inducible factor C-cyclic peptide binding factor (CBF) expression protein (ICE)-CBF-cold response (COR) signaling module is one of the most well-studied systems [4]. CBFs/dehydration-responsive element-binding proteins (DREBs), members of the AP2/ethylene response factor (AP2/ERF) family, play a central role in cold acclimation [19]. The TF CBF is significantly upregulated by the ICE, an MYC-type basic helix-loop-helix family TF, which then activates the expression of downstream COR genes by binding to cis-elements in their promoters [20,21]. Furthermore, plants synthesize numerous cold-resistant proteins and protective substances, such as SS and Pro, which act as osmotic regulators to adjust osmotic potential and maintain membrane integrity [22].
The comprehensive analysis of transcriptomics and metabolomics is essential for understanding the intricate regulatory networks that manage plant responses to cold stress. Under such conditions, integrated transcriptomic and metabolomic analyses reveal enhancements in amino acid and sugar metabolism, indicating significant shifts induced by LT stress [23]. Specifically, pathways related to ABA/JA signaling and Pro biosynthesis play pivotal roles in enhancing cold resistance in wheat [1]. Most differentially expressed genes (DEGs) and differentially accumulated metabolites (DAMs) are predominantly enriched in various carbohydrate and amino acid metabolic processes. Notably, starch and sucrose metabolism, along with phenylalanine metabolism, are significantly enriched and crucial for the cold stress adaptation of Brassica napus [24]. The majority of DEGs are implicated in amino acid biosynthesis, plant hormone signaling, and mitogen-activated protein kinase (MAPK) signaling pathways [8]. Additionally, metabolomics analysis has shown that under cold stress, the levels of free polyamines (PA), plant hormones, and osmotic substances, including putrescine, spermine, spermidine, ABA, JA, raffinose, and Pro, are elevated [8,25]. The regulation of the ICE-CBF-COR pathway through Ca2+ signaling, MAPK signaling, and ROS signaling is critical for modulating the cold stress response in coconut and tea trees [8,26].
Furthermore, most genes and metabolites involved in flavonoid biosynthesis are upregulated in cold-resistant pepper varieties [25]. This approach has also been extensively applied to study the cold stress responses of crops like coconut [9]. Transcriptome analysis identifies WRKY, NAC, MYB, AP2/ERF, and bZIP as the most abundant TF families in many species under LT stress [27,28].
K is a vital nutrient that plays numerous roles in plants, such as enzyme activation, protein synthesis, photosynthesis, turgor pressure, osmotic regulation, membrane potential regulation, ion homeostasis, sugar cotransport, stress adaptation, and growth [29,30] and is essential for over 60 enzymes [31]. Its levels influence primary and secondary metabolite levels in plants [32]. In response to abiotic stress, K+ plays a regulatory role in various biochemical processes related to protein synthesis, carbohydrate metabolism, and enzyme activation, and various physiological processes such as Ca2+ signaling, photosynthesis, and stomatal control [33,34].
An increase in K2SO4 concentration (2% w/v) elevates levels of Pro, carbohydrates, and proteins in grapes, which correlates with increases in endogenous ABA, total phenols, PA, and SS exchange. Additionally, foliar spraying of K2SO4 (3% w/v) regulates the cold stress hormone ABA, reduces electrolyte leakage, and increases the accumulation of beneficial metabolites, therefore improving grape cold resistance. In K-supplemented grapes, an important domestication mechanism enhanced by ABA and PA could increase the supercooling ability of buds, which is a crucial pathway for frost resistance in dormant states [35]. The application of exogenous K+ also improves the biosynthesis of sorbitol and promotes the synthesis of photosynthetic products in Plantago asiatica under LT stress [36].
Coconut is a K-loving plant that requires a significant amount of K+ for its growth and development. Mild to moderate K+ deficiency can cause yellowing and withering of old coconut leaves [37]. Significantly, K+ deficiency reduces the yield and quality of adult trees [38]. Moreover, K+ deficiency also significantly impacts coconut physiological indicators (CAT, SOD, POD, Pro, MAD, ABA, IAA, etc.), as well as the expression of related pathway genes and metabolites [39].
Coconut (Cocos nucifera L.), a member of the palm family, is cultivated in approximately 93 tropical countries and regions around the world, covering a global area of about 12 million hectares. In China, coconut cultivation is primarily concentrated in Hainan, southern Yunnan, and the coastal regions of Guangxi, Guangdong, and Fujian, which collectively contribute only 0.27% to the global cultivation area. Hainan Province alone accounts for 99% of China’s coconut cultivation area [40,41].
Coconut serves as a significant oil and food energy crop in tropical and subtropical regions. It also acts as a natural beverage and fruit tree with substantial economic importance. Coconut water and meat are rich sources of protein, sugar, fatty acids, and amino acids [42].
The optimal temperature range for coconut growth is 27–32 °C, with an ideal average annual temperature around 29 °C. Yields significantly decline if the average monthly temperature drops to 18 °C within any year, and temperatures below 15 °C can cause flower drop, fruit drop, fruit cracking, and yellowing of leaves, potentially leading to the death of the plant [43,44]. Consequently, LT is a major limitation to the geographical distribution of coconuts and represents a common challenge in their cultivation. Recent years have seen an increased focus on enhancing coconut cold resistance due to growing demand [45]. K plays a crucial role in regulating coconut’s cold resistance [37,46]. Although studies on the physiological and molecular mechanisms of coconut cold stress and K+ deficiency response are advancing [8,39,46,47,48], detailing the impacts on plant physiology, related metabolites, gene expression, and the molecular mechanisms of stress response, the specific molecular mechanisms through which K+ modulates coconut’s cold resistance remain to be fully elucidated.
Considering the significant role of K+ in enhancing cold tolerance in crops, this study utilizes multiple omics approaches to (1) elucidate the effects of K+ application on genes and metabolism under LT stress, identifying the primary biological pathways and metabolic processes through which K+ regulates the cold tolerance of coconut seedlings; and (2) explore the gene metabolism regulatory network related to cold tolerance in coconut seedlings and elucidate the physiological and molecular mechanisms by which K+ influences cold adaptation in these seedlings. This constitutes the first comprehensive investigation into the adaptation mechanisms of K+-regulated coconut seedlings to cold stress, combining physiological, transcriptomic, and metabolomic analyses to offer new insights into the adaptation mechanisms of K+-regulated coconut seedlings under cold conditions.
2. Materials and Methods
2.1. Plant Materials and Treatments
The seed fruit was removed from “Wenye No. 2” yellow dwarf coconut seedlings that were 1.5 months post-germination, and the seedlings were recultivated in nutrient bags for 15 days. Seedlings with similar leaf size, height, and quantity were transferred to a hydroponic system using a non-nutritive substrate of quartz sand and vermiculite (20:6) in containers measuring 15 (d) × 20 (h) cm. The coconut seedlings were divided into eight treatment groups (40 plants in total), with each treatment comprising five biological replicates, i.e., five plants per treatment. They were then pre-cultured in a growth room for 15 days under conditions of 80–90% relative humidity, a light cycle of 16 h/8 h (light/dark), and a temperature cycle of 25 °C/25 °C (day/night). Then, coconut seedlings of consistent height (60 cm) were selected to start experiments under different K+ levels at LT (5 °C) and room temperature (RT; 25 °C). The standard K+ content of the coconut leaves was determined based on their standard K+ content [39,49]. Different K+ levels were set at 0.1 mM KCl (K+ deficiency, K0), 2 mM KCl (low K+, KL), 4 mM KCl (moderate K+, KM), and 8 mM KCl (high K+, KH) for treating the seedlings; the concentration of other nutrients followed the Hoagland and Arnon (1950) solution concentrations [50]. These treatments were divided into two groups, each containing four K+ level treatments (K0, KL, KM, and KH). One group (20 plants, 5 plants per treatment) was cultured at RT with different K levels (K0, KL, KM, and KH). Another group of coconut seedlings (20 plants, 5 plants per treatment) was transferred to an LT culture room to experiment with different K+ levels (K0, KL, KM, and KH) under cold conditions (5 °C). Both groups share the same photoperiod. All nutrient solutions were irrigated every 3 days. After 30 days of cultivation, the growth indicators or parameters of each treated coconut seedling were evaluated. Subsequently, photos were taken, and samples were collected, with three biological replicates collected randomly for each treatment. A portion of the collected samples was dried, weighed, and tested for K content. Fresh samples (leaves) were promptly subjected to microscopic structural observation. Another portion of the leave sample was immediately frozen in liquid nitrogen and stored at −80 °C for further physiological, metabolomic, and transcriptome analyses.
2.2. Determination of Dry Weight, Soil and Plant Analyzer Development Values, and K and Chlorophyll Contents
The soil and plant analyzer development (SPAD) value of coconut leaves was measured using the SPAD-502 Plus (Konica Minolta, Tokyo, Japan). To evaluate the dry weight of coconut seedlings, fresh stems, leaves, and roots were dried at 105 °C for 15 min and then at 70 °C for 72 h before being weighed using an electronic balance (Labpro, Shanghai, China). The dry weight of the entire plant (stem + leaves + roots) was calculated. Chlorophyll content was measured using spectrophotometers at 665 and 649 nm, calculated according to the method described by Wang et al. (2019) [51].
K+ measurement: First, 200 mg of dried and finely ground coconut leaf sample was transferred to a 100 mL digestion tube, 5 mL of sulfuric acid and 5 mL of perchloric acid were added, and the mixture was gently shaken. A curved neck funnel was placed at the mouth of the tube, which was heated until the digestive solution was colorless or transparent. Heating continued for an additional 5–10 min, and then the solution was allowed to cool. The digestion solution was transferred to a 100 mL volumetric flask, diluted with deionized water, and filtered. The content of K+ was measured using the filtrate: First, 5 mL of digestion filtrate was transferred to a 50 mL volumetric flask, and the volume was adjusted with deionized water. Then, 5 mL of blank digestion solution was added to prepare K+ standard solutions (2, 5, 10, 20, 40, and 60 µg·mL–1), and analysis was undertaken using an atomic absorption spectrophotometer (AA280FS, Agilent Technologies, Palo Alto, CA, USA), following the method reported by Bao (2000) [52].
2.3. Determination of SS, SPr, Pro, and Malondialdehyde Contents; Enzyme Activities; and Endogenous Hormones
To determine the contents of IAA, ABA, gibberellin (GA), zeatin (ZR), SS, SPr, Pro, and malondialdehyde (MDA), as well as the activities of SOD, CAT, POD, and APX, 0.1000 g of coconut leaf tissue was accurately weighed and mixed with pre-cooled PBS at a weight to volume ratio of 1:10. The sample was ground at high speed and centrifuged at 2500 rpm for 10 min. This was measured using 50 µL of supernatant. IAA, GA, ABA, ZR, MDA, SP, Pro, SOD, CAT, POD, and APX test kits and standards were all sourced from the Nanjing Jiancheng Biotechnology Research Institute, and measurements were strictly conducted according to the manufacturer’s instructions and the method reported by Li (2000) [53]. A 1 cm light path colorimetric tube and a blank colorimetric tube were used to set the baseline. The wavelength was set to 450 nm (IAA, ABA, GA, and ZR), 595 nm (SAP), 620 nm (SS), 532 nm (MDA), 520 nm (Pro), 550 nm (SOD), 405 nm (CAT), 420 nm (POD), and 450 nm (APX), and the absorbance was measured using enzyme markers (DG5033A, Nanjing Huadong Electronics Group Medical Equipment, Nanjing, China). All measurements were taken within 10 min after adding the termination solution. The concentration/activity was calculated based on the absorbance value according to the manufacturer’s formula [8,39].
2.4. Transcriptomics Analysis
Total RNA was extracted from frozen samples using an improved cetyltrimethylammonium bromide method. The purity and integrity of the RNA were evaluated directly by agarose gel electrophoresis. The RNA concentration was measured using a NanoDrop 2000 spectrophotometer (Thermo Fisher Scientific, Waltham, MA, USA). RNA integrity was quantified using the Agilent 2100 Bioanalyzer System (Agilent Technologies, Palo Alto, CA, USA).
Library preparation and RNA-seq analysis were performed at Beijing Biomarker Biotechnology Company and Beijing Biomarker Cloud Technology Company (Beijing, China). Libraries were prepared using the NEBNext® Ultra™ II RNA Library Prep Kit, and index codes were added to each sample. Sequencing was conducted on the Illumina® HiSeq2500 platform (Illumina, San Diego, CA, USA), with three replicates for each sample.
Raw reads were filtered to remove low-quality reads and adapters, resulting in clean reads. These clean reads were mapped onto the reference coconut genome [54] available at http://creativecommons.org/licenses/by/4.0/ (accessed on 1 August 2022) using the Hierarchical Indexing for Spliced Alignment of Transcripts (HISAT2) program [55]. Gene functional annotation utilized multiple databases: NCBI non-redundant protein sequences (Nr), Clusters of Orthologous Groups of proteins (COG/KOG), Swiss-Prot protein sequence database, Kyoto Encyclopedia of Genes and Genomes (KEGG), homologous protein families (Pfam), and Gene Ontology (GO) [56,57].
The expression level for each transcript region was quantified using the fragments per kilobase of transcript per million mapped fragments method [58]. Differential gene expression analysis was performed using DESeq software (1.6.3), and significance was determined using the Benjamini–Hochberg method. DEGs were defined based on |fold change (FC)| ≥ 1.5 and p < 0.05 [59].
GO term enrichment analysis of DEGs was conducted using the GOseq R software package (2.18.0) [60,61]. Additionally, KEGG pathway enrichment analysis of DEGs was performed using the KEGG Orthology Based Annotation System (KOBAS) software (3.0) [62].
2.5. Metabolomics Analysis
Sample preparation, metabolomics, and data analysis were conducted by Beijing Biomarker Biotechnology Co., Ltd., (Beijing, China) (http://www.biomarker.com.cn/ (accessed on 1 August 2022)). Initially, frozen coconut leaves were ground into liquid nitrogen powder, and 100 mg of this powder was added to a 1.5 mL Eppendorf tube. The samples were then extracted with 1.0 mL of 70% methanol aqueous solution at 4 °C for 24 h and centrifuged at 10,000× g and 4 °C for 10 min. The extract was filtered through a 0.22 µm nylon membrane and subjected to analysis by liquid chromatography-mass spectrometry (LC-MS). Extracts from three duplicate samples of each K treatment were mixed to prepare quality control samples. Throughout the analysis process, each quality control sample was measured alongside three corresponding experimental samples to ensure the stability of the analysis conditions.
The metabolic spectra of the leaf extracts (10 µL) were analyzed using an ultra-performance LC electrospray ionization mass spectrometry (UPLC-ESIMS/MS) system (Shimadzu). Chromatographic separation was achieved on a UPLC HSS T3 C18 column (2.1 × 100 mm, i.d., 1.8 µm) (Waters, Milford, MA, USA) maintained at 40 °C. The mobile phase consisted of water with 0.04% acetic acid (mobile phase A) and acetonitrile with 0.04% acetic acid (mobile phase B). A linear gradient program for elution was set as follows: 0–11.0 min from 5% to 95% B, 11.0–12.0 min from 95% to 5%, and 12.1–15.0 min maintained at 5%. The flow rate of the mobile phase was 0.40 mL/min.
Mass spectrometry and MS/MS analysis were performed using an API 4500 QTRAP LC-MS/MS system (AB SCIEX, Framingham, MA, USA). The ESI source parameters included turbo spray ion source, source temperature 550 °C, ion spray voltage 5.5 kV, curtain gas pressure 25 psi, ion source gas 1 pressure 55 psi, and gas II pressure 60 psi. Multiple reaction monitoring experiments used nitrogen at 5 psi as the collision gas, and quadrupole scanning results were obtained.
Metabolite identification relied on the public and cloud technology databases of Beijing Biomarker Biotechnology Co., Ltd., (Beijing, China) Qualitative analysis of metabolites identified by MS was conducted using open databases, including HMDB, MoToDB, MassBank, METLIN, and KNAPSAcK. Metabolite structures were analyzed using standard metabolic procedures, and quantitative analysis employed multiple reaction monitoring methods. Identified metabolites were analyzed using partial least squares discriminant analysis (PLS-DA). Principal component analysis (PCA) and orthogonal PLS-DA (OPLS-DA) were utilized to identify potential biomarkers. Biomarkers were selected based on significant DAMs using variable importance in projection (VIP) ≥ 1, FC ≥ 1.5, and p-value < 0.05 as criteria.
2.6. Integrated Metabolome and Transcriptome Analyses
The “correlation graph” in the R package was utilized to calculate the Pearson correlation coefficients (PCCs) between datasets, and Pearson correlation tests were employed to assess the correlation (R2) between DEGs and DAMs. Specifically, an Excel program was used to compute the coefficient correlation between log2 (FC) for each metabolite and log2 (FC) for each transcript. Using genes and metabolites with PCC > |0.8| and p < 0.05 to establish relevant network relationships, Cytoscape (version 2.8.2) was then used to visualize the relationship between the metabolome and transcriptome. In this analysis, the KEGG pathways enriched in DEGs and DAMs were compared (p < 0.05). DEGs and DAMs with high correlation in the KEGG pathway (p < 0.05) were selected for further analysis and network mapping [8,39,63].
2.7. Quantitative Real-Time PCR
The DEGs identified by RNA sequencing in coconut seedlings were verified using quantitative real-time PCR (qRT-PCR). Gene-specific qRT-PCR primers were designed (Table S1). The qRT-PCR cycles were run on a 96-well plate using the 480II real-time system (Roche, Carlsbad, CA, USA) with Hieff qPCR SYBR Green Master Mix (NotRox) (Yasen Biotechnology, Shanghai, China), according to the manufacturer’s instructions. The thermal cycling steps included denaturation at 95 °C for 5 min, followed by denaturation at 95 °C for 10 s, and annealing at 60 °C for 30 s. All qRT-PCR analyses were performed using three biological replicates and three technical replicates. Normalization was conducted using an internal reference gene (β-actin). Relative gene expression levels were calculated using the 2−ΔΔCT method [64].
2.8. Statistical Analysis
The data are presented as the mean ± standard deviation (SD) of three replicates. Statistical analysis was performed using SPSS software (version 20.0; SPSS, Chicago, IL, USA). The data were analyzed using a one-way analysis of variance to calculate the differences between samples. Student’s t-tests were used to determine the significance of the differences when p < 0.05. A result of p < 0.05 was considered statistically significant. Vector graphs and data tables were created using Excel 2020.
3. Results
3.1. Morphological Traits and Physiological Indicators
The phenotypes of coconut seedlings under different treatments are depicted in Figure 1a. To explore the tissue structure of coconut leaves at varying K levels under LT and RT conditions, leaf structures from coconut leaves in K0 to high K+ (KH) under LT, as well as KH under RT conditions, were observed through paraffin sectioning. It was noted that structural changes in coconut leaves with high KH under both LT and RT conditions were minimal, showing normal cell structures. However, under LT conditions in the K0 treatment, extensive lignification and corkification of cell walls, along with changes in cytoplasm, nucleus, and vessels, were evident (Figure 1b).
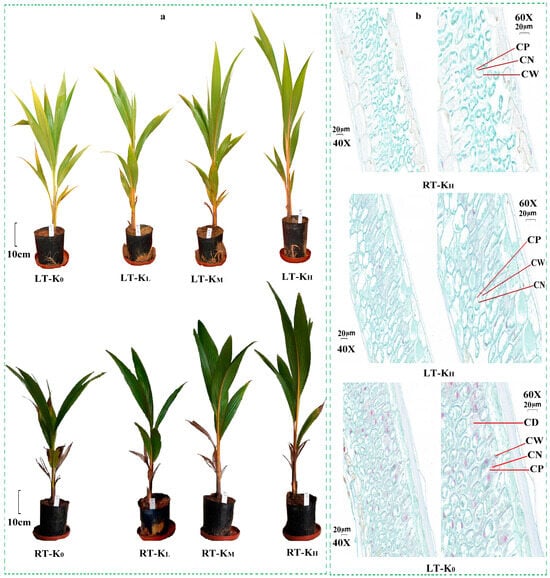
Figure 1.
Investigating the effect of different K levels on the growth of coconut seedlings under LT and RT conditions. Note: (a) Phenotypes of coconut seedlings treated with different K levels under LT and RT conditions; (b) Structural diagram of paraffin sections of coconut seedling leaves treated with different K levels under LT and RT conditions. CP, Cytoplasm; CW, cell wall; CD, cell duct; CN, cell nucleus. LT, RT, K0, KL, KM, and KH are detailed in Table 1.
The study also revealed that compared to the K0 treatment, the dry weight and leaf K content of single coconut seedlings increased significantly with K supplementation under both LT and RT conditions. Specifically, under LT conditions, the single plant dry weight and leaf K content in KH increased by 34.55% and 82.69%, respectively, compared to K0. Under RT conditions, increases of 33.62% and 81.82% were observed, respectively. When compared to RT conditions, the dry weight and leaf K content of coconut seedlings treated with the same K levels under LT conditions were significantly reduced.
Additionally, compared to the K0 treatment, the SPAD value and total chlorophyll content of leaves in the K treatment increased significantly under both LT and RT conditions, correlating with the increase in K levels. In particular, the SPAD value and total chlorophyll content of coconut seedlings in KH under LT conditions increased significantly by 56.79% and 84.53%, respectively, compared to K0. Under RT conditions, these values increased by 52.13% and 82.90%, respectively. However, compared to RT, LT significantly decreased the SPAD value and total chlorophyll content of coconut seedlings. The trends in SPAD values and total chlorophyll content across different temperature treatments were consistent with the observed changes in individual plant dry weight and leaf K content (Table 1).

Table 1.
Physiological responses of coconut seedling leaves treated with different K levels under LT and RT conditions.
In this study, to further validate the transcriptome and metabolomics results, crucial physiological indicators were assessed via the aforementioned screening process. The contents of endogenous hormones in the leaves of coconut seedlings were measured. Compared with the K0 treatment, the levels of IAA, ZR, and GA in the leaves of coconut seedlings increased under both LT and RT conditions with increasing K levels. Specifically, under LT conditions, KH treatment resulted in significant increases of 46.85%, 42.57%, and 41.29% in IAA, ZR, and GA, respectively. KM treatment resulted in significant increases of 41.55%, 40.83%, and 18.40% in IAA, ZR, and GA, respectively (p < 0.05, as below). Compared with the KL treatment, the KH treatment resulted in significant increases of 34.18%, 28.15%, and 25.71% in IAA, ZR, and GA, respectively. Similarly, compared with the K0 treatment, under RT conditions, these hormones in the KH treatment increased by 52.70%, 50.36%, and 45.46%, respectively. KM treatment resulted in significant increases of 42.29%, 48.78%, and 23.73% in IAA, ZR, and GA, respectively. Compared with the KL treatment, the KH treatment resulted in significant increases of 37.87%, 29.46%, and 29.42% in IAA, ZR, and GA, respectively. There were no significant differences in IAA, ZR, and GA between K0 and KL, KM, and KH under LT and RT conditions. In contrast to RT conditions, coconut seedling leaves treated with the same K levels under LT conditions exhibited an increase in IAA, ZR, and GA content. Conversely, compared to the K0 treatment, the ABA content decreased in the K treatments under both LT and RT conditions, diminishing further with increasing K levels. The ABA content in the KH treatment under LT conditions decreased significantly by 34.94%, in the KM treatment decreased significantly by 24.20%. Compared with the KL treatment, the ABA content in the KH treatment decreased significantly by 28.67%. Compared to the K0 treatment, under RT conditions, the decrease in KH was 34.61%, and the decrease in KM was 27.75%. Compared with the KL treatment, the ABA content in the KH treatment decreased significantly by 25.69%. There were no significant differences in ABA between K0 and KL, KM and KH under LT and RT conditions. Nonetheless, in comparison to RT conditions, the ABA content in coconut seedling leaves treated with the same K levels under LT conditions exhibited an increase (Figure 2). The above-mentioned findings suggest that exposure to low temperatures (cold stress) led to a decrease in the content of GA, IAA, and ZR while increasing the content of ABA. However, the application of K effectively mitigated these adverse effects, helping to maintain the homeostasis of endogenous hormones.
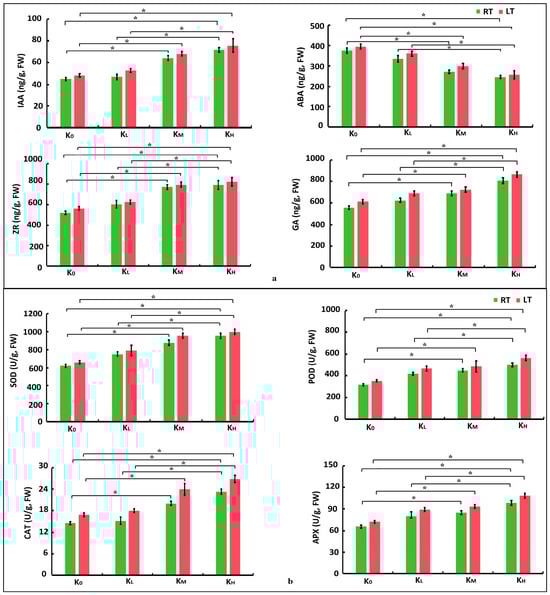
Figure 2.
Physiological characteristics of coconut seedling leaves across various K levels under LT and RT conditions. (a) Endogenous hormones; (b) Enzyme activities. Note: POD, peroxidase; SOD, superoxide dismutase; CAT, catalase; APX, ascorbic acid peroxidase; IAA, auxin; ABA, abscisic acid; ZR, zein; GA, gibberellin. The values are the average of three biological replicates and three detection experiment replicates (n = 6). The vertical bar represents the average standard error. The statistical significance was calculated by the Student’s t-test, and “*” indicated a significant difference at the p < 0.05 level. LT, RT, K0, KL, KM, and KH are detailed in Table 1.
Furthermore, the contents of key substances and the activity of key enzymes in the leaves of coconut seedlings were assessed under various treatments. It was observed that in comparison to the K0 treatment, the contents of SS and MDA in the leaves of coconut seedlings treated with K under both LT and RT conditions significantly decreased, with more pronounced decreases as K levels increased. Specifically, in KH under LT conditions, the contents of SS and MDA decreased significantly by 20.78% and 27.89%, respectively, and under RT conditions, they decreased by 49.30% and 58.69%, respectively. Conversely, compared to RT conditions, the contents of SS and MDA in coconut seedling leaves treated with the same K levels under LT conditions increased.
In comparison to the K0 treatment, the contents of SPr and Pro in coconut seedling leaves significantly increased in K treatments under both LT and RT conditions, showing a marked increase with higher K levels. Specifically, in the KH treatment under LT conditions, SPr and Pro contents increased by 42.45% and 74.39%, respectively. Correspondingly, under RT conditions, they increased by 41% and 72.42%, respectively. Additionally, when compared to RT conditions, the SPr and Pro contents in coconut seedling leaves treated with the same K levels under LT conditions also showed an increase (Table 1).
The activities of antioxidant enzymes, such as SOD, POD, CAT, and APX, displayed similar trends to the SPr and Pro contents. Compared to K0, the activities of SOD, POD, CAT, and APX in coconut seedling leaves in the KH treatment under LT conditions were significantly increased by 46.66%, 59.79%, 41.86%, and 49.98%, respectively, and in the KM treatment were significantly increased by 44.70%, 37.59%, 24.60%, and 29.49%, respectively. Compared to KL, the activities of SOD, POD, CAT, and APX in coconut seedling leaves in the KH treatment were significantly increased by 22.25%, 20.76%, 32.70%, and 21.14%, respectively. Compared to K0, under RT conditions, these increases in KH treatment were 49.29%, 57.85%, 53.16%, and 50.59%, respectively, and in KM treatment were 41.63%, 41.82%, 24.11%, and 30.08%, respectively. Compared to KL, the activities of SOD, POD, CAT, and APX in coconut seedling leaves in the KH treatment were significantly increased by 23.38%, 19.12%, 37.66%, and 22.82%, respectively (p < 0.05). There were no significant differences in SOD, POD, CAT, and APX between K0 and KL, KM, and KH under LT and RT conditions. Furthermore, compared to RT conditions, the activities of SOD, POD, CAT, and APX in coconut seedling leaves treated with the same K levels under LT conditions increased (Figure 2). These findings underscore that the strength of SOD, POD, and CAT activities reflects the plant’s capacity to remove ROS. LT stress leads to excessive ROS in coconut seedlings, therefore reducing their antioxidant capacity. The application of K promotes the removal of ROS in coconut seedlings, maintains the stability of the antioxidant system, and effectively reduces oxidative damage induced by LT stress.
3.2. Transcriptome Analysis
Transcriptome sequencing (RNA-seq) was conducted on 24 samples under K0, KL, KM, and KH treatments in both LT and RT conditions (each sample had three biological replicates). A total of 153.02 Gb of clean data were obtained, averaging 6.38 Gb per sample. The Q30 ratio exceeded 94.24% (Table S2).
This study primarily focused on six crucial comparison groups among the four K-level treatments under both LT and RT conditions. Genes meeting the criteria of |FC| ≥ 1.5 and p-value < 0.05 were considered to have significant differences in the comparison groups. Correlation analysis revealed a correlation exceeding 0.86 among the three replicates, suggesting the reliability of the data (Figure S1a,b). In the PCA, the initial principal component (PC1) accounted for 65% of the variance, whereas the subsequent principal component (PC2) elucidated 10.6% of the variance (Figure S1c,d). Under both LT and RT conditions, in the K0 vs. KL, K0 vs. KM, and K0 vs. KH comparison groups, the DEGs totaled 1891 (upregulated 1040 and downregulated 851), 918 (upregulated 484 and downregulated 434), and 1746 (upregulated 519 and downregulated 1227), respectively. Under both conditions, the number of upregulated DEGs in the K0 vs. KL and K0 vs. KM comparison groups was slightly higher than that of downregulated DEGs, but in the K0 vs. KH comparison groups, the number of upregulated DEGs was significantly lower than that of downregulated DEGs (Figure S2). The number and detailed information of annotated DEGs between each comparison group are shown in Figure S2 and Table S3.
GO analysis was performed on the annotated DEGs. In the first 20 categories of GO terms, cellular components (CC) were divided into eight items, molecular functions (MF) included four items, and biological processes (BP) encompassed eight items. DEGs were predominantly enriched in categories such as cells (GO: 0005623), cell parts (GO: 0044464), organelles (GO: 0043226), membranes (GO: 0016020), and membrane parts (GO: 0044425) within CC; cellular processes (GO: 0009987), metabolic processes (GO: 008152), single organic processes (GO: 0044699), and biological regulation (GO: 0065007) in BP; and binding (GO: 0005488) and catalytic activity (GO: 0003824) in MF (Figure S3).
GO enrichment analysis was conducted on DEGs in the K0 vs. KL, K0 vs. KM, and K0 vs. KH comparison groups under both RT and LT conditions according to GO analysis criteria (p-value ≤ 0.01, DEGs No. ≥ 2) (Table S4). Under LT conditions, except for K0 vs. KL, DEGs in K0 vs. KM and K0 vs. KH were all enriched in protein phosphorylation (GO: 0006468), biosynthetic processes (GO: 0009058), and steroid biosynthetic processes (GO: 0006694) in BP; integral components of membranes (GO: 0016021) and microtubules (GO: 0005874) in CC; and protein kinase activity (GO: 0004672) and coenzyme binding (GO: 0050662) in MF. Notably, DEGs in K0 vs. KM were also uniquely enriched in the steroid biosynthetic process (GO: 0006694) (BP), microtubules (GO: 0005874) (CC), and coenzyme binding (GO: 0050662) (MF). However, it was striking that DEGs in K0 vs. KH were uniquely enriched in the trehalose biosynthetic process (GO: 0005992), glutamine metabolic process (GO: 0006541), sphingolipid metabolic process (GO: 0006665), defense response (GO: 0006952), cell wall biogenesis (GO: 0042546), xyloglucan metabolic process (GO: 0010411), and oxylipin biosynthetic process (GO: 0031408) in BP. Additionally, they showed enrichment in protein serine/threonine kinase activity (GO: 0004674), protein serine/threonine phosphatase activity (GO: 0004722), xyloglucan: xyloglucosyl transferase activity (GO: 0016762), transferase activity, TF activity (GO: 0016740), and sequence-specific DNA binding (GO: 0003700) in MF.
Under RT conditions, DEGs in K0 vs. KL, K0 vs. KM, and K0 vs. KH were commonly enriched in the sesquiterpene biosynthetic process (GO: 0051762) (BP), integral components of membranes (GO: 0016021) (CC), and cyclic activity (GO: 0009975) (MF). Furthermore, it is worth mentioning that the DEGs in both the K0 vs. KL and K0 vs. KM comparisons were also commonly enriched in the chitin catabolic process (BP), cell wall macromolecule catabolic process (BP), and plasma membrane (GO: 0005886) (CC). In addition, the DEGs in both the K0 vs. KM and K0 vs. KH comparisons were commonly enriched in ATP binding (GO: 0005524), protein kinase activity (GO: 0004672), TF activity, sequence-specific DNA binding (GO: 0003700), sequence-specific DNA binding (GO: 0043565), magnesium-dependent protein serine/threonine phosphatase activity (GO: 0004724), and serine C-palmitoyltransferase activity (GO: 0004758) in MF. Remarkably, it was prominent that the DEGs in the K0 vs. KM comparison were uniquely enriched in the regulation of the JA-mediated signaling pathway (GO: 2000022), response to high light intensity (GO: 0009644) (BP), carbohydrate binding (GO: 0030246), oxidoreductase activity (GO: 0016709), and lipase activity (GO: 0016298) (MF). Though, it was worth noting that the DEGs in the K0 vs. KH comparison were also uniquely enriched in negative gravitropism (GO: 0009959) (BP), protein serine/threonine kinase activity (GO: 0004674), ubiquitin-protein transferase activity (GO: 0004842), transferase activity, transferring glycosyl groups (GO: 0016757), xyloglucan: xyloglucosyl transferase activity (GO: 0016762), and protein serine/threonine phosphatase activity (GO: 0004722) (MF).
In order to comprehend the function of DEGs, KEGG pathway enrichment analysis was performed using an FDR-adjusted p-value of 0.05 as the threshold. The comprehensive analysis results are presented in Table S5. The top 20 KEGG enrichment results are depicted in Figure 3. Under LT conditions, DEGs in the K0 vs. KL, K0 vs. KM, and K0 vs. KH comparisons were significantly enriched in pathways including plant hormone signal transduction (ko04075), flavonoid biosynthesis (ko00941), steroid biosynthesis (ko00100), linoleic acid metabolism (ko00591), alpha-linolenic acid metabolism (ko00592), and sphingolipid metabolism (ko00600). Under RT conditions, the DEGs in the K0 vs. KL, K0 vs. KM, and K0 vs. KH comparisons were commonly enriched in plant hormone signal transduction (ko04075); MAPK signaling pathway-plant (ko04016); flavonoid biosynthesis (ko00941); starch and sucrose metabolism (ko00500); plant-pathogen interaction (ko04626); valine, leucine, and isoleucine degradation (ko00280); and alpha-linolenic acid metabolism (ko00592). Notably, DEGs in the K0 vs. KH comparison under LT were uniquely enriched in starch and sucrose metabolism (ko00500), amino sugar and nucleotide sugar metabolism (ko00520), galactose metabolism (ko00052), and glycerophospholipid metabolism (ko00564). Under RT conditions, the DEGs in K0 vs. KH were uniquely enriched in amino sugar and nucleotide sugar metabolism (ko00520) and glycerophospholipid metabolism (ko00564) (Figure 3). These results suggest that K may primarily respond to LT stress by regulating pathways such as plant hormone signal transduction, flavonoid biosynthesis, starch and sucrose metabolism, amino sugar and nucleotide sugar metabolism, alpha-linolenic acid metabolism, galactose metabolism, and glycerophospholipid metabolism. Moreover, different K levels elicit varied molecular responses to LT stress.
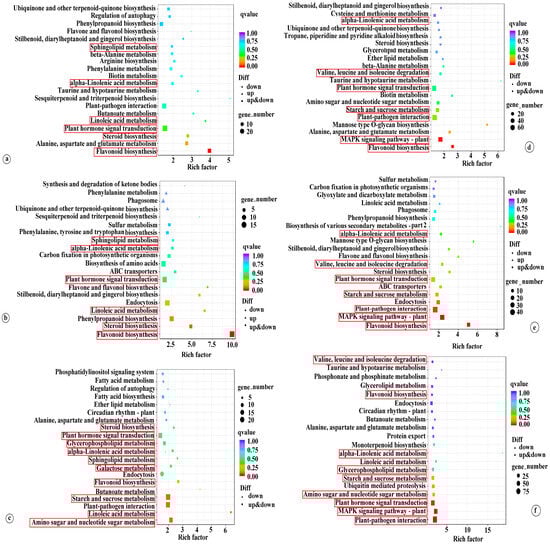
Figure 3.
Examining the top 20 KEGG enrichments of DEGs in coconut seedling leaves in different K levels under LT and RT conditions. Note: DEGs, differentially expressed genes; (a) K0 vs. KL in LT; (b) K0 vs. KM in LT; (c) K0 vs. KH in LT; (d) K0 vs. KL in RT; (e) K0 vs. KM in RT; (f) K0 vs. KH in RT. LT, RT, K0, KL, KM, and KH are detailed in Table 1.
3.2.1. Plant Hormone Signal Transduction
This pathway was significantly enriched across multiple comparison groups, with several key genes showing consistent expression patterns in K0 vs. KH under both LT and RT conditions. Among them, the expression of proteins TIFY (TIFY) and IAA-responsive proteins (IAA and SAUR) was downregulated, particularly the expression levels of TIFY9, TIFY10A, and SAUR32, which were significantly reduced. However, genes like probable xyloglucan endotransglucosylase/hydrolase proteins (XTH22 and XTH23), G-type lectin S-receptor-like serine/threonine-protein kinases (LECRK1, LECRK2, and LECRK4), rust resistance kinase Lr10 (LRK10), scarecrow-like protein 9 (SCL9), probably inactive leucine-rich repeat receptor-like protein kinase (At5g48380), pathogenesis-related protein (PR-1), MDIS1-interacting receptor-like kinase 2 (MIK2), and chitin-inducible GA-responsive protein 1 (CIGR1) were significantly downregulated in K0 vs. KH under RT conditions, conversely, other comparison groups exhibited no significant changes in expression. Compared with the control (K0), the expression of these genes was downregulated in high K treatment, suggesting that high K levels mitigate the inhibitory effects of these genes and reduce the damage from LTs to coconut seedlings. Moreover, under both LT and RT conditions, compared to K0, ethylene-responsive TF 1B (ERF1B), protein BZR1 homolog 1 (BZR1), and DELLA protein SLR1 (SLR1) were upregulated in treatments with varying K levels (KL, KM, and KH) (Figure 4).
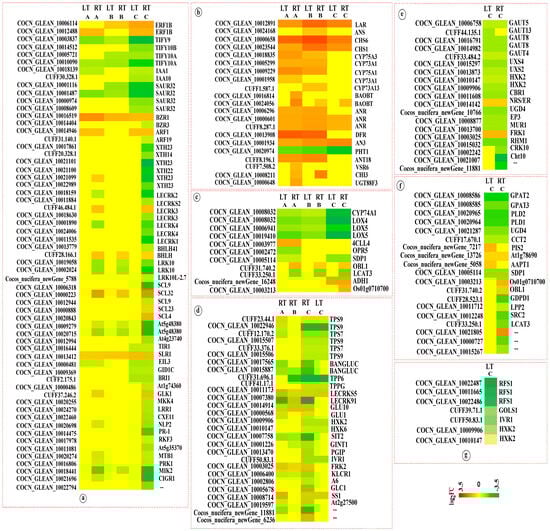
Figure 4.
Heat map of KEGG enriched DEGs in coconut seedling leaves in different K levels under LT and RT conditions. Note: DEGs, differentially expressed genes; A, K0 vs. KL; B, K0 vs. KM; C, K0 vs. KH; (a) Plant hormone signal translation; (b) Flavonoid biosynthesis; (c) Alpha-Linolenic acid metabolism; (d) Starch and sucrose metabolism; (e) Amino sugar and nucleoside sugar metabolism; (f) Glycerophospholipid metabolism; (g) Galactose metabolism. LT, RT, K0, KL, KM, and KH are detailed in Table 1.
3.2.2. Flavonoid Biosynthesis
The flavonoid biosynthesis pathway was significantly enriched in multiple comparison groups. Under both LT and RT conditions, compared to the control (K0), the genes for leucoanthocyanidin reductase (LAR), chalcone synthase (CHS) (CHS6 and CHS1), anthocyanidin reductase (ANR), and naringenin,2-oxoglutarate 3-dioxygenase (AN3) were upregulated in the KL, KM, and KH treatments. Additionally, genes for flavonoids (CYP75A3, CYP73A1, and CYP75A1), bifunctional dihydroflavonol 4-reductase/flavanone 4-reductase (DFR), and dihydroflavonol 4-reductase (ANT18) were upregulated under KL and KM treatments. However, compared to K0, putrescine hydroxycinnamoyltransferase 1 (PHT1) was downregulated under KL, KM, and KH treatments, with a significant downregulation under KH treatment. Markedly, the genes encoding LAR, CHS, DFR, and PHT1 showed significant expression changes (Figure 4), suggesting that K may primarily induce alterations in flavonoid biosynthesis, therefore mitigating LT damage.
3.2.3. Alpha-Linolenic Acid Metabolism
This pathway was significantly enriched across six comparison groups. Under LT and RT conditions, compared to K0 treatment, genes associated with alpha-linolenic acid metabolism, such as allene oxide synthase 1 (CYP74A1), lipoxygenase 4 (LOX4), and putative lipoxygenase 5 (LOX5) were downregulated in the KL, KM, and KH treatments, particularly under KH. Additionally, genes encoding triacylglycerol lipase SDP1 (SDP1) and phospholipase A1 LCAT3 (LCAT3) were significantly downregulated under KH treatment. Furthermore, three DEGs annotated as triacylglycerol lipase OBL1 (OBL1), alcohol dehydrogenase 1 (ADH1), and phospholipase A1-II 5 (Os01g0710700) were downregulated under KH treatment (Figure 4). These findings indicate that K might facilitate adaptation to LT stress in coconuts by regulating the expression of key enzymes in the alpha-linolenic acid metabolism pathway.
3.2.4. Starch and Sucrose Metabolism
This pathway was notably enriched in six comparison groups. Under both LT and RT conditions, compared to the control (K0), genes encoding probable α, α-trehalose-phosphate synthase (TPS7 and TPS9), probable trehalose-phosphate phosphatase (TPP6 and TPPG), hexokinase (HXK2 and HXK6), and beta-fructofuranosidase 1 (IVR1) were downregulated under KH treatment, particularly TPS9 and TPP6. Moreover, genes encoding glucan endo-1,3-beta-glucosidase (BANGLUC), L-type lectin-domain containing receptor kinase IX.1 (LECRK91), L-type lectin-domain containing receptor kinase (SIT2), and protein KINESIN LIGHT CHAIN-RELATED 1 (KLCR1) were downregulated in KL, KM, and KH treatments under RT conditions, significantly so under KH. Contrariwise, compared to K0, probable L-type lectin-domain containing receptor kinase S.5 (LECRKS5) was upregulated in KL, KM, and KH treatment under both LT and RT conditions, while endoglucanase 7 (GLU10) and fructokinase-2 (FRK2) were upregulated in KL, KM, and KH treatment under RT conditions (Figure 4). This suggests that K may help coconuts adapt to LT stress by regulating the expression of key enzymes in starch and sucrose metabolism pathways.
3.2.5. Amino Sugar and Nucleotide Sugar and Glycerophospholipid Metabolism
This pathway was significantly enriched in the K0 vs. KH comparison group under both LT and RT conditions. Relative to the control (K0), significant downregulation was observed in genes encoding probable galacturonosyltransferase (GAUT4 and GAUT5), galacturonosyltransferase 8 (GAUT8), UDP-glucuronic acid decarboxylase (UXS2 and UXS4), hexokinase-2 (HXK2), UDP-glucose 6-dehydrogenase 4 (UGD4), endochitinase EP3 (EP3), GDP-mannose 4,6 dehydratase 2 (MUR1), and UDP-4-keto-6-deoxy-D-glucose 3,5-epimerase (RHM1) under KH treatment. Additionally, genes for cysteine-rich receptor-like protein kinase 10 (CRK10), chitinase 10 (Cht10), and cocos_nucifera_newGene_11881 were significantly downregulated in the KH treatment. In contrast, bifunctional dTDP-4-dehydrorhamnose 3,5-epimerase/dTDP-4-dehydrorhamnose reductase (NRS/ER) and fructokinase-1 (FRK1) saw upregulation in KH treatment under both LT and RT conditions.
Conversely, the genes for probable glycerol-3-phosphate acyltransferase (GPAT2 and GPAT3), phospholipase D alpha (PLD1 and PLD2), UGD4, choline-phosphate cytidylyltransferase 2 (CCT2), and triacylglycerol lipase (SDP1) were downregulated, with significant downregulation noted for GPAT2, PLD1, and PLD2. Moreover, glycerophosphodiester phosphodiesterase (GDPD1), protein SRC2 (SRC2), phospholipase A (LCAT3), and lipid phosphate phosphatase 2 (LPP2) were significantly downregulated in the KH treatment under RT conditions. However, N-acylphosphatidylethanolamine synthase (At1g78690) was upregulated in KH treatment under both LT and RT conditions. Moreover, probable CDP-diacylglycerol-inositol 3-phosphatidyltransferase 2 (PIS2) and choline/ethanolamine phosphotransferase 1 (AAPT1) were upregulated under LT conditions. Correspondingly, phospholipase A1-II 5 (Os01g0710700) and triacylglycerol lipase (OBL1) were upregulated under RT conditions (Figure 4). These results suggest that K may help coconuts adapt to LT stress by modulating the expression of key enzymes and protein genes in the amino sugar, nucleotide sugar, and glycerophospholipid metabolism pathways.
3.2.6. Galactose Metabolism
The galactose metabolism pathway was notably enriched in the K0 vs. KH under LT conditions. Relative to the control (K0), genes for probable galactinol-sucrose galactosyltransferase 1 (RFS1), galactinol synthase 1 (GOLS1), IVR1, and HXK2 were downregulated in the KH treatment, with the expression of three DEGs encoding RFS1 significantly downregulated (Figure 4). This suggests that higher K levels may mitigate the inhibitory effects of these genes, therefore reducing the damage caused by LTs to coconut seedlings.
3.2.7. Major Regulator Genes
K Uptake-Related Genes: K uptake-related genes are pivotal in the metabolic pathways of K absorption, transportation, and transformation. Relative to the control (K0), genes including K transporters (POT1 and POT6), probable K transporters (HAK8, HAK9, and HAK13), cation/calcium exchanger 1 (CCX1), and probable voltage-gated K channel (KAB1) were upregulated in K treatments under both LT and RT conditions. Conversely, K channel AKT2 (AKT2 and KAT1), cation/calcium exchange 4 (CCX4), and K transporter 5 (HAK5) were downregulated (Table S6).
Ca2+ Signaling: This signaling pathway is crucial for K absorption, transportation, and conversion, with its Ca-binding proteins being key regulators. Among the 22 Ca2+ signaling genes identified, 15 genes (including probable calcium-binding proteins CML14, CML18, CML24, CML27, CML31, and CML48; calcium-binding proteins KIC and CP1; calcium-dependent protein kinases (CPKs) CPK18, CPK20, and CPK29; calcineurin B-like protein 3 (CBL3); and CBL-interacting protein kinases CIPK1, CIPK18, and CIPK19) were downregulated in KH treatment under both LT and RT conditions. However, seven genes (including probable calcium-binding proteins CML7, CML36, and CML45; CPK19; and CBL-interacting protein kinases CIPK6, CIPK23, and CIPK32) were upregulated (Table S6).
Phytohormones: These play a crucial role in plant responses to LT stress. Compared with K0, genes including IAA-responsive proteins (IAA1 and IAA10), IAA transporter-like proteins (LAX2 and LAX4), IAA response factors (ARF1 and ARF2), IAA efflux carrier components (PIN2 and PIN3), GA receptor (GID1C), and probable protein phosphatases 2C (PP2C6 and PP2C27) were upregulated in K treatments under both LT and RT conditions. However, genes for IAA-responsive protein (SAUR32), IAA response factor (ARF19), CIGR1, ABA receptors (PYL4 and PYL8), and probable protein phosphatases 2C (PP2C34 and PP2C38) were downregulated (Table S6).
ROS Management: Reducing or removing ROS is vital for abiotic stress responses. Compared with K0, genes for PODs (PER3, PER4, and PER64) were upregulated in K treatments under both LT and RT conditions, whereas genes for POD (PER63), Pro-rich receptor-like protein kinase (PERK1), and hydroxyproline O-galactosyltransferase (GALT6) were downregulated (Table S6).
Photosynthesis: This key function helps plants resist abiotic stress. Relative to K0, genes related to the photosynthesis pathway, such as chlorophyll a-b binding protein 2 (CAB2) and ATP synthase delta chain (ATPD), were upregulated in K treatments under both LT and RT conditions (Table S6).
ICE-CBF-COR: Pathway: This is the primary pathway responding to LTs in plants. Compared with K0, genes for dehydration-responsive element-binding proteins (DREB/CBF) (DREB1E and DREB1F) were downregulated in KH treatment under both LT and RT conditions, with DREB1F significantly downregulated (|log2 (FC)| ≥ 1.5) (Table S6).
3.2.8. TFs
TFs are crucial molecular switches that regulate plant growth and development and are essential for stress adaptation. In the K0 vs. KL, K0 vs. KM, and K0 vs. KH comparison groups under both LT and RT conditions, commonly expressed TFs included WRKY, MYB, ERF/AP2, BHLH, HSF, GATA, BZIP, and NTY. Relative to K0, 77.42% (24 of 31) of WRKY-TFs were downregulated in the KH treatment under both LT and RT conditions, with significant downregulation in WRKY41, WRKY55, WRKY28, WRKY57, WRKY11, WRKY22, WRKY53, WRKY24, and WRKY50 (|log2 (FC)| ≥ 1.5). MYB TFs showed 90.24% (37 of 41) upregulation, with MYB61, KUA1, and AS1 being notably upregulated. For the ERF/AP2 family, 51.43% (18 of 35) were upregulated, whereas 48.57% (17 of 35) were downregulated, including significant downregulations in ERF110, ERF109, ERF3, ERF026, ERF017, and ERF12, while RAP2-4 and ERN1 were significantly upregulated. BHLH TFs were evenly split with 50% (7 of 14) upregulated and 50% downregulated; significant upregulations were noted in BHLH70 and BHLH78, whereas BHLH148, BHLH162, and BHLH153 were significantly downregulated. Two HSF genes were upregulated, with seven being downregulated. GATA genes showed two upregulations, while four (including GATA9, GATA8, and two versions of GATA5) were significantly downregulated. Three BZIP genes and three NTY genes were downregulated and upregulated, respectively. These findings indicate that LT stress significantly affects the regulation of TFs in coconuts. K application helps maintain the balance of these TFs and mitigate the damage caused by LT stress (Figure 5).
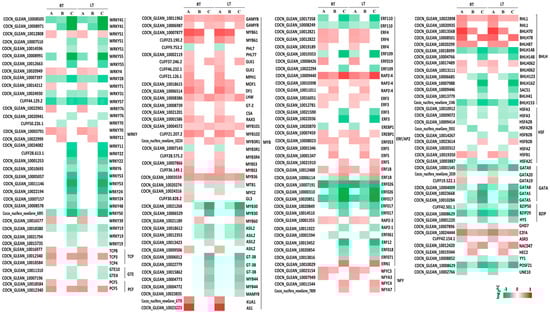
Figure 5.
Heat map of DEGs of major transcription factors in coconut seedling leaves under different K levels under LT and RT conditions. Note: DEGs, differentially expressed genes, A, K0 vs. KL; B, K0 vs. KM; C, K0 vs. KH; LT, RT, are detailed in Table 1.
3.2.9. qRT-PCR Verification
To confirm the reliability of the RNA-seq data and the accuracy of the analysis results in this study, we randomly selected 13 DEGs for qRT-PCR analysis. These DEGs were associated with several metabolic and signaling pathways: starch and sucrose metabolism (FRK1), amino sugar and nucleotide sugar metabolism (RFS1), cysteine and methionine metabolism (SAT1), alpha-linolenic acid metabolism (LOX5 and LOX4), phenylpropanoid biosynthesis (PHT1), flavonoid biosynthesis (CHS3 and LAR), TFs (WRKY41, RAP2-4, and ERF026), and K uptake (CCX4 and HAK8). The trend changes observed in the RNA-seq and qRT-PCR data across different K levels under LT conditions were similar. Correlation analysis yielded an R2 of 0.9961 with p < 0.01, affirming the reliability of the RNA-seq data and validating the transcriptomic alterations observed (Figure S4).
3.3. Metabolome Analysis
This study utilized both positive ion mode (Pos) and negative ion mode (Neg) to enhance metabolite coverage and detection performance. A total of 1648 metabolites were identified in coconut leaves under LT conditions—1139 in positive mode and 509 in negative mode. These metabolites were classified into 13 categories, including flavonoids, amino acids and derivatives, pyrimidine nucleosides, phenolic acids, organooxygen compounds, organic acids, alkaloids, lipids and lipid-like molecules, fatty acyls, organonitrogen compounds, carboxylic acids and derivatives, coumarins and derivatives, and benzene and substituted derivatives. Flavonoids were the most abundant category, followed by pyrimidine nucleosides and phenolic acids.
Under RT conditions, 1616 metabolites were detected—1139 in positive mode and 477 in negative mode—spanning 14 categories: amino acids and derivatives, organooxygen compounds, flavonoids, organic acids, benzene and substituted derivatives, organonitrogen compounds, phenolic acids, lipids and lipid-like molecules, pyrimidine nucleosides, fatty acyls, carboxylic acids and derivatives, organoheterocyclic compounds, coumarins and derivatives, and alkaloids. Amino acids and derivatives were the most plentiful, with organooxygen compounds and flavonoids following (Figures S5 and S7).
VIP values were determined for each metabolite in the comparison groups using OPLS-DA. Metabolites with a p-value < 0.05, VIP > 1, and |FC| ≥ 1.5 were defined as DAMs. Hierarchical clustering analysis of DAMs indicated that samples from the same variety clustered together while those from different treatments separated, demonstrating significant metabolic changes in coconut seedling leaves under various temperatures and K levels (Figure S7). In PCA, PC1 and PC2 accounted for 53.38% to 72.56% and 11.33% to 28.02% of the variations, respectively (Figure S8g). Correlation analysis confirmed that the correlation between the three replicates was greater than 0.679, affirming the reliability of the data (Figure S9).
55 DAMs (34 upregulated, 21 downregulated) were identified in the K0 vs. KL comparison under LT conditions. In the K0 vs. KM comparison, there were 23 DAMs (12 upregulated, 11 downregulated), and in the K0 vs. KH comparison, there were 129 DAMs (95 upregulated, 34 downregulated). Under RT conditions, the K0 vs. KL comparison yielded 147 DAMs (71 upregulated, 76 downregulated), the K0 vs. KM comparison resulted in 222 DAMs (83 upregulated, 139 downregulated), and the K0 vs. KH comparison showed 60 DAMs (10 upregulated, 50 downregulated) (Table 2 and Table S7). Although the total number of DAMs in LT conditions was lower than in RT conditions, the number of DAMs in the K0 vs. KH group under LT conditions was higher than under RT conditions, and the number of upregulated DAMs in K0 vs. KH under LT was also greater than those in RT. This indicates that the metabolic responses to different K treatments under LT and RT conditions vary, aligning with the transcriptome analysis results.
Table 2.
Quantity and classification details of metabolites accumulated through inter-comparison groups.
In LT conditions, DAMs in the K0 vs. KL, K0 vs. KM, and K0 vs. KH comparisons were predominantly flavonoids, and amino acids and derivatives. Notably, the K0 vs. KH group had a richer diversity of DAMs related to pyrimidine nucleosides, phenolic acids, organooxygen compounds, organic acids, alkaloids, lipids, and lipid-like molecules. Under RT conditions, the DAMs in the K0 vs. KL, K0 vs. KM, and K0 vs. KH groups were primarily amino acids and derivatives, organic acids, and flavonoids. The number of DAMs in the K0 vs. KH comparison was notably lower than in the K0 vs. KL and K0 vs. KM comparisons. In the K0 vs. KL and K0 vs. KM groups, a relatively high proportion of organooxygen compounds, benzene and substituted derivatives, and phenolic acids were found among the DAMs. Conversely, in the K0 vs. KH group, a higher proportion of DAMs related to carboxylic acids and derivatives, and fatty acyls were observed (Table 2).
The top 10 upregulated DAMs under LT conditions included coumarin, paclitaxel, glutathione, and myristoyl-coenzyme A. Under RT conditions, the DAMs that were mainly upregulated in K treatments were neohesperidin, 2,5-dihydroxybenzaldehyde, phenol, 12-oxo-10E-dodecenoic acid, loganic acid, and chorismic acid. The top 10 downregulated DAMs included 5-Aminopentanamide, 13S-HpOTrE (gamma), 9(S)-HpOTrE, and pyridoxal phosphate (Figure S8a–f). These DAMs showed a high correlation with DEGs in some important enrichment pathways, which will be analyzed in detail below.
In both LT and RT conditions, the number and detailed information of DAMs in the K0 vs. KL, K0 vs. KM, and K0 vs. KH comparison groups were presented in Table 2 and Table S6. KEGG pathway enrichment analysis on DAMs between different comparison groups was conducted to elucidate their biological functions, with significantly enriched pathways selected based on p-values ≤ 0.05 (Table S8). These included starch and sucrose metabolism, amino sugar and nucleotide sugar metabolism, pyrimidine metabolism, galactose metabolism, ascorbate and aldarate metabolism, flavonoid biosynthesis, phenylpropanoid biosynthesis, lysine degradation, tyrosine metabolism, cysteine and methionine metabolism, biosynthesis of amino acids, alpha-Linolenic acid metabolism, glycerophospholipid metabolism, and ABC transporters, consistent with transcriptome results. This study’s focus will thus be a detailed analysis of these pathways (Figure S10).
3.3.1. DAMs in Carbohydrate Metabolism
Starch and sucrose metabolism, amino sugar and nucleotide sugar metabolism, pyrimidine metabolism, galactose metabolism, and ascorbate and aldarate metabolism are all part of the carbohydrate metabolism pathway. These pathways were enriched in the K0 vs. KL, K0 vs. KM, and K0 vs. KH comparison groups under both LT and RT conditions. Among the DAMs in these pathways, a total of 8 DAMs were identified, including 1 UDP-glucose, 1 N-glycolylneuraminic acid, 1 deoxycytidine, 1 stachyose, 1 N-acetyl-D-galactosamine, 1 raffinose, 1 D-galactarate, and 1 dehydroascorbic acid. The clustering heatmap revealed that compared to the K0 treatment, the abundance of UDP-glucose in the starch and sucrose metabolism pathway increased under the KL and KM treatments in LT conditions. Additionally, in the amino sugar and nucleotide sugar metabolism pathway, N-glycolylneuraminic acid was upregulated in the KM treatment under RT conditions. Deoxycytidine was upregulated in the KH treatment under RT conditions within the pyrimidine metabolism pathway. In the galactose metabolism pathway, stachyose abundance increased in the KH treatment under LT conditions, and raffinose increased in the KM treatment under RT conditions, but N-acetyl-D-galactosamine decreased. As for the ascorbate and aldarate metabolism pathway, D-galactarate was downregulated in the KH treatment under LT conditions, while dehydroascorbic acid was upregulated in the KL treatment under RT conditions (Figure 6). Overall, LT stress negatively regulates the contents of key metabolites such as UDP-glucose and stachyose in carbohydrate metabolism pathways, whereas K application has a positive regulatory effect. Conversely, the content of D-galactarate is positively regulated under stress, while K application negatively regulates this process.
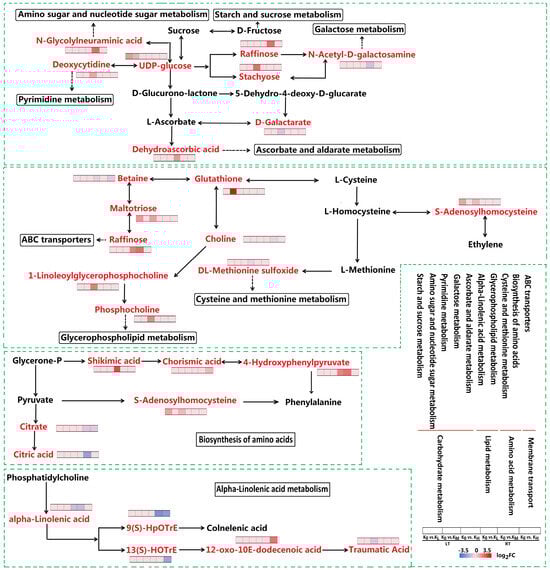
Figure 6.
Expression of DAMs in key pathways occurs in K0 vs. KL, K0 vs. KM, and K0 vs. KH in LT and RT. Note: DAMs, differentially accumulated metabolites; DAMs are displayed in red, highlighted font. The redder the color of the heat map, the more significant the upregulation of DAMs; the bluer the color, the more significant the downregulation of DAMs. LT, RT, K0, KL, KM, and KH are detailed in Table 1.
3.3.2. DAMs in Biosynthesis of Other Secondary Metabolites
The flavonoid biosynthesis and phenylpropanoid biosynthesis pathways, which belong to the biosynthesis of other secondary metabolites, were enriched in the K0 vs. KL, K0 vs. KM, and K0 vs. KH comparison groups under both LT and RT conditions. These pathways identified a total of nine DAMs, including one cyanidin, one neohesperidin, one chlorogenic acid, one chlorogenate, one coumarin, one 3,5-dimethoxy-4-hydroxycinnamic acid, one trans-cinnamate, one caffeic acid, and one 4-hydroxy-3-methoxycinnamaldehyde. Compared to the K0 treatment, in the flavonoid and phenylpropanoid biosynthesis pathways, the KL and KM treatments under RT conditions increased the abundance of chlorogenic acid and chlorogenate, respectively. In the flavonoid biosynthesis pathway, KH treatment under LT conditions increased the abundance of cyanidin, while KL treatment under RT conditions increased the abundance of neohesperidin. In the phenylpropanoid biosynthesis pathway, KH treatment under LT conditions increased the abundance of coumarin and 3,5-dimethoxy-4-hydroxycinnamic acid, while KL and KM treatments under RT conditions increased the abundance of caffeic acid and 4-hydroxy-3-methoxycinnamaldehyde, respectively. However, KL treatment under LT conditions reduced the abundance of trans-cinnamate (Figure 7). These results indicate that LT stress induces downregulation of metabolic levels such as cyanidin, coumarin, and 3,5-dimethoxy-4-hydroxycinnamic acid, leading to an increase in trans-cinnamate. This disruption may affect the normal biosynthesis of flavonoids and phenylpropanoids, whereas K application helps maintain the homeostasis of these processes.
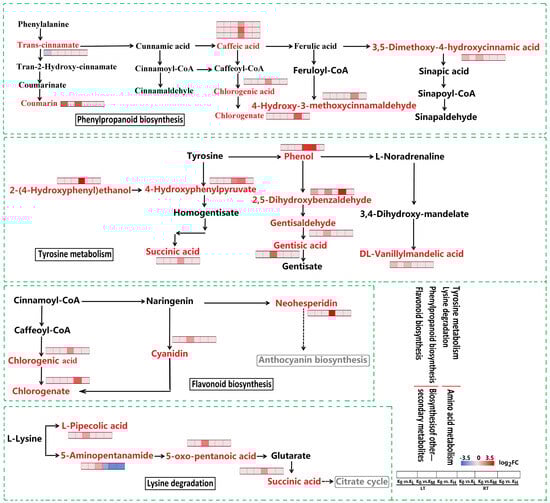
Figure 7.
Expression of DAMs in key pathways occurs in K0 vs. KL, K0 vs. KM, and K0 vs. KH in LT and RT. Note: DAMs, differentially accumulated metabolites; DAMs are displayed in red, highlighted font. The redder the color of the heat map, the more significant the upregulation of DAMs; The bluer the color, the more significant the downregulation of DAMs. LT, RT, K0, KL, KM, and KH are detailed in Table 1.
3.3.3. DAMs in Amino Acid Metabolism
The amino acid metabolism pathway, encompassing lysine degradation, tyrosine metabolism, cysteine, and methionine metabolism, and the biosynthesis of amino acids, was enriched in the K0 vs. KL, K0 vs. KM, and K0 vs. KH comparison groups under both LT and RT conditions. Eighteen DAMs were identified within these pathways, including L-pipecolic acid, 5-aminopentanamide, 5-oxo-pentanoic acid, succinic acid, 2,5-dihydroxybenzaldehyde, DL-vanillylmandelic acid, gentisaldehyde, gentisic acid, phenol, 4-hydroxyphenylpyruvate, 2-(4-hydroxyphenyl)ethanol, S-adenosylhomocysteine, glutathione, DL-methionine sulfoxide, shikimic acid, citric acid, citrate, and chorismic acid. In the lysine degradation pathway, L-pipecolic acid, 5-aminopentanamide, and 5-oxo-pentanoic acid were upregulated in the KH treatment under LT conditions, while succinic acid was upregulated in the KL treatment under RT conditions (Figure 7). In the tyrosine metabolism pathway, 2,5-dihydroxybenzaldehyde, DL-vanillylmandelic acid, gentisaldehyde, and gentisic acid were upregulated in the KH treatment under LT conditions, while succinic acid, phenol, 4-hydroxyphenylpyruvate, and 2-(4-hydroxyphenyl)ethanol were upregulated in the KL and KM treatments under RT conditions (Figure 7). In the cysteine and methionine metabolism pathway, S-adenosylhomocysteine was upregulated in the KL and KH treatments under LT conditions, while glutathione was upregulated in the KH treatment under LT conditions. DL-Methionine sulfoxide was downregulated in the KL treatment under RT conditions (Figure 6). In the biosynthesis of the amino acids pathway, S-adenosylhomocysteine was upregulated in the KH treatment under LT conditions, 4-hydroxyphenylpyruvate and shikimic acid were upregulated in the KL and KM treatments under RT conditions, and chorismic acid was upregulated in the KH treatment under RT conditions. However, citric acid and citrate were downregulated in the KM and KH treatments under RT conditions (Figure 6). The results demonstrate that LT stress negatively regulates the metabolism of lysine degradation, tyrosine metabolism, cysteine and methionine metabolism, and biosynthesis of amino acids. Conversely, the K application effectively maintains the stability and balance of these metabolic processes.
3.3.4. DAMs in Lipid Metabolism
The lipid metabolism pathway, specifically alpha-linolenic acid metabolism and glycerophospholipid metabolism, was enriched in the comparison groups of K0 vs. KL, K0 vs. KM, and K0 vs. KH under both LT and RT conditions. Seven DAMs were identified within these pathways, including traumatic acid, alpha-linolenic acid, 9(S)-HpOTrE, 13(S)-HOTrE, 12-oxo-10E-dodecenoic acid, phosphocholine, 1-Linoleoylglycerophosphocholine, and choline.
Compared to the K0 treatment, the KH treatment under both LT and RT conditions increased the abundance of 12-oxo-10E-dodecenoic acid but decreased the abundance of traumatic acid, alpha-Linolenic acid, 9(S)-HpOTrE, and 13(S)-HOTrE. In the glycerophospholipid metabolism pathway, phosphocholine and 1-Linoleoylglycerophosphocholine were upregulated in the KH treatment under LT conditions, while choline was downregulated in the KM treatment under RT conditions (Figure 6). This suggests that LT stress positively regulates the metabolism of traumatic acid, alpha-linolenic acid, 9(S)-HpOTrE, and 13(S)-HOTrE, while negatively regulating the metabolism of 12-oxo-10E-dodecenoic acid, phosphocholine, and 1-linoleoylglycerophosphocholine. K application effectively maintains the stability and balance of these metabolic processes.
3.3.5. DAMs in ABC Transporters
The ABC transporters pathway was enriched across the comparison groups of K0 vs. KL, K0 vs. KM, and K0 vs. KH under both LT and RT conditions. A total of five DAMs were identified within this pathway, including choline, maltotriose, betaine, raffinose, and glutathione. Compared with the K0 treatment, maltotriose was upregulated in the KL and KH treatments under LT conditions, and glutathione was upregulated in the KM treatment under LT conditions. Raffinose was upregulated in the KL and KM treatments under RT conditions. Conversely, betaine and choline were downregulated in the KL and KM treatments, respectively (Figure 6). These results suggest that LT stress inhibits ABC transporter metabolism, and K application activates the accumulation of glutathione metabolites within these metabolic pathways.
3.4. Integrative Analysis of the Transcriptome and Metabolome
In this study, KEGG pathway maps were used to establish and visualize genes-metabolites interactions, providing a comprehensive analysis of transcriptomic and metabolomic data after treating coconut seedlings with different K levels (K0, KL, KM, and KH) under both LT and RT conditions. All DEGs and DAMs were mapped to the KEGG pathway database to identify common pathways. Detailed information on DEGs and DAMs from all comparison groups is available in Table S9.
Key pathways enriched in multiple comparison groups include carbohydrate metabolism (starch and sucrose metabolism, amino sugar and nucleotide sugar metabolism, pyrimidine metabolism, galactose metabolism, ascorbate and aldarate metabolism), biosynthesis of other secondary metabolites (flavonoid biosynthesis and phenylpropanoid biosynthesis), amino acid metabolism (lysine degradation, tyrosine metabolism, cysteine and methionine metabolism, and biosynthesis of amino acids), lipid metabolism (alpha-Linolenic acid metabolism and glycerophospholipid metabolism), and ABC transporters. These pathways were identified as significant and have been prioritized for further analysis due to the differential expression of DEGs and DAMs observed in K0, KL, KM, and KH under both LT and RT conditions (Table S10, Figure S11). This integrative approach highlights the interconnected nature of gene and metabolite networks in responding to K treatment under LT stresses.
3.4.1. DEGs and DAMs in Carbohydrate Metabolism
Significant enrichment was observed in the carbohydrate metabolism pathway, particularly in sucrose synthase 1 (SS1), FRK1, EP3, FRK2, DNA-directed RNA polymerase (rpoC1), RFS1, HXK2, GDP-L-galactose phosphorylase 1 (VTC2), UGD4, aldehyde dehydrogenase family 2 member B7 (ALDH2B7), and monodehydroascorbate reductase 2 (MDAR2). These genes were involved in starch and sucrose metabolism, amino sugar and nucleotide sugar metabolism, pyrimidine metabolism, galactose metabolism, and ascorbate and aldarate metabolism pathways (Figure 8a). In these five metabolic pathways, the expression of genes and metabolites displayed similar trends. Compared to the K0 treatment, SS1 and FRK1, along with UDP-glucose, were upregulated in the starch and sucrose metabolism pathway under LT conditions for KL and KM. In the amino sugar and nucleotide sugar metabolism pathway, EP3 showed upregulation under LT and RT conditions for KM, FRK1 was upregulated under LT and RT conditions for KM and KH, and UDP-glucose was upregulated under LT conditions for KL and KM, while N-glycolylneuraminic acid was upregulated under RT conditions for KM. In the pyrimidine metabolism pathway, rpoC1 saw upregulation in KL and KH under both LT and RT conditions, with deoxycytidine specifically upregulated in KH under RT conditions. Within the galactose metabolism pathway, RFS1 and HXK2 were downregulated in KH under both LT and RT conditions, and N-acetyl-D-galactosamine was downregulated under RT conditions for KM, but raffinose saw an increase. Additionally, stachyose was upregulated in KH under LT conditions. In the ascorbate and aldarate metabolism pathway, VTC2 and MDAR2 experienced upregulation in KL under both LT and RT conditions, whereas UGD4 and ALDH2B7 were downregulated in KH under both LT and RT conditions. D-galactarate was downregulated in KH under LT conditions, and dehydroascorbic acid was upregulated in KL under RT conditions. In summary, LT stress disrupted the metabolic processes associated with starch and sucrose metabolism, amino sugar and nucleotide sugar metabolism, pyrimidine metabolism, galactose metabolism, and ascorbate and aldarate metabolism in coconut seedlings, while K application helped maintain the stability of these five metabolic processes and mitigated cold damage in coconuts.
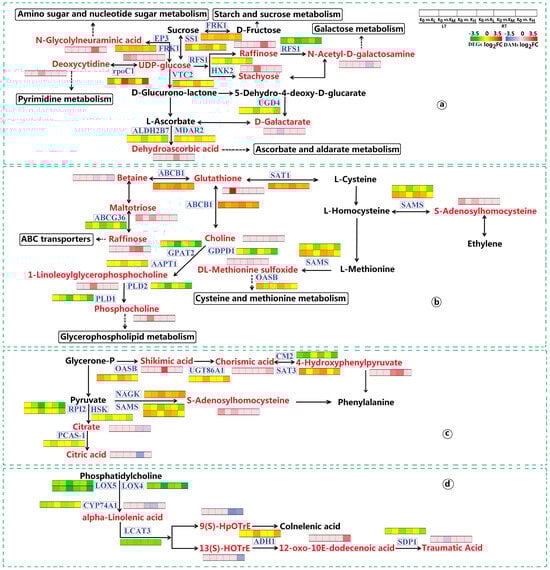
Figure 8.
Expression of DEGs and DAMs in key pathways found in K0 vs. KL, K0 vs. KM, and K0 vs. KH in LT and RT. Note: DEGs, differentially expressed genes; DAMs, differentially accumulated metabolites; (a) Starch and sucrose metabolism, amino sugar and nucleate sugar metabolism, pyrimidine metabolism, galactose metabolism, and ascorbate and alarate metabolism; (b) Cysteine and methionine metabolism, glycerophoric metabolism, and ABC transporters; (c) Biosynthesis of amino acids; (d). Alpha-linolenic acid metabolism. DEGs are displayed in blue boxes, while DAMs are displayed in red, highlighted font. The redder the color of the heat map, the more significant the upregulation of DEGs and DAMs; The greener and bluer the color, the more significant the downregulation of DEGs and DAMs. LT, RT, K0, KL, KM, and KH are detailed in Table 1.
3.4.2. DEGs and DAMs in Biosynthesis of Other Secondary Metabolites
In the biosynthesis of other secondary metabolites pathway, several enzymes were significantly enriched, including PHT1, DFR, flavonoid 3′,5′-hydroxylase 1 (CYP75A1), CHS3, benzyl alcohol O-benzoyltransferase (BAOBT), LAR, probable chalcone-flavonone isomerase 3 (CHI3), ANR, flavonoid 3′,5′-hydroxylase 2 (CYP75A3), cinnamoyl-CoA reductase 1 (CCR1), probable cinnamyl alcohol dehydrogenase 6 (CAD6), POD 3 (PER3), 4-coumarate-CoA ligase 1 (4CL1), cinnamoyl-CoA reductase-like SNL6 (SNL6), cytochrome P450 84A1 (CYP84A1), and trans-cinnamate 4-monooxygenase (CYP73A4). These enzymes participate in flavonoid and phenylpropanoid biosynthesis pathways. In the flavonoid biosynthesis pathway, under both LT and RT conditions, CHS3, BAOBT, LAR, and ANR were upregulated across KL, KM, and KH treatments. DFR, CYP75A1, CHI3, and CYP75A3 saw upregulation in KL and KM treatments. Conversely, PHT1 was downregulated across all K treatment levels under both temperature conditions. Neohesperidin, chlorogenic acid, and chlorogenate showed increased levels in KL and KM under RT conditions, while cyanidin levels rose in KH under LT conditions (Figure 9b). In the phenylpropanoid biosynthesis pathway, CCR1, PHT1, PER63, and 4CL1 were downregulated across all K treatments under both LT and RT conditions. However, CAD6, PER3, BAOBT, SNL6, CYP84A1, and CYP73A4 were upregulated under these conditions. Metabolites such as coumarin and 3,5-dimethoxy-4-hydroxycinnamic acid were elevated in KH under LT conditions, while chlorogenic acid, chlorogenate, caffeic acid, and 4-hydroxy-3-methoxycinnamaldehyde increased in KL and KM under RT conditions. In contrast, trans-cinnamate was reduced in KL under LT conditions (Figure 9a). These results illustrate how LT stress induces alterations in crucial genes and metabolites within the flavonoid and phenylpropanoid biosynthesis pathways, potentially disrupting their normal biosynthesis. K application appeared to help in maintaining the homeostasis of these biosynthetic processes, suggesting its beneficial role in mitigating the impacts of LT stress.
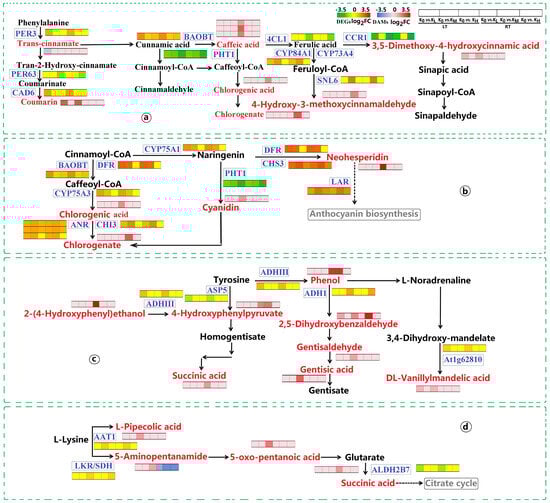
Figure 9.
Expression of DEGs and DAMs in key pathways observed in K0 vs. KL, K0 vs. KM, and K0 vs. KH in LT and RT. Note: DEGs, differentially expressed genes; DAMs, differentially accumulated metabolites; (a) Phenolpropanoid biosynthesis; (b) Flavonoid biosynthesis; (c) Tyrosine metabolism; (d) Lysine degradation. DEGs are shown in blue boxes, while DAMs are highlighted in red font. The redder the color of the heatmap, the more significant the upregulation of DEGs and DAMs; the greener and bluer the color, the more significant the downregulation of DEGs and DAMs. LT, RT, K0, KL, KM, and KH are detailed in Table 1.
3.4.3. DEGs and DAMs in Amino Acid Metabolism
In the amino acid metabolism pathway—encompassing lysine degradation, tyrosine metabolism, cysteine and methionine metabolism, and biosynthesis of amino acids—key enzymes were significantly enriched. These included alpha-aminoadipic semialdehyde synthase (LKR/SDH), ALDH2B7, cytosolic acetyl-CoA acetyltransferase 1 (AAT1), alcohol dehydrogenase class-3 (ADHIII), primary amine oxidase (At1g62810), ADH1, ASP5, acetylglutamate kinase (NAGK), S-adenosylmethionine synthase (SAMS) in two variants (CUFF46.329.1 and COCN_GLEAN_10015512), chorismate mutase 2 (CM2), serine acetyltransferase 3 (SAT3), UDP-glycosyltransferase 86A1 (UGT86A1), cysteine synthase (OASB), bifunctional L-3-cyanoalanine synthase/cysteine synthase 1 (PCAS-1), homoserine kinase (HSK), and probable ribose-5-phosphate isomerase 2 (RPI2). In the lysine degradation pathway, AAT1 and LKR/SDH were upregulated in KM and KH under both LT and RT conditions. ALDH2B7 was downregulated in KL under both temperature conditions. L-pipecolic acid, 5-aminopentanamide, and 5-oxo-pentanoic acid were upregulated in KH under LT conditions, while succinic acid increased in KL under RT conditions (Figure 9d). In the tyrosine metabolism pathway, ADHIII, At1g62810, and ADH1 were upregulated in KL and KH under both temperature conditions. ASP5 was downregulated in KL under LT and RT conditions. Metabolites such as 2,5-dihydroxybenzaldehyde, DL-vanillylmandelic acid, gentisaldehyde, and gentisic acid were upregulated in KH under LT conditions. Additionally, succinic acid, phenol, 4-hydroxyphenylpyruvate, and 2-(4-hydroxyphenyl)ethanol were upregulated in KL and KM under RT conditions (Figure 9c). In the cysteine and methionine metabolism pathway, SAT1 was upregulated across KL, KM, and KH under both LT and RT conditions. SAMS and OASB were upregulated in KL and KM under both temperature conditions. However, SAMS (CUFF46.329.1) was downregulated in KL and KH under both LT and RT conditions. S-adenosylhomocysteine increased in KL and KH under LT conditions, and glutathione increased in KM under LT conditions. In contrast, DL-methionine sulfoxide decreased in KL under RT conditions (Figure 8b). In the biosynthesis of amino acids pathway, enzymes, such as NAGK, SAMS (COCN_GLEAN_10015512), SAT3, UGT86A1, and OASB, were upregulated in KL, KM, and KH under both LT and RT conditions. However, SAMS (CUFF46.329.1), CM2, PCAS-1, HSK, and RPI2 were downregulated in these conditions. S-adenosylhomocysteine was upregulated in KH under LT conditions, and 4-hydroxyphenylpyruvate and shikimic acid were upregulated in KL and KM under RT conditions, while chorismic acid increased in KH under RT conditions. Conversely, citric acid and citrate were downregulated in KM and KH under RT conditions (Figure 8c). These findings demonstrate that LT stress adversely affects the metabolism of lysine degradation, tyrosine metabolism, cysteine and methionine metabolism, and the biosynthesis of amino acids. K application has been shown to mitigate these negative effects effectively.
3.4.4. DEGs and DAMs in Lipid Metabolism
In the lipid metabolism pathways, particularly alpha-linolenic acid metabolism, key enzymes, such as putative lipoxygenase (LOX5, LOX4), SDP1, CYP74A1, ADH1, and phospholipase A(1) LCAT3 (LCAT3), were significantly enriched. Under both LT and RT conditions, compared with K0 treatment, enzymes LOX5, LOX4, SDP1, CYP74A1, and LCAT3 were downregulated in KL, KM, and KH. Conversely, ADH1 was the only enzyme upregulated in KH under both temperature conditions. Metabolically, 12-oxo-10E-dodecenoic acid saw an upregulation in KH under both LT and RT conditions. However, traumatic acid, alpha-linolenic acid, 9(S)-HpOTrE, and 13(S)-HOTrE were downregulated (Figure 8d). In the glycerophospholipid metabolism pathway, enzymes GPAT2, PLD2, PLD1, and GDPD1 were downregulated in KM and KH under both LT and RT conditions. AAPT1 was upregulated in KH under LT and RT conditions. Phosphocholine and 1-linoleoylglycerophosphocholine saw an upregulation in KH under LT conditions, whereas choline was downregulated in KM under RT conditions (Figure 8b). These results demonstrate that LT stress impacts the expression of key genes and metabolites involved in alpha-linolenic acid and glycerophospholipid metabolism pathways and that K application helps maintain the stability and balance of these metabolic processes.
3.4.5. DEGs and DAMs in ABC Transporters
In the ABC transporters pathway, ABC transporter B family member 1 (ABCB1) and ABC transporter G family member 36 (ABCG36) were notably enriched (Figure 8b). Relative to the K0 treatment, ABCB1 was upregulated in KL, KM, and KH under both LT and RT conditions, whereas ABCG36 was downregulated in KL and KH under LT and RT conditions. Maltotriose was upregulated in KL and KH under LT conditions, and glutathione was upregulated in KM under LT conditions. Raffinose was elevated in KL and KM under RT conditions. However, betaine and choline saw a downregulation in KL and KM, respectively. These results indicate that LT stress inhibits the metabolism of ABC transporters, while K application effectively mitigates its adverse impacts.
3.5. Network Regulation Diagram Based on the PCC Model
This study measured the relationship between genes and metabolites in all key pathways—Carbohydrate metabolism, biosynthesis of other secondary metabolites, amino acid metabolism, lipid metabolism, and ABC transporters—by calculating the PCCs. Using an absolute value with a correlation Pearson coefficient ≥ 0.8 as the screening threshold, highly correlated DEGs and DAMs were obtained (Table S11), and a “genes-metabolites” regulatory network diagram in main pathways was plotted using Cytoscape (Figure 10 and Figure 11). In the starch and sucrose metabolism (Ko00500) pathway, SS1, At2g01630, Os06g0675700, TPP6, FRK1, and GAUT12 played a positive role in UDP-glucose regulation, while GAUT5 played a negative role (Figure 10a). The UDP-glucose in the amino sugar and nucleotide sugar metabolism (Ko00520) pathway was positively regulated by six key genes (ChiC, CHIB1, rsca, FRK1, GAUT12, and EP3) and negatively regulated by one gene (GAUT5), while N-glycolylneuraminic acid was positively regulated by four key genes (EP3, CTL1, FRK1, and At3g19330) and negatively regulated by three genes (CRK10, COCN_GLEAN10011958, and Cht10), indicating that EP3 and FRK1 genes simultaneously positively regulated UDP-glucose and N-Glycolylneuraminic acid metabolism (Figure 10b). In the glycerophospholipid metabolism pathway (Ko00564), the genes GPAT2, GPAT3, CCT2, PLD2, UGD4, PLD1, and SDP1 collectively played a negative role in the regulation of 1-linoleoylglycerophosphorine and phosphatidylcholine, while At1g78690 and AAPT1 played a positive role in the metabolism of these two metabolites. Additionally, GPAT2 and GDPD1 positively regulated choline, while the OBL1 gene negatively regulated choline (Figure 10c). In the galactose metabolism (Ko00052) pathway, the HXK2 gene negatively regulated stachyose, while the RFS1 gene negatively regulated UDP-glucose, stachyose, and raffinose, but positively regulated N-acetyl-D-galactosamine. GOLS1 negatively regulated raffinose. However, the gene encoding Os03g0165400 positively regulated raffinose. Os06g0675700 positively regulated UDP-glucose (Figure 10d). In the ABC transporters pathway (Ko02010), the ABCG36 gene positively regulated betaine and negatively regulated raffinose. The ABCG11 gene positively regulated raffinose and negatively regulated betaine. The ABCB1 (CUFF11.175.1) gene positively regulated glutathione and negatively regulated betaine, while the ABCB1 gene (COCN_GLEAN_10002107) positively regulated raffinose and negatively regulated choline. The ABCG39 and ABCB21 genes positively regulated betaine, whereas the ABCG26 gene positively regulated raffinose (Figure 10e). In the cysteine and methionine metabolism pathway (Ko00270), DL-methionine sulfoxide was negatively regulated by seven key genes: PGDH1, SAT1, SAMS (COCN_GLEAN_10015512), LLDHA, OASB, another instance of PGDH1, and MGL. It was positively regulated by two genes: BAATG/AAT and SAMS (CUFF46.329.1). Meanwhile, glutathione was positively regulated by one key gene (SAMS (CUFF46.329.1)), and S-adenosylhomocysteine was negatively regulated by one key gene (SAT1) (Figure 10f). In the alpha-linolenic acid metabolism pathway (Ko00592), the LOX5 gene positively regulated traumatic acid, alpha-linolenic acid, 9(S)-HpOTrE, and 13(S)-HOTrE. CYP74A1 and LOX4 genes positively regulated traumatic acid and alpha-linolenic acid. The SDP1 gene positively regulated traumatic acid and negatively regulated 12-oxo-10E-dodecenoic acid. APH1 positively regulated 12-oxo-10E-dodecenoic acid while negatively regulating 9(S)-HpOTrE and 13(S)-HOTrE. LCAT3 positively regulated alpha-linolenic acid, 9(S)-HpOTrE, and 13(S)-HOTrE, and negatively regulated 12-oxo-10E-dodecenoic acid. The OBL1 gene negatively regulated alpha-linolenic acid (Figure 11a). In the tyrosine metabolism pathway (Ko00350), the ADH1 gene positively regulated DL-vanillylmandelic acid, gentisaldehyde, 2,5-dihydroxybenzaldehyde, and gentisic acid. The CUFF7.298.1 gene positively regulated 2-(4-hydroxyphenyl)ethanol, 4-hydroxyphenylpyruvate, succinic acid, and phenol. The gene (C. nucifera newGene_6027) positively regulated 2-(4-hydroxyphenyl)ethanol, 4-hydroxyphenylpyruvate, and succinic acid. CUFF37.729.2 also positively regulated 2-(4-hydroxyphenyl)ethanol, 4-hydroxyphenylpyruvate, and succinic acid. The ASP5 gene negatively regulated DL-vanillylmandelic acid, 4-hydroxyphenylpyruvate, succinic acid, and phenol. The ADHIII gene positively regulated DL-vanillylmandelic acid, 4-hydroxyphenylpyruvate, succinic acid, and phenol, while the At1g62810 gene positively regulated DL-vanillylmandelic acid, and the COCN_GLEAN_10018517 gene negatively regulated phenol (Figure 11b).
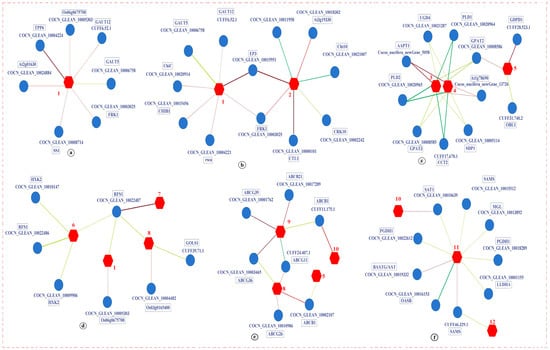
Figure 10.
A network regulation diagram of DAMs and DEGs in key metabolic pathways based on the Pearson correlation coefficient model. Note: DEGs, differentially expressed genes; DAMs, differentially accumulated metabolites; (a) Starch and sucrose metabolism (Ko00500); (b) Amino sugar and nucleate sugar metabolism (Ko00520); (c) Glycerophospholipid metabolism (Ko00564); (d) Galactose metabolism (Ko00052); (e) ABC transporters (Ko02010); (f) Cysteine and methionine metabolism (Ko00270); 1, UDP-glucose (meta_46); 2, N-Glycolylneuraminic acid (meta_997); 3, 1-Linoleoylcerophosphocholine (meta_172); 4, Phosphocholine (meta_53); 5, Choline (meta_19); 6, Stachyose (meta_343); 7, N-Acetyl-D-galactosamine (meta_241); 8, Raffinose (meta_402); 9, Betaine (meta_116); 10, Glutathione (meta_208); 11, DL-Methionine sulfoxide (meta_1083); 12, S-Adenosylhomocysteine (meta_842). Filtered and plotted based on absolute values with correlation coefficients > 0.8. The straight line between DEGs and DAMs represents correlation, with thicker and darker lines indicating greater positive correlation and thinner and lighter lines indicating greater negative correlation.
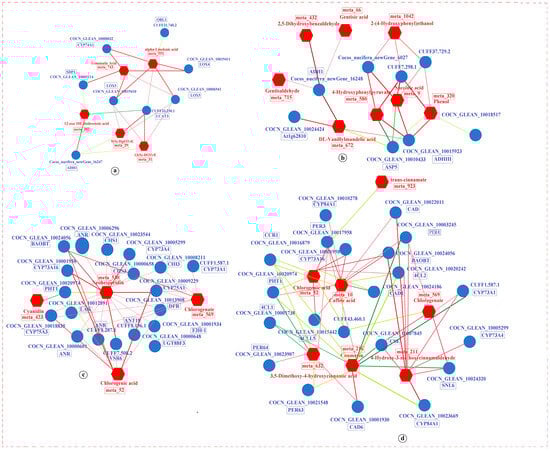
Figure 11.
A network regulation diagram of DEGs and DAMs in key metabolic pathways based on the Pearson correlation coefficient model. Note: DEGs, differentially expressed genes; DAMs, differentially accumulated metabolites; (a) alpha-Linolenic acid metabolism (Ko 00592); (b) Tyrosine metabolism (Ko00350); (c) Flavonoid biosynthesis (Ko00941); (d) Phenolpropanoid biosynthesis (Ko00940); 1, Traumatic acid (meta_743); 2, alpha-Linolenic acid(meta_551); 3, 12-oxo-10E-dodecenoic acid (meta_392); 4, 9(S)-HpOTrE (meta_29); 5, 13(S)-HOTrE (meta_31); 6, Gentisaldehyde (meta_715); 7, 2,5-Dihydroxybenzaldehyde (meta_432); 8, Gentisic acid (meta_66); 9, DL-Vanillylmandelic acid (meta_672); 10, 2-(4-Hydroxyphenyl) ethanal (meta_1042); 11, 4-Hydroxypheylpyruvate(meta_580); 12, Succinic acid (meta_9); 13, Phenol(meta_743); 14, Cyanidin (meta_423); 15, Neohesperidin (meta_530); 16, Chlorogenate (meta_569); 17,Chlorogenic acid (meta_52); 18, Trans-Cinnamate (meta_923); 19, Caffeic acid (meta_10); 20, 3,5-Dimethoxy-4-hydroxycinnamic acid(meta_632); 21, Coumarin (meta_216); 22, 4-Hydroxy-3-methoxycinnamaldehyde (meta_211). Filtered and plotted based on absolute values with correlation coefficients > 0.8. The straight line between DEGs and DAMs represents correlation, with red lines indicating a positive correlation, thicker and darker red lines indicating a greater positive correlation, green lines indicating a negative correlation, and thicker and darker green lines indicating a greater negative correlation.
The number of key genes in the flavonoid biosynthesis (Ko00941) and phenylpropanoid biosynthesis (Ko00940) pathways was relatively high, with most genes and metabolites showing a correlation. In the flavonoid biosynthesis pathway, the key genes (DFR, CYP75A1, CHS3, BAOBT, LAR, ANR, and CYP75A3) positively regulated neohesperidin. The CHI3 gene positively regulated chlorogenate. The PHT1 gene negatively regulated cyanidin (Figure 11c).
In the phenylpropanoid biosynthesis pathway, 4-hydroxy-3-methoxycinnamaldehyde was positively regulated by three key genes (SNL6, CYP84A1, and CYP73A4). Coumarin was negatively regulated by three key genes (PHT1, PER63, and 4CL1). 3,5-Dimethoxy-4-hydroxycinnamic acids were positively regulated by CAD6 and PER3 genes but negatively regulated by the CCR1 gene. Additionally, the BAOBT gene positively regulated caffeic acid (Figure 11d).
4. Discussion
Plants resist abiotic stress through various physiological and metabolic modifications [65]. In this study, we performed physiological, transcriptomic, and metabolomic analyses to uncover the regulatory network of varying K levels in coconut response to cold stress, and substantial changes in metabolite accumulation and gene expressions were observed through metabolomics and RNA-seq analysis.
4.1. K Can Accelerate the Clearance of ROS in Coconut Seedlings and Reduce LT Stress
Preserving intracellular ROS equilibrium is essential for normal plant functions. During abiotic stress, an overabundance of ROS can cause oxidative damage in plants, resulting in an excessive buildup of MDA and a noticeable decline in growth parameters [66]. Therefore, eliminating ROS is a crucial mechanism for plant cold tolerance. The primary enzymatic antioxidants are POD, SOD, CAT, and APX. Among these, SOD is regarded as the primary defense in the plant antioxidant system. APX plays a role in maintaining ROS balance by removing hydrogen peroxide. Studies have demonstrated that the inactivation of APX can result in an excessive buildup of ROS [67]. POD and CAT are vital antioxidant enzymes that convert hydrogen peroxide into water [65]. Pro is abundant in higher plants and usually accumulates significantly under environmental stress. It functions not only as an osmotic regulator but also aids in stabilizing subcellular structures, scavenging free radicals, and buffering cellular redox potential under stress conditions. The rapid breakdown of Pro after stress relief supplies a substantial amount of reducing agents, which support mitochondrial oxidative phosphorylation and ATP production, aiding in stress recovery and repairing stress-induced damage [65].
K+, as a regulatory signal, indirectly alleviates stress damage by influencing the removal process of ROS. K+ takes on a crucial function in mitigating salt stress by regulating cellular antioxidant metabolism and ion balance. The production of ROS during the transfer of electrons in photosynthesis diminished as K+ levels increased. K+ eases the harm from abiotic stress on plants by amplifying the effectiveness of vital antioxidant enzymes such as POD, SOD, APX, and CAT while also increasing nutrient levels [68]. K+ may improve tolerance to stress by prompting TFs to activate genes involved in stress response and oxidative defense mechanisms [69]. Hence, the activation of antioxidant defense mechanisms played a crucial role in mitigating plant alterations caused by abiotic stress. Similarly, in this study, compared with the K0 treatment, the levels of K, SPr, and Pro in coconut seedling leaves treated with K under LT and RT conditions significantly increased, showing a significant increase with increasing K levels. Compared to RT conditions, the K, SPr, and Pro content in coconut seedling leaves treated with the same K level under LT conditions significantly increased. The activity of antioxidant enzymes SOD, POD, CAT, and APX showed similar trends to the content changes in SPr and Pro. However, as the K level increased, the content of MDA significantly decreased. This also indicates that K enhances the photosynthesis of coconut seedlings by increasing the activity of key antioxidant enzymes such as SOD, POD, CAT, APX, etc., and correspondingly inducing the genes of plant hormone signal transduction (Figure 4). Concurrently, K+ activated photosynthesis-related genes, including chlorophyll a-b binding protein 2 (CAB2) and ATP synthesis delta chain (ATPD), and upregulating their expression (Table S7), increasing SPAD and total chlorophyll content. Ultimately, this promoted the increase and accumulation of nutrients and osmotic regulators such as K, SPr, and Pro, therefore inhibiting ROS formation, reducing MDA accumulation, and mitigating the LT stress damage in coconut seedlings (Figure 2; Table 1).
SS and SPr are considered key osmoregulatory substances in plants, and their accumulation in cytoplasmic aerosols can prevent protoplast dehydration and improve plant cold resistance [70]. In this study, the levels of SS from coconut seedling leaves dropped when exposed to K under both LT and RT conditions. Moreover, the SS levels significantly declined as K concentration increased. Under LT conditions, however, the SS content in the leaves was markedly higher than under RT conditions when treated with the same K levels. The reduction in SS content is likely due to the accelerated metabolic rate in coconut seedlings as K levels rise, resulting in greater sugar breakdown. Also, coconut seedlings exhibit slower metabolism at LT compared to RT. Consequently, the SS content in seedlings exposed to identical K levels under LT conditions showed a significant increase (Table 1).
4.2. K Can Regulate the Crucial Genes and TFs to Alleviate LT Stress Damage
K+ plays a regulatory role in various biochemical processes related to protein synthesis, carbohydrate metabolism, and enzyme activation, and various physiological processes such as the Ca2+ signaling pathway, photosynthesis, and stomatal control are based on K+ [33]. Genes involved in K+ transport and uptake play a crucial role in alleviating LT stress [34]. In this study, compared with the K0 treatment, genes associated with K uptake, such as K transporter (POT1 and POT6), probable K transporter (HAK8, HAK9, and HAK13), cation/calcium exchange 1 (CCX1), and KAB1, were upregulated after K treatments under LT conditions (Table S6). This study also indicated that genes involved in K+ transport and uptake played significant regulatory roles in coconut response to LT stress.
In many plants, the ICE-CBF-COR signaling pathway is the most important in response to cold stress. This pathway is regulated by CBFs/DREBs, which induce LT tolerance [71]. Genetic and molecular analyses have identified CBFs as key TFs crucial for cold acclimation in higher plants [21,72]. In this study, compared with the K0 treatment, the expression of two genes (dehydration-responsive element-binding proteins (DREB1E and DREB1F) was downregulated in the KH treatment under LT conditions, with DREB1F significantly downregulated (Table S6). This may indicate that LT stress positively regulates DREB1E and DREB1F, while K negatively regulates these two genes to alleviate the damage of LT stress to coconut seedlings.
Ca2+ signaling serves as a vital pathway for K absorption, transportation, and transformation, with its Ca-binding proteins acting as pivotal regulators in these processes [26,33]. Additionally, Ca2+ signaling plays a crucial role as a second messenger in plant responses to cold stress. Intracellular Ca2+ sensors detect changes in Ca2+ levels through phosphorylation, subsequently initiating downstream signaling cascades that trigger the expression of cold-specific genes, aiding plants in adapting to cold stress [73]. To date, numerous Ca2+ signaling-related calcium-binding proteins have been discovered in plants. The primary intracellular Ca2+ sensors in plants include calmodulin (CAM), calmodulin-binding proteins (CML), and calmodulin-like proteins (CBP). Moreover, calmodulin-dependent protein kinases (CPK) and calcineurin B-like proteins (CBL) interacting with protein kinases (CIPK) are crucial components involved in Ca2+ signaling pathways [1]. In this study, compared to the K0 treatment, KH treatment under LT conditions resulted in differential expression of 22 Ca2+ signaling protein genes, with 15 genes (CML14, CML18, CML24, CML27, CML31, CML48, KIC, CP1, CPK18, CPK20, CPK29, CBL3, CIPK1, CIPK18, and CIPK19) being downregulated while seven genes (CML7, CML36, CML45, CPK19, CIPK6, CIPK23, and CIPK32) being upregulated (Table S6). These findings suggest that LT stress induces differential expression of Ca-binding proteins associated with Ca2+ signaling in coconut seedlings, and K may modulate the expression of these genes to maintain homeostasis and equilibrium, therefore mitigating the adverse effects of LT stress on coconut seedlings.
The endogenous hormones within plants and their associated signaling pathways play a central role in governing defense mechanisms against diverse abiotic stresses [74]. In this study, compared to the K0 treatment, the levels of IAA, ZR, and GA in coconut seedling leaves increased in K treatments under LT conditions, and this increase correlated with higher K levels. Furthermore, compared to RT conditions, the levels of IAA, ZR, and GA increased in coconut seedling leaves treated with the same K level under LT conditions. Conversely, the ABA content decreased in the K treatment under LT conditions compared to the K0 treatment, and this decrease was more pronounced with increasing K levels. However, compared to RT conditions, the ABA content in coconut seedling leaves treated with the same K level under LT conditions increased (Figure 2). These findings suggest that the K application effectively mitigates these negative effects and maintains the homeostasis of endogenous hormones. The increase in ABA content in coconut seedling leaves treated with the same K level under LT conditions compared to RT conditions may be attributed to the decline in SPAD and total chlorophyll content under LT conditions, leading to diminished photosynthetic activity in coconut leaves. Abiotic stress triggers the accumulation of ABA, which then binds to PYP/PYL receptors, consequently inhibiting the activity of protein phosphatase 2C (PP2C). This inhibition leads to the activation of protein kinases (SnRK2s), which subsequently phosphorylate downstream TFs, therefore modulating the plant’s response to stress [75]. In this study, compared to K0 treatment under LT conditions, K treatment resulted in the upregulation of the gene encoding probable protein phosphatase 2C (PP2C6 and PP2C27). Contrariwise, it resulted in a decrease in downregulation of the genes encoding ABA receptors (PYL4 and PYL8) and probable protein phosphatase 2C (PP2C34 and PP2C38) (Table S6). Thus, these results suggest that the buildup of endogenous ABA induced by LT stress directly triggers the expression of key ABA signaling pathway genes (PYL4 and PYL8) to inhibit PP2C activity. However, the application of K may inhibit the expression of key PYL genes in the ABA pathway, consequently enhancing the activity of significant PP2C genes to mitigate the adverse impact of LT stress on the growth of coconut seedlings.
IAA, an endogenous small molecule, synergizes with other hormone pathways and exerts a significant impact on plant growth and stress response. The IAA Response Factor and IAA Response Protein are pivotal components of the IAA signaling pathway and serve as regulatory factors for plant growth and stress response [15]. The IAA signaling pathway in strawberries is markedly impaired following LT treatment, underscoring the critical role of IAA signaling in cold stress [76]. In this study, compared to K0 treatment under LT conditions, several key IAA-related genes showed differential expression in K-treated coconut seedlings. IAA-responsive proteins (IAA1 and IAA10), IAA transporter-like proteins (LAX2 and LAX4), IAA response factors (ARF1 and ARF2), IAA efflux carrier components (PIN2 and PIN3), GA receptor (GID1C), and probable protein phosphatase 2C (PP2C6 and PP2C27) were upregulated, while IAA-responsive protein (SAUR32), IAA response factor (ARF19), CIGR1, ABA receptors (PYL4 and PYL8), and probable protein phosphatase 2C (PP2C34 and PP2C38) were downregulated (Table S6). These findings suggest that LT stress negatively regulates certain key IAA-related genes, while K may exert a positive regulatory effect on these genes, mitigating the adverse impact of LT stress on the growth of coconut seedlings.
TFs are crucial for plant growth, development, and responses to abiotic stress. TF families associated with plant stress resistance include AP2/EREBP, MYB, WRKY, and bHLH [77]. Consistent with findings in other plants, our transcriptomic data revealed that the majority of differentially expressed TFs belonged to the WRKY, MYB, ERF/AP2, HSF, BHLH, BZIP, GATA, and NTY families. The AP2/ERF family, comprising AP2/ERF, RAV, and DREB subfamilies, plays crucial roles in multiple stress responses [78]. AP2/ERF genes positively regulate cold stress by upregulating CBF genes and reducing ROS levels [79]. In this study, compared to K0 treatment under LT conditions, 51.43% (18) of ERF/AP2 genes (35) were upregulated, while 48.57% (17) were downregulated. Notably, ERF110, ERF109, ERF3, ERF026, ERF017, and ERF12 were significantly downregulated, whereas RAP2-4 and ERN1 were significantly upregulated (Figure 5). LT stress induces the expression of ERF/AP2 TFs in coconut seedlings, while K application can regulate the upregulation of ERF/AP2 to mitigate the damage caused by LT stress. WRKY-TFs constitute a vital family in combating abiotic stresses like cold, heat, and salt. For instance, PmWRKY32 enhances cold stress resilience by upregulating COR genes, boosting antioxidant enzyme activity, and increasing osmoregulatory substance levels [80]. In our study, compared to K0 treatment under LT conditions, 77.42% (24 out of 31) of WRKY genes were downregulated in K-treated coconut seedlings. Notably, WRKY41, WRKY55, WRKY28, WRKY57, WRKY11, WRKY22, WRKY53, WRKY24, and WRKY50 were significantly downregulated (Figure 5). Consistent with prior research, WRKY emerges as a significant TF involved in regulating LT stress in coconut seedlings [9]. These findings suggest that K application can modulate the upregulation of most WRKY genes, therefore enhancing the ability of coconut seedlings to withstand cold stress. Additionally, certain members of the MYB family have been implicated in cold stress regulation by MYB TFs [81]. In our study, compared to K0 treatment under LT conditions, 90.24% (37 out of 41) of MYB genes were upregulated in K-treated coconut seedlings. Notably, MYB61, KUA1, and AS1 showed significant upregulation (Figure 5). In line with previous studies, MYB emerges as a significant TF involved in regulating LT stress in coconut seedlings [8]. K application can enhance MYB expression, thus contributing to LT stress regulation. Some research indicates that HSF participates in the cold acclimation metabolic pathway of Arabidopsis [82]. Moreover, HSF overexpression stimulates the synthesis of protective metabolites, such as galactose-affinity sugars, bolstering plant tolerance to abiotic stress [83]. In our study, compared to K0, K treatment under LT conditions led to the upregulation of two HSF genes and the downregulation of seven HSF genes (Figure 5). This underscores the crucial role of HSF in coconut response to LT stress, with K application modulating HSF expression to actively counter LT stress. Furthermore, BZIP and BHLH TFs have been implicated in stress responses [28]. In our study, compared to K0, K treatment under LT conditions resulted in 50% (7 out of 14) of BHLH genes being upregulated, while the remaining 50% were downregulated. Notably, BHLH70 and BHLH78 showed significant upregulation, whereas BHLH148, BHLH162, and BHLH153 were significantly downregulated. Additionally, three BZIP genes were downregulated (Figure 5). These findings highlight the positive role of BZIP and BHLH TFs in coconut seedlings’ response to LT stress, with K application influencing the expression of these TFs, therefore facilitating their regulatory function in coconut response to LT stress. Moreover, our study revealed differential expression of GATA and NTY TFs. Specifically, compared to K0, K treatments under LT conditions led to the upregulation of two GATA genes, while four GATA genes (GATA9, GATA8, GATA5 (COCN_GLEAN_10023668 and COCN_GLEAN_10010284)) were significantly downregulated. Additionally, three NTY genes were upregulated (Figure 5). These results indicate the involvement of GATA and NTY TFs in regulating coconut response to LT stress, with K application exerting a positive influence on their expression.
These findings collectively suggest that K application enhances the regulatory roles of ERF/AP2, WRKY, MYB, HSF, BZIP, BHLH, GATA, and NTY TFs in coconut seedlings’ response to low-temperature stress.
4.3. K Activates Crucial Pathways Involved in Synthesis and Metabolism in Response to LT Stress
Carbohydrate metabolism, mainly encompassing starch and sucrose metabolism, amino sugar and nucleotide sugar metabolism, and galactose metabolism, plays pivotal roles in plant responses to various abiotic stresses. UDP-glucose serves as a cellular sugar donor and participates in the glycosylation process of various compounds in plant cells [24]. Our study identified starch and sucrose metabolism, amino sugar and nucleotide sugar metabolism, and galactose metabolism as the main enrichment pathways for DEGs and DAMs. Remarkably, K treatment under LT conditions leads to the upregulation of key genes and metabolites associated with starch and sucrose metabolism, amino sugar and nucleotide sugar metabolism, and galactose metabolism. In comparison with the K0 treatment, SS1, FRK1, and UDP-glucose were upregulated in the starch and sucrose metabolism pathway in K treatments under LT conditions. SS1 and FRK1 genes positively regulated UDP-glucose, while the GAUT5 gene played a negative role (Figure 8a and Figure 10a). Similarly, EP3, FRK1, and UDP-glucose were upregulated in the amino sugar and nucleotide sugar metabolism pathways in K treatments under LT conditions. EP3 and FRK1 genes positively regulated UDP-glucose metabolism (Figure 8a and Figure 10b). Conversely, in the galactose metabolism pathway, RFS1 and HXK2 were downregulated in K treatment under LT conditions, while stachyose was upregulated. HXK2 negatively regulated stachyose, while the RFS1 gene negatively regulated UDP-glucose, stachyose, and raffinose while positively regulating N-acetyl-D-galactosamine (Figure 8a and Figure 10d). These results demonstrate that LT stress disrupts the metabolic processes of starch and sucrose metabolism, amino sugar and nucleotide sugar metabolism, and galactose metabolism in coconut seedlings, while K application maintains the stability of these metabolic processes, thus reducing cold damage to coconuts.
Flavonoid biosynthesis and phenylpropanoid biosynthesis pathways fall under the biosynthesis of other secondary metabolites pathways, playing pivotal roles in plant responses to cold stress and enhancing LT tolerance [8,84,85]. Flavonoids, in particular, play a crucial role in alleviating the cold stress response by eliminating ROS produced during cold stress, thus reducing cold stress damage [25,86]. Notably, flavonoids and lignin accumulation in plants like loquat (E. japonica) [87] and apple (Malus domestica) [88] promote adaptation to LT environments. Cold stress induces the expression of structural genes such as CHS and 4-coumarin CoA ligase (4CL) in the phenylpropanoid biosynthesis pathway. In our study, flavonoid biosynthesis and phenylpropanoid biosynthesis emerged as the main common enrichment pathways of DEGs and DAMs. Compared to K0 treatment, in the flavonoid biosynthesis pathway, CHS3, BAOBT, LAR, ANR, DFR, CYP75A1, CHI3, CYP75A3, and cyanidin were upregulated in K treatments under LT conditions, while PHT1 was downregulated. The PHT1 gene acts as a negative regulator of cyanidin (Figure 9b and Figure 11c). Similarly, in the phenylpropanoid biosynthesis pathway, CCR1, PHT1, PER63, 4CL1, and trans-cinnamate were downregulated in K treatments under LT conditions, whereas CAD6, PER3, BAOBT, SNL6, CYP84A1, CYP73A4, as well as the metabolites coumarin, and 3,5-dimethoxy-4-hydroxycinnamic acids were upregulated. Coumarin was negatively regulated by three key genes (PHT1, PER63, and 4CL1), while 3,5-dimethoxy-4-hydroxycinnamic acids were positively regulated by CAD6 and PER3 genes but negatively regulated by CCR1 genes (Figure 9a and Figure 11d). These results revealed that LT stress induces changes in key genes and metabolites involved in flavonoid and phenylpropanoid biosynthesis pathways, potentially disrupting the normal biosynthesis of flavonoids and phenylpropanoids. However, the application of K proves beneficial in maintaining the homeostasis of this process.
Amino acid genes and metabolites within the amino acid metabolism pathway play a crucial role in responding to abiotic stress in plants [8,23,25]. The pathways such as tyrosine metabolism, cysteine, and methionine metabolism are integral components of amino acid metabolism pathways. In our study, these pathways were identified as the main common enrichment pathways of DEGs and DAMs. Compared to K0 treatment, in the tyrosine metabolism pathway, ADHIII, At1g6281, ADH1, 2,5-dihydroxybenzaldehyde, DL-vanillylmandelic acid, gentisaldehyde, and gentisic acid were upregulated under LT conditions with K treatment, Congruently, ASP5 was downregulated. The ADH1 gene positively regulated DL-vanillylmandelic acid, gentisaldehyde, 2,5-dihydroxybenzaldehyde, and gentisic acid. The ASP5 gene negatively regulated DL-vanillylmandelic acid. In addition, both ADHIII and At1g62810 genes were positively regulated by DL-vanillylmandelic acid (Figure 9c and Figure 11b). In the cysteine and methionine metabolism pathway, SAT1, SAMS (COCN_GLEAN_10015512), OASB, and glutathione were upregulated under LT conditions with K treatment, while SAMS (CUFF46.329.1) and S-adenosylhomocysteine were downregulated. Glutathione was positively regulated by SAMS (COCN_GLEAN_10015512), whereas S-adenosylhomocysteine was negatively regulated by SAT1 (Figure 8b and Figure 10f). These results revealed that LT stress negatively regulates the metabolism of tyrosine metabolism, cysteine, and methionine metabolism. However, the K application effectively alleviates its negative effects.
Alpha (α)-Linolenic acid metabolism and glycerophospholipid metabolism are crucial lipid metabolites that respond to LT stress [8,89]. In our study, the α-Linolenic acid metabolism pathway was among the main enrichment pathways shared by DEGs and DAMs. Compared with K0 treatment, LOX5, LOX4, SDP1, CYP74A1, LCAT3, traumatic acid, alpha-linolenic acid, 9(S)-HpOTrE, and 13(S)-HOTrE were downregulated under LT conditions with K treatment, while ADH1 and 12-oxo-10E-dodecenoic acid were upregulated. The LOX5 gene positively regulated traumatic acid, alpha-linolenic acid, 9(S)-HpOTrE, and 13(S)-HOTrE. CYP74A1 and LOX4 genes positively regulated traumatic acid and alpha-linolenic. The SDP1 gene positively regulated traumatic acid and negatively regulated 12-oxo-10E-dodecenoic acid. APH1 positively regulated 12-oxo-10E-dodecenoic acid while negatively regulated 9(S)-HpOTrE and 13(S)-HOTrE. LCAT3 positively regulated alpha-linolenic acid, 9(S)-HpOTrE, and 13(S)-HOTrE and negatively regulated 12-oxo-10E-dodecenoic acid. The OBL1 gene negatively regulated α-Linolenic acid (Figure 8d and Figure 11a). Similarly, in the glycerophospholipid metabolism pathway, GPAT2, PLD2, PLD1, GDPD1, phosphocholine, and 1-linoleoylglycerophosphocholine were downregulated under LT conditions with K treatment, while AAPT1 was upregulated. The genes of GPAT2, GPAT3, CCT2, PLD2, UGD4, PLD1, and SDP1 simultaneously played a negative role in the regulation of 1-Linoleoylglycerophosphocholine and phosphocholine, while AAPT1 played a positive role in the metabolism of these two metabolites (Figure 8b and Figure 10c). These findings suggest that LT stress affects the expression of genes and metabolites in the α-Linolenic acid metabolism and glycerophospholipid metabolism pathways. The application of K effectively maintains the stability and balance of these metabolic processes.
ABC transporters are crucial for abiotic stress in plants, mainly involved in substance transport within plants, such as carbohydrates, ions, lipids, etc. They play a vital role in translocation and help plants cope with stressful environments [24]. In our study, ABC transporters were the main enrichment pathway for DEGs and DAMs. Compared with the K0 treatment, ABCB1 and glutathione in the ABC transporters pathway were upregulated under LT conditions with K treatment. Specifically, the ABCB1 (CUFF11.175.1) gene positively regulated glutathione (Figure 8b and Figure 10e). These findings suggest that LT stress inhibits the metabolism of ABC transporters while K application effectively alleviates its negative effects.
5. Conclusions
This study comprehensively explored how K regulated the cold tolerance of coconut seedlings by examining both physiological and molecular mechanisms through transcriptomic, metabolomic, and physiological analyses. The results demonstrated that K administration affects various aspects of coconut seedlings’ physiology, including antioxidant enzyme activity, hormone levels, chlorophyll content, and nutrient balance. Moreover, K treatment stimulated the metabolism of hormones, carbohydrates, and secondary metabolites while also influencing amino acid metabolism and lipid metabolism, as well as the activity of ABC transporters. These effects collectively enhanced antioxidant capacity and maintained ROS balance, therefore strengthening coconut seedlings’ ability to withstand cold stress. This study showed the physiological and molecular mechanisms by which potassium regulated the low-temperature tolerance of coconut (Cocos nucifera L.) seedlings (Figure 12). This would lay a foundation for future breeding strategies to enhance cold tolerance in coconut varieties.
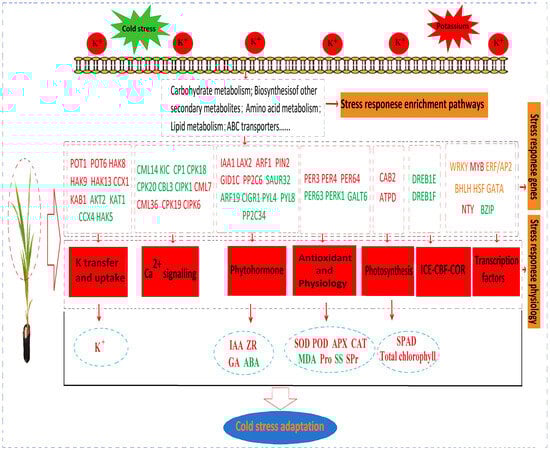
Figure 12.
A schematic diagram of the mechanism by which K enhances the cold tolerance of coconut seedlings. Note: Rectangles represent genes, while ovals represent metabolites. Red font indicates upregulation of gene and metabolite expression, while green font indicates downregulation of gene and metabolite expression. Orange font indicates both upregulation and downregulation of gene and metabolite expression.
Supplementary Materials
The following supporting information can be downloaded at https://www.mdpi.com/article/10.3390/agronomy14122983/s1. Table S1. Primers used in qRT-PCR validation under different comparison groups. Table S2. Summary of the sequencing data generated for RNA-seq and mapping of the coconut genome under different treatments. Table S3. Annotatable genes with FPKM values in RNA-seq in different comparison groups. Table S4. Analyses of Top 20 Go enrichment pathways in different comparison groups. Table S5. Analyses of Top 20 KEGG enrichment pathways in different comparison groups. Table S6. The major regulator genes in different comparison groups. Table S7. Different accumulated metabolites (DAMs) identified in coconut leaves in different comparison groups (Pos. + Neg.). Table S8. KEGG enrichment pathways of different accumulated metabolites (DAMs) in coconut leaves in different comparison groups (Pos. + Neg.). Table S9. KEGG enrichment pathways of correlations between differentially expressed genes (DEGs) and differentially accumulated metabolites (DAMs) in coconut leaves in different comparison groups (Pos. + Neg.). Table S10. Analysis of DEGs and DAMs from KEGG enrichment pathways of correlations between differentially expressed genes (DEGs) and differentially accumulated metabolites (DAMs) in coconut leaves in different comparison groups (Pos. + Neg.). Table S11 Pearson correlation analysis results of differentially expressed genes (DEGs) and differentially accumulated metabolites (DAMs) in key metabolic pathways. Figure S1. Analysis of differential expression levels of genes in coconut seedling leaves under different K levels under LT and RT conditions.(a) Correlation heatmaps of differential expression levels of genes in K0, KL, KM, and KH under LT; (b) Correlation heatmaps of differential expression levels of genes in K0, KL, KM, and KH under RT; (c) PCA analysis of differentially expressed genes (DEGs) in K0, KL, KM, and KH under LT; (d) PCA analysis of DEGs in K0, KL, KM, and KH under RT. LT and RT represent two cultivation temperature conditions, such as low temperature (5 °C) and room temperature (25 °C). K0, KL, KM, and KH represent the four levels of K treatments (0.1, 2, 4, and 6), mM potassium chloride (KCl). Figure S2. Volcano and bar charts of differentially expressed genes (DEGs) in coconut seedling leaves under different K levels under LT and RT conditions. (a) K0 vs. KL in LT; (b) K0 vs. KM in LT; (c) K0 vs. KH in LT; (d) K0 vs. KL in RT; (e) K0 vs. KM in RT; (f) K0 vs. KH in RT. LT, RT, K0, KL, KM, and KH are detailed in Figure S1. Figure S3. GO annotation classification statistics of differentially expressed genes (DEGs) in coconut seedling leaves under different K levels under LT and RT conditions. (a) K0 vs. KL in RT; (b) K0 vs. KM in RT; (c) K0 vs. KH in RT; (d) K0 vs. KL in LT; (e) K0 vs. KM in LT; (f) K0 vs. KH in LT. LT, RT, K0, KL, KM, and KH are detailed in Figure S1. Figure S4. qRT-PCR validation of RNA-qseq relative expression estimation. (a) qRT-PCR and RNA-seq expression analysis was performed on 13 candidate genes in coconut seedling leaves under LT conditions in K0, KL, KM, and KH. The left Y-axis represents RNA-seq, and the right Y-axis represents qRT-PCR. The error bar represents the mean ± standard deviation of three biological replicates. (b) Correlation between qRT-PCR and RNA-seq detection of selected gene expression levels. LT, K0, KL, KM, and KH are detailed in Figure S1. Figure S5. Volcano plot of differential metabolites in coconut seedling leaves under different K levels under LT and RT conditions. (a) K0 vs. KL in LT; (b) K0 vs. KM in LT; (c) K0 vs. KH in LT; (d) K0 vs. KL in RT; (e) K0 vs. KM in RT; (f) K0 vs. KH in RT. Pos, in positive mode Neg, in negative mode. LT, RT, K0, KL, KM, and KH are detailed in Figure S1. Figure S6. Classification and distribution of differentially accumulated metabolites (DAMs) in coconut seedling leaves under different K levels under LT and RT conditions. (a) K0 vs. KL in LT; (b) K0 vs. KM in LT; (c) K0 vs. KH in LT; (d) K0 vs. KL in RT; (e) K0 vs. KM in RT; (f) K0 vs. KH in RT. LT, RT, K0, KL, KM, and KH are detailed in Figure S1. Figure S7. Cluster heatmap of differential metabolites in coconut seedling leaves under different K levels under LT and RT conditions. (a) K0 vs. KL in LT; (b) K0 vs. KM in LT; (c) K0 vs. KH in LT; (d) K0 vs. KL in RT; (e) K0 vs. KM in RT; (f) K0 vs. KH in RT. Pos, in positive mode Neg, in negative mode. LT, RT, K0, KL, KM, and KH are detailed in Figure S1. Figure S8. Differential metabolic analysis of coconut seedling leaves under different K levels under LT and RT conditions. (a) Column Chart from top 10 of differentially accumulated metabolites (DAMs) in upregulation and downregulation in K0 vs. KL under LT; (b) Column Chart from top 10 of DAMs in upregulation and downregulation in K0 vs. KM under LT; (c) Column Chart from top 10 of DAMs in upregulation and downregulation in K0 vs. KH under LT; (d) Column Chart from top 10 of DAMs in upregulation and downregulation in K0 vs. KL under RT; (e) Column Chart from top 10 of DAMs in upregulation and downregulation in K0 vs. KM under RT; (f) Column Chart from top 10 of DAMs in upregulation and downregulation in K0 vs. KH under RT; (g) Principal Component Analysis (PCA) of DAMs in coconut seedling leaves treated with K0, KL, KM, and KH under LT and RT conditions. LT, RT, K0, KL, KM, and KH are detailed in Figure S1. Figure S9. Correlation diagram between samples of coconut seedling leaves treated with K0, KL, KM, and KH under LT and RT conditions. (a) K0, KL, KM, and KH treatments under LT conditions; (b) K0, KL, KM, and KH under RT conditions. Pos, in positive mode Neg, in negative mode LT, RT, K0, KL, KM, and KH are detailed in Figure S1. Figure S10. KEGG enrichment pathways of differential metabolites in coconut seedling leaves treated with K0, KL, KM, and KH under LT and RT conditions. (a) K0 vs. KL in LT; (b) K0 vs. KM in LT;(c) K0 vs. KH in LT; (d) K0 vs. KL in RT; (e) K0 vs. KH in RT;(f) K0 vs. KH in RT. Pos, in positive mode Neg, in negative mode LT, RT, K0, KL, KM, and KH are detailed in Figure S1. Figure S11. Co-enrichment column chart of differentially expressed genes (DEGs) and differentially accumulated metabolites (DAMs) in coconut seedling leaves treated with K0, KL, KM, and KH under LT and RT conditions. (a) K0 vs. KL in LT; (b) K0 vs. KM in LT;(c) K0 vs. KH in LT; (d) K0 vs. KL in RT; (e) K0 vs. KH in RT;(f) K0 vs. KH in RT. Pos, in positive mode Neg, in negative mode LT, RT, K0, KL, KM, and KH are detailed in Figure S1.
Author Contributions
Conceptualization, L.L. and Y.Y.; methodology, L.L., Y.Y., Y.W. and A.I.; validation, L.L., Y.Y. and M.A.S.; investigation, L.L., Y.W. and M.A.S.; data curation, L.L., Y.Y., Y.W., M.A.S. and A.I.; writing—original draft preparation, L.L., Y.W. and A.I.; writing—review and editing, L.L., Y.Y., M.A.S. and A.I.; project administration, L.L. and Y.Y. All authors have read and agreed to the published version of the manuscript.
Funding
The authors gratefully acknowledge the financial support from the High-Level Talents Program of the Hainan Natural Science Foundation (323RC523 and 320RC741, respectively).
Institutional Review Board Statement
Not applicable.
Informed Consent Statement
Not applicable.
Data Availability Statement
Data will be made available at https://www.ncbi.nlm.nih.gov/bioproject/PRJNA1109394 (accessed on 9 May 2024).
Conflicts of Interest
The authors declare no conflicts of interest.
References
- Zhao, Y.; Zhou, M.; Xu, K.; Li, J.H.; Li, S.S.; Zhang, S.H.; Yang, X.J. Integrated transcriptomics and metabolomics analyses provide insights into cold stress response in wheat. Crop J. 2019, 7, 857–866. [Google Scholar] [CrossRef]
- Hu, Y.M.; Peng, X.J.; Wang, F.F.; Chen, P.L.; Zhao, M.L.; Shen, S.H. Natural population re-sequencing detects the genetic basis of local adaptation to low temperature in a woody plant. Plant Mol. Biol. 2021, 105, 585–599. [Google Scholar] [CrossRef] [PubMed]
- Sakina, A.; Wani, W.; Mushtaq, M.; Wani, S.H.; Shikari, A.B. Omics approaches for cold stress tolerance in plants. In Recent Approaches in Omics for Plant Resilience to Climate Change; Wani, S.H., Ed.; Springer International Publishing: Cham, Switzerland, 2019; pp. 331–356. [Google Scholar] [CrossRef]
- Mou, D.; Li, Z.R.; Liu, W.H.; Liang, G.L.; Jia, Z.F.; Yu, H.Y.; Wang, J.L.; Ou, W.Y.; Liu, K.; Yao, X.X.; et al. Integrated transcriptomic and metabolomic analyses of Caucasian clover (Trifolium ambiguum Bieb.) in response to freezing stress. Braz. J. Bot. 2022, 45, 573–585. [Google Scholar] [CrossRef]
- Ma, L.; Coulter, J.A.; Liu, L.J.; Zhao, Y.H.; Chang, Y.; Pu, Y.Y.; Zeng, X.C.; Xu, Y.Z.; Wu, J.Y.; Fang, Y.; et al. Transcriptome analysis reveals key cold-stress-responsive genes in winter rapeseed (Brassica rapa L.). Int. J. Mol. Sci. 2019, 20, 1071. [Google Scholar] [CrossRef]
- Kapoor, D.; Singh, S.; Kumar, V.; Romero, R.; Prasad, R.; Singh, J. Antioxidant enzymes regulation in plants in reference to reactive oxygen species (ROS) and reactive nitrogen species (RNS). Plant Gene 2019, 19, 100182. [Google Scholar] [CrossRef]
- Fürtauer, L.; Weiszmann, J.; Weckwerth, W.; Nägele, T. Dynamics of plant metabolism during cold acclimation. Int. J. Mol. Sci. 2019, 20, 5411. [Google Scholar] [CrossRef]
- Lu, L.; Yang, W.; Dong, Z.; Tang, L.; Liu, Y.; Xie, S.; Yang, Y. Integrated Transcriptomic and Metabolomics Analyses Reveal Molecular Responses to Cold Stress in Coconut (Cocos nucifera L.) Seedlings. Int. J. Mol. Sci. 2023, 24, 14563. [Google Scholar] [CrossRef] [PubMed]
- Zhu, A.D.; Li, W.Y.; Ye, J.L.; Sun, X.H.; Ding, Y.D.; Cheng, Y.J.; Deng, X.X. Microarray expression profiling of postharvest ponkan mandarin (Citrus reticulata) fruit under cold storage reveals regulatory gene candidates and implications on soluble sugars metabolism. J. Int. Plant Biol. 2011, 53, 358–374. [Google Scholar] [CrossRef]
- Halman, J.M.; Schaberg, P.G.; Hawley, G.J.; Eagar, C. Calcium addition at the Hubbard Brook Experimental Forest increases sugar storage, antioxidant activity and cold tolerance in native red spruce (Picea rubens). Tree Physiol. 2008, 28, 855–862. [Google Scholar] [CrossRef]
- Zhang, J.; Liang, L.; Xie, Y.; Zhao, Z.; Su, L.; Tang, Y.; Sun, B.; Lai, Y.; Li, H. Transcriptome and Metabolome Analyses Reveal Molecular Responses of Two Pepper (Capsicum annuum L.) Cultivars to Cold Stress. Front. Plant Sci. 2022, 13, 819630. [Google Scholar] [CrossRef]
- Zhang, W.J.; Wang, J.Q.; Huang, Z.L.; Mi, L.; Xu, K.F.; Wu, J.J.; Fan, Y.H.; Ma, S.Y.; Jiang, D.G. Effects of low temperature at booting stage on sucrose metabolism and endogenous hormone contents in winter wheat Spikelet. Front. Plant Sci. 2019, 10, 498. [Google Scholar] [CrossRef]
- Yang, Y.N.; Yao, Z.K.; Jia, J.; Duan, F.J.; Chen, Z.Y.; Sang, L.Y. Effect of exogenous abscisic acid on cold acclimation in two Magnolia species. Biol. Plant. 2016, 60, 555–562. [Google Scholar] [CrossRef]
- Xu, G.X.; Li, L.J.; Zhou, J.; Lyu, D.G.; Zhao, D.Y.; Qin, S.J. Comparison of transcriptome and metabolome analysis revealed differences in cold resistant metabolic pathways in different apple cultivars under low temperature stress. Hortic. Plant J. 2023, 9, 183–198. [Google Scholar] [CrossRef]
- Paterlini, A. Uncharted routes: Exploring the relevance of auxin movement via plasmodesmata. Biol. Open 2020, 9, bio055541. [Google Scholar] [CrossRef]
- Taïbi, K.; Campo, A.D.D.; Vilagrosa, A.; Bellés, J.M.; López-Gresa, M.P.; López-Nicolás, J.M.; Mulet, J.M. Distinctive physiological and molecular responses to cold stress among cold-tolerant and cold-sensitive Pinus halepensis seed sources. BMC Plant Biol. 2018, 18, 236. [Google Scholar] [CrossRef]
- Suzuki, N. Temperature stress and responses in plants. Int. J. Mol. Sci. 2019, 20, 2001. [Google Scholar] [CrossRef] [PubMed]
- Yuan, P.; Yang, T.; Poovaiah, B.W. Calcium signaling-mediated plant response to cold stress. Int. J. Mol. Sci. 2018, 19, 3896. [Google Scholar] [CrossRef]
- Kim, Y.S.; Lee, M.; Lee, J.H.; Lee, H.J.; Park, C.M. The unified ICE-CBF pathway provides a transcriptional feedback control of freezing tolerance during cold acclimation in Arabidopsis. Plant Mol. Biol. 2015, 89, 187–201. [Google Scholar] [CrossRef] [PubMed]
- Tang, K.; Zhao, L.; Ren, Y.; Yang, S.; Zhu, J.K.; Zhao, C. The transcription factor ICE1 functions in cold stress response by binding to the promoters of CBF and COR genes. J. Integr. Plant Biol. 2020, 62, 258–263. [Google Scholar] [CrossRef] [PubMed]
- Dong, B.; Zheng, Z.; Zhong, S.; Ye, Y.; Wang, Y.; Yang, L.; Xiao, Z.; Fang, Q.; Zhao, H. Integrated Transcriptome and Metabolome Analysis of Color Change and Low-Temperature Response during Flowering of Prunus mume. Int. J. Mol.Sci. 2022, 23, 12831. [Google Scholar] [CrossRef]
- Sun, S.; Fang, J.; Lin, M.; Hu, C.; Qi, X.; Chen, J.; Zhong, Y.; Muhammad, A.; Li, Z.; Li, Y. Comparative Metabolomic and Transcriptomic Studies Reveal Key Metabolism Pathways Contributing to Freezing Tolerance Under Cold Stress in Kiwifruit. Front. Plant Sci. 2021, 12, 628969. [Google Scholar] [CrossRef]
- Wang, J.; Guo, J.P.; Zhang, Y.X.; Yan, X.R. Integrated transcriptomic and metabolomic analyses of yellow horn (Xanthoceras sorbifolia) in response to cold stress. PLoS ONE 2020, 15, e0236588. [Google Scholar] [CrossRef]
- Raza, A.; Su, W.; Hussain, M.A.; Mehmood, S.S.; Zhang, X.; Cheng, Y.; Zou, X.; Lv, Y. Integrated Analysis of Metabolome and Transcriptome Reveals Insights for Cold Tolerance in Rapeseed (Brassica napus L.). Front. Plant Sci. 2021, 12, 721681. [Google Scholar] [CrossRef]
- Gao, C.; Mumtaz, M.A.; Zhou, Y.; Yang, Z.; Shu, H.; Zhu, J.; Bao, W.; Cheng, S.; Yin, L.; Huang, J.; et al. Integrated Transcriptomic and Metabolomic Analyses of Cold-Tolerant and Cold-Sensitive Pepper Species Reveal Key Genes and Essential Metabolic Pathways Involved in Response to Cold Stress. Int. J. Mol. Sci. 2022, 23, 6683. [Google Scholar] [CrossRef]
- Cheng, Y.; Ban, Q.; Mao, J.; Lin, M.; Zhu, X.; Xia, Y.; Cao, X.; Zhang, X.; Li, Y. Integrated Metabolomic and Transcriptomic Analysis Reveals That Amino Acid Biosynthesis May Determine Differences in Cold-Tolerant and Cold-Sensitive Tea Cultivars. Int. J. Mol. Sci. 2023, 24, 1907. [Google Scholar] [CrossRef]
- Guo, Y.G.; Wang, C.Y.; Fu, M.K.; El-Kassaby, F.F.; Wang, Y.A.; Wang, T.L.; Gui, B. Metabolome and transcriptome analyses reveal flavonoids biosynthesis differences in ginkgo biloba associated with environmental conditions. Ind. Crops Prod. 2020, 158, 112963. [Google Scholar] [CrossRef]
- Mehmood, S.S.; Lu, G.; Luo, D.; Hussain, M.A.; Raza, A.; Zafar, Z.; Zhang, X.K.; Cheng, Y.; Zou, X.L.; Lv, Y. Integrated analysis of transcriptomics and proteomics provides insights into the molecular regulation of cold response in Brassica napus. Environ. Exp. Bot. 2021, 187, 104480. [Google Scholar] [CrossRef]
- Sanyal, S.K.; Rajasheker, G.; Kishor, P.K.; Kumar, S.A.; Kumari, P.H.; Saritha, K.V.; Rathnagiri, P.; Pandey, G.K. Role of protein phosphatases in signaling, potassium transport, and abiotic stress responses. In Protein Phosphatases and Stress Management in Plants; Pandey, G.K., Ed.; Springer: Cham, Switzerland, 2020; pp. 203–232. [Google Scholar] [CrossRef]
- Sardans, J.; Peñuelas, J. Potassium control of plant functions: Ecological and agricultural implications. Plants 2021, 10, 419. [Google Scholar] [CrossRef] [PubMed]
- Vašák, M.; Schnabl, J. Sodium and potassium ions in proteins and enzyme catalysis. Metal. Ions Life Sci. 2016, 16, 259. [Google Scholar] [CrossRef]
- Coskun, D.; Britto, D.T.; Kronzucker, H. The nitrogen-potassium intersection: Membranes, metabolism, and mechanism. Plant Cell Environ. 2017, 40, 2029–2041. [Google Scholar] [CrossRef] [PubMed]
- Hasanuzzaman, M.; Bhuyan, M.H.M.; Nahar, K.; Hossain, M.S.; Mahmud, J.A.; Hossen, M.S.; Masud, A.A.C.; Moumita Fujita, M. Potassium: A vital regulator of plant responses and tolerance to abiotic stresses. Agronomy 2018, 8, 31. [Google Scholar] [CrossRef]
- Hosseini, S.A.; Maillard, A.; Hajirezaei, M.R.; Ali, N.; Schwarzenberg, A.; Jamois, F.; Yvin, J.C. Induction of Barley Silicon Transporter HvLsi1 and HvLsi2, increased silicon concentration in the shoot and regulated Starch and ABA Homeostasis under Osmotic stress and Concomitant Potassium Deficiency. Front. Plant Sci. 2017, 8, 1359. [Google Scholar] [CrossRef] [PubMed]
- Karimi, R. Potassium-induced freezing tolerance is associated with endogenous abscisic acid, polyamines and soluble sugars changes in grapevine. Sci. Hortic. 2017, 215, 184–194. [Google Scholar] [CrossRef]
- Ho, L.H.; Rode, R.; Siegel, M.; Reinhardt, F.; Neuhaus, H.E.; Yvin, J.C.; Pluchon, S.; Hosseini, S.A.; Pommerrenig, B. Potassium application boosts photosynthesis and sorbitol biosynthesis and accelerates cold acclimation of common plantain (Plantago major L.). Plants 2020, 9, 1259. [Google Scholar] [CrossRef] [PubMed]
- Maheswarappa, H.P.; Thomas, G.V.; Gupta, A.; Bhat, R.; Palaniswami, C. Productivity and nutrient status of coconut (Cocos nucifera) as influenced by integrated nutrient management with vermicomposted coconut leaves. Indian J. Agron. 2014, 59, 455–459. [Google Scholar]
- Kalpana, M.; Gautam, B.; Srinivasulu, B.; Rao, D.V.R.; Arulraj, S.; Jayabose, C. Impact of integrated nutrient management on nut yield and quality of coconut under coastal ecosystem. J. Plant Crops 2008, 36, 249–253. [Google Scholar]
- Lu, L.; Chen, S.; Yang, W.; Wu, Y.; Liu, Y.; Yin, X.; Yang, Y.; Yang, Y. Integrated transcriptomic and metabolomic analyses reveal key metabolic pathways in response to potassium deficiency in coconut (Cocos nucifera L.) seedlings. Front. Plant Sci. 2023, 14, 1112264. [Google Scholar] [CrossRef] [PubMed]
- Tang, L.X.; Liu, L.Y.; Feng, M.L. Development of coconut industry in the world. Acta Agric. Jiangxi 2016, 11, 159–165. (In Chinese) [Google Scholar]
- Lu, L.L.; Liu, R.; Xiao, Y.; Li, J.; Shen, X.J.; Li, H.S.; Fan, H.K. Research Progress on Coconut Germplasm Resources, Cultivation and Utilization. Chin. J. Trop. Crops 2021, 42, 9. (In Chinese) [Google Scholar]
- Peamprasart, T.; Chiewchan, N. Effect of fat content and preheat treatment on the apparent viscosity of coconut milk after homogenization. J. Food Eng. 2006, 77, 653–658. [Google Scholar] [CrossRef]
- Zhao, S.L.; Cao, H.X. Collection, Conservation, Identification, Evaluation and Innovative Utilization of Coconut Germplasm Resources, 1st ed.; China Agriculture Press: Beijing, China, 2012; pp. 112–116. [Google Scholar]
- Cao, H.; Huang, H.; Lei, X.; Zhang, D.; Zhang, R. Difference of the leaf anatomical structure of coconut varieties under low temperature treatments. Chin. J. Trop. Crops 2014, 35, 2420–2425. (In Chinese) [Google Scholar]
- Yang, Y.; Iqbal, A.; Qadri, R. Breeding of coconut (Cocos nucifera L.): The tree of life. In Advances in Plant Breeding Strategies: Fruits; Al-Khayri, J., Jain, S., Johnson, D., Eds.; Springer: Cham, Switzerland, 2018; pp. 673–725. [Google Scholar]
- Cao, H.X.; Lei, X.T.; Liu, Y.J.; Sun, C.X.; Zhang, R.L. Identification and comprehensive evaluation of cold resistance indexes of coconut. Guangdong Agric. Sci. 2016, 2, 49–54. (In Chinese) [Google Scholar] [CrossRef]
- Yang, Y.D.; Mumtaz, A.S.; Walid, B.A.; Zhang, J.; Wu, Y.; Li, J.; Fan, H.K.; Wang, F.Y. iTRAQ-based comparative proteomic analysis of two coconut varieties reveals aromatic coconut cold-sensitive in response to low temperature. J. Proteom. 2020, 220, 103766. [Google Scholar] [CrossRef]
- Li, J.; Wang, F.; Sayed, M.A.; Shen, X.; Zhou, L.; Liu, X.; Sun, X.; Chen, S.; Wu, Y.; Lu, L.; et al. Integrated transcriptomic and metabolomic data reveal the cold stress responses molecular mechanisms of two coconut varieties. Front. Plant Sci. 2024, 15, 1353352. [Google Scholar] [CrossRef]
- Brunin, C.; He, G.L. Diagnosis of coconut leaves-world tropical agriculture information. World Trop. Agric. Inform. 1965, 5, 58–60. [Google Scholar]
- Hoagland, D.R.; Arnon, D.I. The water-culture method for growing plants without soil. Calif. Agric. Exp. Stn. Circ. 1950, 347, 1–32. [Google Scholar]
- Wang, Y.J.; Hu, X.; Jin, G.; Hou, Z.W.; Ning, J.M.; Zhang, Z.Z. Rapid prediction of chlorophylls and carotenoids content in tea leaves under different levels of nitrogen application based on hyperspectral imaging. J. Sci. Food Agric. 2019, 99, 1997–2004. [Google Scholar] [CrossRef]
- Bao, S.D. Agrochemical Analysis of Soil, 3rd ed.; Agricultural Publishing House: Beijing, China, 2000; pp. 23–56. (In Chinese) [Google Scholar]
- Li, H.S. Principles and Techniques of Plant Physiology and Biochemistry Experiment; Higher Education Press: Beijing, China, 2000; pp. 25–63. [Google Scholar]
- Xiao, Y.; Xu, P.X.; Fan, H.K.; Luc, B.; Xia, W.; Stephanie, B.; Xu, J.Y.; Li, Q.; Guo, A.P.; Zhou, L.X.; et al. The genome draft of coconut (Cocos nucifera). GigaSci 2017, 6, 1–17. [Google Scholar] [CrossRef]
- Kim, D.; Langmead, B.; Salzberg, S.L. HISAT: A fast spliced aligner with low memory requirements. Nat. Meth. 2015, 12, 357–360. [Google Scholar] [CrossRef]
- Tatusov, R.L.; Galperin, M.Y.; Natale, D.A. The COG database: A tool for genome scale analysis of protein functions and evolution. Nucleic Acids Res. 2000, 28, 33–36. [Google Scholar] [CrossRef]
- Finn, R.D.; Alex, B.; Jody, C.; Penelope, C.; Eberhardt, R.Y.; Eddy, S.R.; Andreas, H.; Kirstie, H.; Liisa, H.; Jaina, M.; et al. Pfam: The protein families database. Nucleic Acids Res. 2013, 42, D222–D230. [Google Scholar] [CrossRef] [PubMed]
- Li, B.; Dewey, C.N. RSEM: Accurate transcript quantification from RNA-seq data with or without a reference genome. BMC Bioinf. 2011, 12, 323. [Google Scholar] [CrossRef]
- Love, M.I.; Huber, W.; Anders, S. Moderated estimation of fold change and dispersion for RNA-seq data with DESeq2. Genome Biol. 2014, 15, 550. [Google Scholar] [CrossRef]
- Ashburner, M.; Ball, C.A.; Blake, J.A.; Botstein, D.; Butler, H.; Cherry, J.M.; Davis, A.P.; Dolinski, K.; Dwight, S.S.; Eppig, J.T.; et al. Gene ontology: Tool for the unification of biology. Nat. Genet. 2000, 25, 25–29. [Google Scholar] [CrossRef]
- Alexa, A.; Rahnenfuhrer, J. topGO: Enrichment Analysis for Gene Ontology; R Package Version 2.8; The Pennsylvania State University: University Park, PA, USA, 2010. [Google Scholar]
- Kanehisa, M.; Goto, S.; Kawashima, S.; Okuno, Y.; Hattori, M. The KEGG resource for deciphering the genome. Nucleic Acids Res. 2004, 32, D277–D280. [Google Scholar] [CrossRef]
- Shannon, P.; Markiel, A.; Ozier, O.; Baliga, N.S.; Wang, J.T.; Ramage, D.; Amin, N.; Schwikowski, B.; Ideker, T. Cytoscape: A software environment for integrated models of biomolecular interaction networks. Genome Res. 2003, 13, 2498–2504. [Google Scholar] [CrossRef]
- Livak, K.J.; Schmittgen, T.D. Analysis of relative gene expression data using real time quantitative PCR and the 2-DDCT method. Methods 2001, 25, 402–408. [Google Scholar] [CrossRef] [PubMed]
- Hu, Z.R.; Yan, W.J.; Yang, C.K.; Huang, X.B.; Hu, X.T.; Li, Y.Y.; Yang, J.S.; Xiang, S.P.; Yi, P.F.; Hu, R.S. Integrative analysis of transcriptome and metabolome provides insights into the underlying mechanism of cold stress response and recovery in two tobacco cultivars. Environ. Exp. Bot. 2022, 200, 104920. [Google Scholar] [CrossRef]
- Li, H.; Wang, H.; Wen, W.J.; Yang, G.W. The antioxidant system in Suaeda salsa under salt stress. Plant Signal. Behav. 2020, 15, 1771939. [Google Scholar] [CrossRef]
- Ju, F.; Pang, J.; Sun, L.; Gu, J.; Wang, Z.; Wu, X.; Ali, S.; Wang, Y.; Zhao, W.; Wang, S.; et al. Integrative transcriptomic, metabolomic and physiological analyses revealed the physiological and molecular mechanisms by which potassium regulates the salt tolerance of cotton (Gossypium hirsutum L.) roots. Ind. Crops Prod. 2023, 193, 116177. [Google Scholar] [CrossRef]
- Ahanger, M.A.; Agarwal, R.M. Salinity stress induced alterations in antioxidant metabolism and nitrogen assimilation in wheat (Triticum aestivum L.) as influenced by potassium supplementation. Plant Physiol. Biochem. 2017, 115, 449–460. [Google Scholar] [CrossRef]
- Ahanger, M.A.; Tomar, N.S.; Tittal, M.; Argal, S.; Agarwal, R.M. Plant growth under water/salt stress: ROS production; antioxidants and signifcance of added potassium under such conditions. Physiol. Mol. Biol. Plants 2017, 23, 731–744. [Google Scholar] [CrossRef]
- George, I.S.; Pascovici, D.; Mirzaei, M.; Haynes, P.A. Quantitative proteomic analysis of cabernet sauvignon grape cells exposed to thermal stresses reveals alterations in sugar and phenylpropanoid metabolism. Proteomics 2015, 15, 3048–3060. [Google Scholar] [CrossRef]
- Wang, D.Z.; Jin, Y.N.; Ding, X.H.; Wang, W.J.; Zhai, S.S.; Bai, L.P.; Guo, Z.F. Gene regulation and signal transduction in the ICE–CBF–COR signaling pathway during cold stress in plants. Biochemistry 2017, 82, 1103–1117. [Google Scholar] [CrossRef] [PubMed]
- Wang, F.; Chen, X.; Dong, S.; Jiang, X.; Wang, L.; Yu, J.; Zhou, Y. Crosstalk of PIF4 and DELLA modulates CBF transcript and hormone homeostasis in cold response in tomato. Plant Biotechnol. J. 2020, 18, 1041–1055. [Google Scholar] [CrossRef]
- Guo, X.Y.; Liu, D.F.; Chong, K. Cold signaling in plants: Insights into mechanisms and regulation. J. Integr. Plant Biol. 2018, 60, 745–756. [Google Scholar] [CrossRef] [PubMed]
- Guo, Y.L.; Yan, J.Y.; Su, Z.Z.; Chang, J.J.; Yang, J.Q.; Wei, C.H.; Zhang, Y.; Ma, J.X.; Zhang, X.; Li, H. Abscisic acid mediates grafting-induced cold tolerance of watermelon via interaction with melatonin and methyl jasmonate. Front. Plant Sci. 2021, 12, 785317. [Google Scholar] [CrossRef]
- Wang, Y.X.; Hu, Y.; Chen, B.H.; Zhu, Y.F.; Dawuda, M.M.; Svetla, S. Physiological mechanisms of resistance to cold stress associated with 10 elite apple rootstocks. J. Integr. Agric. 2018, 17, 857–866. [Google Scholar] [CrossRef]
- Zhang, Y.; Zhang, Y.; Lin, Y.; Luo, Y.; Wang, X.; Chen, Q.; Sun, B.; Wang, Y.; Li, M.; Tang, H. A transcriptomic analysis reveals diverse regulatory networks that respond to cold stress in strawberry (Fragaria × ananassa). Int. J. Genom. 2019, 2019, 7106092. [Google Scholar] [CrossRef]
- Sazegari, S.; Niazi, A.; Ahmadi, F.S.A. Study on the regulatory network with promoter analysis for Arabidopsis DREB-genes. Bioinformation 2015, 11, 101. [Google Scholar] [CrossRef]
- Vazquez, M.; Romero, I.; Escribano, M.I.; Merodio, C.; Sanchez-Ballesta, M.T. Deciphering the Role of CBF/DREB Transcription Factorsand Dehydrins in Maintaining the Quality of Table Grapes cv. Autumn Royal Treated with High CO2 Levels and Stored at 0 °C. Front. Plant Sci. 2017, 8, 1591. [Google Scholar] [CrossRef]
- Pradhan, S.K.; Pandit, E.; Nayak, D.K.; Behera, L.; Mohapatra, T. Genes, pathways and transcription factors involved in seedling stage chilling stress tolerance in indica rice through RNA-Seq analysis. BMC Plant Biol. 2019, 19, 352. [Google Scholar] [CrossRef]
- Bao, F.; Ding, A.; Cheng, T.; Wang, J.; Zhang, Q. Genome-wide analysis of members of the WRKY gene family and their cold stress response in Prunus mume. Genes 2019, 10, 911. [Google Scholar] [CrossRef]
- Zhang, C.Y.; Liu, H.C.; Zhang, X.S.; Guo, Q.X.; Bian, S.M.; Wang, J.Y.; Zhai, L.L. VcMYB4a, an R2R3-MYB transcription factor from Vaccinium corymbosum, negatively regulates salt, drought, and temperature stress. Gene 2020, 757, 144935. [Google Scholar] [CrossRef]
- Olate, E.; Jiménez-Gómez, J.M.; Holuigue, L.; Salinas, J. NPR1 mediates a novel regulatory pathway in cold acclimation by interacting with HSFA1 factors. Nat. Plants 2018, 4, 811–823. [Google Scholar] [CrossRef] [PubMed]
- Lang, S.; Liu, X.; Xue, H.; Li, X.; Wang, X. Functional characterization of BnHSFA4a as a heat shock. J. Exp. Bot. 2017, 68, 2361–2375. [Google Scholar] [CrossRef]
- Wei, L.; Sun, X.; Qi, X.; Zhang, Y.; Xu, Y. Dihydromyricetin ameliorates cardiac ischemia/reperfusion injury through Sirt3 activation. BioMed Res. Int. 2019, 2019, 6803943. [Google Scholar] [CrossRef]
- Liu, Y.; Tikunov, Y.; Schouten, R.E.; Marcelis, L.F.M.; Visser, R.G.F.; Bovy, A. Anthocyanin biosynthesis and degradation mechanisms in solanaceous vegetables: A review. Front. Chem. 2018, 6, 52–58. [Google Scholar] [CrossRef]
- Li, Y.T.; Zhang, J.; Wang, S.J.; Zhang, H.E.; Liu, Y.C.; Yang, M.S. Integrative transcriptomic and metabolomic analyses reveal the flavonoid biosynthesis of Pyrus hopeiensis flowers under cold stress. Hortic. Plant J. 2023, 9, 395–413. [Google Scholar] [CrossRef]
- Zhang, J.; Yin, X.R.; Li, H.; Xu, M.; Zhang, M.X.; Li, S.J.; Liu, X.F.; Shi, Y.N.; Grierson, D.; Chen, K.S. Ethylene response factor EjERF39-EjMYB8 complex activates cold-induced lignification of loquat fruit, via the biosynthetic gene Ej4CL1. J. Exp. Bot. 2020, 71, 3172–3184. [Google Scholar] [CrossRef]
- An, J.P.; Wang, X.F.; Zhang, X.W.; Xu, H.F.; Hao, Y.J. An apple MYB transcription factor regulates cold tolerance and anthocyanin accumulation and undergoes MIEL1-mediated degradation. Plant Biotechnol. J. 2020, 18, 337–353. [Google Scholar] [CrossRef]
- Xie, D.; Li, Z. Transcriptome profile and differentially expressed genes analysis in winter wheat under cold stress conditions. Res. J. Biotechnol. 2015, 10, 73–88. [Google Scholar]


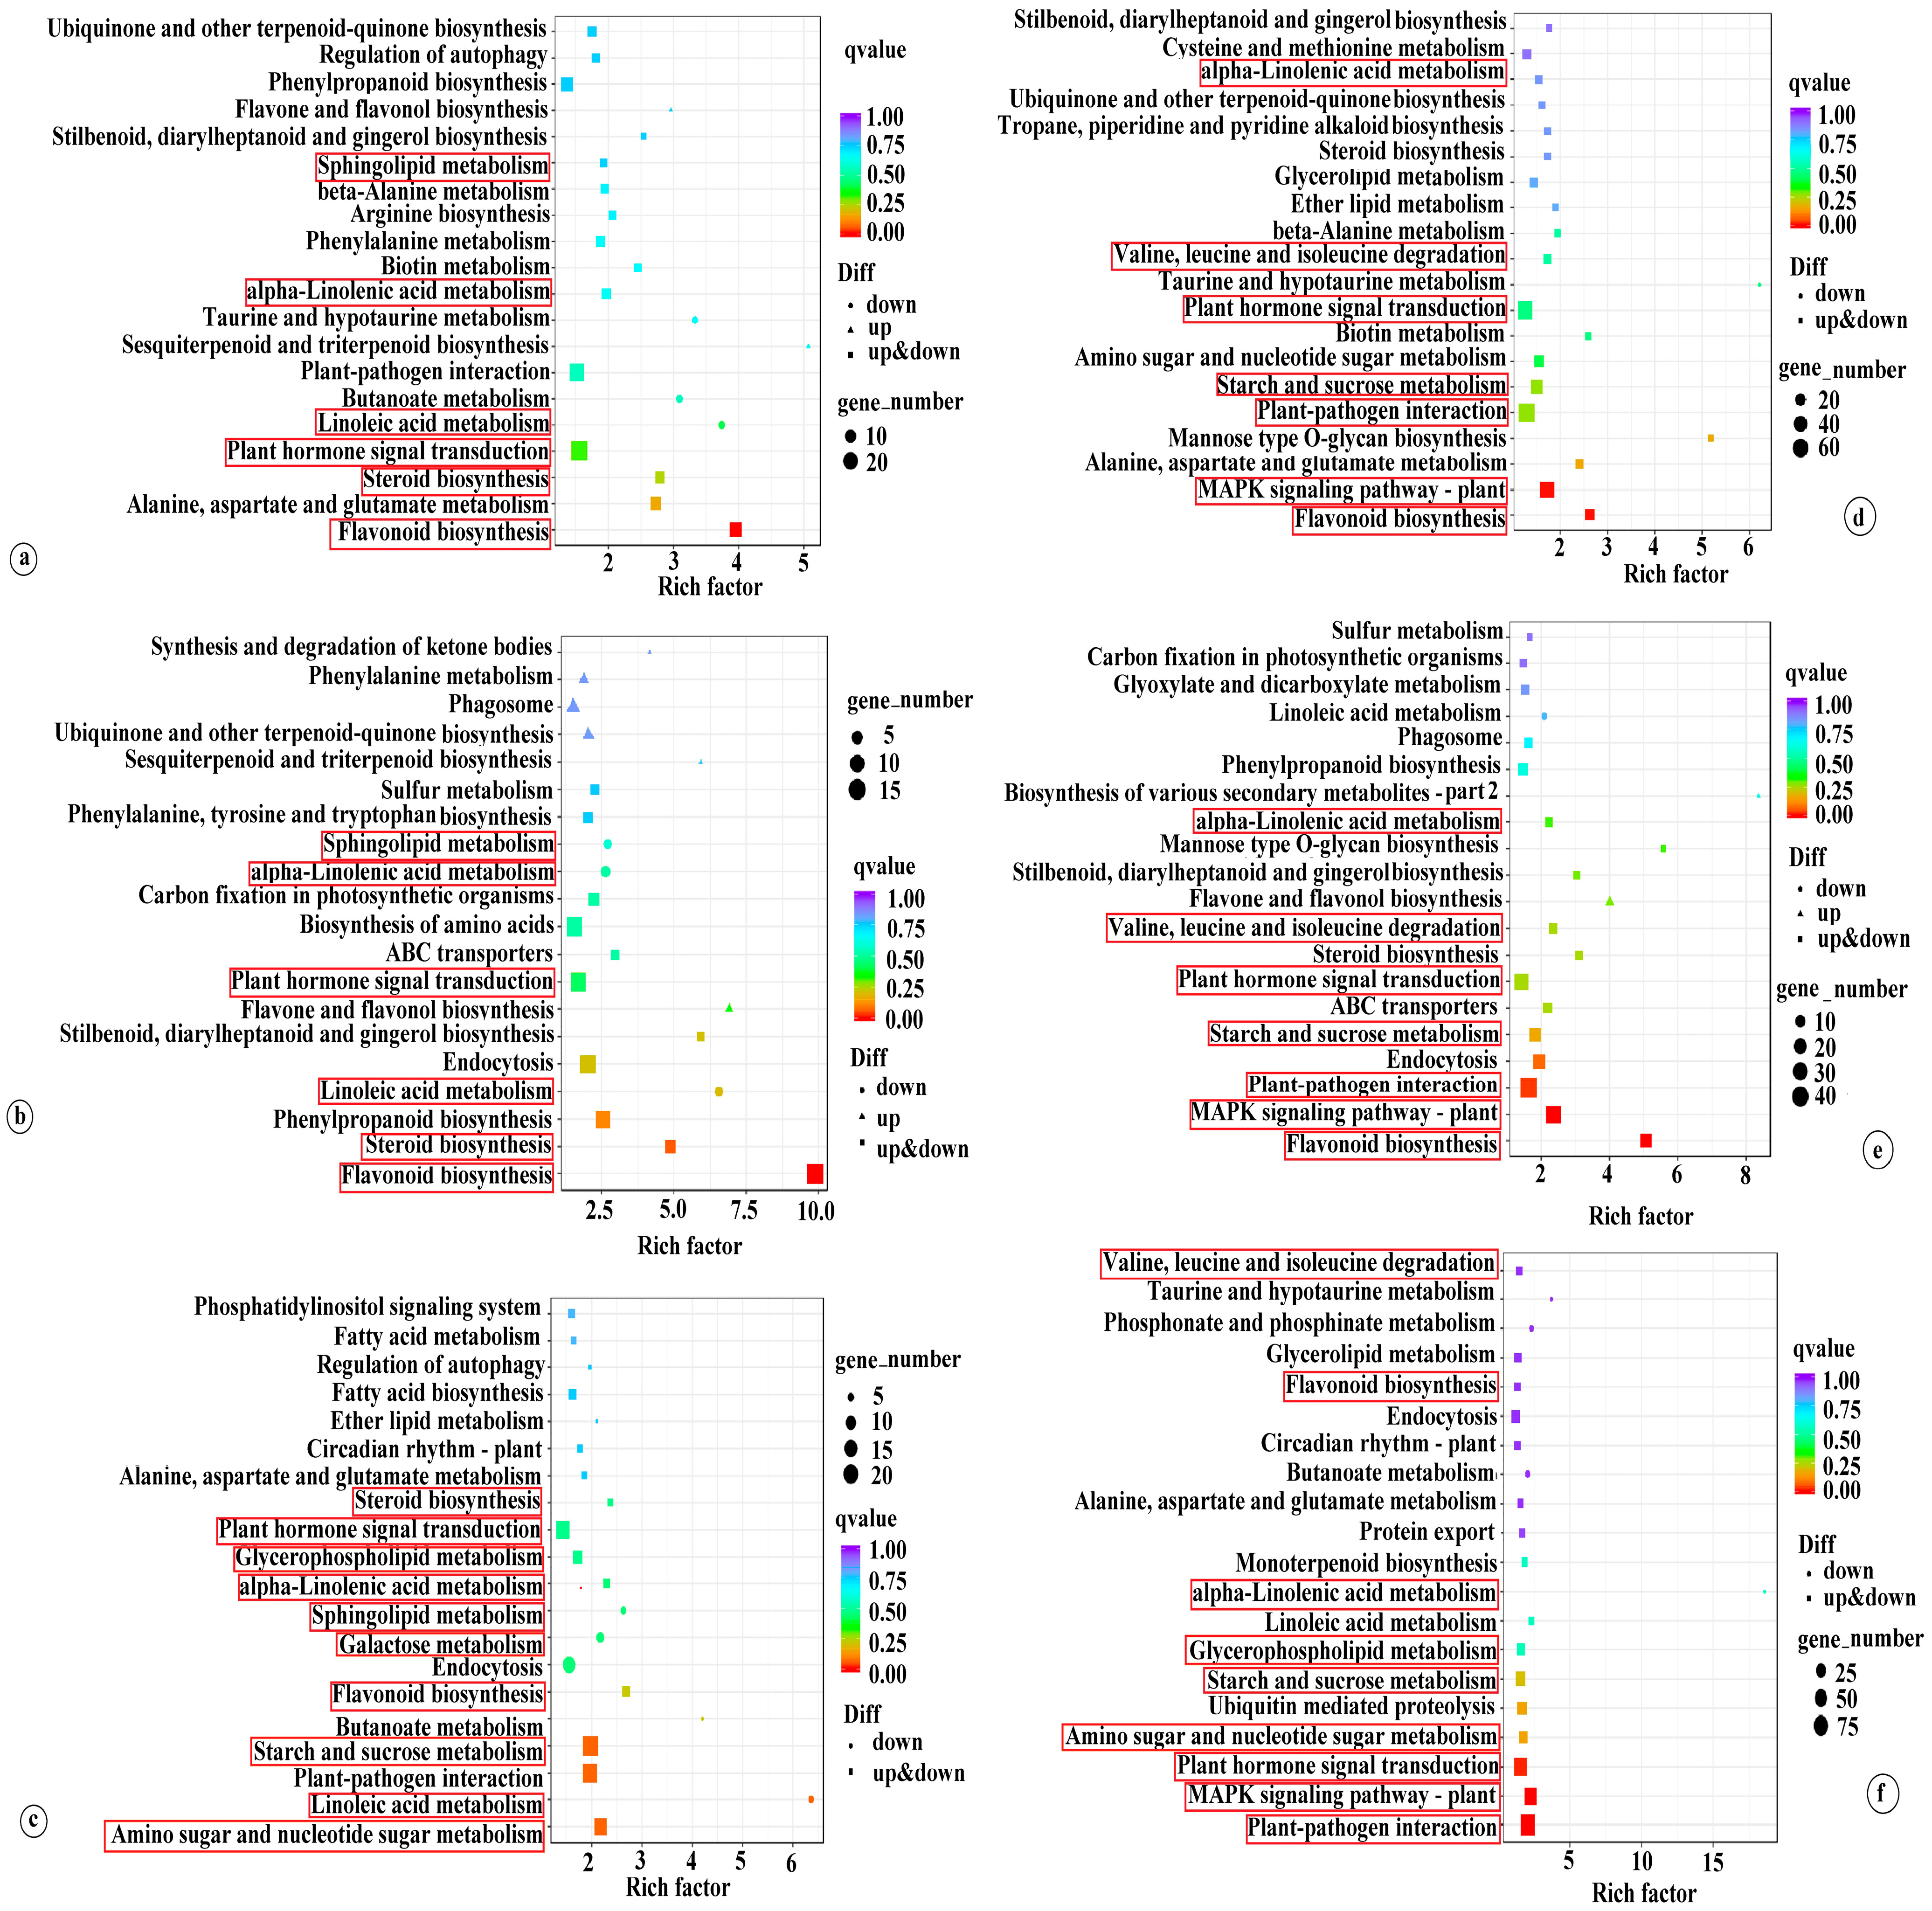
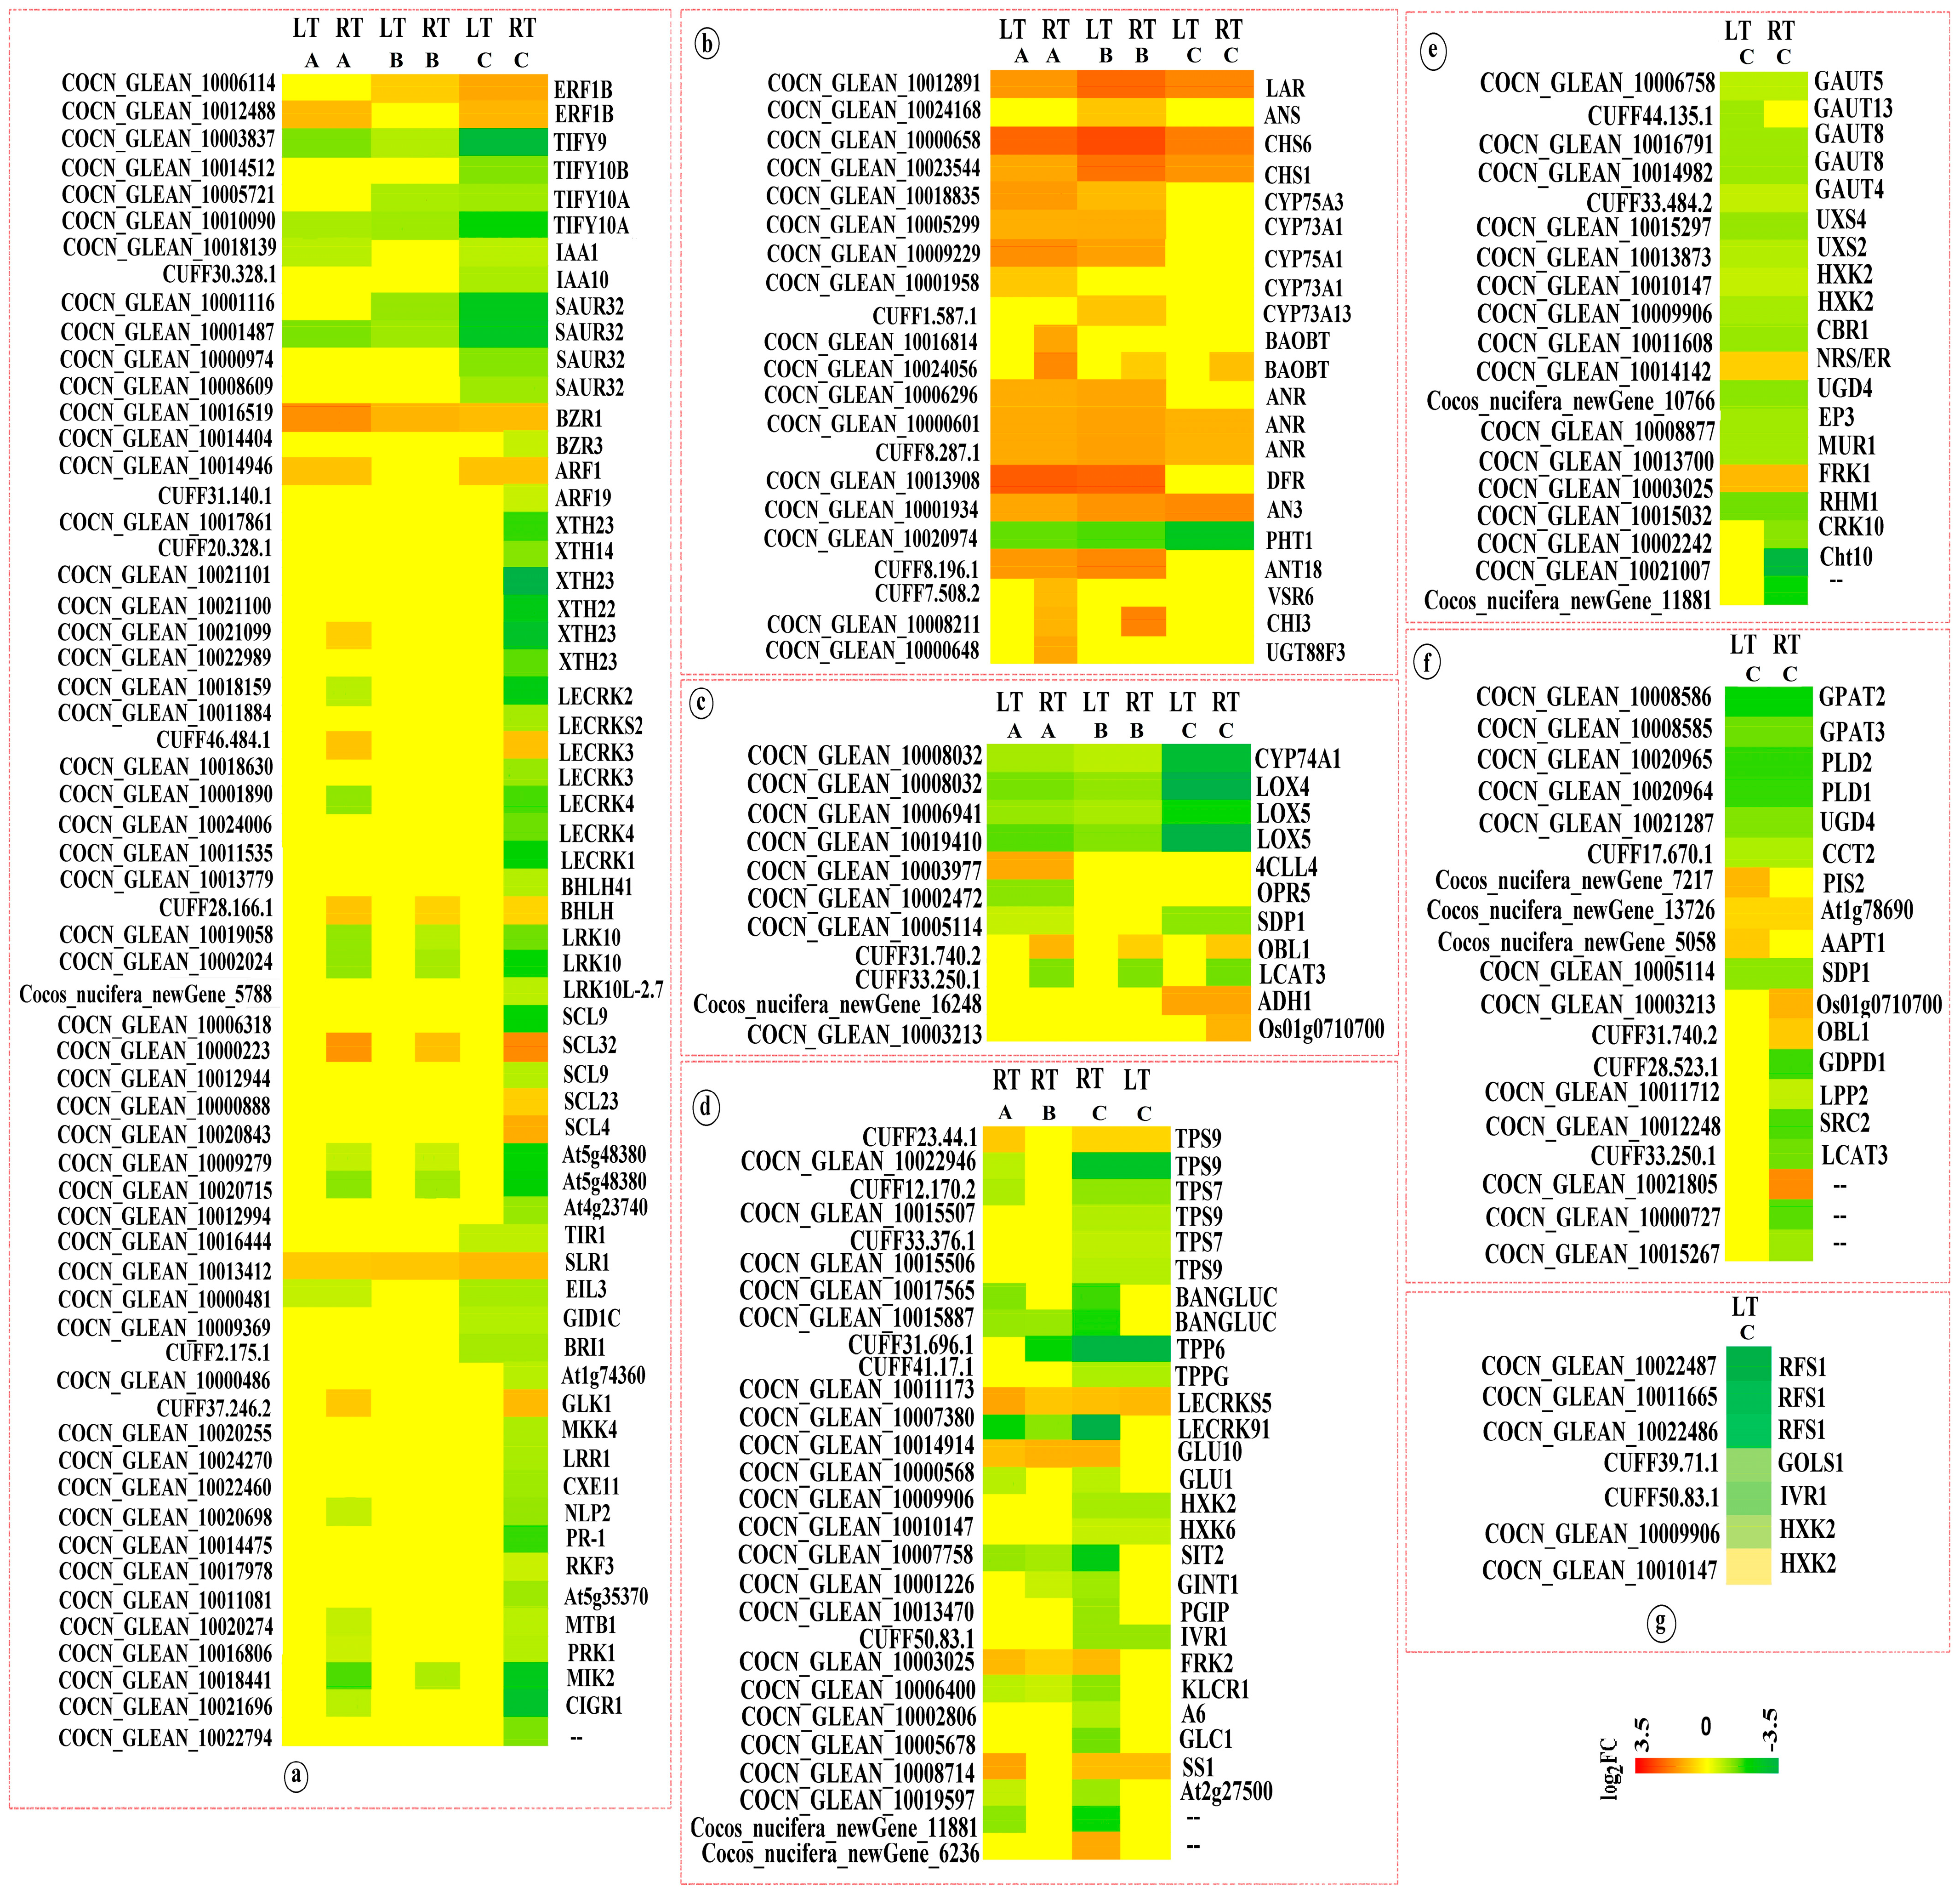
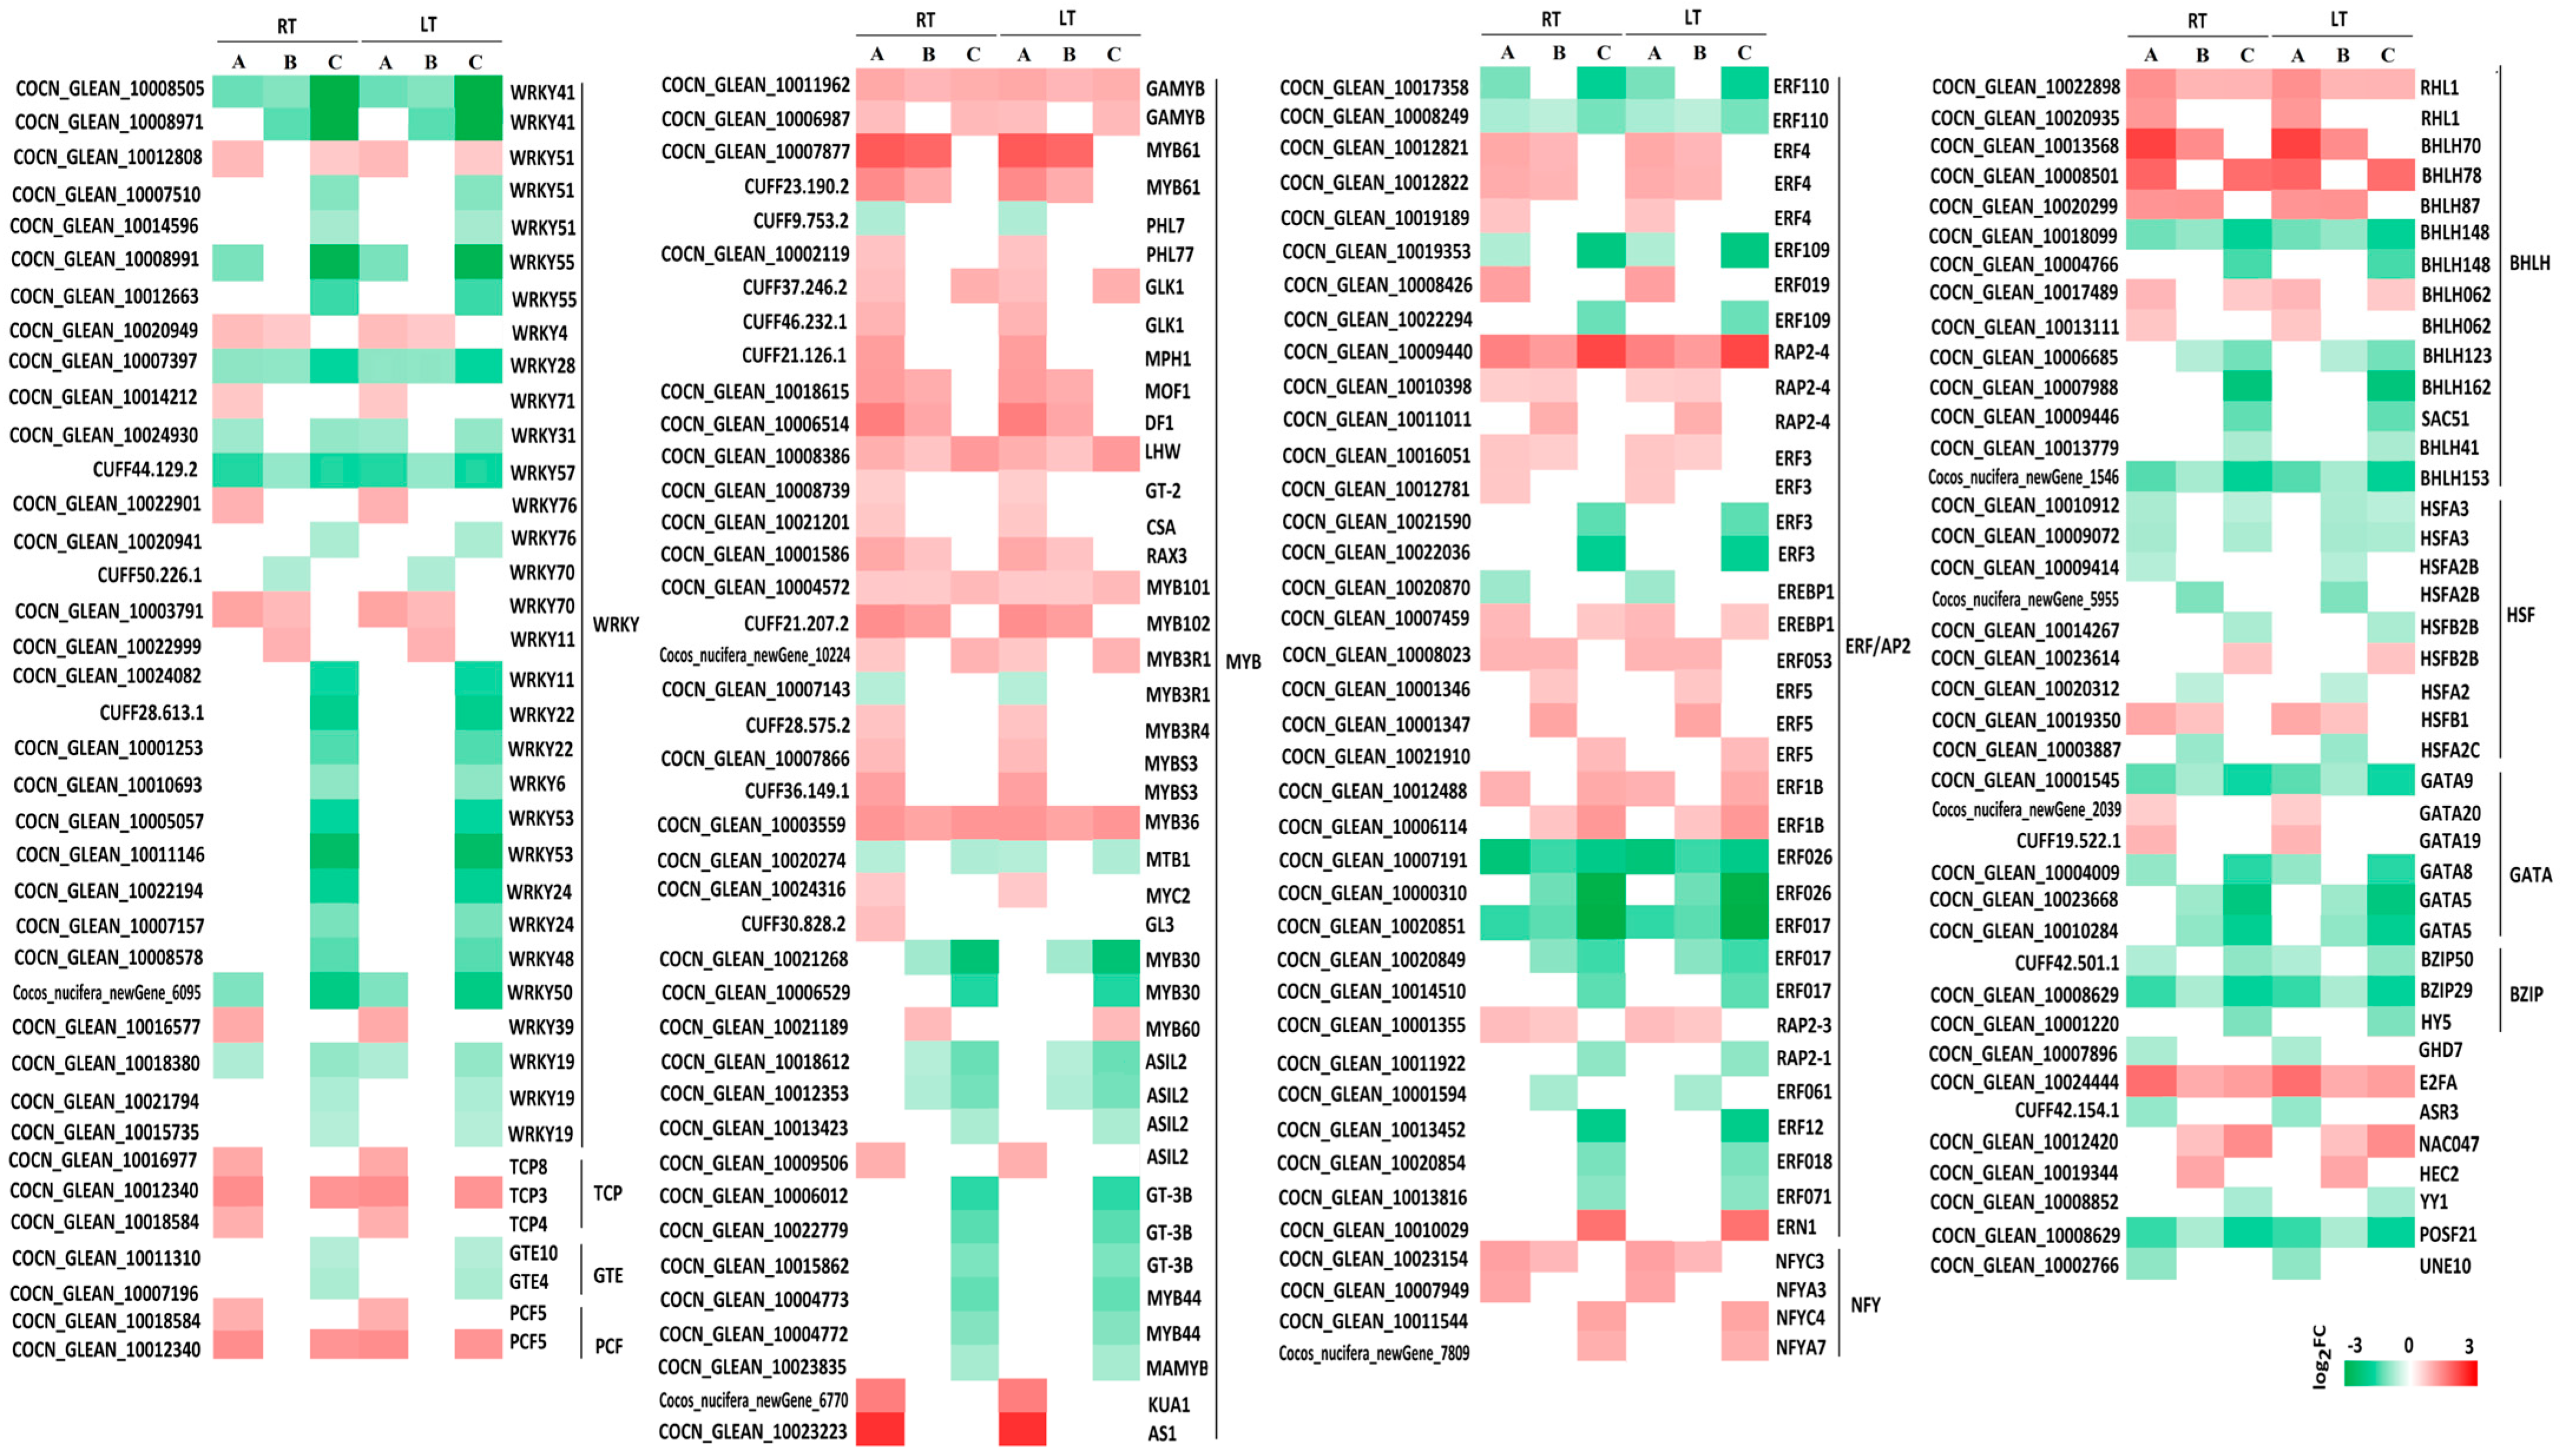


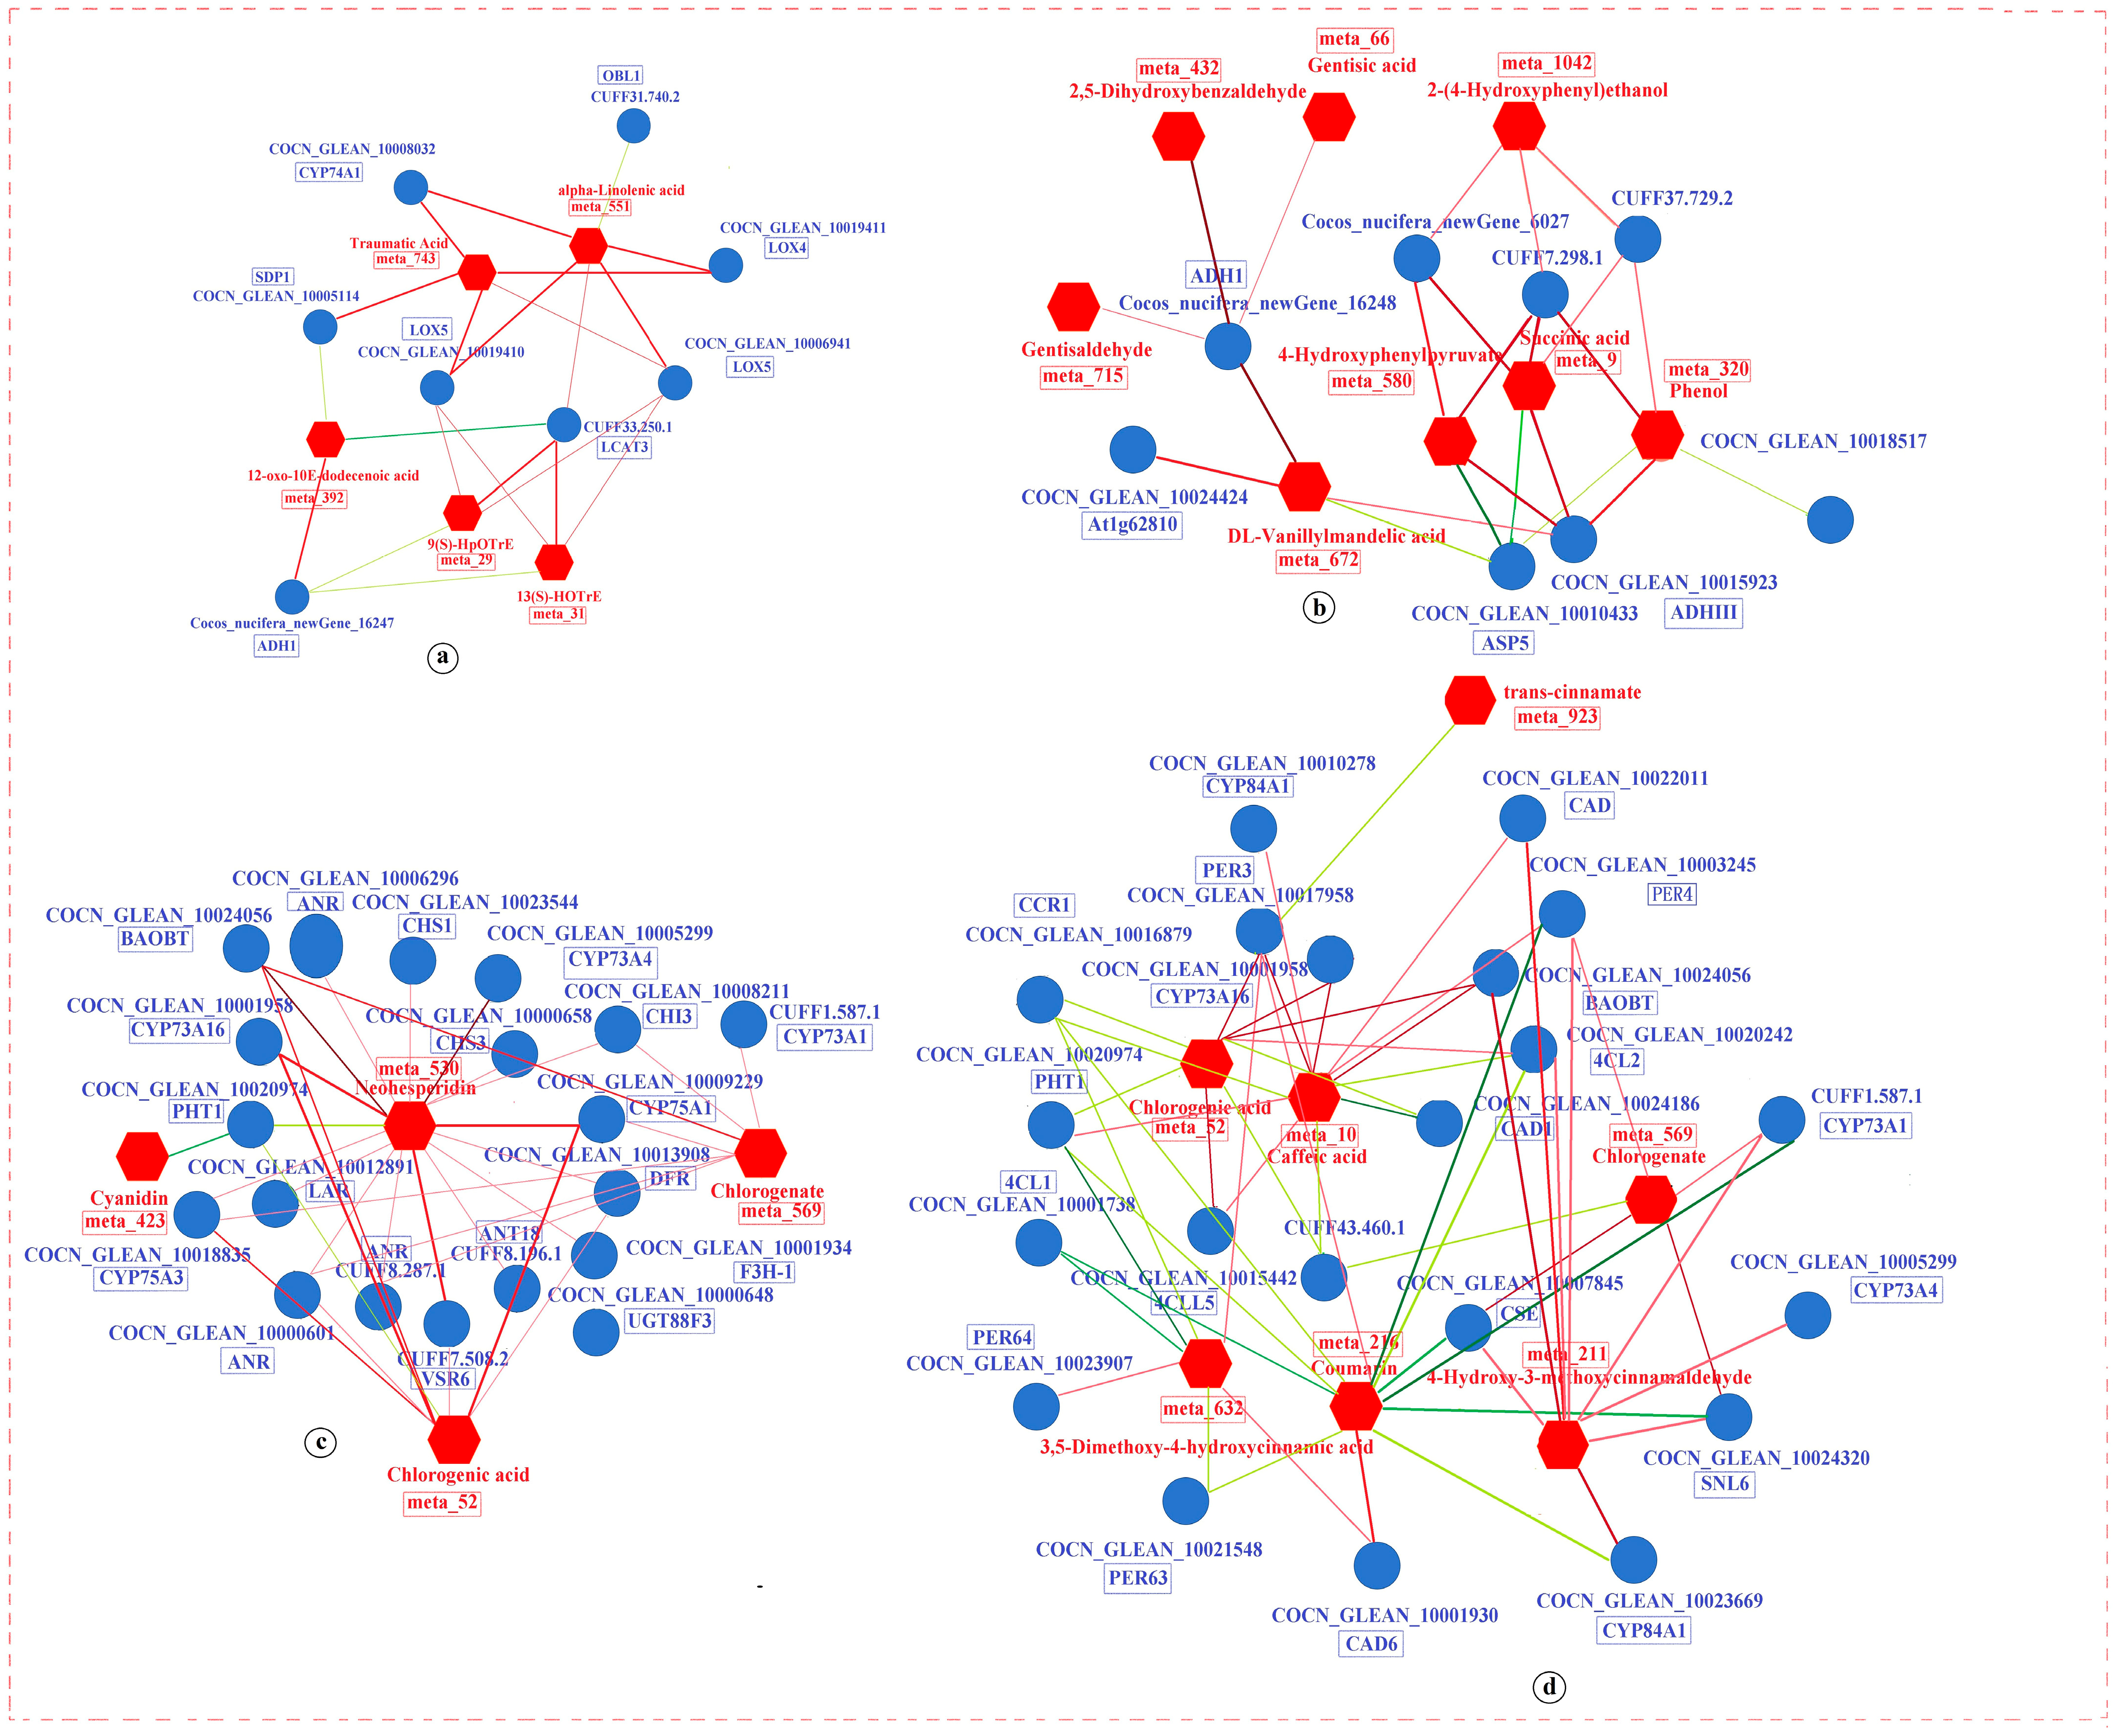

Disclaimer/Publisher’s Note: The statements, opinions and data contained in all publications are solely those of the individual author(s) and contributor(s) and not of MDPI and/or the editor(s). MDPI and/or the editor(s) disclaim responsibility for any injury to people or property resulting from any ideas, methods, instructions or products referred to in the content. |
© 2024 by the authors. Licensee MDPI, Basel, Switzerland. This article is an open access article distributed under the terms and conditions of the Creative Commons Attribution (CC BY) license (https://creativecommons.org/licenses/by/4.0/).