Article

The Sources of Nutrients for the Growing Ear of Winter Wheat in the Critical Cereal Window

by
Witold Grzebisz
1,*,
Witold Szczepaniak
1,
Katarzyna Przygocka-Cyna
1,
Maria Biber
1 and
Tomasz Spiżewski
2
1
Department of Agricultural Chemistry and Environmental Biogeochemistry, Poznan University of Life Sciences, Wojska Polskiego 28, 60-637 Poznan, Poland
2
Department of Vegetable Crops, Poznan University of Life Sciences, Wojska Polskiego 28, 60-637 Poznan, Poland
*
Author to whom correspondence should be addressed.
Agronomy 2024, 14(12), 3018; https://doi.org/10.3390/agronomy14123018
Submission received: 25 October 2024 / Revised: 6 December 2024 / Accepted: 17 December 2024 / Published: 18 December 2024
(This article belongs to the Section Soil and Plant Nutrition)

Abstract

:
The process of winter bread wheat (WW) nutrient management in the Critical Cereal Window (CCW) has a decisive impact on yield component formation and, consequently, the grain yield (GY) and grain protein content (GPC). This hypothesis was verified in a single-factor field experiment carried out in the 2013/2014, 2014/2015, and 2015/2016 seasons. It consisted of seven nitrogen-fertilized variants: 0, 40, 80, 120, 160, 200, and 240 kg N ha−1. The mass of nutrients in ears was determined in the full flowering stage. The mass balance of nutrients (N, P, K, Mg, Ca, Fe, Mn, Zn, and Cu) was determined in leaves and stems. These sets of data were first used to calculate the soil nutrient uptake and then to predict the GY and GPC. Three nutrients, i.e., N, Ca, and Mg, were the main predictors of ear biomass. The set of ear nutrients significantly predicting GY and GE consisted of Ca, P, and Zn. Overall, this indirectly indicates a balanced N status for the ear. A positive nutrient balance in leaves, indicating their remobilization, was found for N, P, Fe, Zn, and Cu. Negative values, indicating a net nutrient accumulation in the non-ear organs of WW, were found for the remaining nutrients. The greatest impact on the GY and its components was observed for the balance of Mg and P but not N. The predictive worth of the nutrient balance for stems was much lower. The GPC, regardless of the type of indicator, depended solely on the N balance. Meanwhile, the main nutrient sources of N and Fe in ears were leaves and stems due to their uptake from the soil. For Cu, the primary source was soil, completed by its remobilization from leaves. For the remaining nutrients examined, the key source for the ear was soil, which was completed by remobilization from leaves and stems. Mg and Ca differed from other nutrients because their source for ears was exclusively soil. They were invested by WW in the ears and non-ear organs, mainly in the stems. The effective use of the yield potential of WW and other cereals requires insight into the nutritional status of the canopy at the beginning of the booting stage. This knowledge is necessary to develop an effective N management strategy and to correct and possibly apply fertilizers to improve both the yield and the GPC.

1. Introduction

The world’s total wheat grain production in the 2022/2023 season was 789 million tons, but the target production for 2050 is 840 million tons [1,2]. Therefore, the required annual average increase would have to be 1.96%, but from 2014 to 2023, it was only 0.76% [1]. Overall, the progress in wheat yield due to breeding is slow at less than 1% per year, but it should be 2.4% [3]. The commonly proposed solution of increasing the area of arable soils suitable for wheat is extremely difficult, if not impossible, to implement. Wheat, especially bread wheat, is a crop with very high requirements regarding soil fertility and agronomic conditions. Soils suitable for wheat are already occupied by this crop [4]. Therefore, the potential yield gap will only be covered by increasing the efficiency of the nitrogen fertilizer (Nf) applied [5].
It is generally accepted that the number of grains per m2 (the canopy grain density) of wheat is closely related to the number of fertile florets (NFFs) at the beginning of flowering [6,7]. This decisive trait, which determines grain yield formation, has a specific development cycle. The potential number of inflorescence primordia appears in the double ridge stage. Their death occurs when the juvenile ear grows rapidly [8,9]. Further, fully fertile florets during cereal plant flowering are those that have acquired the ability to be fertilized and thus achieve the potential to produce grains. The condition for the potential fertility of floret primordia is to obtain meiotic capacity at the beginning of the booting phase, and floret primordia that have not achieved this status are subject to abortion [10]. An intensive reduction in floret primordia begins after 20–30 days, reaching the critical stage 6–20 days before flowering [11]. The spectrum of factors, apart from developmental ones, determining the survival of primordia florets during this period is wide. The decisive factor is the availability of assimilates for the growing ear in its juvenile growth stage [12]. The driving nutrient in this process is N, which determines the production of assimilates (CO2 fixation) and thus affects the number of fertile florets in the ear [10,11]. As stated by Zhao et al. [13], the mechanisms responsible for N accumulation in the ear are not well understood. Therefore, the beginning of the booting phase can be considered the beginning of the Critical Cereal Window (CCW). This period lasts until the full flowering of the cereal plant [14].
Ear biomass is considered a physiological sink for N, which has a decisive impact on the formation of fertile florets [15]. Their number in a wheat ear in the flowering phase strongly depends on the supply of assimilates from the beginning of the booting phase. For these reasons, the pre-flowering N status depends on the farmer’s N-control-oriented activities [13,16]. Ears in the canopy of winter wheat should reach the same stage of development at the beginning of flowering. This condition of the wheat canopy is ensured by the morphological uniformity of ears (equal stem length), which determines the uniformity of the grain size and protein content [17,18,19,20]. This condition, as shown in Figure 1, is difficult for the farmer to achieve. In the CCW, the period of ear development, regardless of the stage at the beginning of the heading, is shortened to two days for spikelet initiation and six hours for the growth of floret primordia. Therefore, the probability of survival of weakly developed florets in a tertiary or quaternary ear-bearing shoot is low, and the size of floret primordia and spikelets is reduced [21].
Non-ear organs of the wheat tiller, such as leaves and stems, can potentially compete with the intensively growing ear for assimilates in the CCW. Strong internal competition has been recognized between the still-growing stem and developing spikelets [22]. However, the impact of non-ear organs on NFFs is poorly understood [10]. The ear plays a complex role in N supply to the growing grains. It largely serves as a buffer/transit organ for N compounds. The resources and efficiency of N remobilization from the ear under conditions of optimal water and N supply are lower than from leaves and reach 56% and 75%, respectively [23,24]. At the same time, the ear-forming role of nutrient-supporting N action in the plant is a black box.
The greatest dynamics of N accumulation by wheat occur in the stem elongation phase (BBCH 30─BBCH 39). The amount of nutrients accumulated in this period has a significant impact on grain yield [25,26]. Two questions should be asked here: (i) How much N, as well as the nutrients that support its effectiveness, is taken up in the CCW? (ii) What is the distribution of these nutrients between the vegetative organs of winter wheat (leaves, stem) and the intensively growing ear?
So far, the sources of nutrients in winter wheat ears during the Critical Cereal Window have not been identified. This conclusion also applies to other cereals. Their source for the growing ear may be remobilization from the vegetative parts of the plant and/or direct uptake from the soil. At the same time, the potential competition between the growing ear and the still-growing leaves and the stem cannot be ignored. In the present state of knowledge, several questions arise regarding managing nutrients in winter wheat from the beginning of booting to full flowering, i.e., within the CCW. They are as follows:
  • Does ear biomass depend solely on N supply?
  • What are the sources of nutrients for the growing ear?
  • Which source has the greatest effect on the N mass in the ear?
  • Are the vegetative organs of winter wheat an effective sink for nutrients?
  • Under what conditions does this phenomenon manifest itself?
The substantive essence of this article is to obtain answers to questions about the sources—the origin of nutrients—determining the growth of the ear of a cereal plant. So far, there are no such answers. However, the hypothesis is as follows: the processes of nutrient management by winter bread wheat (WW) in the Critical Cereal Window (CCW) are decisive for yield component formation and, consequently, grain yield (GY) and grain protein content (GPC). The key objective of the study was to determine the sources of nutrients and their source structure in the developing ears in a winter wheat canopy during the Critical Cereal Window. Furthermore, an important objective was to predict the yield and the grain protein content based on the amount and balance of nutrients in the ear in the Critical Cereal Window.

2. Materials and Methods

2.1. Experimental Site

A study on the mass and sources of nutrients in winter wheat ears and relationships with grain yield, its components, and grain protein content was conducted in the 2013/2014, 2014/2015, and 2015/2016 seasons in Smolice (52°42′ N; 17°10′ E), Poland. The field experiment was conducted on fertile soil formed from loamy sand over loamy sand, classified as Albic Luvisol. The organic carbon (Corg) content and pH values were variable in subsequent growing seasons. The content of available nutrients, measured before applying fertilizers, was, except for Ca, very good for the tested crop. The amount of N (Nmin), measured just before the spring regrowth of winter wheat in the 0.0–0.6 m soil layer, was generally high or very high (Table 1).
The local climate in the study area, classified as intermediate between Atlantic and Continental, is seasonal, but the latter dominates in the summer months. The early vegetation phase of winter wheat in spring 2014 was very good; however, May was wet. The second part of the season was less favorable, as June was very dry, and July was dry. The 2015 growing season was dominated by mild dry conditions, prevailing throughout spring vegetation. The beginning of the 2016 growing season was wet, May was semi-dry, and June was dry. Subsequently, most of the wheat grain filling period was wet (Figure 2).

2.2. Experimental Design

The data used in this study were based on a one-factor field experiment replicated four times, including a control N plot and six plots with increasing doses of N fertilizer: 40, 80, 120, 160, 200, and 240 kg ha−1. The total area of a single plot was 22.5 m2 (1.5 × 15 m). The winter wheat cv. Wydma was sown annually after winter oilseed rape in the fourth week of September at 300 grain m−2. The crop was harvested the following year at the end of July from an area of 19.5 m−2. Nitrogen was applied in the form of ammonia nitrate (34:0:0) in line with the following experimental schedule:
(1)
The first N doses of 40 and 80 kg N ha−1 were applied at the end of winter, just before the spring beginning of winter wheat vegetation.
(2)
The N dose was supplemented to 160 kg N ha−1 at the end of tillering/the beginning of shoot elongation (BBCH 29/30).
(3)
The N dose was supplemented to 240 kg N ha−1 when the flag leaf became visible (BBCH 39).
Nitrogen fertilizer was applied to the top dressing using a fertilizer spreader. Phosphorus was applied at a rate of 17.2 kg P ha−1 in the form of triple superphosphate (46% P2O5) and potassium at a rate of 100 kg K ha−1 as Korn-Kali (K-MgO-Na2O-SO3 → 40-6-3-12.5). Both fertilizers were applied to the soil two weeks before wheat sowing. Plant protection was conducted in accordance with the principles of the Code of Good Practice.

2.3. Plant Sampling

The plant material used to determine dry matter and nutrient content in the ears of winter wheat was collected at the full flowering stage (BBCH 65). The N content was determined in plant material using the standard macro Kjeldahl method [31]. For mineral nutrients, the collected plant sample was dried at 65 °C and then mineralized at 550 °C. The obtained ash was dissolved in 33% HNO3. The P concentration was measured using the vanadium–molybdenum method with a Specord 2XX/40 (Analytik Jena, Jena, Germany) at a wavelength of 436 nm. The concentrations of K, Mg, Ca, Fe, Mn, Zn, and Cu were determined using flame-type atomic absorption spectrometry. The results were expressed on a dry matter basis. The mass of the nutrients in winter wheat ears was calculated based on the ear biomass and the content of a given nutrient.

2.4. Calculation of Nutrient Balance During the Critical Cereal Window

The balance of nutrients, including N, P, K, Mg, Ca, Fe, Mn, Zn, and Cu, was prepared based on data on the mass of nutrients in the leaves and stems of winter wheat at the BBCH 40 and BBCH 65 stages. Primary data for these characteristics are included and discussed in the article by Grzebisz and Biber [32]. The balance equations for the tested nutrients are as follows:
N u B i = N u a 40 N u a 65 ,          k g ,   g   h a 1
where the following apply:
NuBi—the balance of a given nutrient;
Nua40—the amount of a nutrient in leaves or stems at the BBCH 40 stage, kg, g ha−1;
Nua65—the amount of a nutrient in leaves or stems at the BBCH 65 stage, kg, g ha−1.
Positive balance values for the given nutrient indicate its net remobilization from leaves or stems. A negative value indicates a net accumulation of the given nutrient in the vegetative organs of winter wheat in the CCW.
The uptake of nutrients (Nus) by wheat from the soil in the CCW was calculated as the difference between the amount of the nutrient in the ear and its balance in vegetative parts of the crop canopy. The equation used for the calculations is as follows:
N u s i = N u E A R i N u B L E i + N u B S T i ,           k g ,   g   h a 1
where
Nui—a given nutrient;
NuEARi—the nutrient mass in the ears, kg, g ha−1;
NuBLei—the balance of a given nutrient in leaves in the CCW, kg, g ha−1;
NuBSTi—the balance of a given nutrient in stems in the CCW, kg, g ha−1.

2.5. Statistical Analysis

The effect of experimental factors (the year and N doses) and their interactions with the nutrient mass in ears, nutrient balance, and soil nutrient uptake during CCW were assessed using a two-way ANOVA (years, Y and N doses, and Nf). Means were separated via honest significant difference (HSD) using Tukey’s method when the F-test indicated significant factorial effects at p < 0.05. The relationships between the traits were analyzed using Pearson correlation and linear regression. STATISTICA 12 software was used for all statistical analyses (StatSoft Inc., Tulsa, OK, USA, 2013). In the second step of the diagnostic procedure, stepwise regression was applied to define an optimal set of nutrients for the tested wheat traits (grain yield, grain protein content, grain protein yield, and yield components). In the computational procedure, a consecutive variable was removed from the multiple linear regressions step by step. The best regression model was chosen based on the highest F-value.

3. Results

3.1. The Mass of Nutrients in the Ears in the Full Flowering Phase

The mass of nutrients accumulated in winter wheat ears in the full flowering phase (BBCG 65) responded significantly to the applied Nf doses. At the same time, it showed considerable variability in subsequent growing seasons. However, there was no response to the interaction of both factors (Table 2). The mass of nutrients, except for potassium (K), was much higher in the 2016 growing season. The largest difference compared to 2015 was recorded for magnesium (Mg) and manganese (Mn). They were 3.6-fold and 2.9-fold higher, respectively, in favor of 2016. Approximately 2-fold differences were noted for phosphorus (P), iron (Fe), zinc (Zn), and copper (Cu). In the case of K, its mass in 2015 was significantly lower compared to other years.
The trends of nutrient mass in ears in response to increasing doses of nitrogen fertilizers (Nf) were the same for all macronutrients examined. In general, the mass of a given nutrient increased to an Nf of 160 kg N ha−1, then stabilized, as was found for Mg and Ca, or decreased slightly, as noted for N, K, and P. The trends found fit the quadratic regression model quite well. The optimal Nf dose for the maximum mass was 176, 175, 185, 194, and 195 kg ha−1 for N, K, P, Mg, and Ca, respectively (Figure S1). The same pattern was found for micronutrients, with a stabilization trend observed for Fe, Mn, and Zn, as well as a significant decline for Cu. The optimal Nf dose was 212, 228, 203, and 161 kg ha−1, respectively (Figure S2). The significant difference in the progressive accumulation of N and K is worth noting, which increased and gradually expanded to an Nf of 175 kg N ha−1. Furthermore, the trends of Mn and Zn accumulation were almost analogous.
The basic set of nutrients determining ear biomass (EAB) consisted of N, Mg, and Ca, responsible for 98% of its variability (Table A1). The first two nutrients had a positive sign, indicating a deficiency, and Ca had a negative sign, indicating an excess. It should be emphasized that N and Ca were strongly and positively correlated with each other (r = 0.93***) and slightly weakly with Mg (r = 0.70***). A strong correlation also occurred between N and Fe and Cu. Ca was significantly correlated with Fe and Cu (Table S1).
Similarly to EAB, the mass of nutrients in ears was used to predict the GY of winter wheat and its components (Table A1). The predictive nutrient set mainly consisted of Ca. It was present in six, including EAB, of the eight wheat traits examined. The effect of Ca on these traits (GY, GPY, GE, CGD, and TGW) was always positive. In the case of TGW, Ca was the only predictor, but the level of prediction was moderate. In the obtained algorithms, Ca was often accompanied by Mn, P, and N. The reliability of GY and CGD prediction was very high, and for GPY and GE, it was high. In the basic set of indicatory nutrients, next to Ca, the most common was P. It was significantly correlated with all nutrients, including an extremely strong relationship with Mg and Fe (r = 0.95***) (Table S1). Moreover, these three of the eight algorithms contained Zn (GY and GPY) and Mn (GE), which performed positively. These two micronutrients were strongly correlated with each other (r = 0.92***). At the same time, no significant correlation of both nutrients with Ca was found. The set of nutrients for CGD prediction consisted of Ca and Zn, which were deficient, and Mg, which was in excess. A slightly different set of predictive nutrients was found for CED and included N and Zn, which were deficient, and Mg, which was in excess. The grain protein content (GPC) was determined using only the N mass, and a positive sign indicates its deficiency in the ears.

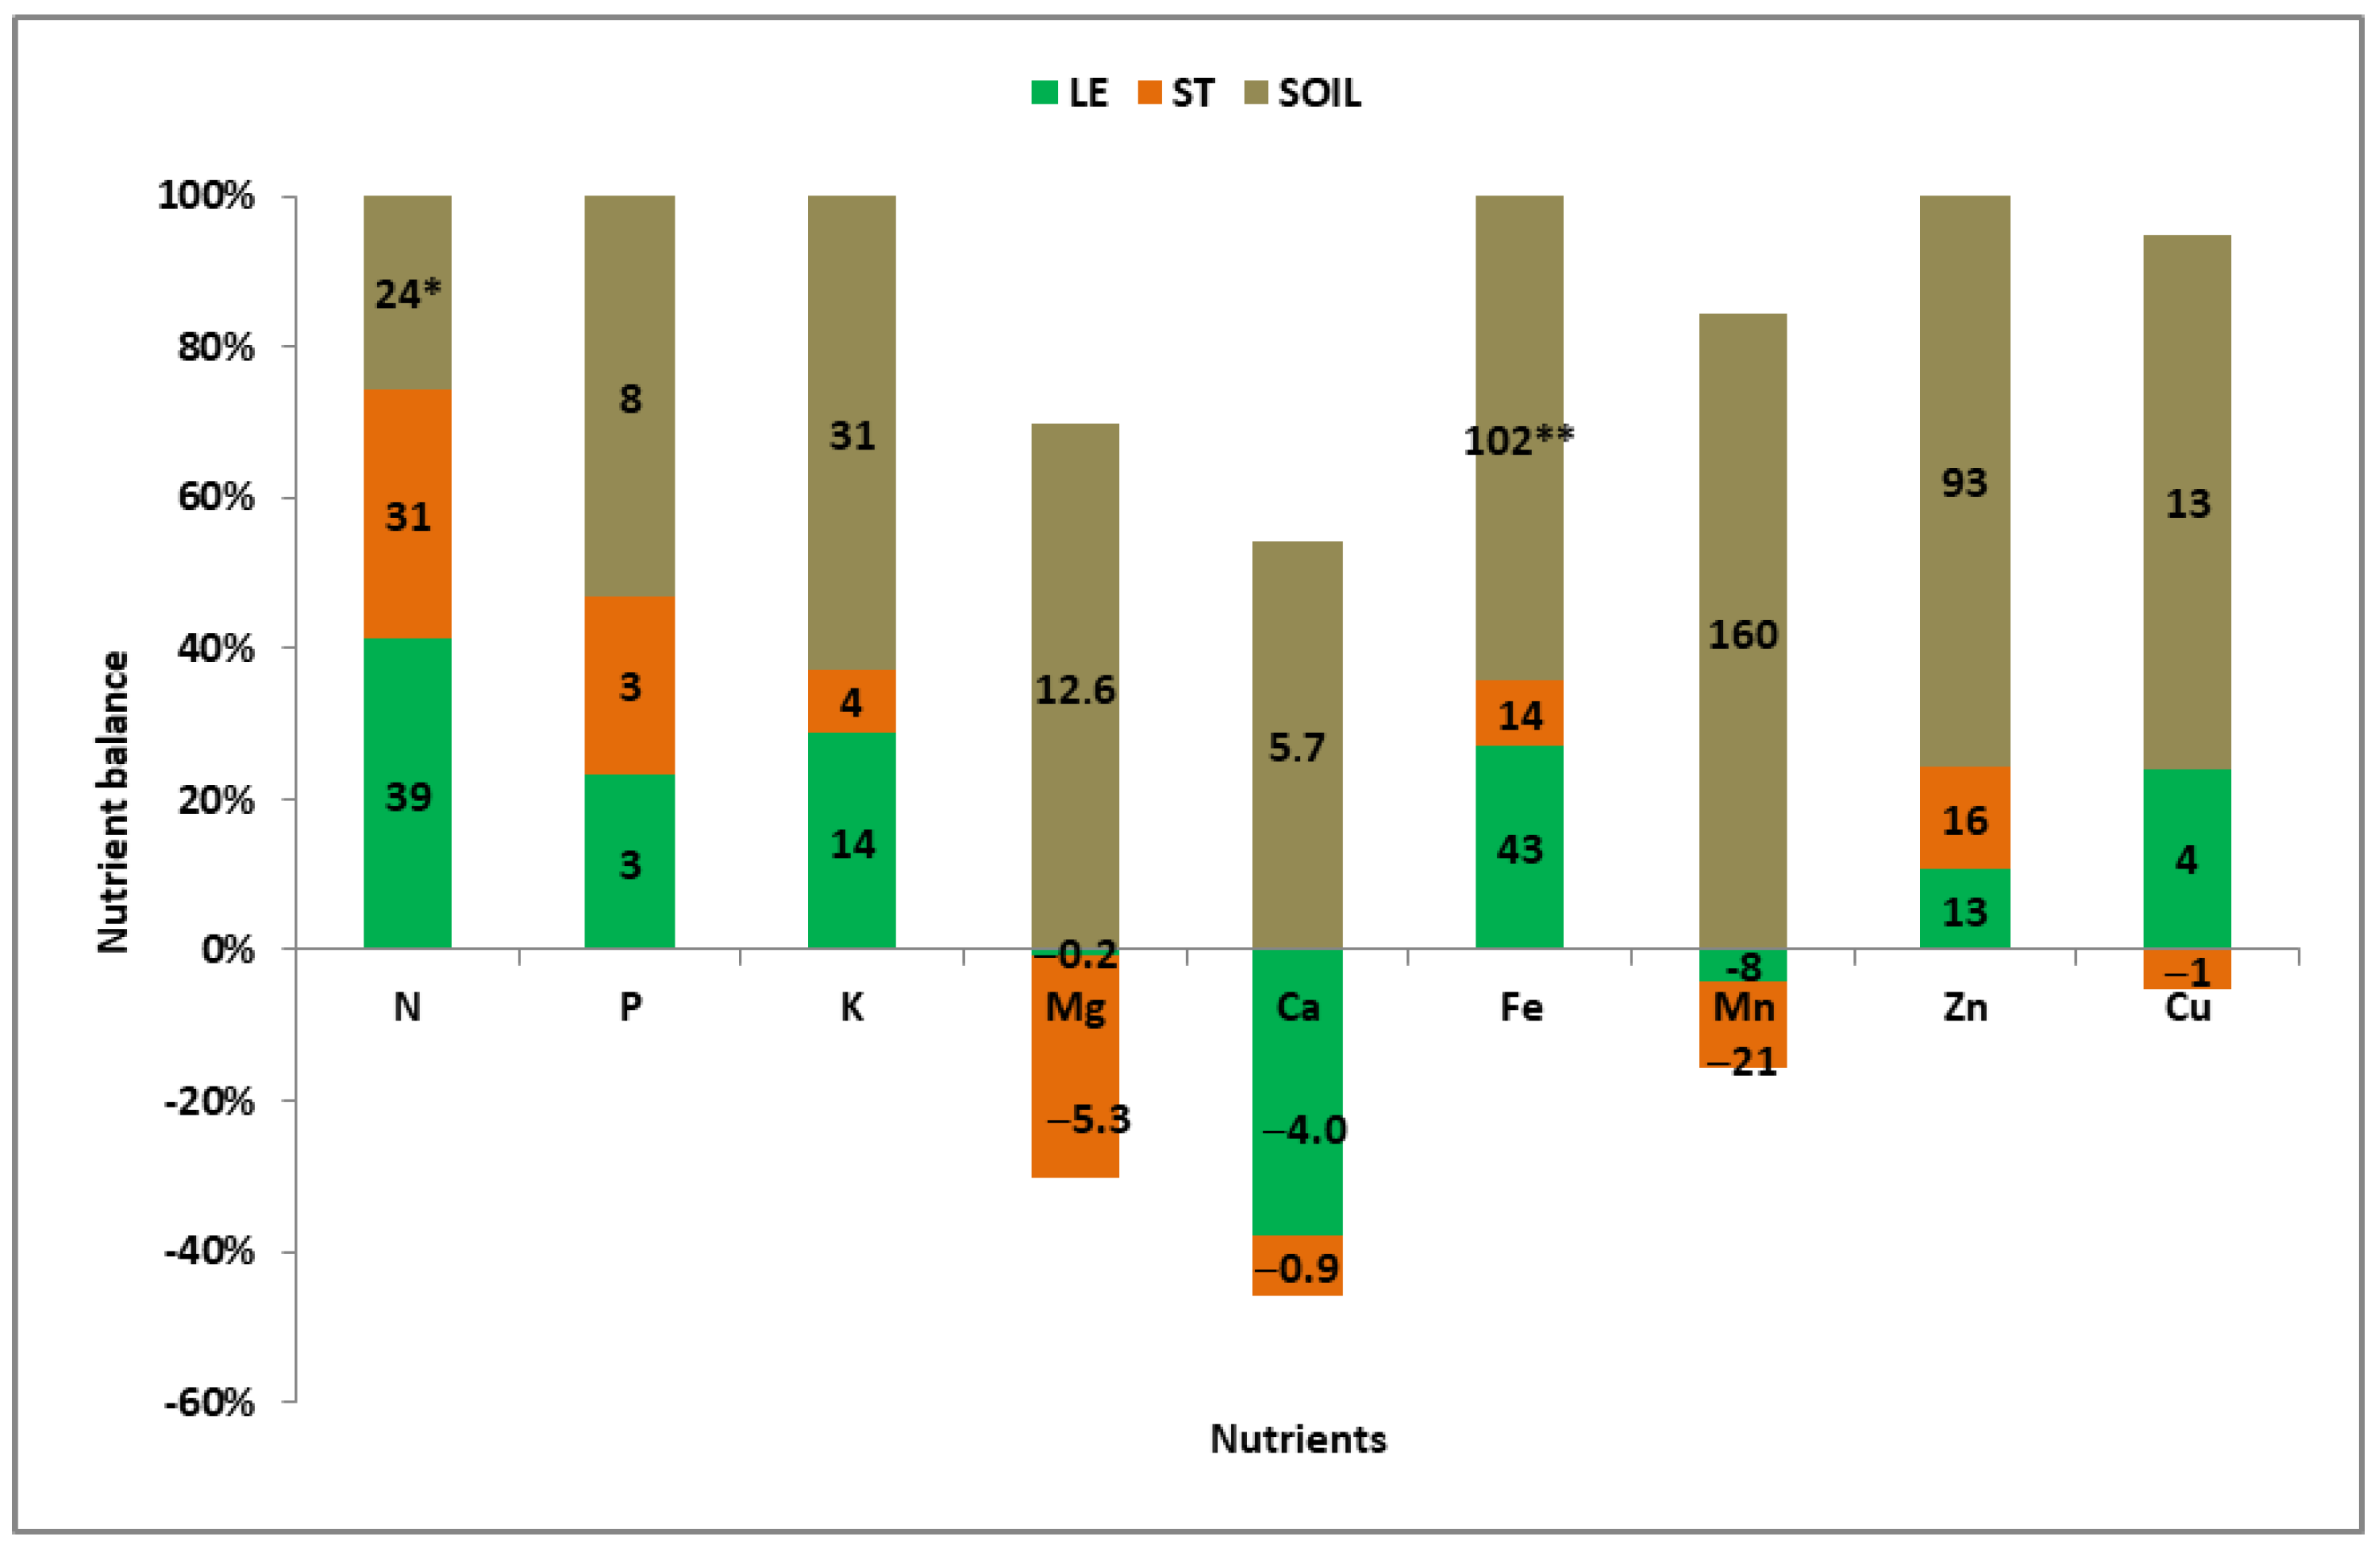
3.2. Nutrient Mass Balance in Leaves in the Critical Cereal Window

Nutrient remobilization from winter wheat leaves from BBCH 40 to BBCH 65 (CCW), occurring in all studied growing seasons, was recorded for N, P, Fe, Zn, and Cu (Table 3). The amount of remobilized N (N remobilized quota—NRQ) among this set of nutrients showed no significant response to either the year or Nf doses applied. In 2014, the amount of remobilized P was much greater compared to other seasons. The P remobilized quota (PRQ) was only significantly dependent on the weather. However, it had a large impact on the variability of many wheat yield traits (Table A2). The remobilization quota (RQ) for Fe and Cu responded significantly to the years and applied Nf doses but not to the interaction of both factors. At the same time, FeRQ increased in line with the applied Nf doses up to 160 kg N ha−1 and then stabilized on plots with the highest Nf doses. CuRQ was the lowest in 2015, 6-fold and 3.5-fold lower compared to 2016 and 2014. In response to Nf, CuRQ increased up to 120 kg N ha−1 and then decreased significantly.
Among the nutrients examined, the mass balance of Mg, Ca, and Zn showed a significant and specific response to the Y × N interaction (Table 3). The Mg balance depended significantly on the weather and was slightly modified by Nf doses (Figure S4). Net Mg accumulation in leaves was only recorded in 2015. Its balance in the CCW showed a strong response to Nf doses, consistent with the quadratic regression model. In 2014, no response of Mg balance to Nf doses was found. In 2016, Mg was remobilized from leaves, showing a moderate linear response to increasing Nf doses. The Ca balance showed the strongest response to the Y × N interaction (Figure S4). Net Ca accumulation in leaves was recorded in 2014 and 2015, but it only increased gradually with increasing Nf doses in 2015. In 2014, the highest net Ca accumulation in leaves was found. It amounted to 4.4 kg N ha−1 for Nfop of 125 kg N ha−1. In 2016, the Ca balance was positive, which indicated its remobilization from leaves. The trend followed the quadratic regression model. The cardinal values were 1.1 kg Ca ha−1 at Nf of 66 kg N ha−1. The trends of ZnRQ reached well-defined maxima and corresponding optima for Nf. In 2014, it amounted to 20.1 g Zn ha−1 and 101.5 kg N ha−1. In 2015, its maximum decreased to 9.7 g Zn ha−1 and was reached for an Nf of 94.5 kg N ha−1. In 2015, net Zn accumulation in wheat leaves was recorded in plots fertilized with 200 and 240 kg N ha−1. In 2016, ZnRQ increased with increasing Nf doses (Figure S5). In the case of K, its remobilization was recorded in 2014 and 2016, while net accumulation occurred in 2015. For Mn, its net accumulation in leaves was recorded in 2014 and 2015, and remobilization was recorded in 2016.
The ear biomass was significantly related to the micronutrient balance in wheat leaves. It was driven negatively by Fe and positively by Zn (Table A2). As indicated earlier, the nutrients that had the greatest impact on wheat yield characteristics were Mg and P. A stepwise regression analysis conducted for the entire set of wheat yield characteristics indicated the dominant role of Mg. It was crucial for determining GY, CPY, CED, GE, and CGD, while P was crucial for determining GY, CED, and CGD. The effect of Mg and P on the GY is shown in the equation below:
G Y = 6.53 + 0.83 P 0.82 M g   f o r   n = 21 ,   R 2 = 0.80 ,   p   0.001
In fact, net Mg accumulating in leaves, only under the condition of a simultaneous increase in P remobilization, had a positive effect on GY. The same phenomenon was revealed for other Mg-induced wheat traits. GPC only depended on N, but the relationship was positive but weak (R2 = 0.31) (Table A2). The Mg mass balance was significantly, positively, and strongly correlated with Ca (r = 0.95***), as well as with Zn, Cu, and Mn. At the same time, no significant correlation between Mg and N, P, and Fe was found. The PRQ showed strong positive relationships with K and Fe but moderate relationships with Zn and Cu. Fe was strongly correlated with P and other micronutrients but not with N and K and was negatively correlated with Mg and Ca (Table S2).

3.3. Nutrient Mass Balance in Stems in the Critical Cereal Window

The balance of nutrients examined in winter wheat stems in the CCW showed a significant response to the Y × N interaction (Table 4). The greatest impact on wheat yield characteristics was found for Mg and Cu. Mg balance significantly affected EAB and TGW (Table A2). Net Mg accumulation in stems was recorded in each growing season, and the highest was noted in 2016. Mg accumulation trends in response to increasing Nf doses were year-specific. In 2014, this trend was not significant due to high variability. In 2015, net Mg accumulation increased gradually with Nf doses. In 2016, the analyzed trend was consistent with the quadratic regression model. The maximum Mg balance of −10 kg Mg ha−1 was obtained for an Nf of 142 kg N ha−1 (Figure S6). The Mg balance was significantly but negatively correlated with Zn and Cu balances (Table S3).
Particular attention should be paid to the Cu mass balance, which significantly affected three basic yield characteristics: GY, GE, and GPC (Table A2). For the first two traits, it was the single predictor. Trends in Cu balance in response to increasing Nf doses were year-specific but consistent with the quadratic regression model (Figure S7). In 2014, the maximum Cu balance of −7.4 g Cu ha−1 was obtained for Nf of 104 kg N ha−1. In 2015, these cardinal values were 0.2 g Cu ha−1 and 86 kg N ha−1. In 2016, the corresponding cardinals were 9.1 g Cu ha−1 and 167 kg N ha−1. The Cu balance was significantly, positively, and strongly correlated with Zn (r = 0.88***) and N (r = 0.88 (Table S3).
Among the other nutrients, P is noteworthy, as, together with Mg, it significantly affected EAB. The biomass of ears increased with an increase in the PRQ and, at the same time, with an increased amount of Mg in stems (negative balance) (Table A2). The lowest P balance was recorded in 2015, when it was 6-fold lower compared to other seasons. The trend of PRQ in 2015 was consistent with the quadratic regression model. The maximum PRQ of 5 kg P ha−1 was obtained for an Nf of 118 kg N ha−1 (Figure S8). In 2014, the net P balance was recorded. Its trend increased gradually with increasing Nf doses. In 2016, the P balance was, on average, positive, but it showed exceptionally high variability in response to Nf doses. The PRQ was significantly, positively, and strongly correlated with K (r = 0.6***), followed by N, Ca, and Fe (Table S3).
The NRQ in the CCW was a significant predictor of GPC. Together with Zn, it increased, while Cu decreased GPC values (Table A2). The N balance was positive, although variable, in subsequent growing seasons. Its annual values decreased in the following order: 2016 > 2014 > 2015 (Table 4). The effect of increasing Nf doses on the tested wheat trait was year-specific. A significant response was found in 2014 and 2015. In 2014, it increased in line with Nf doses. The most pronounced trend was observed in 2015, when it was consistent with the quadratic regression model. The maximum NRQ of 23 kg N ha−1 was obtained for an Nf of 102 kg N ha−1 (Figure S9). Moreover, it was significantly, positively, and strongly correlated with P, K, Fe, and Cu (Table S3).

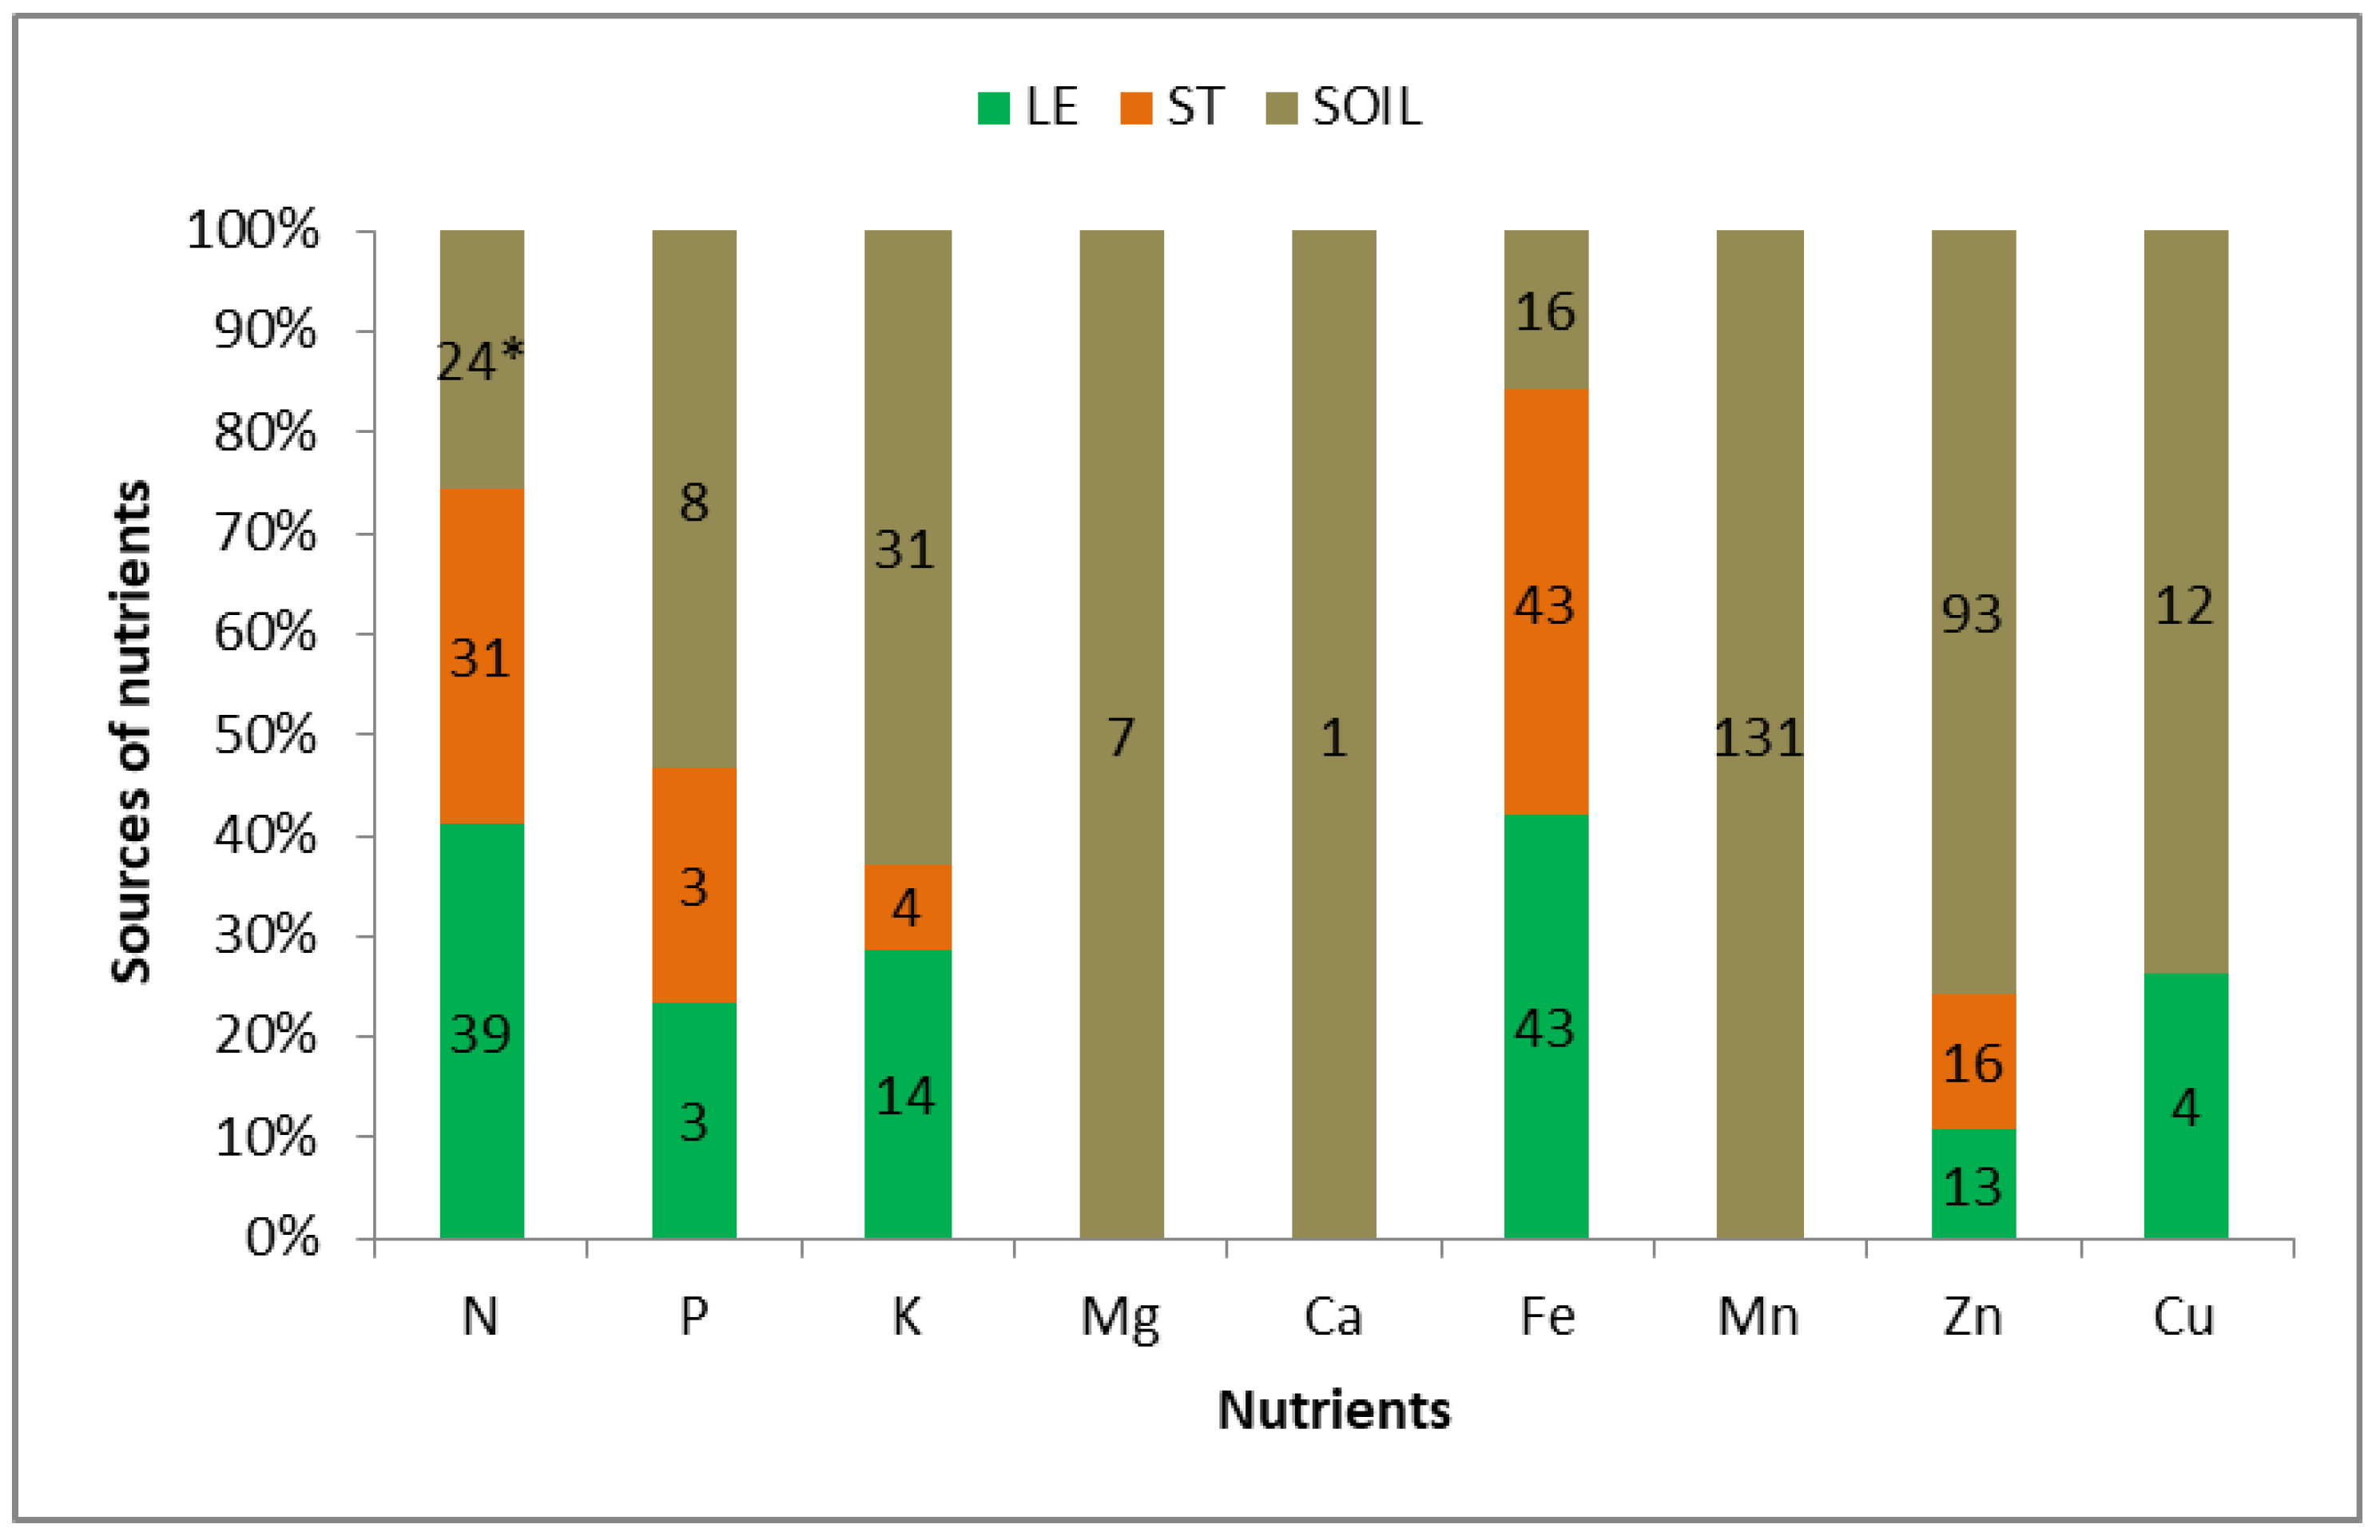
3.4. Soil Nutrient Uptake by Winter Wheat During the Critical Cereal Window

The key factor affecting the nutrient uptake from the soil by winter wheat in the CCW was the weather in subsequent growing seasons (Table 5). There was a significant response to Nf noted for Mg and Zn. In the case of Mg, no interaction between experimental factors was found. In the case of Zn, its uptake depended on the Y × Nf interaction. The same regularity was found for K, Ca, and Cu. Mg requires special attention. Its uptake by wheat from the soil in the CCW showed a large impact on EAB and GPC (Table A3). Its uptake responded significantly to the years and Nf doses (Table 5). In subsequent years of the study, it followed the order 2014 < 2015 < 2016. In response to increasing Nf doses, Mg uptake is best described by the quadratic regression model. The amount of 14.2 kg Mg ha−1 was obtained for Nf was 156 kg N ha−1. It was significantly and strongly correlated with P, moderately correlated with Fe, and weakly correlated with N. The same special attention should be paid to K. Its uptake by wheat in the CCW depended only on the weather in a given growing season. In 2014, no soil K uptake was recorded, but in other years, it was significant. In 2015, it was 5-fold higher than in 2016.
In this set of nutrients, Ca had a key effect on wheat yield characteristics. Stepwise regression analysis showed that Ca was a significant, independent predictor of GY, CPY, and CED (Table A3). However, the R2 values for these relationships were moderate (GY = 0.45) or low, as found for the other traits (0.31 and 0.23, respectively). Moreover, Ca, together with the accompanying nutrients, affected GE (P and Mn) and CGD (Fe). The effect of increasing Nf doses on Ca uptake by wheat was year-specific (Figure S10). In 2014, it followed the quadratic regression model. The maximum Ca uptake of 2.5 kg ha−1 was obtained for an Nf of 108 kg N ha−1. The same trend was recorded in 2016, and the cardinals were 1.2 kg Ca ha−1 for an Nf of 87 kg N ha−1. In 2015, Ca uptake by wheat increased in line with Nf doses. Ca uptake from soil by wheat was significantly, positively, and strongly correlated with K; moderately correlated with N, Fe, and Cu; and weakly correlated with Mn (Table S4).
The variability in Cu uptake by wheat, in combination with P, Mg, and Zn, determined 94% of the variability of EAB (Table A3). Annual Cu trends in response to increasing Nf doses followed the quadratic regression model (Figure S11). In 2014, the maximum Cu uptake of 17.6 g ha−1 was obtained for Nf of 115 kg N ha−1. This trend was reversed in 2015 and 2016. The cardinal values were 14.6 and 5.0 Cu ha−1 for Nf doses of 74 and 98 kg ha−1, respectively. Cu soil uptake was significantly and strongly correlated with K; moderately correlated with Ca; and weakly correlated with N, Fe, and Zn (Table S4). P uptake, which was also responsible for the state of GE, showed only a response to weather in subsequent growing seasons. It was significantly and strongly correlated, especially with Mg (r = 0.94***) (Table S4).
The Zn uptake by wheat in the studied period resulted from the Y × Nf interaction. The highest was recorded in 2014, when it was twice as high compared to the other two seasons (Figure S12). The Zn uptake trend in response to Nf doses followed the quadratic regression model. The maximum amount of 164 g Zn ha−1 was obtained for an Nf that was 142 kg N ha−1. The opposite tendency was found in 2015. The cardinals were 43.8 Zn ha−1 for an Nf of 75 kg N ha−1, respectively. In 2016, Zn uptake was at the same level as in 2015, but no significant trend in response to Nf doses was found. This nutrient only showed a significant and strong relationship with Mn (r = 0.94***), which was responsible for GE formation (Table S4).

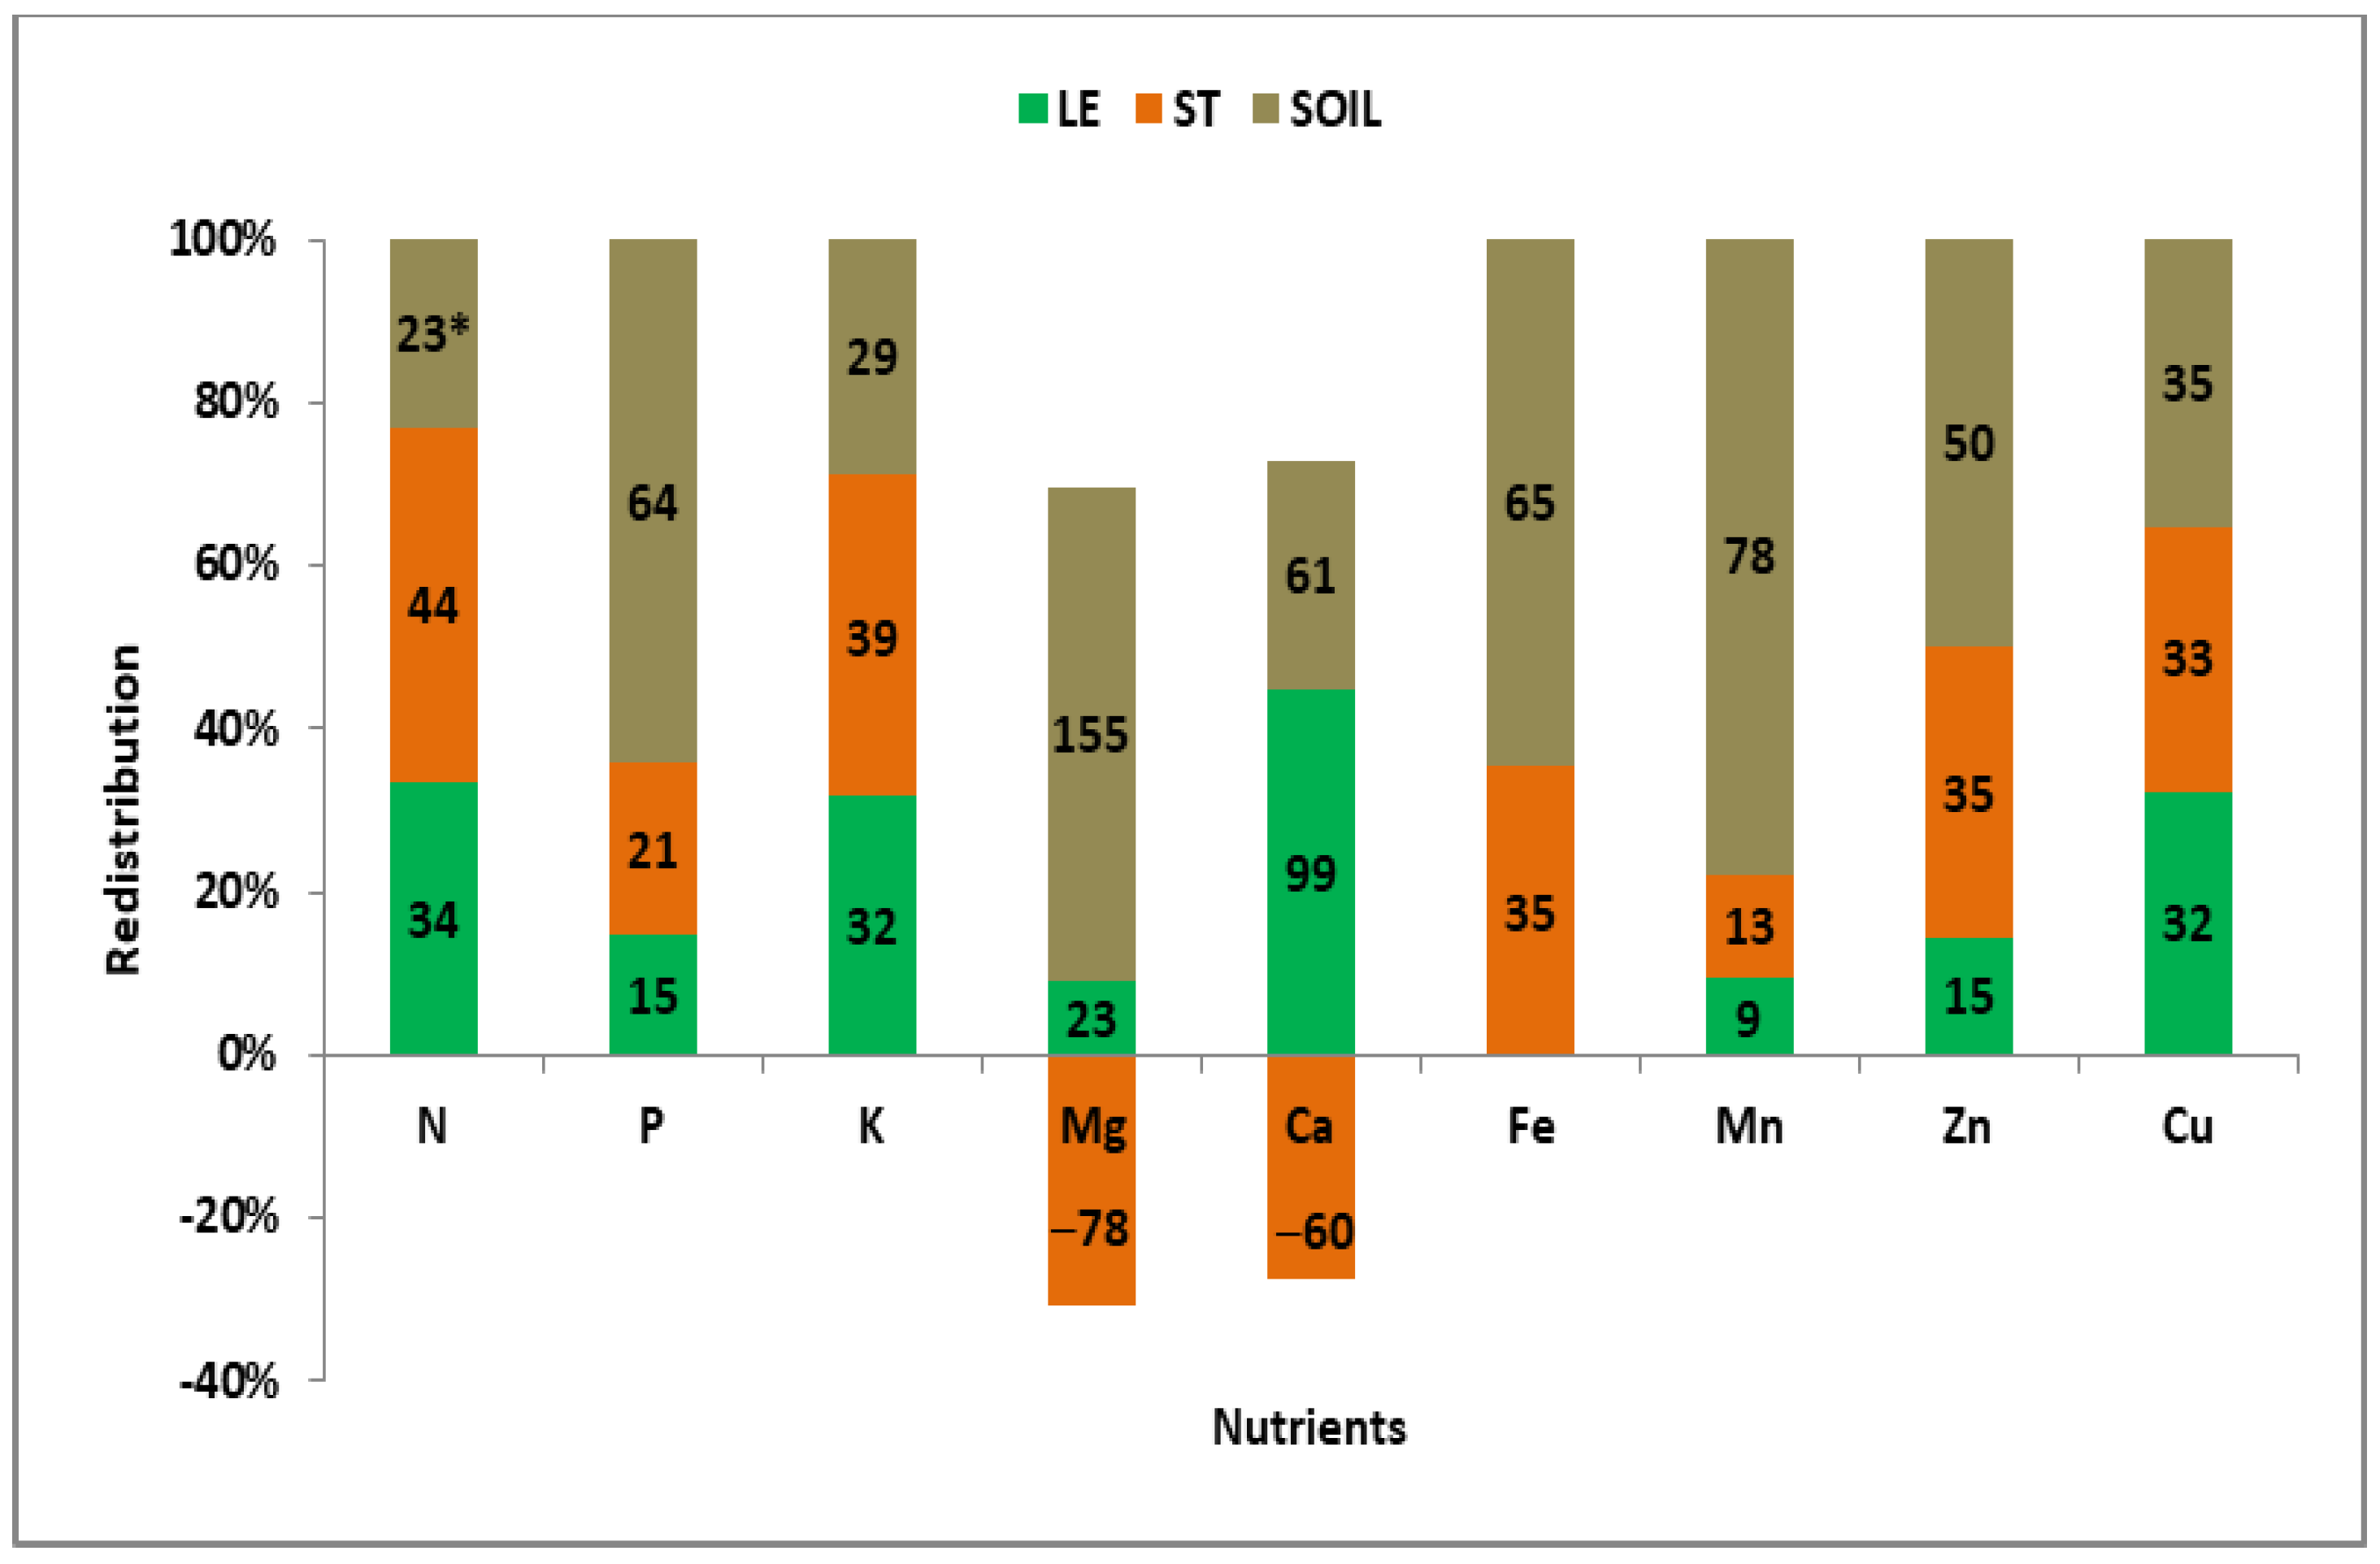
3.5. Redistribution of Nutrients Taken up by Winter Wheat in the CCW

The total amount of nutrients taken up by wheat plants during the CCW changed in subsequent years of the study. The macro-elements were dominated by N, followed by K. The amount of P and Mg was similar but varied over the years. The lowest amount was recorded for Ca. In the macronutrient group, Fe and Mn were taken up by plants, despite seasonal variability, in approximately the same amounts. Zn was taken up in much smaller quantities, and the quantity of Cu was the smallest (Figures S13a–S15a).
Analyzing the redistribution of nutrients taken up from the soil by the wheat plant between its organs is very complex. The first step concerns the redistribution of nutrients between the ears and vegetative organs, while the second step concerns the structure of nutrient sources in the ear.
In 2014, the entire set of tested nutrients for the growing ear, based on the structure of the origin source(s), was divided into five groups (Table 6). The three-source structure (multi-source) group included nutrients remobilized from the leaves and the stem and taken up by the plant during CCW from the soil. This group was represented by P. Its resources in ears were provided in equal amounts by leaves and stems (40% each), and the remaining 20% was taken up by the plant from the soil (Figure A2). At the same time, no net accumulation was noted in the vegetative wheat organs. The double-source group had two variants. The first vegetative group (Double-VE), representing nutrients remobilized from the leaves and stem, consisted of N, K, and F. In the case of N, which was accumulated in the ears in the largest amounts, the share of both sources was balanced (50% each). Almost the same structure was found for Fe. The main source of K was leaves (60%). The second double-source group (SOLE) includes nutrients taken up by plants from the soil and remobilized from the leaves. This group was represented by Zn and Cu. Soil nutrient uptake accounted for 89% and 69% of their total mass in wheat ears, respectively (Figure S13b). It should be emphasized that part of both nutrients taken up from the soil was allocated to the stems (Figure A2). Two single sources of nutrients for the ears were identified. The first was the stems (ST), covering 100% of the Ca needs of the ears and some of the Ca needs of the leaves. The second single source was soil (SO), covering the ears’ needs for Mg and Mn. In the case of Mg, 25% of soil nutrients were allocated to the stem. In the case of Mn, 5% of its total amount of soil taken was accumulated in the stem, and 43% was accumulated in the leaves.
In 2015, the year with the highest grain yield, four groups of nutrient sources for the growing ear were distinguished (Table 6). The multi-source group consisted of N, P, and Zn (Figure A3). In the case of Zn and P, the dominant source was soil, with a share of 81% and 69%, respectively (Figure S14b). Regarding N, the share of soil and leaves was almost equal (48% and 45%, respectively). In the SOLE group, including Fe and Cu, the dominant source was soil, whose share was 61% and 92%, respectively. At the same time, some of the nutrients taken up by the plants from the soil were transferred to the stem (63% and 29%, respectively) (Figure A3). The SOST group only included Mn. Its uptake from the soil comprised 65% of the mass of the ear. At the same time, 35% of soil Mn was incorporated into the leaves, and the soil was the only source of K, Mg, and Ca to the growing ear. Nutrients taken from the soil were also accumulated in both vegetative parts. In the case of K, 8% of the soil taken was allocated to the leaves, and 38% was allocated to the stem. In the case of Mg, the respective contribution to the leaves was 27% and 36%. However, in the case of Ca, the contribution included 73% to the leaves and 20% to the stem. Only seven percent of Ca taken up by wheat plants in the CCW was allocated to the ears.
In 2016, the year with the lowest grain yield, only three groups of nutrient sources for the growing ear were distinguished (Table 6; Figure A3). The multi-source group comprised six nutrients, including N, P, K, Mn, Zn, and Cu (Figure S15b). For N and K, the dominant source was the stem, amounting to 44% and 39%, respectively. Soil was the dominant source of P, Mn, and Zn. However, for Cu, all three sources contributed equally. The SOLE group was represented by Mg and Ca. Meanwhile, Mg’s main source was soil (75%). Moreover, 51% of the total amount taken up by wheat plants from the soil in the CCW was accumulated in the stem. In the case of Ca, leaves delivered 99% of accumulated nutrients to the ears. Analogously to Mg, most of the soil’s Ca was transferred to the stem. The SOST group was solely represented by Fe. Soil dominated the stem’s source of nutrients (65% vs. 35%).

4. Discussion

4.1. Ear Nutrients—Yield Prediction

The ear of a cereal plant is the final physiological sink of biological energy. GY results from the potential of the number of florets to be fertilized in the full flowering phase. The supply of assimilates to the growing ear results from the N nutritional status of the plant in the critical period of basic yield component formation [11,12,33]. This is the period from the beginning of booting to the beginning of flowering [22,32]. Therefore, the basic question is to assess the predictive worth of winter wheat ears, which is mainly considered in terms of GY and GPC; however, the main yield components, such as GE, cannot be omitted.
Based on the productivity of N mass in ears in the full flowering phase of winter wheat and GY, the individual growing seasons can be treated as follows:
  • Effective N—2014. This season was characterized by a low amount of N in the ears and high yield. The productivity of N accumulated in ears was 141 kg grain kg−1 ear N.
  • Optimal N—2015. This season was characterized by a moderate amount of N in the ears and a very high yield. The productivity of N accumulated in ears was 120 kg of grain kg−1 N.
  • Ineffective N—2016. This season was characterized by a very high amount of N in the ears and moderate yield. The productivity of N accumulated in ears was only 60 kg grain kg−1 ear N.
Therefore, the mass of N in winter wheat ears in the full flowering phase is not a clear indicator of grain yield.
This study showed that the mass of nutrients accumulated in winter wheat ears in the full flowering phase was stable over the years in response to increasing Nf doses. For all nutrients examined, the obtained trend was consistent with the quadratic regression model. This type of response indicates the nutritional saturation of the ears in the WW canopy. Such a model for Nf in winter wheat appears in years with optimal growing conditions, leading to a high GY [34]. With respect to the optimum Nf dose, the nutrients examined can be divided into three groups (with a division criterion of 20 kg N ha−1):
  • Moderate: Cu, N, K, and P; range: 160–180 kg N ha−1;
  • High: Mg, Ca, and Zn; range: 190–210 kg N ha−1;
  • Very high: Fe and Mn; range: 210–230 kg N ha−1.
The obtained ranges clearly indicate that the accumulation of micronutrients and secondary nutrients, like Mg and Ca, in the wheat ears occurred under a high supply of N. Therefore, for High-Yield–High-Protein (HY–HP) varieties of WW, a good crop supply with these nutrients is consistent with high doses of Nf. The presented ranges, excluding the first group, fall within or even exceed the ranges suggested for bread wheat [35]. Fe requires special attention because its accumulation in wheat ears depends on high Nf doses [36]. The obtained results expand the range of nutrients that require a large supply of N, leading to an increase in their mass in wheat in the period just before flowering. This is also important in terms of the quality of wheat grain. As a result of a phenomenon called mineral density dilution, the content of nutrients, especially Mg and microelements, in grains at maturity decreases [37].
A reliable analysis of the diagnostic worth of nutrient mass in EAB in the CCW requires a specific division of the data obtained into two subsets based on the GY in subsequent years of the study. For both, i.e., the two-year system (2YS, 2014 and 2015) and the three-year system (3YS, all studied years), the prediction of EAB was extremely high (R2 ≈ 0.98–0.997). Importantly, N and Ca’s predictive value was shown in both algorithms, regardless of the length of the analyzed period. In 2YS, excess N was only revealed for the highest Nf doses in 2015, i.e., the year with the highest GY. The N deficiency in 3YS is misleading because EAB over 3.9 t ha−1 was significantly unproductive [32].
The wheat biomass at the beginning of flowering explains 70% of the variability in the canopy grain density (CGD) [38]. This conclusion is true for optimal wheat growth conditions, which are the exception and not the rule in natural rainfall conditions. In such conditions, N deficiency reduces the accumulation of N in the ear, leading to a decrease in its mass and, consequently, to a reduction in CGD [11,39]. Analysis of the yield-forming role of N, or more precisely, the N mass in wheat ears, showed that in 2YS, it was critical for six of eight wheat traits examined. This mainly applies to the economically key ones, i.e., GY and GPC. Both these traits were N-deficient despite high Nf doses. However, in 3YS, the N mass, apart from EAB, was only critical for GPC. The grain protein yield (GPY) in the variant with maximum Nf doses was 1.945 and 1.315 t ha−1, respectively, for 2015 and 2016. The unit productivity of an ear N was 8.1 and 5.5 kg protein kg Near−1, respectively. Therefore, the HY-HP production system found in 2015 was more productive with respect to GPY than the Medium-Yield–High-Protein (MH–HP) system found in 2016.
The Ca mass in the ear was a key predictor of six winter wheat traits, including EAB. It is worth noting that in 3YS, Ca mass accumulated in the ears at BBCH 65 was critical for both GY and its key components, such as GE and TGW. No such phenomenon was observed in the 2YS. This controversy clearly indicates a disturbance in Ca accumulation in ears in 2016, a year with the lowest yield. However, there is a question of whether the increase in Ca content in the wheat ear was the reason or the result of a sudden decline in GE. Overall, it likely is not because it was a consequence of the reduced number of grains, which increased the mass of vegetative parts of the ear. A negative impact of Ca accumulation in vegetative organs of a cereal crop just before flowering on GE and GY was observed for spelt wheat [40]. Moreover, the mass of Ca in the ear was very strongly related to N and moderately related to P. The yield-forming role of P was revealed in both discussion systems. The negative P sign in the developed equations clearly suggests its excessive mass in the ear at BBCH 65. It can, therefore, be concluded that regardless of the GY level, P was not effectively used by wheat to support grain yield. The ineffective P management deepened in 2016, with a much lower yield than previous seasons. Excess P in the ears was very significant in predicting GE. The reason for this relationship lies in the significant reduction in GE because the grains are the main sink for P [41]. Winter wheat—and, therefore, all cereals—can, similarly to rapeseed, effectively manage P, provided an optimal size of the sink, i.e., grains per m2 [42].

4.2. Nutrient Economy of Winter Wheat Canopy During CCW

In the CCW, two aspects of nutrient management in winter wheat require great attention. The first concerns the redistribution of nutrients taken up by wheat between its organs. The second one focuses on the sources of nutrients for the growing ear.
The key question is the cause(s) that induce the redistribution structure of nutrients taken up by wheat from the soil between the actively growing ear and the non-ear organs of the plant. The physiological function of nutrients examined in the CCW, based on their redistribution among wheat parts, can be divided into three groups (Table 6; Figure 3). The first, which can be called physiologically conservative, consists of N and P. Their physiological action was only oriented toward the growth of the ear. Moreover, they were remobilized from both the leaves and the stem. In the case of N, its remobilization during the vegetative part of seed plant growth is the base of the diagnostic tool known as Critical Nitrogen Dilution [43]. In the studied case, the key predictor was the N remobilization quota (NRQ). It explains 92% of the variability in GY in subsequent growing seasons, as follows:
G Y = 0.05 N R Q + 12.1   f o r   n = 3 ,   R 2 = 0.92 ,   p   0.06
The much lower N remobilization from the stems in 2015 compared to the remaining growing seasons was compensated by a large simultaneous uptake from the soil. A low stem NRQ indirectly indicates an immature nutritional status. This assumption also results from the activity of nutrients, whose nutritional status in the CCW can be described as physiologically labile. The set of nutrients accumulated both in the ear and in the vegetative wheat organs varied over the years. In 2014, it comprised Mn, Zn, and Cu, which accumulated in the stems. In 2015, this set included K and Mn, which accumulated both in leaves and stems, and again Cu and Zn, which accumulated only in stems. The supply of a crop plant with K (including high-yielding winter wheat) during the growing season depends on its available resources in the soil [44,45]. However, critical microelements can and even must be provided to the crop plant to exploit its production potential using foliar spraying [46,47].
The growth of the stem is inherently related to the formation of the ear. It has been proven that the better the stem shape (length, mass), the larger the ear. Moreover, the stem is the transportation pathway for assimilates to reach floret primordia [48]. The prolonged period of stem growth just before wheat flowering is considered to be its biometric trait that increases yield [49,50]. This is, as presented by Grzebisz et al. [14], sourced from a large CGD. The low stem NRQ in 2015 was not the primary factor determining the stem growth in the WW canopy but, rather, a secondary factor. The primary factor was the pool of soil mineral N (Nmin) available to the crop during CCW. In 2014, it was fully exhausted before the booting phase, while in 2016, it was relatively low. In 2015, the convergence of Nmin resources with the simultaneous high availability of K and other nutrients was probably the primary reason for the extended growth of the stem, which ultimately led to an increase in the grain set in a wheat ear. The sink-source theory is dominated by the view that GY is limited by a low size of the sink CGD [51,52,53]. In fact, the sink size in seed plants, e.g., cereals, should be assessed at the beginning of booting, not at the beginning of flowering, and certainly not at harvest. This study indirectly shows that the main limitation in the build-up of CGD is the limited size of the N source. This probably refers to the amount of nitrate nitrogen in the soil in the period extending from the beginning of shoot elongation to the beginning of wheat flowering (CCW; 14). This assumption is based on a study with winter rapeseed oils, for which a decrease in the N-NO3 mass from BBCH 30 to BBCH 60 was significantly correlated with the crop biomass at the end of this period [54].
Among the nine nutrients examined, only Mg and Ca showed constant physiological activity, consisting of stable (regardless of weather conditions) investment in the non-ear organs of WW during CCW. Therefore, they can be called physiologically active. Most of the soil Mg was allocated to the stem, while Ca was allocated to the leaves. The change of leaves into stems as the sink for Ca in 2016 emphasizes a disturbance in the nutritional physiology of winter wheat, indirectly indicating a juvenile status of ear-bearing tillers. For Ca, the stem is only a transitional, temporary organ and not the final acceptor—the final acceptor is the leaves [55]. The allocation of Mg in the CCW in the stems indicates the physiological activity and growth of this plant organ [14]. The multi-functionality of Mg is due to its necessity in transporting assimilates to the growing florets in the spikelets. Thus, this yield-forming function of Mg should be treated as the basis for its application to wheat foliage at the beginning of the booting phase but the latest in the heading phase [46].
The main source of nutrients for the growing ear, apart from N and Fe, was the soil (Figure 4). As for N, its main source for growing ears was leaves, followed by stems. Over the years of the study, the N source structure was very variable. In 2015, the leaves contributed equally to the soil, while in 2014, the leaves contributed equally to stems, and no soil uptake was recorded. However, in 2016, the stem dominated over leaves, which should be considered a disturbance of the N economy in the CCW. In the case of Fe, there was a balance between leaves and stems (43% each), which was achieved via soil uptake. No soil uptake was recorded in 2014, while in other seasons, dominant soil uptake was recorded. The observed relationship indicates an important role of Fe in the N economy of WW. This is consistent with recent reports for rice [56]. Soil was the dominant source of the other nutrients examined. Averaged over years and Nf doses, soil delivered 100% of Mg, Ca, and Mn accumulated in the ear in the full flowering stage. The double-nutrient source, i.e., soil and leaves (SOLE), was represented by Cu, where soil uptake contributed to 75% of Cu mass in the ear. All other nutrients that accumulated in the ears, such as N, Fe, P, K, and Zn, came from three sources. In the case of the last three nutrients, soil uptake predominated over remobilization from winter wheat non-ear organs. The structure of Fe sources clearly indicates how to supplement the needs of winter wheat for this nutrient: foliar feeding. In the case of nutrients whose sources for the ear are dominated by soil uptake, the plant supply depends on the size of the soil’s available pool. Zn soil application, practiced in many regions of the world, increases the size of the wheat root system. As a consequence, there was an increase in Zn uptake and an increase in grain yield and Zn concentration in the grain [57]. Our results showed a strong relationship between the mass of Zn accumulated in ears, especially with K, Mn, and Fe, but not with Ca. Therefore, Zn can be treated as a specific regulator of N efficiency by improving the management of other nutrients in the CCW. This is a challenge for farmers, whose goal is not only to use the yield potential of winter wheat but also to increase the efficiency of N in the soil/crop system.

5. Conclusions

A high grain yield with a simultaneous high grain protein content of winter bread wheat is possible, provided that N resources are effectively controlled from the beginning of the booting phase to the full flowering phase (CCW). A necessary condition for determining the scope of fertilization treatments is recognizing the nutritional status of winter wheat at the beginning of this period. In this study, the ear biomass (EAB) and the mass of accumulated nutrients were considered critical winter wheat traits. These traits define the grain yield (GY) and protein content (GPC). Overall, this study showed that the range of critical nutritional factors in the ears resulted from the degree of disruption of N management in the CCW.
The CCW indicators relating to the nutrient balance in leaves and stems during this period made it possible to recognize the main processes, i.e., remobilization and/or net accumulation, as well as their impact on the wheat traits examined. A positive nutrient balance in leaves, indicating remobilization, was found for N, P, Fe, Zn, and Cu. The P and Mg balance in stems were the best EAB predictors, and GY was the best predictor in leaves. The leaf N balance confirms the importance of this indicator for GPC prediction.
The CCW period of winter wheat growth should always be combined with the effective transformation of the taken-up soil N into grain yield and protein content. The soil N and Fe were important but not the dominant sources for the growing ears. For both nutrients, the processes of their remobilization from leaves and stems were more important. The observed phenomenon is important for both farmers and breeders of winter wheat varieties. For the first group, this indicates the optimization of N fertilization before the booting phase, as well as foliar application of both nutrients in the CCW. The question for breeders is how to increase the remobilization of both nutrients from leaves and stems. The only source of Mg, Ca, and Mn (and partly for Cu) was soil. This is a clear suggestion and challenges farmers to maintain the content of available nutrients in the soil at a high level. The key source of P, K, and Zn for ears was soil, supported by extensive remobilization from leaves and stems. The highest yield was provided by the set of nutrients taken up from the soil by WW during CCW, apart from Mg and Ca, which also included K, Mn, Zn, and Cu. For the farmer, in addition to fertilizing WW in the CCW, it is equally important to choose a variety that has a high predisposition to take up N from the soil in the CCW, specifically from previously applied fertilizers.

Supplementary Materials

The following supporting information can be downloaded at: https://www.mdpi.com/article/10.3390/agronomy14123018/s1, Figure S1. Trends in the mass of macronutrients in winter wheat ears in the full flowering phase in response to increasing Nf doses; Figure S2. Trends in the mass of micronutrients in winter wheat ears in the full flowering phase in response to increasing Nf doses; Figure S3. Trends in magnesium balance in leaves in subsequent growing season in response to an increase in Nf doses; Figure S4. Trends in calcium balance in leaves in subsequent growing season in response to an increase in Nf doses; Figure S5. Trends in zinc balance in leaves in subsequent growing season in response to an increase in Nf doses; Figure S6. Trends in magnesium balance in stems in subsequent growing season in response to an increase in Nf doses. Figure S7. Trends in copper balance in stems in subsequent growing season in response to an increase in Nf doses. Figure S8. Trends in phosphorus balance in stems in subsequent growing season in response to an increase in Nf doses. Figure S9; Trends in nitrogen balance in stems in subsequent growing season in response to an increase in Nf doses; Figure S10. Trends in calcium soil uptake by winter wheat in CCW in subsequent growing season; Figure S11. Trends in copper soil uptake by winter wheat in CCW in subsequent growing season; Figure S12. Trends in zinc soil uptake by winter wheat in CCW in subsequent growing season; Figure S13a. Nutrient uptake by winter wheat in CCW and redistribution between plant organs. The 2014 growing season; Figure S13b. Redistribution of nutrient sources for ear nutrients mass, 2014; Figure S14a. Nutrient uptake by winter wheat in CCW and redistribution between plant organs, 2015; Figure S14b. Redistribution of nutrient sources for ear nutrients mass, 2015; Figure S15a. Nutrient uptake by winter wheat in CCW and redistribution between plant organs. 2016; Figure S15b. Redistribution of nutrient sources for ear nutrients mass, 2016; Table S1. Correlation matrix of nutrients accumulated in winter wheat ears with grain yield and grain protein content and yield components; Table S2. Correlation matrix of ears to leaves nutrient ratios with grain yield, grain protein content, and yield components at full flowering of wheat; Table S3. Correlation matrix of nutrients remobilized from winter wheat stems during the Critical Cereal Window and grain yield and crude protein content and yield components; Table S4. Correlation matrix of nutrients taken up by winter wheat from the soil during the Critical Cereal Window and grain yield, grain protein content, and yield components.

Author Contributions

Conceptualization, W.G. and W.S.; methodology, W.G. and W.S.; software, W.G.; validation, M.B., T.S. and K.P.-C.; formal analysis, M.B.; investigation, W.S., K.P.-C., M.B. and T.S.; resources, M.B.; data curation, T.S.; writing—original draft preparation, W.S.; writing—review and editing, W.G.; visualization, K.P.-C.; supervision, T.S.; project administration, M.B. All authors have read and agreed to the published version of the manuscript.

Funding

The publication was financed by the Polish Minister of Science and Higher Education as part of the Strategy of the Poznan University of Life Sciences for 2024–2026 in the field of improving scientific research and development work in priority research areas.

Data Availability Statement

The original contributions presented in the study are included in the article and Supplementary Materials, and further inquiries can be directed to the corresponding author.

Conflicts of Interest

The authors declare no conflicts of interest.

Appendix A

Table A1. Regression models of nutrient mass in the ears of winter wheat in the full flowering phase.
Wheat TraitThree-Year System, 3YS,
n = 21
R2Two-Year System, 2YS,
n = 14
R2
Ear biomass, EABEAB = 0.83 + 0.3N + 0.21Mg − 1.46Ca0.98EAB = 0.06 − 0.01N + 0.24P + 0.04K + 1.11Ca − 0.009Fe0.997
Grain yield, GYGY = 4.82 − 0.87P + 8.92Ca + 0.08Zn0.89GY = 5.78 + 0.17N − 1.28P + 0.05Mn0.85
Grain protein content, CPCPC = 1.1 + 0.06N 0.73CPC = 8.76 + 0.14N − 1.31P + 0.05Mn0.83
Grain protein yield, CPYGPY = 0.11 − 0.11P + 1.49Ca + 0.01Zn0.80GPY = 0.48 + 0.04N − 0.3P + 0.01Mn0.87
Canopy ear density, CEDCED = 426 + 2.28N − 29.2Mg + 1.8Zn0.72CED = 311 + 29Cu0.69
Grain per ear, GEGE = 25.7 − 2.29P + 22.5Ca + 0.13Mn0.79Nonsignificant-
Canopy grain density, CGDGD = 10.1 − 1.88Mg + 8.2Ca + 0.13Zn0.88CGD = 10.6 + 0.13N0.68
Thousand grain weightTGW = 45.9 + 4.3Ca0.49TGW = 51.6 + 0.07N − 2.1P + 0.28K0.78
Legend: N, P, K, Mg, Ca, Fe, Mn, Zn, and Cu—nutrients.
Table A2. Regression models of nutrient balance in winter wheat leaves and stems in the Critical Cereal Window.
Wheat TraitLeavesR2StemsR2
Ear biomass, EABEAB = 3.51 − 0.015Fe + 0.094Zn 0.70 EAB = 1.7 + 0.23P − 0.31Mg0.91
Grain yield, GYGY = 6.53 + 0.83P − 0.82Mg 0.78GY = 9.28 − 0.17Cu0.26
Grain protein content, GPCGPC = 8.65 + 0.095N0.31GPC = 8.84 + 0.06N + 0.0Zn − 0.34Cu0.59
Grain protein yield, GPYGPY = 0.41 + 0.019N − 0.067Mg0.60Nonsignificant-
Canopy ear density, CEDCED = 422 + 53P − 67Mg − 1.9Fe + 9.6Zn0.71Nonsignificant-
Grain per ear, GEGE = 26.4 − 0.96Mg + 0.07Fe0.84GE = 34.3 − 0.35Cu0.27
Canopy grain density, CGDCGD = 12.4 + 1.95P − 1.66Mg0.84Nonsignificant-
Thousand grain weightTGW = 50.1 − 0.53K0.32TGW = 48 − 0.28Mg − 0.007Fe0.58
Legend: N, P, K, Mg, Ca, Fe, Mn, Zn, and Cu—nutrients.
Table A3. Regression models of nutrients taken up from the soil by winter wheat in the Critical Cereal Window.
Wheat TraitThree-Year System, 3YS, n = 21R2
Ear biomass, EABEAB = 1.06 − 0.11P + 0.3Mg + 0.1Zn − 0.07Cu0.94
Grain yield, GYGY = 8.2 + 0.22Ca0.45
Grain protein content, GPCGPC = 0.4 + 0.24Mg0.53
Grain protein yield, GPYGPY = 1.0 + 0.028Ca0.31
Canopy ear density, CEDCD = 623 + 6.0Ca0.23
Grain per ear, GEGE = 26.6 − 0.41P + 0.49Ca + 0.2Mn0.73
Canopy grain density, CGDCGR = 18 + 0.63Ca − 0.024Fe 0.59
Thousand grain weightTGW = 48.3 + 0.01Fe0.59
Legend: N, P, K, Mg, Ca, Fe, Mn, Zn, and Cu—nutrients.

Appendix B

Figure A1. The redistribution of nutrients taken up by winter wheat in the CCW between its organs during full flowering, 2014. * The percentage redistribution based on the amount of a given nutrient in the ears. Legend: LE—leaves, ST—stems, SOIL—soil nutrient sources.
Agronomy 14 03018 g0a1
Figure A2. The redistribution of nutrients taken up by winter wheat in the CCW between its organs during full flowering, 2015. * The percentage redistribution based on the amount of a given nutrient in the ears. Legend: LE—leaves, ST—stems, SOIL—soil nutrient sources.
Agronomy 14 03018 g0a2
Figure A3. The redistribution of nutrients taken up by winter wheat in the CCW between its organs during full flowering, 2016. * The percentage redistribution based on the amount of a given nutrient in the ears. Legend: LE—leaves, ST—stems, SOIL—soil nutrient sources.
Agronomy 14 03018 g0a3

References

  1. FAOSTAT. Available online: https://faostat.fao.org/site/567/default.aspx#ancor (accessed on 25 August 2024).
  2. Sharma, I.; Tyagi, B.S.; Singh, G.; Venkatesh, K.; Gupta, O.P. Enhancing wheat production—A global perspective. Indian J. Agric. Sci. 2015, 85, 3–13. [Google Scholar] [CrossRef]
  3. Ray, D.K.; Mueller, N.D.; West, P.C.; Foley, J.A. Yield trends are insufficient to double global crop production by 2050. PLoS ONE 2013, 8, e66428. [Google Scholar] [CrossRef]
  4. Dadrasi, A.; Chaichi, M.; Nehbandani, A.; Soltani, E.; Nemati, A.; Salmani, F.; Heydari, M.; Yousefi, A.R. Global insight into understanding wheat yield and production in agro-ecological zoning. Sci. Rep. 2023, 13, 15898. [Google Scholar] [CrossRef] [PubMed]
  5. Grzebisz, W.; Łukowiak, R. Nitrogen gap amelioration is a core for sustainable intensification of agriculture—A concept. Agronomy 2021, 11, 419. [Google Scholar] [CrossRef]
  6. Senapati, N.; Semenov, M.A. Large genetic yield potential and genetic yield gap estimated for wheat in Europe. Glob. Food Secur. 2020, 24, 100340. [Google Scholar] [CrossRef] [PubMed]
  7. Slafer, G.A.; Garcia, G.A.; Serrago, R.A.; Miralles, D.J. Physiological drivers of responses of grains per m2 to environmental and genetic factors in wheat. Field Crops Res. 2022, 285, 108593. [Google Scholar] [CrossRef]
  8. Kirby, E.J.M. Analysis of leaf, stem and ear growth in wheat from terminal spikelet stage to anthesis. Field Crops. Res. 1988, 18, 127–140. [Google Scholar] [CrossRef]
  9. González, F.G.; Miralles, D.J.; Slafer, G.A. Wheat floret survival as related to pre-anthesis spike growth. J. Exp. Bot. 2011, 62, 4889–4901. [Google Scholar] [CrossRef] [PubMed]
  10. Zhang, Z.; Li, Y.; Wu, Y.; Zheng, X.; Guo, X.; Sun, W.; Sun, Z.; Wang, Z.; Zhang, Y. A dynamic regulation of nitrogen on floret primordia development in wheat. Crop J. 2024, 12, 271–280. [Google Scholar] [CrossRef]
  11. Ferrante, A.; Savin, R.; Slafer, G.A. Floret development and spike fertility in wheat: Differences between cultivars of contrasting yield potential and their sensitivity to photoperiod and soil N. Funct. Plant Biol. 2005, 32, 189–197. [Google Scholar] [CrossRef]
  12. Prieto, P.; Ochagavia, H.; Savin, R.; Griffiths, S.; Slafer, G.A. Dynamics of floret initiation/death determining spike fertility in wheat as affected by PpG genes under field conditions. J. Exp. Bot. 2018, 69, 2633–2645. [Google Scholar] [CrossRef] [PubMed]
  13. Zhao, B.; Tahir Ata-ul-Karim, S.; Lemaire, G.; Duan, A.; Liu, Z.; Guo, Y.; Qin, A.; Ning, D.; Liu, Z. Exploring the nitrogen source-sink ratio to quantify ear nitrogen accumulation in maize and wheat using critical nitrogen dilution curve. Field Crops Res. 2021, 274, 108332. [Google Scholar] [CrossRef]
  14. Grzebisz, W.; Szczepaniak, W.; Potarzycki, J.; Biber, M. Prediction of grain yield and gluten content in winter bread wheat based on nutrient content in plant parts during the Critical Cereal Window. Agronomy 2023, 13, 2649. [Google Scholar] [CrossRef]
  15. Duan, J.; Wu, Y.; Zhou, Y.; Ren, X.; Shao, Y.; Feng, W.; Zhu, Y.; Wang, Y.; Guo, T. Grain number response to pre-anthesis dry matter and nitrogen in improving wheat yield in the Huang-Huai Plain. Sci. Rep. 2018, 8, 7126. [Google Scholar] [CrossRef] [PubMed]
  16. Szczepaniak, W.; Nowicki, B.; Bełka, D.; Kazimierowicz, A.; Kulwicki, M.; Grzebisz, W. Effect of foliar application of micronutrients and fungicides on the nitrogen use efficiency in winter wheat. Agronomy 2022, 12, 257. [Google Scholar] [CrossRef]
  17. Grzebisz, W. Technology of Crop Plants Fertilization—Yielding Physiology. Part II. Cereals and Maize; PWRiL: Poznań, Poland, 2012; 279p. (In Polish) [Google Scholar]
  18. Iwańska, M.; Paderewski, J.; Stępień, M.; Rodrigues, P.C. Adaptation of winter wheat cultivars to different environments: A case study in Poland. Agronomy 2020, 10, 632. [Google Scholar] [CrossRef]
  19. Hlisnikovsky, L.; Menšik, L.; Kunzová, E. The development of winter wheat yield and quality under different fertilizer regimes and soil-climatic conditions in the Czech Republic. Agronomy 2020, 10, 1160. [Google Scholar] [CrossRef]
  20. Koppensteiner, L.K.; Kaul, H.-P.; Piepho, H.-P.; Barta, N.; Euteneuer, P.; Bernas, J.; Klimek-Kopyra, A.; Gronauer, A.; Neugschwandtner, R.W. Yield and yield components of facultative wheat are affected by sowing time, nitrogen fertilization and environment. Europ. J. Agron. 2022, 140, 126591. [Google Scholar] [CrossRef]
  21. Khalid, A.; Hameed, A.; Farrukh Tahir, M. Wheat quality: A review on chemical composition, nutritional attributes, grain anatomy, types, classification, and function of seed storage proteins in bread making quality. Front. Nutr. 2023, 10, 1053196. [Google Scholar] [CrossRef] [PubMed]
  22. Guo, Z.; Chen, D.; Schnurbusch, T. Plant and floret growth at distinct developmental stages during the stem elongation phase in wheat. Front. Plant Sci. 2018, 9, 330. [Google Scholar] [CrossRef] [PubMed]
  23. Gaju, O.; Allard, V.; Martre, P.; Le Gouis, J.; Moreau, D.; Bogard, M.; Hubbart, S.; Foulkes, M.J. Nitrogen partitioning and remobilization in relation to leaf senescence, grain yield and grain nitrogen concentration in wheat cultivars. Field Crops Res. 2014, 155, 213–223. [Google Scholar] [CrossRef]
  24. Kong, L.G.; Xie, Y.; Hu, L.; Feng, B.; Li, S.D. Remobilization of vegetative nitrogen to developing grain in wheat (Triticum aestivum L.). Field Crops Res. 2016, 196, 134–144. [Google Scholar] [CrossRef]
  25. Masoni, A.; Ercoli, L.; Mariotti, M.; Arduini, I. Post-anthesis accumulation and remobilization of dry matter, nitrogen and phosphorus in durum wheat as affected by soil type. Europ. J. Agron. 2007, 26, 179–186. [Google Scholar] [CrossRef]
  26. Meng, Q.; Yue, S.; Chen, X.; Cui, Z.; Ye, Y.; Ma, W.; Tong, Y.; Zhang, F. Understanding dry matter and nitrogen accumulation with time-course for high-yielding wheat production in China. PLoS ONE 2013, 8, e68783. [Google Scholar] [CrossRef] [PubMed]
  27. Mehlich, A. Mehlich 3 soil test extractant: A modification of Mehlich 2 extractant. Com. Soil Sci. Plant Anal. 1984, 15, 1409–1416. [Google Scholar] [CrossRef]
  28. Kęsik, K. Application of the Mehlich 3 method in the fertilizer advisory system. Stud. I Rap. IUNG-PIB 2016, 48, 95–104. (In Polish) [Google Scholar]
  29. Trávník, K.; Zbíral, J.; Němec, P. Agrochemical Soil Testing—Mehlich III; Central Institute for Supervising and Testing in Agriculture: Brno, Czech Republic, 1999. (In Czech)
  30. Zbíral, J. Determination of plant-available micronutrients by the Mehlich 3 soil extractant—A proposal of critical values. Plant Soil Environ. 2016, 62, 527–531. [Google Scholar] [CrossRef]
  31. PN-EN ISO 20483:2014-02; Cereal Grains and Pulses—Determination of Nitrogen Content and Conversion to Crude Protein—Kjeldahl Method. Polish Committee for Standardization: Warsaw, Poland, 2014; 24p.
  32. Grzebisz, W.; Biber, M. Nutrient mass in winter wheat in the Cereal Critical Window under different nitrogen levels—Effect on grain yield and grain protein concentration. Agronomy 2024, 14, 2435. [Google Scholar] [CrossRef]
  33. Zhang, Z.; Li, J.; Hu, N.; Li, W.; Qin, W.; Gao, Y.; Liu, Y.; Sun, Z.; Yu, K.; Wang, Z.; et al. Spike growth affects spike fertility through the number of florets with green anthers before floret abortion. Field Crops Res. 2021, 260, 108007. [Google Scholar] [CrossRef]
  34. Szczepaniak, W.; Potarzycki, J. Impact of increasing nitrogen rates on the course of the nitrogen critical concentration curve during the vegetative growth of winter wheat. J. Elem. 2014, 19, 549–566. [Google Scholar]
  35. Wu, W.; Wang, Y.; Wang, L.; Xu, H.; Zörb, C.; Geiflus, C.-M.; Xue, C.; Sun, Z.; Ma, W. Booting stage is the key for timing split nitrogen application in improving yield and quality of wheat—A global meta-analysis. Field Crops Res. 2022, 287, 108665. [Google Scholar] [CrossRef]
  36. Hamnér, K.; Weih, M.; Eriksson, J.; Kirchmann, H. Influence of nitrogen supply on macro- and micronutrient accumulation during growth of winter wheat. Field Crops Res. 2017, 213, 118–129. [Google Scholar] [CrossRef]
  37. Adams, C.B.; Graebner, R.; Marschall, J.; Neely, C.; Long, D.S.; Reardon, C.L.; Rogers, C.W. Yield has minimal effect on whole-grain yield mineral density of modern soft wheat, compared to production environment. Field Crops Res. 2024, 312, 109403. [Google Scholar] [CrossRef]
  38. Bindraban, P.S.; Sayre, K.D.; Solismoya, E. Identifying factors that determine kernel number in wheat. Field Crops Res. 1998, 58, 223–234. [Google Scholar] [CrossRef]
  39. Demotes-Mainard, S.; Jeuffroy, M.-H. Effects of nitrogen and radiation on dry matter and nitrogen accumulation in the spike of winter wheat. Field Crops Res. 2004, 87, 221–233. [Google Scholar] [CrossRef]
  40. Grzebisz, W.; Barłóg, P.; Kryszak, J.; Łukowiak, R. Pre-anthesis nutritional status of spelt wheat as a tool for predictong the attinable yield. Agronomy 2019, 9, 558. [Google Scholar] [CrossRef]
  41. Zhang, Y.-Y.; Guan, H.-W.; Liu, L.-R.; He, L.; Duan, J.-H.; Wang, C.-Y.; Guo, T.-C.; Feng, C. Effect of phosphorus application on spike and fertile floret development and yield of winter wheat under different water treatments. Acta. Agron. Sinica 2023, 49, 2753–2765. [Google Scholar]
  42. Grzebisz, W.; Szczepaniak, W.; Barłog, P.; Przygocka-Cyna, K.; Potarzycki, J. Phosphorus sources for winter oilseed rape (Brassica napus L.) during reproductive growth-magnesium sulfate management impact on P use efficiency. Arch. Agron. Soil Sci. 2018, 64, 1646–1662. [Google Scholar] [CrossRef]
  43. Lemaire, G.; Jeuffroy, M.-H.; Fstal, F. Diagnosis tool for plant an crop N status in vegetative stage: Theory and practices for crop N management. Eur. J. Agron. 2008, 28, 614–624. [Google Scholar] [CrossRef]
  44. Barraclough, P.B. The growth and activity of winter wheat roots in the field: Nutrient uptakes of high-yielding crops. J. Agric. Sci. Camb. 1986, 106, 45–52. [Google Scholar] [CrossRef]
  45. Grzebisz, W.; Diatta, J.; Barłóg, P.; Biber, M.; Potarzycki, J.; Łukowiak, R.; Przygocka-Cyna, K.; Szczepaniak, W. Soil fertility clock-crop rotation as a paradigm in nitrogen fertilizer productivity control. Plants 2022, 11, 2841. [Google Scholar] [CrossRef] [PubMed]
  46. Potarzycki, J.; Grzebisz, W.; Szczepaniak, W. Magnesium fertilization increases nitrogen use efficiency in winter wheat (Triticum aestivum L.). Plants 2022, 11, 2600. [Google Scholar] [CrossRef] [PubMed]
  47. Ram, S.; Malik, V.K.; Gupta, V.; Narwal, S.; Sirohi, M.; Ankush; Pandey, V.; Gupta, O.P.; Mista, A.K.; Singh, G. Impact of foliar application of iron and zinc fertilizers on grain iron, zinc and protein contents in bread wheat (Triticum aestivum L.). Front. Nutr. 2024, 11, 1378937. [Google Scholar] [CrossRef] [PubMed]
  48. Gonzalez, F.G.; Slader, G.A.; Miralles, D.J. Grain and floret number in response mto the photoperiod during stem elongation in fully and slightly nvernalized wheats. Field Crops Res. 2003, 81, 17–27. [Google Scholar] [CrossRef]
  49. Xie, Q.; Mayes, S.; Sparkes, D.L. Preanthesis biomass accumulation and plant organs defines yield components in wheat. Eur. J. Agron. 2016, 81, 15–26. [Google Scholar] [CrossRef]
  50. Dreccer, M.F.; Wockner, K.B.; Palta, J.A.; McIntyre, C.L.; Borgognone, M.G.; Bourgault, M.; Reynolds, M.; Miralles, D.J. More fertile florests and grains per spike can be achieved at higher temperature in wheat lines with high spike biomass and sugar content at booting. Funct. Plant Biol. 2014, 41, 482–495. [Google Scholar] [CrossRef] [PubMed]
  51. Körner, C. Paradigm shift in plant growth control. Curr. Opin. Plant Biol. 2015, 25, 107–114. [Google Scholar] [CrossRef] [PubMed]
  52. Slafer, G.A.; Elia, M.; Savin, R.; García, G.A.; Terrile, I.I.; Ferrante, A.; Miralles, D.J.; González, F.G. Fruiting efficiency: An alternative trait to further rise in wheat yield. Food Energy Secur. 2015, 4, 92–109. [Google Scholar] [CrossRef]
  53. Fradgley, N.S.; Bentley, A.R.; Swarbreck, S.M. Defining the physiological determinants of low nitrogen requirement in wheat. Bioch. Soc. Trans. 2021, 49, 609–616. [Google Scholar] [CrossRef] [PubMed]
  54. Grzebisz, W.; Łukowiak, R.; Kotnis, K. Evaluation of nitrogen fertilization systems based on the in-season variability of the nitrogenous growth factors and soil fertility factors—A case of winter oilseed rape (Brassica napus L.). Agronomy 2020, 10, 1701. [Google Scholar] [CrossRef]
  55. White, P.J. Calcium. In Handbook of Plant Nutrition, 2nd ed.; Barker, A.V., Pilbeam, D.J., Eds.; CRC Press, Taylor and Francis Group: Bocan Raton, FL, USA, 2015; pp. 165–198. [Google Scholar]
  56. Liu, Y.; Xu, G. Nitrogen-iron interaction as an emerging factor influencing crop productivity and nutrient use efficiency. Mol. Plant 2023, 16, 1727–1729. [Google Scholar] [CrossRef] [PubMed]
  57. Liu, D.-Y.; Liu, Y.-M.; Zhang, W.; Chen, X.-P.; Zou, C.-Q. Zinc uptake, translocation, and remobilization in winter wheat as affected by soil application of Zn fertilizer. Front. Plant Sci. 2019, 10, 426. [Google Scholar] [CrossRef] [PubMed]
Figure 1. Winter wheat in the full flowering phase—the layered structure of ears in the canopy. [Photo by Witold Grzebisz].
Agronomy 14 03018 g001
Figure 2. The daily mean air temperature and precipitation at the Smolice Experimental Station during the study.
Agronomy 14 03018 g002
Figure 3. The redistribution of nutrients taken up by winter wheat plants from the soil in the CCW. Legend: *, **—nutrient source, kg ha−1, macronutrients, micronutrients, respectively; LE—leaves; ST—stems, SOIL—soil.
Agronomy 14 03018 g003
Figure 4. Percentage of individual nutrient sources in the ear of winter wheat in the full flowering phase. Legend: *—nutrient share; LE—leaves; ST—stems, SOIL—soil.
Agronomy 14 03018 g004
Table 1. The agrochemical soil characteristics in consecutive growing seasons 1,2,3,4.
Soil, cmpHCorg
%
PKMgCaCuMnZnFeNmin
mg kg−1kg ha−1
2013/2014
0–306.91.3234 VH 5231 H105 M988 L0.4 L27.2 L3.6 M536 H86.4
30–606.71.1234 VH237 H103 VM876 L0.4 L25.7 L3.5 M541 H
2014/2015
0–30 7.12.2185 VH185 M165 MVH2045 M3.5 M85.5 M6.3 H268 M129.0
30–607.22.1161 VH157 M155 VH2063 M3.5 M93.8 M5.6 H269 M
2015/2016
0–30 6.61.6202 VH281 VH165 VH1480 L2.8 M61.9 M6.1 H347 M110.0
30–606.61.4139 VH222 VH163 VH1504 L2.5 M62.0 M3.7 M231 M
1 1.0 M KCl soil/solution ratio of 1:2.5, m/v. 2 Loss on ignition. 3 Mehlich 3 [27]. 4 0.01 dm−3 CaCl2, soil/solution ratio of 1:5, m/v. 5 Availability classes: VL, very low; L, low; M, medium; H, high; VH, very high [28,29,30].
Table 2. The mass of nutrients in winter wheat ears in the full flowering phase: BBCH 65.
Factor Level of FactorNPKMgCaFeMnZnCu
kg ha−1g ha−1
Year201469.6c11.6b53.2a5.71b0.54c131.8b155.3b132.1b12.7b
(Y)201593.3b10.0b43.4b3.40c0.94b114.5c61.3c87.8c12.8b
2016120.8a21.5a54.0a12.40a1.08a230.0a175.9a148.2a22.4a
Fc, p46.4 ***143 ***12.8 ***363 ***92.6 ***90.9 ***138 ***41.6 ***84.2 ***
Nitrogen 063.9c10.4c33.5c5.46c0.58c111.1d85.5d77.4c11.5d
Rates (N)4076.5c12.4bc40.2c6.35b0.72b130.5cd109.6c95.1bc14.5c
kg N ha−18093.5b13.4b48.0b6.54b0.80b143.8c124.9bc115.1b15.7bc
120107.1ab16.3a57.7a7.93a0.96a173.2b141.9ab142.0a17.1ab
160110.7a16.2a60.3a8.10a0.96a180.7ab150.1a147.5a19.3a
200105.3ab16.1a57.6a7.99a0.98a194.3a145.6ab137.8a17.6ab
240105.1ab15.6a54.1ab7.81a0.95a177.7b158.3a144.1a16.1bc
Fc, p9.6 ***8.7 ***16.2 ***7.7 ***12.2 ***9.4 ***10.6 ***13.8 ***7.4 ***
Source variation for the studied interaction
Y × Nnsnsnsnsnsnsnsnsns
Similar letters in the column indicate a lack of significant differences between experimental treatments using Tukey’s test; *** indicates significant differences at p < 0.001; ns—nonsignificant. Legend: N, P, K, Mg, Ca, Fe, Mn, Zn, and Cu—nutrients.
Table 3. The balance of nutrients in leaves of winter wheat from the beginning of booting to full flowering.
Factor Level of FactorNPKMgCaFeMnZnCu
kg ha−1g ha−1
Year201434.64.7a31.9a0.00b−1.78b81.7a−13.3b15.4a4.4b
(Y)201541.62.2b−6.0c−3.33c−11.34c44.7b−27.9b2.8b1.2c
201640.53.2b17.1b2.84a1.07a1.7c16.5a21.5a7.2a
Fc. p 0.8 ns11.4 ***31.2 ***145.6 ***228 ***33.5 ***7.4 ***23.0 ***18.6 ***
Nitrogen 024.21.712.2−0.05−1.91a8.1b−1.65.42.0d
Rates (N)4032.53.214.10.48−2.47ab23.0ab2.111.43.5c
kg N ha−18038.83.214.2−0.13−3.48a–c48.1ab−6.713.04.8ab
12036.83.410.9−0.36−5.51c47.5ab−16.516.65.8a
16048.74.017.6−0.24−5.28bc58.0a−19.918.55.0ab
20045.44.011.3−0.47−4.96bc60.6a1.914.94.4bc
24045.93.920.1−0.37−4.50a–c53.8a−16.812.74.5bc
Fc. p 1.9 ns2.0 ns0.2 ns0.7 ns4.7 ***3.5 **0.6 ns1.9 ns2.9 **
Source variation for the studied interaction
Y × N nsnsns*****nsns*ns
Similar letters in the column indicate a lack of significant differences between experimental treatments using Tukey’s test; ***, **, and * indicate significant differences at p < 0.001, p < 0.01, and p < 0.05, respectively; ns—nonsignificant. Legend: N, P, K, Mg, Ca, Fe, Mn, Zn, and Cu—nutrients.
Table 4. The balance of nutrients in the stems of winter wheat from the beginning of booting to full flowering.
Factor Level of FactorNPKMgCaFeMnZnCu
kg ha−1g ha−1
Year201435.1b4.58a21.0a−1.88a0.82a79.1a−125.1b−16.8c−4.7b
(Y)20156.5c0.90b−29.7b−4.35b−2.77c−118.6b38.4a13.7b−5.3b
201652.6a4.58a21.2a−9.69c−0.65b81.5a22.7a52.5a7.3a
Fc, p51.0 ***30.1 ***37.7 ***217 ***295 ***79.4 ***112 ***97.4 ***117 ***
Nitrogen 022.5ab0.24c−4.0c−4.81−1.02ab−6.1−23.7ab−3.6c−3.4b
Rates (N)4018.7b4.61a16.4ab−4.06−0.72a15.8−13.7ab8.2bc−1.6b
kg N ha−18039.5a4.47ab20.5a−5.39−0.83a–c38.2−16.4ab34.6a4.2a
12036.3ab2.03bc−9.7bc−6.82−1.20c43.8−60.8b9.3bc−0.7b
16033.5ab3.34ab−8.5bc−6.37−1.03bc−34.4−40.5b19.4a–c−2.7b
20033.4ab4.21ab−1.8bc−5.24−0.74a–c27.015.0a24.7ab−2.4b
24036.0ab4.58a16.4ab−4.44−0.54a13.8−9.2ab22.6ab0.2ab
Fc, p2.4 *7.7 ***3.2 **5.8 ***2.0 ns1.9 ns3.5 **5.5 ***8.1 ***
Source variation for the studied interaction
Y × N**************************
Similar letters in the column indicate no significant differences between experimental treatments using Tukey’s test; ***, **, and * indicate significant differences at p < 0.001, p < 0.01, and p < 0.05, respectively; ns—nonsignificant. Legend: N, P, K, Mg, Ca, Fe, Mn, Zn, and Cu—nutrients.
Table 5. Soil nutrient uptake by winter wheat from the beginning of booting to full flowering.
Factor Level of FactorNPKMgCaFeMnZnCu
kg ha−1g ha−1
Year2014−0.2b2.2c −0.1b7.6c1.5b−28.9c292.4a133.0a13.0ab
(Y)201545.2a6.9b79.1a11.1b15.0a188.4a50.7c71.4b16.9a
201627.7ab13.7a15.6b19.2a0.7b146.8a136.8b74.2b7.9b
Fc. p 5.9 *32.9 ***17.7 ***67.2 ***215 ***24.0 ***30.5 ***17.8 ***9.2 ***
Nitrogen 017.18.223.410.3b3.5c109.3107.874.4c12.6
Rates (N)4025.24.69.79.9b3.9bc91.7121.275.4c12.6
kg N ha−18015.15.813.312.0ab5.1a–c57.5148.167.6cd6.7
12034.010.956.515.1a7.7a81.9219.2116.1a12.0
16028.48.951.214.7ab7.3ab157.1210.5109.5ab17.0
20026.57.948.113.7ab6.7a–c106.8128.698.2b15.7
24023.27.217.512.6ab6.0a–c110.2184.4108.7ab11.5
Fc. p 0.2 ns1.8 ns1.7 ns3.3 *3.8 **1.5 ns1.8 ns2.5 *1.4 ns
Source variation for the studied interaction
Y × Nnsnsns**ns***nsns****
Similar letters in the column indicate a lack of significant differences between experimental treatments using Tukey’s test; ***, **, and * indicate significant differences at p < 0.001, p < 0.01, and p < 0.05, respectively; ns—nonsignificant. Legend: N, P, K, Mg, Ca, Fe, Mn, Zn, and Cu—nutrients.
Table 6. The nutrient economy of winter wheat in the Critical Cereal Window.
Growing Nutrient Sources for the Growing Ear—SummaryNutrient Invested in Vegetative Organs
SeasonType of SourceSource Sources
Year Acronymof NutrientsNutrientsLeaves (LE)Stems (ST)
2014MultiALE + ST + SOP
Double—VEBLE + STN, Fe, KCa, MnMg, Mn, Zn, Cu
Double—SOLECSO + LEZn, Cu
Single—STDSTCa
Single—SOESO Mg, Mn
2015 MultiALE + ST + SON, P, Zn
Double—SOLECSO + LEFe, CuK, Mg, Ca, MnK, Mg, Ca, Fe, Cu
Double—SOSTDSO + STMn
Single ESO K, Mg, Ca
2016MultiALE + ST + SON, P, K, Mn, Zn, Cu
Double—SOLECSO + LEMgMg, Ca
Double—SOST
Single—LE
D
F
SO + ST
LE
Fe
MeanMultiALE + ST + SON, P, K, Fe, Zn
2014—Double—SOLECSO + LECuMg (trace), Ca, MnMg, Mn, Cu
2016SingleESOMg, Ca, Mn
Legend: LE—leaves; ST—stems; SO—soil.
Disclaimer/Publisher’s Note: The statements, opinions and data contained in all publications are solely those of the individual author(s) and contributor(s) and not of MDPI and/or the editor(s). MDPI and/or the editor(s) disclaim responsibility for any injury to people or property resulting from any ideas, methods, instructions or products referred to in the content.

