Article

Exogenous 24-Epibrassinolide Improves Resistance to Leaf Spot Disease Through Antioxidant Regulation and Phenylpropanoid Metabolism in Oats

1
College of Pratacultural Science, Gansu Agricultural University, Lanzhou 730070, China
2
National Center of Pratacultural Technology Innovation (Under Preparation), Hohhot 010050, China
3
Key Laboratory of Superior Forage Germplasm in the Qinghai-Tibetan Plateau, Academy of Animal Husbandry and Veterinary Sciences, Qinghai University, Xining 810016, China
*
Author to whom correspondence should be addressed.
Agronomy 2024, 14(12), 3035; https://doi.org/10.3390/agronomy14123035
Submission received: 24 November 2024 / Revised: 11 December 2024 / Accepted: 17 December 2024 / Published: 19 December 2024

Abstract

:
Leaf spot disease has become a significant limitation in oat production. 24-epibrassinolide (EBR), a highly active brassinosteroid, plays a significant role in enhancing plant immunity against various diseases by modulating physiological and molecular responses. However, the exact mechanisms by which exogenous EBR regulates plant defense to leaf spot disease are still largely unknown. In this study, we applied various concentrations of EBR (0, 0.01, 0.1, 1, and 10 mg·L−1) to the leaves of oat plants that were inoculated with the Drechslera avenae pathogen. The application of 1 mg·L−1 EBR significantly decreased disease index and increased chlorophyll content under pathogen inoculation while also enhancing antioxidant enzyme (SOD, CAT, and APX) activity and reducing pathogen-induced O2•− production rate and MDA content. Moreover, the enzymes associated with phenylpropanoid metabolism, such as PAL, C4H, and 4CL, were significantly activated by exogenous EBR. Our transcriptomic analyses further revealed that the combination of exogenous EBR and pathogen inoculation upregulated genes involved in signal transduction (BR, ABA, and MAPK), antioxidant enzyme defense systems, and phenylpropanoid and lignin-specific pathways, such as BAS1, APX, GPX, PAL, C4H, 4CL, CCR1, and CAD. Together, these findings reveal that exogenous BR application can improve resistance to Drechslera avenae-induced leaf spot disease in oats by regulating antioxidant defense systems and phenylpropanoid metabolism, which may have the potential to control leaf spot disease in oat production.

1. Introduction

Oats (Avena sativa) are among the most valuable crops for cultivation and livestock feeding, known for their high forage yield, palatability, high crude protein content, digestible fiber, and superior feed quality [1,2,3]. As one of the world’s most important feed resources, oats also significantly contribute to the agricultural sector. However, disease incidence has become a major factor that impacts oat yield and quality production. In particular, leaf spot disease is especially prevalent [4]. This disease has a high incidence rate and has been documented across major oat-producing regions worldwide [5]. Currently, research on managing oat leaf spot disease, primarily caused by Drechslera avenae, is limited, and most control methods rely on chemical fungicides. However, excessive use of these fungicides may lead to harmful residues in agricultural soils that negatively affect oat crops and potentially pose risks to human health and environmental safety [6]. Given these concerns, it is imperative that we urgently develop effective, environmentally friendly approaches to manage oat leaf spot disease.
Plant growth regulators, such as phytohormones, help plants to induce defense responses against various pathogens [7,8]. Brassinosteroids (BRs), a class of polyhydroxylated steroid phytohormones, are natural, nontoxic, and eco-friendly and could theoretically be used in agriculture to promote growth and yields, as well as plant defense against biotic and abiotic stress tolerance [9,10]. Previously, it was demonstrated that BRs play a role in systemic acquired resistance (SAR) and can enhance induced systemic resistance (ISR) by priming plants to respond more robustly to subsequent pathogen attacks [11]. In Arabidopsis thaliana, BR signaling interacts with immune receptors like FLS2 to mediate PTI responses. In particular, they selectively associate with PTI responses by interacting with PEPR1 and EFR, which results in them playing an important role in the defense against multiple pathogens [12,13,14]. Likewise, overexpression of Bri1-associated kinase 1-interacting receptor-like kinase (SlBIR3) also resulted in enhanced susceptibility to the necrotrophic fungus Botrytis cinerea in tomatoes (Solanum lycopersicum) [15]. Additionally, it has also been found in rice that BR application induced resistance to rice blast and bacterial blight diseases caused by Magnaporthe grisea and Xanthomonas oryzae, respectively [11].
When it comes to plant immunity, increasing evidence suggests that using exogenous BR application, such as 24-epibrassinolide (EBR), can induce plant defense response to various pathogen interactions to effectively control disease [16,17,18]. These studies suggest that EBR-mediated defense response modulates reactive oxygen species (ROS), secondary metabolic pathways, and photosynthetic capacity. For instance, in tea (Camellia sinensis) plants, exogenous EBR enhanced defense against Colletotrichum gloeosporioides, which is associated with reducing H2O2 accumulation and promoting the phenylpropanoid pathway [19]. Likewise, it also induced CsMYB4 expression to possibly activate the transcription of CsPOD5, which is responsible for lignin biosynthesis in response to Colletotrichum fructicola [17]. Additionally, in melon (Cucumis melo) leaves, exogenous EBR can defend the photosynthetic structure from effective oxidation damage and trigger the stability of chlorophyll against downy mildew disease caused by Pseudoperonospora cubensis [16]. Moreover, exogenous EBR could be a promising strategy to increase resistance against Colletotrichum gloeosporioides in mango (Mangifera indica) fruits, which is strongly associated with improving defense enzyme activities involved in the ROS metabolism phenylpropanoid pathway [20]. Together, these mechanisms highlight the potential for EBR as an environmentally friendly solution to enhance plant resistance to diverse pathogens.
To the best of our knowledge, few studies have investigated BR application to control leaf spot disease in oats and its possible defense mechanisms. In this study, we investigated the influence of exogenous EBR on oat leaf spot disease caused by Drechslera avenae. Furthermore, we employed a comparative transcriptome analysis to determine defense enzyme activities and metabolites related to ROS metabolism and phenylpropanoid pathways. Our results could provide a potential strategy to control leaf spot disease in oats and deepen our understanding of how EBR application induces defense responses against pathogen attacks.

2. Materials and Methods

2.1. Plant Growth and Experimental Conditions

The seeds of oat cultivar ‘Molasses’ were sown in plastic pots (200 mm × 150 mm × 120 mm) containing a mixed medium (soil and vermiculite, 2:1) and cultivated in a growth chamber following a temperature cycle (25 °C/20 °C, day/night) under a 14 h photoperiod. The relative humidity was set to 65%.
Initial experiments were conducted to determine the optimal EBR concentration to apply to oat seedlings inoculated with pathogenic fungi with leaf spot disease (Drechslera avenae). Twelve days after planting, the seedlings were sprayed with different EBR concentrations (0, 0.01, 0.1, 1.0, 10.0 mg·L−1). The EBR solution was sprayed onto the leaves of oat plants using a hand-held sprayer to ensure uniform distribution. The plants were sprayed until the leaf surfaces were wet but not dripping. This method was repeated for all pots to maintain consistency in the treatment. For the control plants, an equal volume of distilled water was sprayed. The stock solution of EBR was prepared by dissolving the appropriate amount of EBR in ethanol to a final concentration of 1 mg·mL−1. This stock solution was further diluted with distilled water to achieve the desired experimental concentrations (e.g., 0.01, 0.1, 1.0, 10.0 mg·L−1) just before application to the plants. The 24-epibrassinolide used in this study was purchased from Beijing Coolabor Biotechnology Co. (Beijing, China), with a purity of >90%.
At 24 h after EBR application, seedlings were inoculated with Drechslera avenae using the spore suspension method [21]. Drechslera avenae was isolated and stored by our laboratory. A spore suspension of Drechslera avenae was prepared by first cultivating the fungus on potato dextrose agar (PDA) plates at 25 °C for seven days. The spores were then harvested by flooding the plates with sterile distilled water containing 0.05% Tween 20 and gently scraping the surface with a sterile glass rod. The spore suspension was filtered through four layers of cheesecloth and then adjusted to a concentration of 106 spores/mL. To obtain the spore concentration, a 10 µL aliquot of the spore suspension was loaded onto a hemocytometer, and the spores in five squares were counted at 400× magnification. The concentration of spores (conidia/mL) was calculated using the following formula: Spore Concentration (spores/mL) = (Number of spores counted/Number of squares counted) × Dilution factor × 104. The final concentration was adjusted to 106 spores/mL by diluting the suspension with sterile distilled water. After nine days of pathogen inoculation, the disease severity index was determined, and leaves were sampled for physiological index measurement. The untreated seedings with the pathogen inoculation were used as controls (CK). Three replicates were generated for each treatment (control and inoculated).
We also conducted an experiment to determine the effect of EBR on defense responses at the transcriptional level. The established seedlings were subjected to four treatments: (A) group: the control; (B) group: pathogen inoculation; (E) group: EBR application; and (F) group: the combination of EBR application and pathogen inoculation. EBR was applied at the optimal concentration at 1.0 mg·L−1. After the treatments were imposed, seedlings were grown for nine days, and the leaves were sampled and immediately frozen in liquid nitrogen and then stored at −80 °C for later RNA sequencing.

2.2. Measurement of Disease Index

The incidence of disease was assessed using a total of 20 leaves randomly selected from the lower, middle, and upper parts of the oat plant in each pot. Disease severity was scored according to a 0–4 scale: 0 = no visible disease (healthy); 1 = small lesions covering less than 10% of the leaf area; 2 = lesions covering 11–25% of the leaf area; 3 = lesions covering 26–50% of the leaf area; 4 = lesions covering more than 50% of the leaf area. After that, disease index was calculated according to the following formula: Disease Index = (∑ (severity score × number of leaves in that category))/(total number of leaves scored × maximum severity score) × 100.

2.3. Determination of Chlorophyll Content

A 0.5 g fresh sample was cut into small pieces and soaked in 8 mL of 95% ethanol for 24 h in a dark environment. The absorbance was then measured at 665 nm and 649 nm using an SP-756P UV spectrophotometer (Shanghai Spectrum Instruments Co., Shanghai, China). As a control, 95% ethanol was used as a blank to calculate chlorophyll content.

2.4. Determination of Antioxidant Enzyme Activity and ROS Production

To extract the crude enzyme solution, 8 mL of 50 mmol·L−1 phosphate buffer (pH 7.8) was added to 0.5 g of leaves, which were then thoroughly ground on ice. The homogenate was centrifuged at 12,000× g for 15 min at 4 °C using a high-speed refrigerated centrifuge. The resulting supernatant was used to measure antioxidant enzyme activity. The activities of superoxide dismutase (SOD), catalase (CAT), and ascorbate peroxidase (APX) were measured following the protocol outlined in our previous study [22].
A malondialdehyde (MDA) assay kit (Comin, Suzhou, China) and hydrogen peroxide (H2O2) assay kit (Comin, Suzhou, China) were used to determine MDA and H2O2 concentrations, respectively. To determine the •O2 production rate, 4 mL of 50 mmol·L−1 phosphate buffer (pH 7.8) was added to 0.5 g of leaves that were then thoroughly ground on ice. The mixture was then centrifuged at 5000× g for 15 min at 4 °C. Following this, 1 mL of 10 mmol·L−1 hydroxylamine hydrochloride and 0.5 mL of 50 mmol·L−1 phosphate buffer (pH 7.8) were added to 0.5 mL of the supernatant. After mixing, the solution was incubated at 25 °C for 1 h. Then, 1 mL of 17 mmol·L−1 p-aminobenzenesulfonamide and 1 mL of 7 mmol·L−1 α-naphthylamine were added, mixed, and left to react at 25 °C for 20 min. Finally, 2 mL of ether was added, and the mixture was centrifuged at 3000× g for 3 min. The pink layer was collected, and its absorbance was measured at 530 nm [22].

2.5. Determination of Enzyme Activity and Metabolite Content Related to Phenylpropane Metabolism

To determine phenylalanine ammonia-lyase (PAL) activity, 0.5 g of the sample was added to 5 mL of extraction buffer containing 50 mmol·L−1 boric acid-borax buffer (pH 8.8), 40 g·L−1 PVP, 2 mmol·L−1 EDTA, and 5 mmol·L−1 β-mercaptoethanol. For the reaction, each tube contained 3.5 mL of reaction solution (3.0 mL of 50 mmol·L−1 boric acid-borax buffer, pH 8.8, and 0.5 mL of 20 mmol·L−1 L-phenylalanine solution) and 0.5 mL of enzyme extract. The tubes were then incubated at 37 °C for 1 h, after which 1 mL of 6 mol·L−1 HCl was added to stop the reaction. Absorbance was measured at 290 nm.
To determine cinnamate-4-hydroxylase (C4H) and 4-coumarate ligase (4CL) activity, 5 mL of 50 mmol·L−1 Tris-HCl buffer (pH 7.5, containing 25% (v/v) glycerol and 0.1 mmol·L−1 DTT) was added to 0.5 g of the sample, which was then ground in an ice bath. For the C4H activity assay, 0.5 mL of crude enzyme extract was mixed with 1 mL of 50 mmol·L−1 phosphate buffer (pH 7.5) that contained 2 mmol·L−1 cinnamic acid and 0.5 mmol·L−1 NADPH. For the 4CL activity assay, 0.5 mL of crude enzyme extract was mixed with 1.5 mL of Tris-HCl buffer (pH 7.5) that contained 7.5 mmol·L−1 MgCl2, 1 mmol·L−1 CoA, 1 mmol·L−1 ATP, and 0.2 mmol·L−1 p-coumaric acid. Absorbances were measured at 290 nm and 333 nm, respectively.
For lignin content, 8 mL of 95% ethanol was added to 0.5 g of the sample and ground to form a homogenate. The supernatant was then discarded, and the precipitate was washed 3 times with 5 mL of 95% ethanol, then 3 times with a 1:2 (v/v) ethanol mixture. The precipitate was then allowed to air dry overnight. The dried precipitate was then dissolved in 2.5 mL of 25% bromoacetyl acetic acid solution at 70 °C for 30 min. Following this, 1 mL of 2 mol·L−1 NaOH was added to stop the reaction, as well as 0.1 mL of 7.5 mol·L−1 hydroxylamine hydrochloride and 5.4 mL of acetic acid. The absorbance of the supernatant was then measured at 280 nm.
For total phenol and flavonoid content, a small amount of 1% hydrochloric acid was added to a methanol solution along with 0.5 g of the sample, which was then ground into a homogeneous slurry on ice. The volume was then adjusted to 20 mL and extracted at 4 °C in the dark for 20 min. The mixture was then filtered to measure absorbances at 280 nm for total phenols and at 325 nm for flavonoids. A 1% HCl-methanol solution was used as a blank control.

2.6. RNA Sequencing and DEG Identification

Total RNA was extracted using TRIzol reagent (Invitrogen, Carlsbad, CA, USA) following the manufacturer’s protocol. RNA purity and concentration was assessed using a NanoDrop 2000 spectrophotometer (Thermo Scientific, Waltham, MA, USA). RNA integrity was then evaluated with an Agilent 2100 Bioanalyzer (Agilent Technologies, Santa Clara, CA, USA). Libraries were then constructed using the VAHTS Universal V6 RNA-seq Library Prep Kit according to the manufacturer’s instructions. Transcriptome sequencing and analysis were performed by OE Biotech Co., Ltd. (Shanghai, China) using the Illumina NovaSeq 6000 sequencing platform for all samples.
Raw reads in fastq format were processed using fastp software [23], and clean reads (free from low-quality sequences) were used for data analysis. Reference genome alignment was performed using HISAT2 software [24], while gene expression levels (FPKM) were calculated [25]. Read counts for each gene were then obtained using HTSeq-count [26]. Principal component analysis (PCA) and gene mapping (based on counts) were conducted using R (v 3.2.0) to evaluate biological replicates of the samples.
Differential expression gene (DEG) analysis was performed using DESeq 2 [27]. Gene expression ratios within the threshold of |log2(foldchange)| > 1 and Padj values < 0.05 were considered as DEGs. To further describe the function of DEGs, Gene Ontology (GO) classification and KEGG pathway enrichment were performed.

2.7. Gene Expression Confirmation

We randomly selected 20 genes from our transcriptome data for real-time quantitative PCR (qPCR) reverse validation. Primers of all selected genes were designed using the online Primer-BLAST tool in NCBI (https://www.ncbi.nlm.nih.gov/tools/primer-blast/ (accessed on 6 September 2023)) and are shown in Table A1. Actin was used as the internal reference gene. Total RNA isolation, cDNA synthesis, and the reaction system and program of qPCR analysis were performed following the protocol outlined in our previous study [28]. The relative expression levels of all target genes were evaluated using the 2−ΔΔCT method.

2.8. Statistical Analysis

To compare treatment effects, a one-way analysis of variance (ANOVA) was performed using SPSS 19.0 (IBM, Armonk, NY, USA). A significance level of p < 0.05 was considered statistically significant. All data are presented as means ± standard deviation (SD).

3. Results

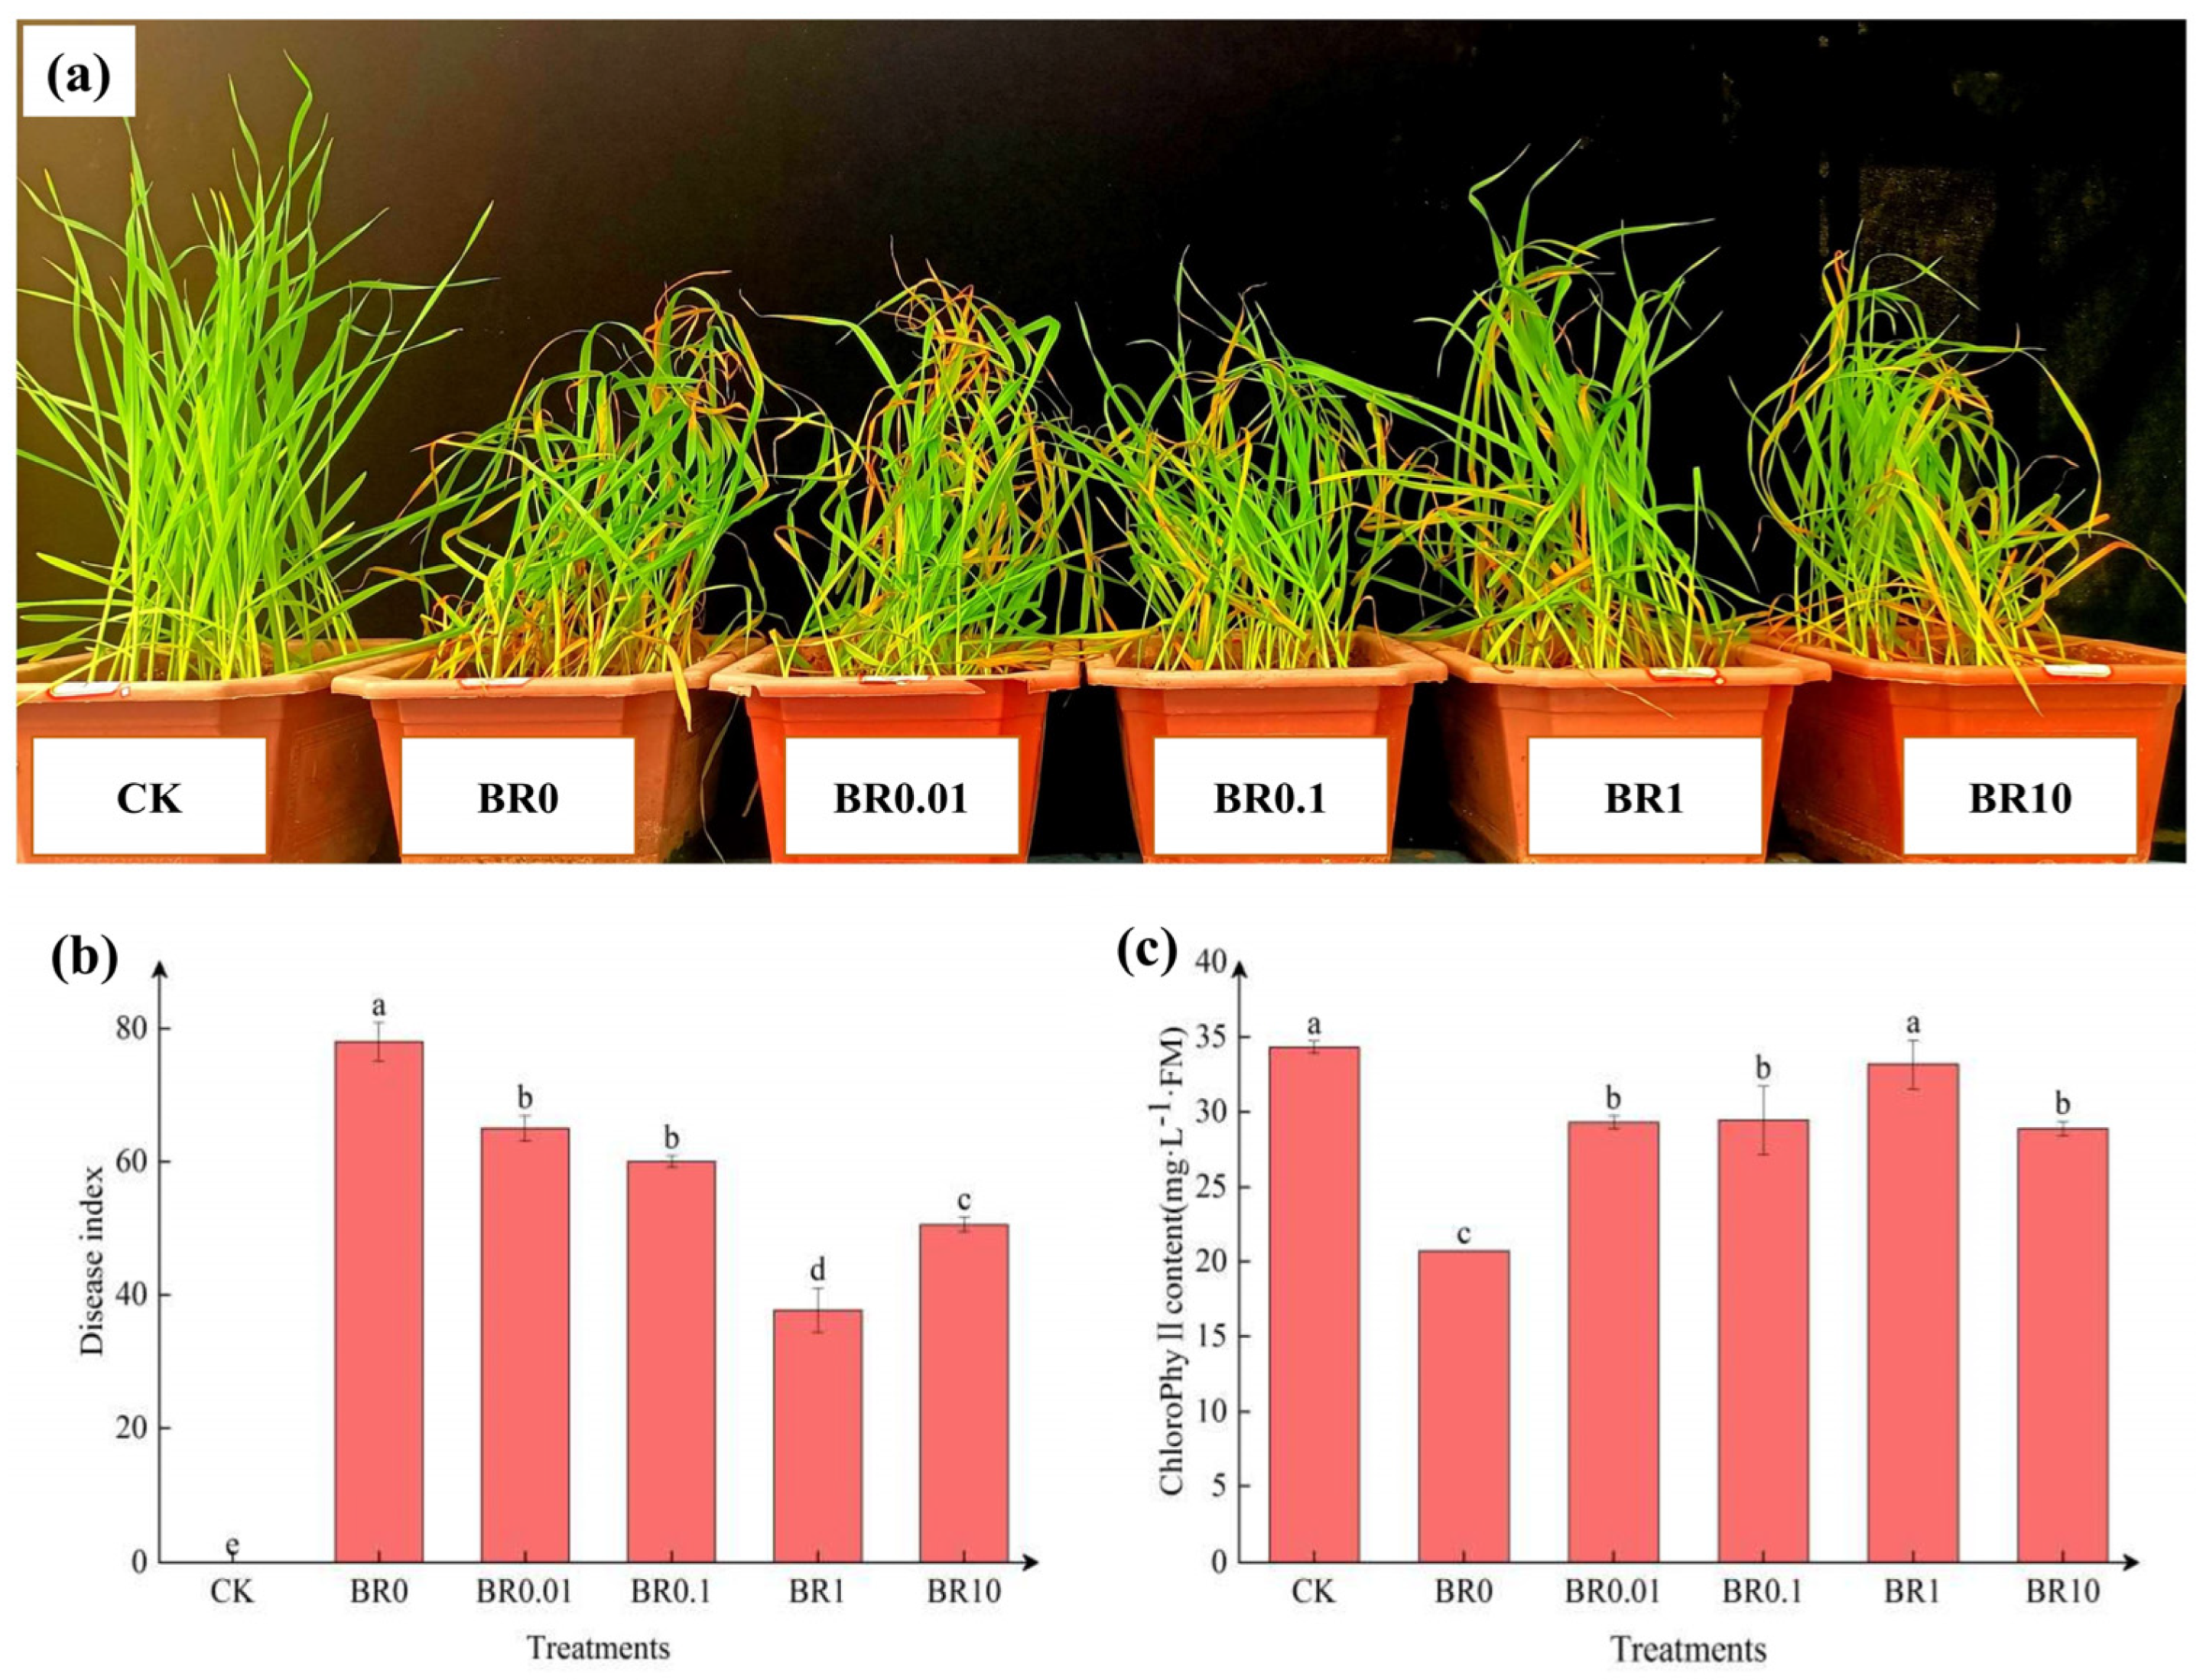
3.1. Effect of Exogenous EBR on Disease Index and Chlorophyll Content

As shown in Figure 1a, pathogen infection led to yellowing and weakened growth in oat leaves. The application of exogenous EBR was able to induce resistance in oats against leaf spot disease to help alleviate these symptoms, especially with the BR1 treatment. After 9 days of inoculation with the pathogenic fungus, the disease index increased significantly across all treatments compared with CK (Figure 1b). Different concentrations of exogenous EBR initially showed a trend of decreasing the disease index, but then it increased over time. The lowest disease index was observed in the BR1 treatment, which reduced the disease index by 51.60% compared to the pathogen inoculation alone (BR0).
In addition, the chlorophyll content in the oat leaves declined significantly after pathogen inoculation (Figure 1c). Compared to the control (CK), pathogen inoculation (BR0) resulted in a 39.64% reduction in chlorophyll content. However, when exogenous EBR (0.01~10 mg·L−1) was applied, the chlorophyll content significantly increased compared to the BR0 treatment, and the highest level was observed with the BR1 treatment.

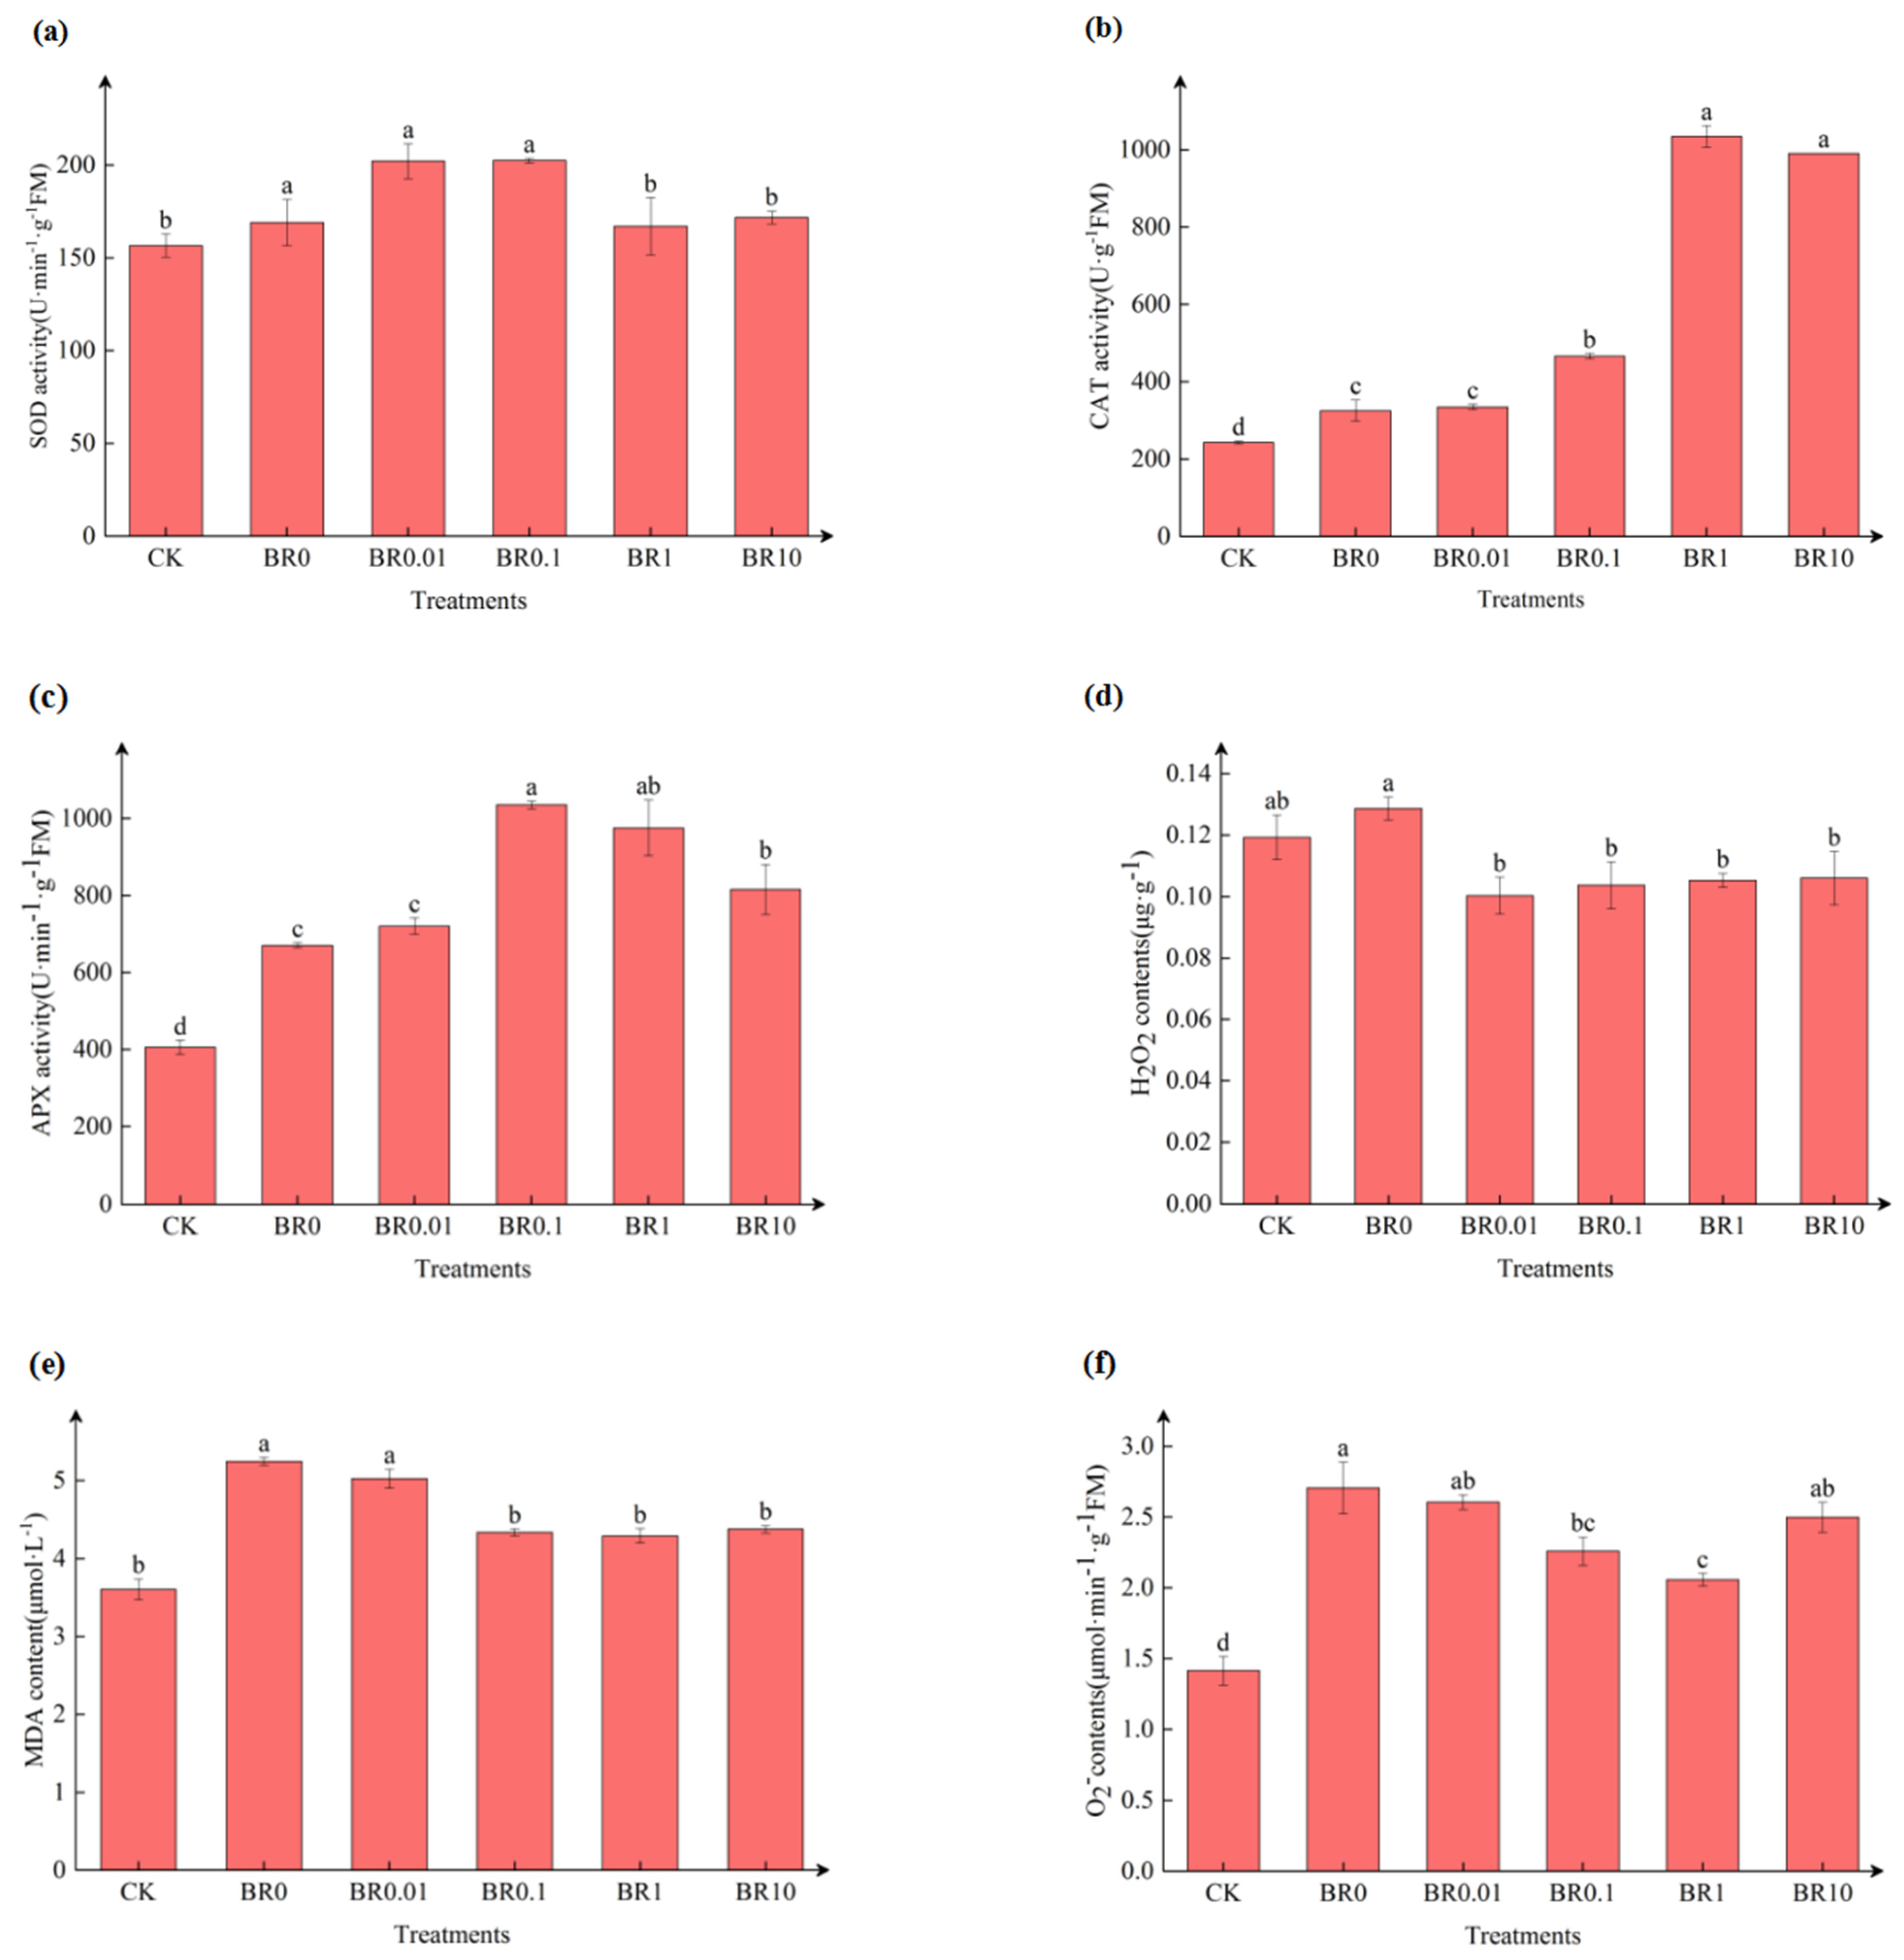
3.2. Effect of Exogenous EBR on Antioxidant Enzyme Activity and ROS Production

Pathogen inoculation alone significantly increased the activities of CAT and APX by 33.80%, and 65.16%, respectively, compared to the control (CK) (Figure 2b,c). Under the BR0.1 treatment, SOD and APX activities reached their peaks at 202.50 U·min−1·g−1 and 1034.83 U·min−1·g−1, respectively, and showed a 19.75% and 54.34% increase compared to the BR0 treatment (Figure 2a,c). The activity of CAT was highest under the BR1 treatment, with a total increase in activity of 218.03% over the BR0 treatment (Figure 2b). Additionally, we found that pathogen infection alone (BR0) led to an increase in •O2 production rate and H2O2 and MDA contents, by 91.33%, 7.88%, and 45.64%, respectively (Figure 2d–f). In contrast to the BR0 treatment, the application of exogenous EBR at 1.0 mg·L−1 significantly induced a reduction in •O2 production rate, H2O2, and MDA contents.

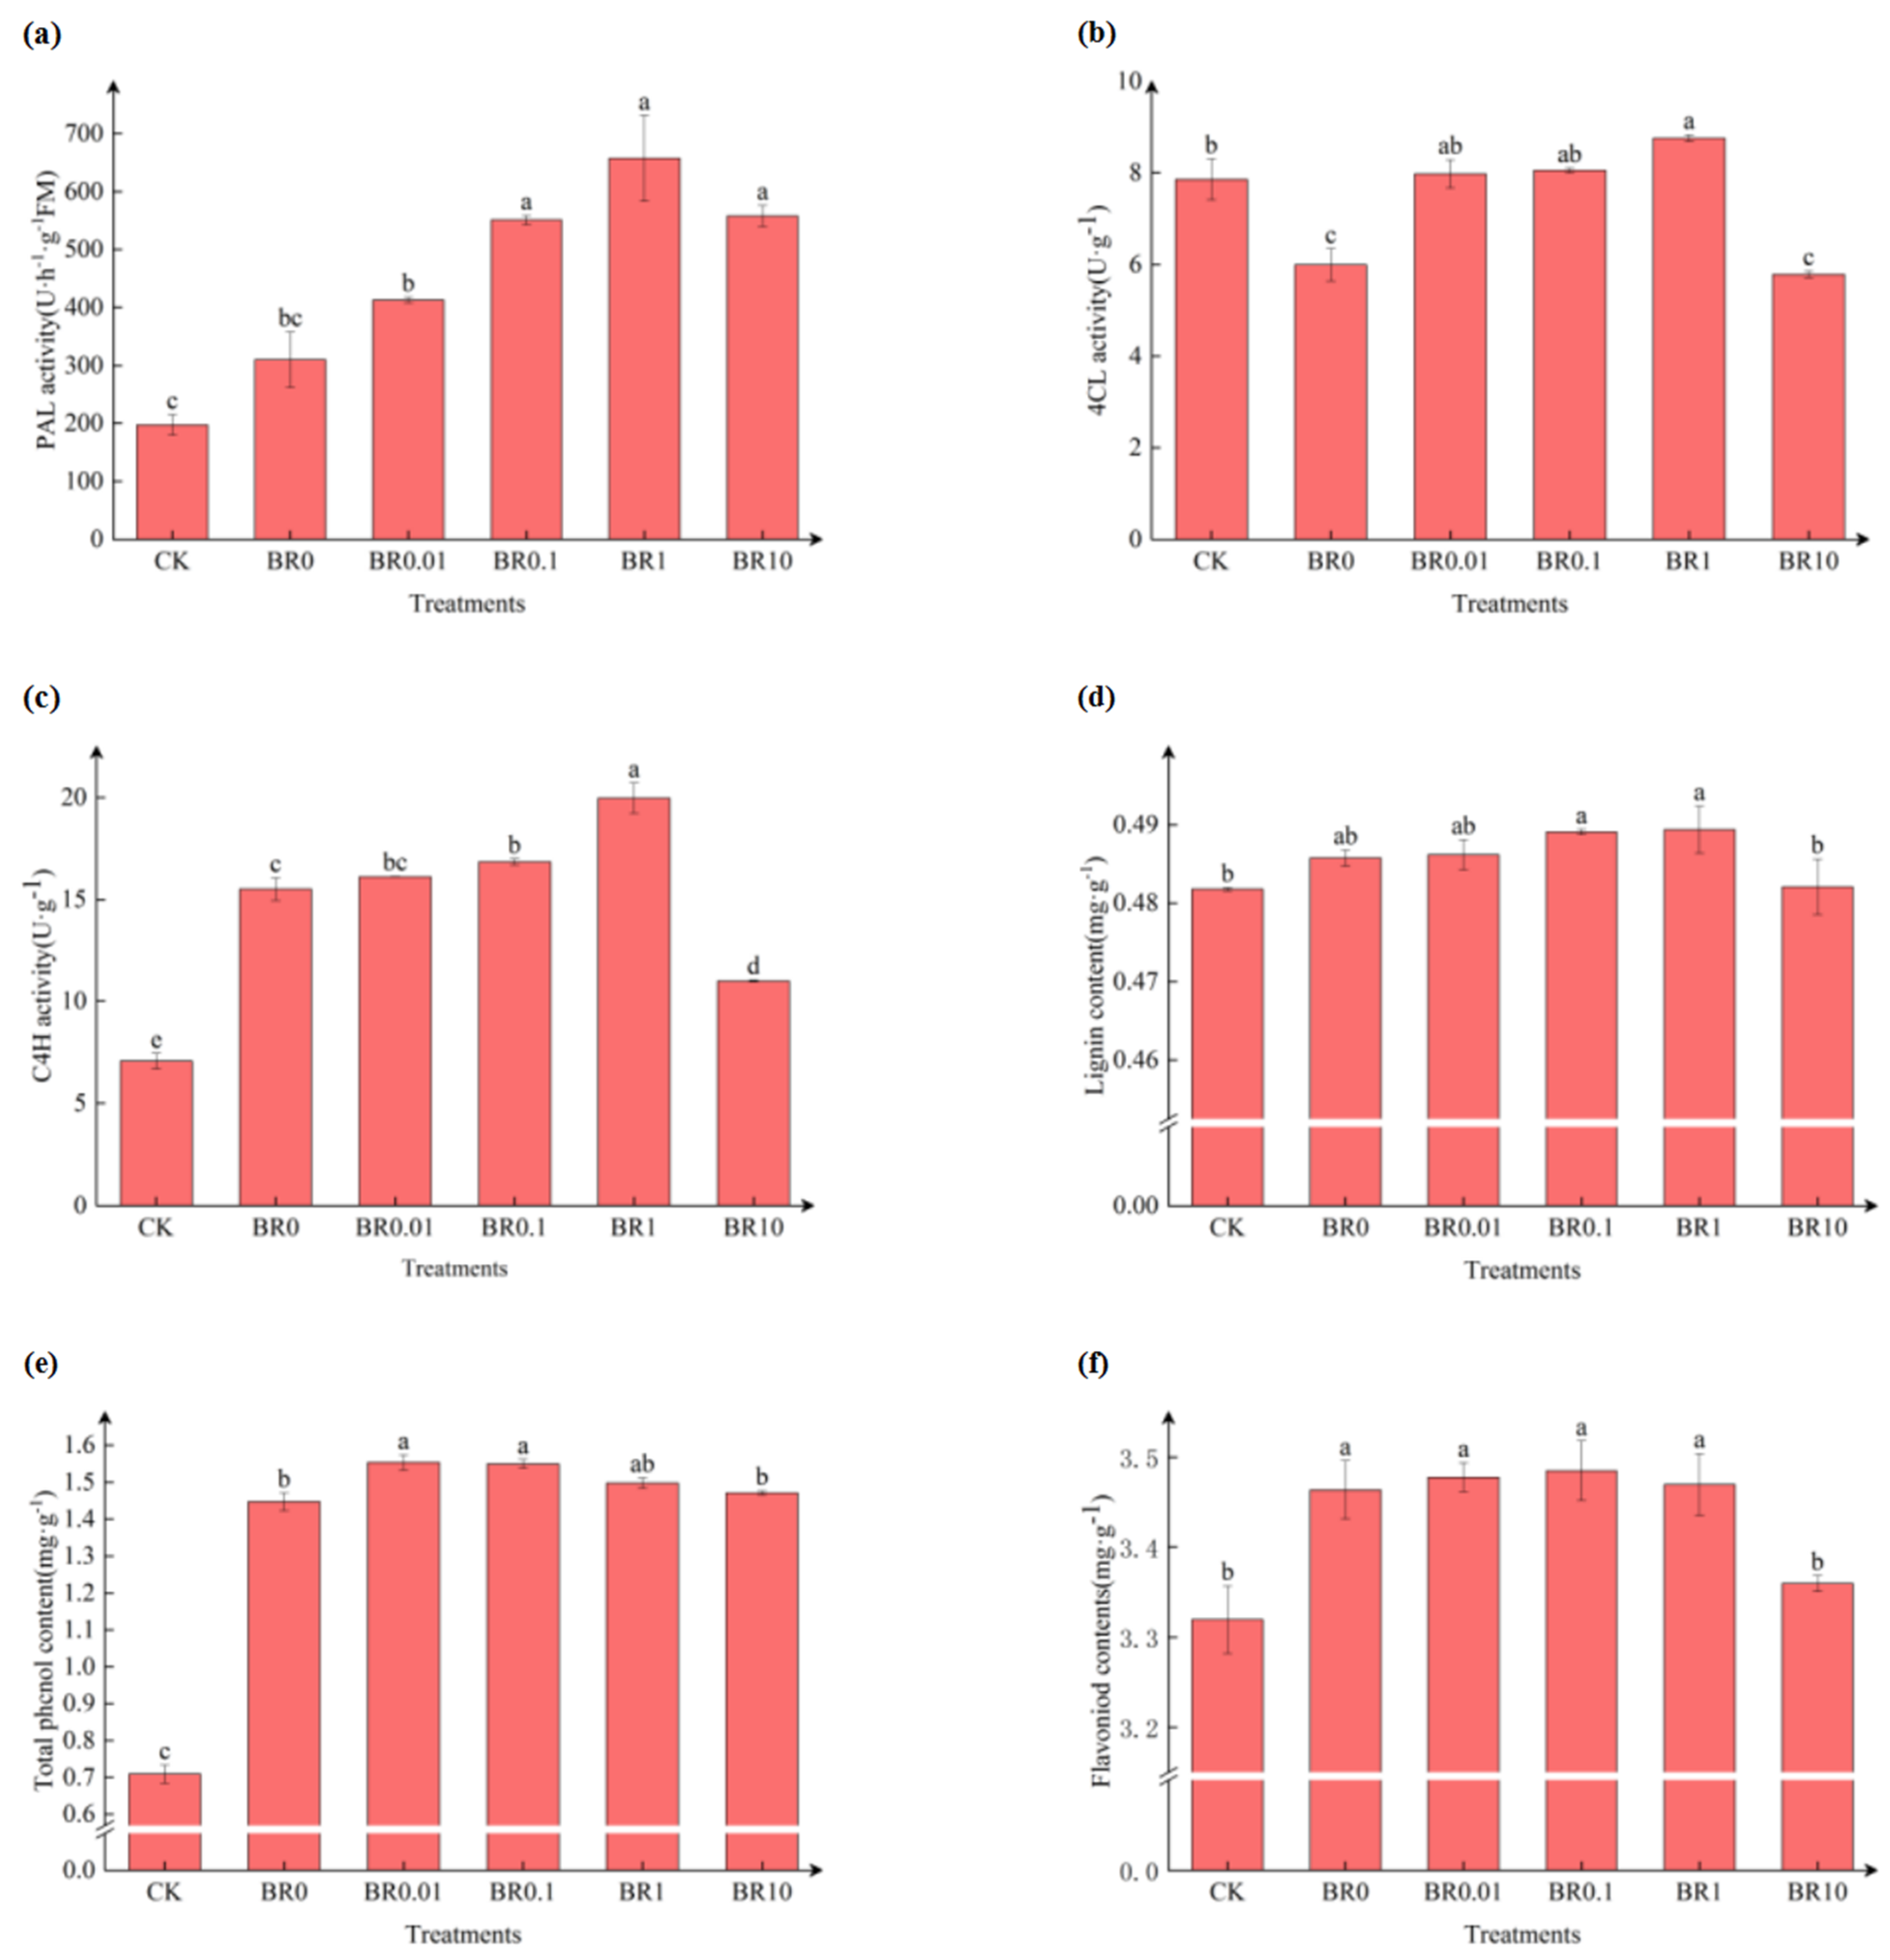
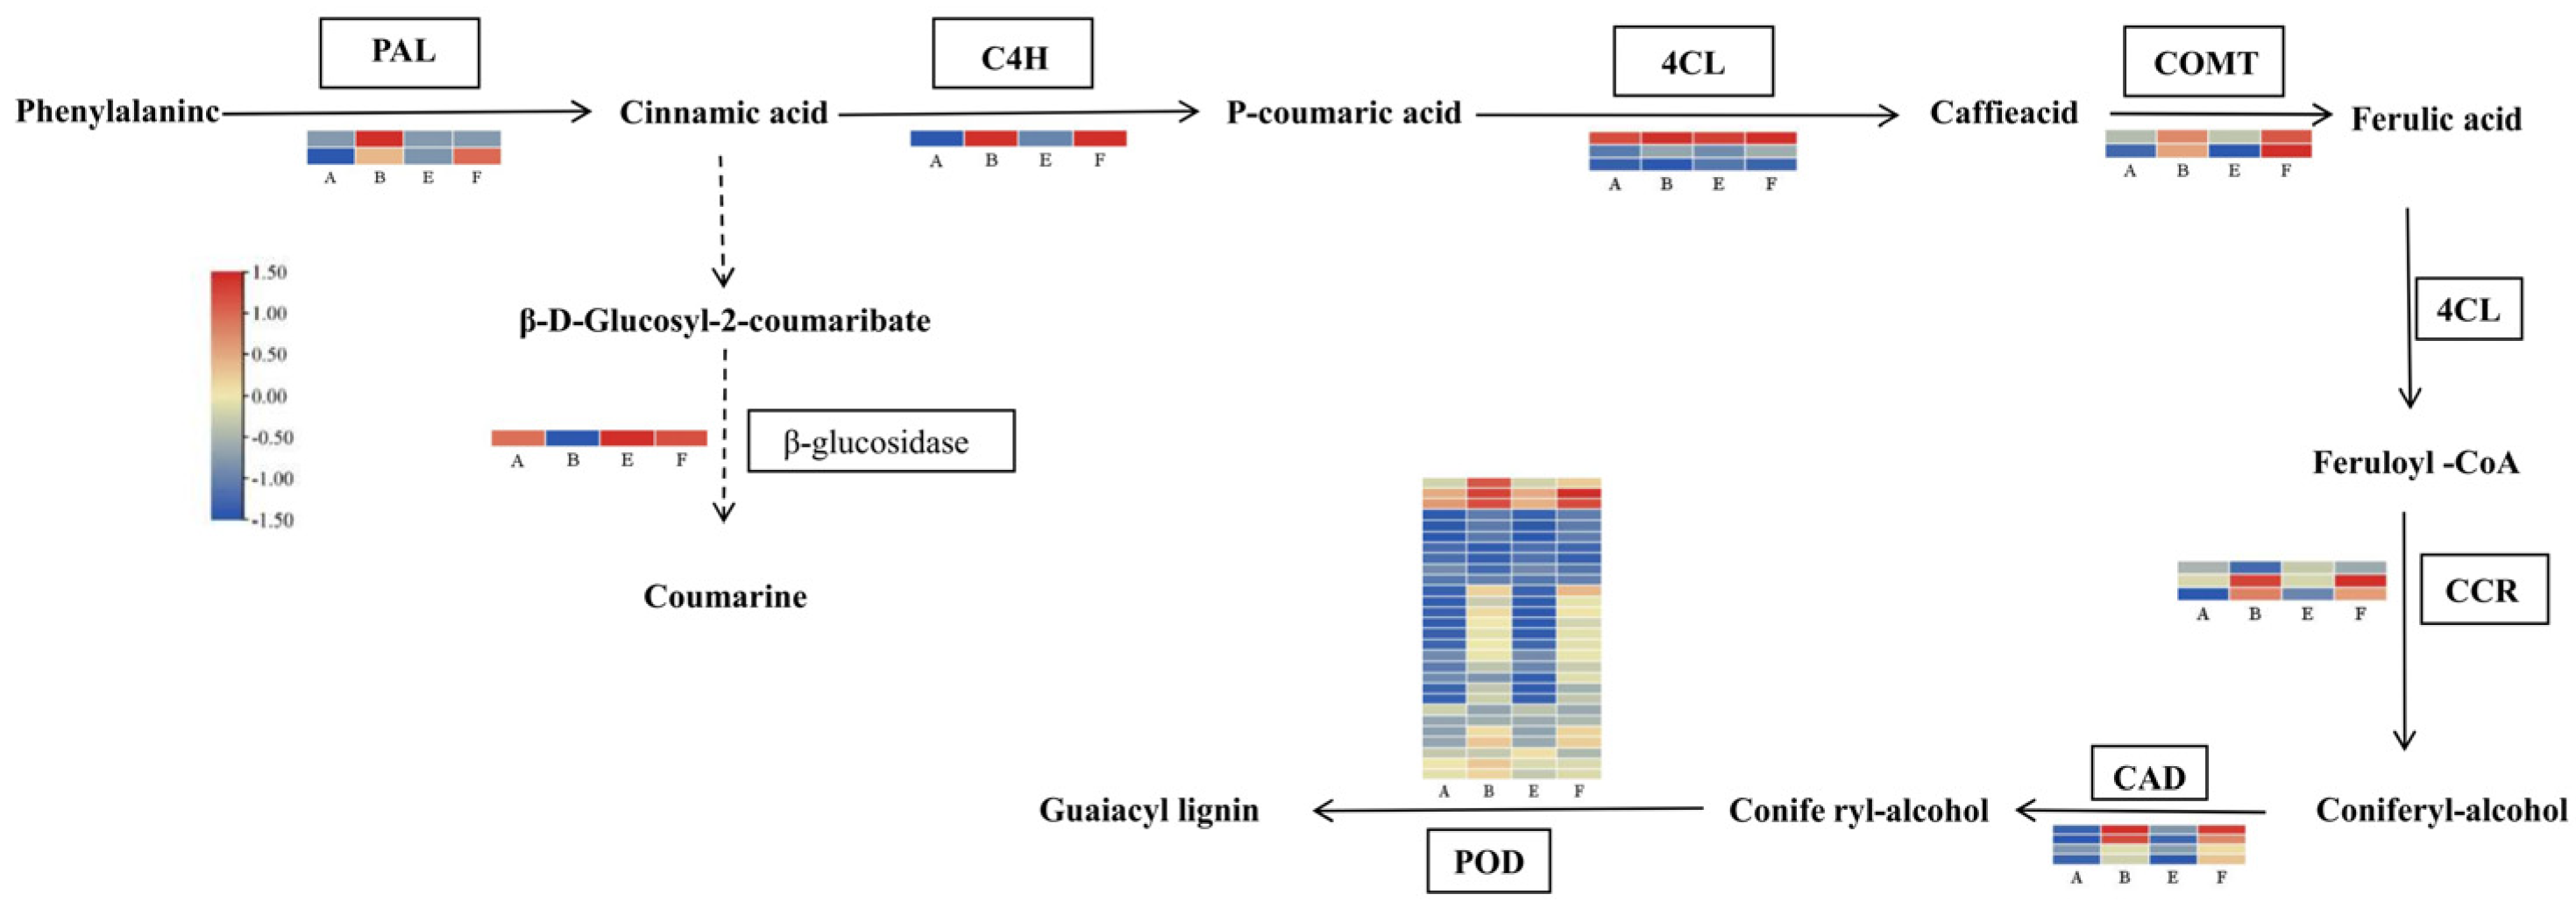
3.3. Effect of Exogenous EBR on Enzyme Activity and Metabolite Contents for Phenylpropanoid Metabolism

Pathogen inoculation alone significantly increased PAL and C4H activities as well as lignin, flavonoid, and total phenolic contents compared to the control (CK) (Figure 3). The application of exogenous EBR activated the increase of these enzyme activities, particularly in the BR1 treatment. However, the lignin and total phenolic content in the BR1 treatment showed a slight increase compared to the pathogen inoculation treatment alone.

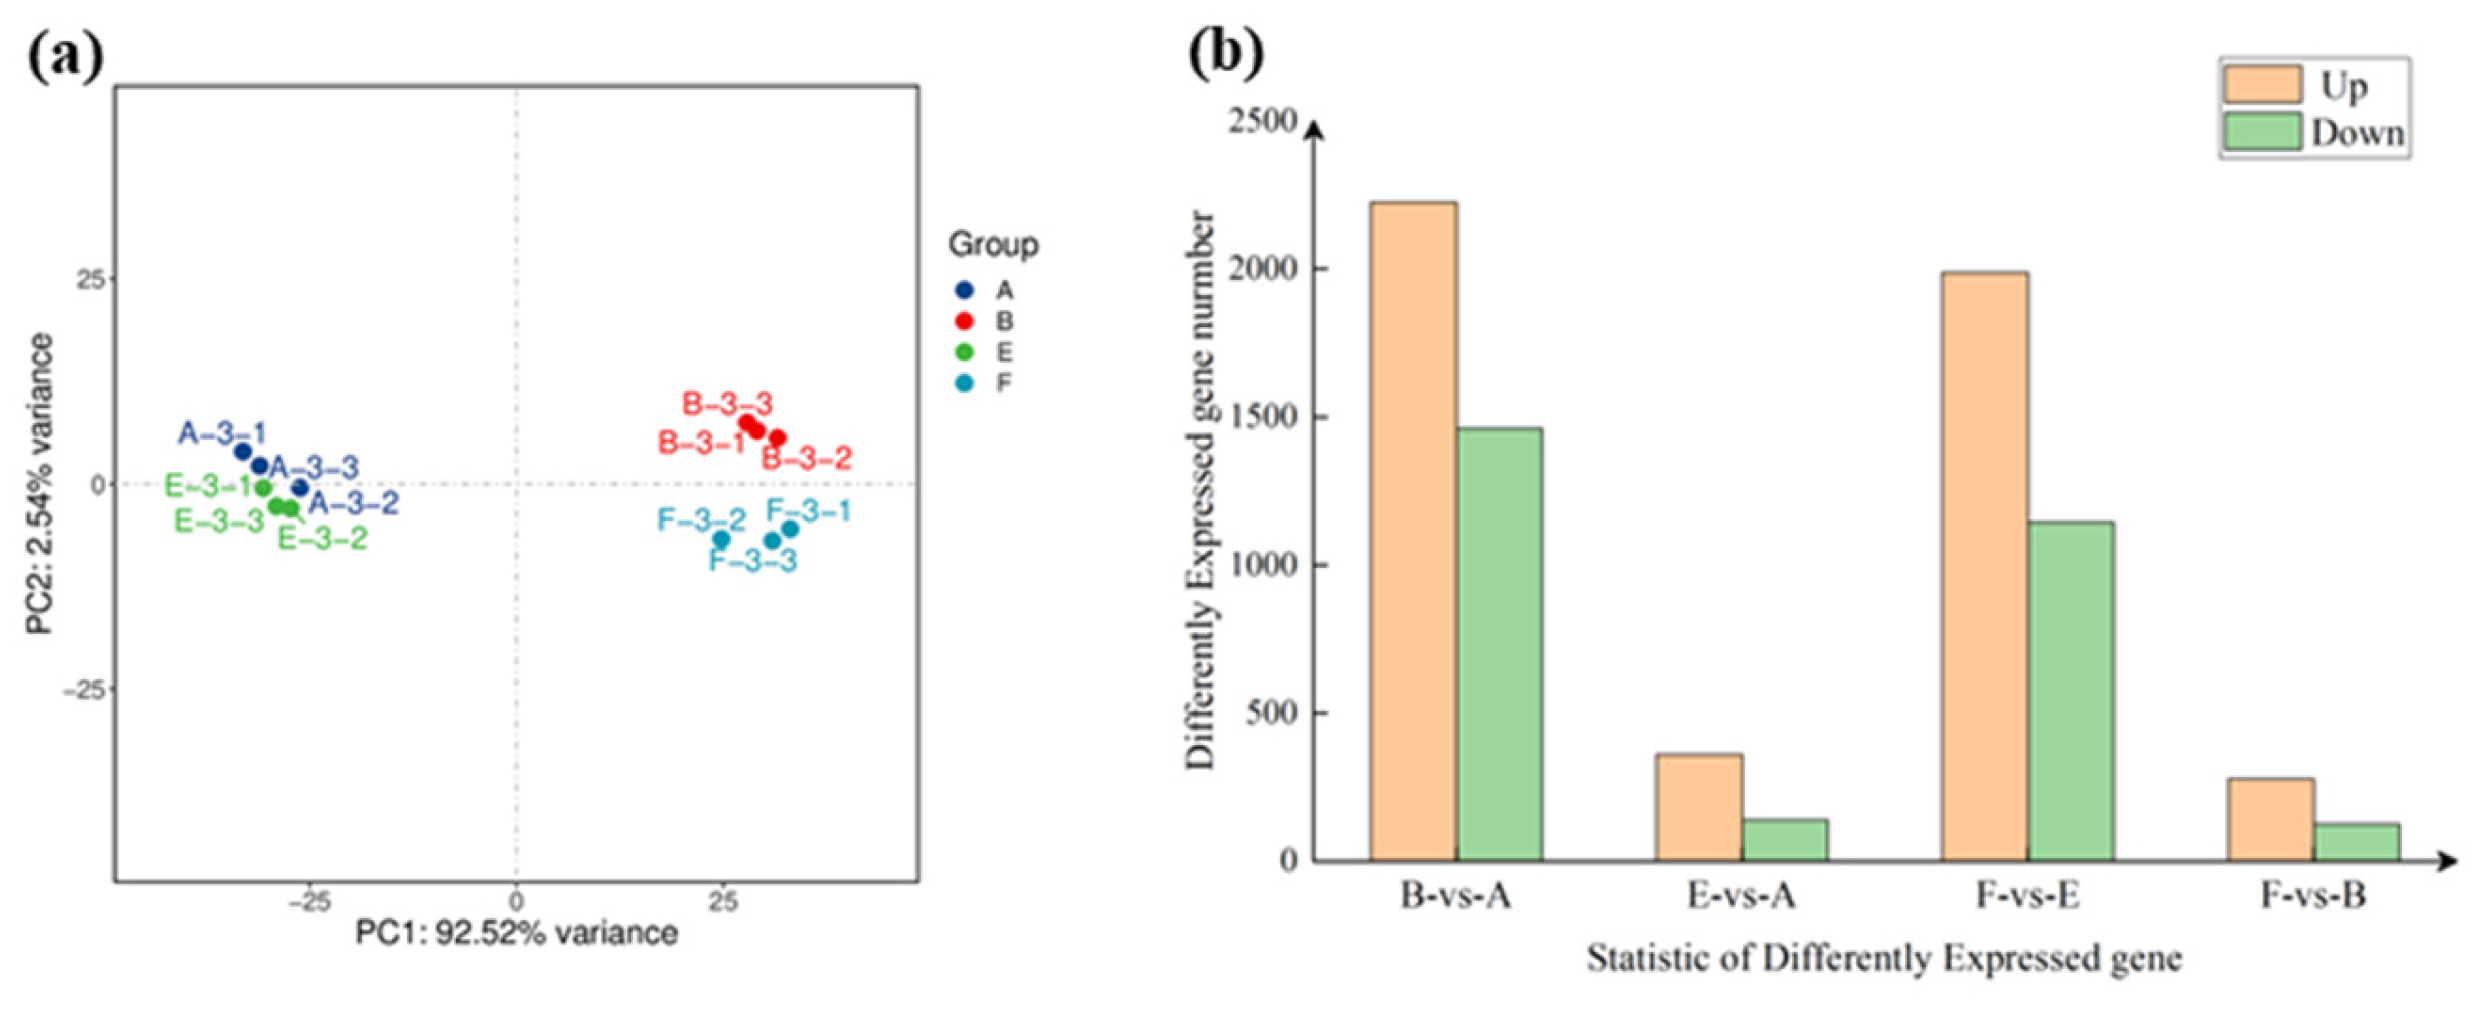
3.4. DEGs Responding to Leaf Spot Disease and Exogenous EBR

To reveal the molecular mechanism of exogenous EBR-induced defense responses against a pathogenic fungus, Drechslera avenae, we used transcriptome sequencing in oat leaves treated with a combination of EBR (1.0 mg·L−1) and pathogen inoculation. Our principal component analysis (PCA) showed that the distribution of the two treatment groups (B and F) inoculated with Drechslera avenae was far apart from A and E, which indicates that there were more DEGs produced after pathogen inoculation (Figure 4a). In the B-vs-A control group, there was a total of 3688 DEGs, of which 2226 were upregulated and 1462 were downregulated (Figure 4b). There was a total of 404 differentially expressed genes in the F-vs-B control group, of which 278 were upregulated and 126 were downregulated.
qPCR analysis was further performed to validate the confidence level of the transcriptome data. The expression levels of 20 randomly selected genes showed a similar trend in FPKM values for our transcriptome data with the different comparisons (Figure A1). Together, this indicates the authenticity and reliability of the transcriptome data.

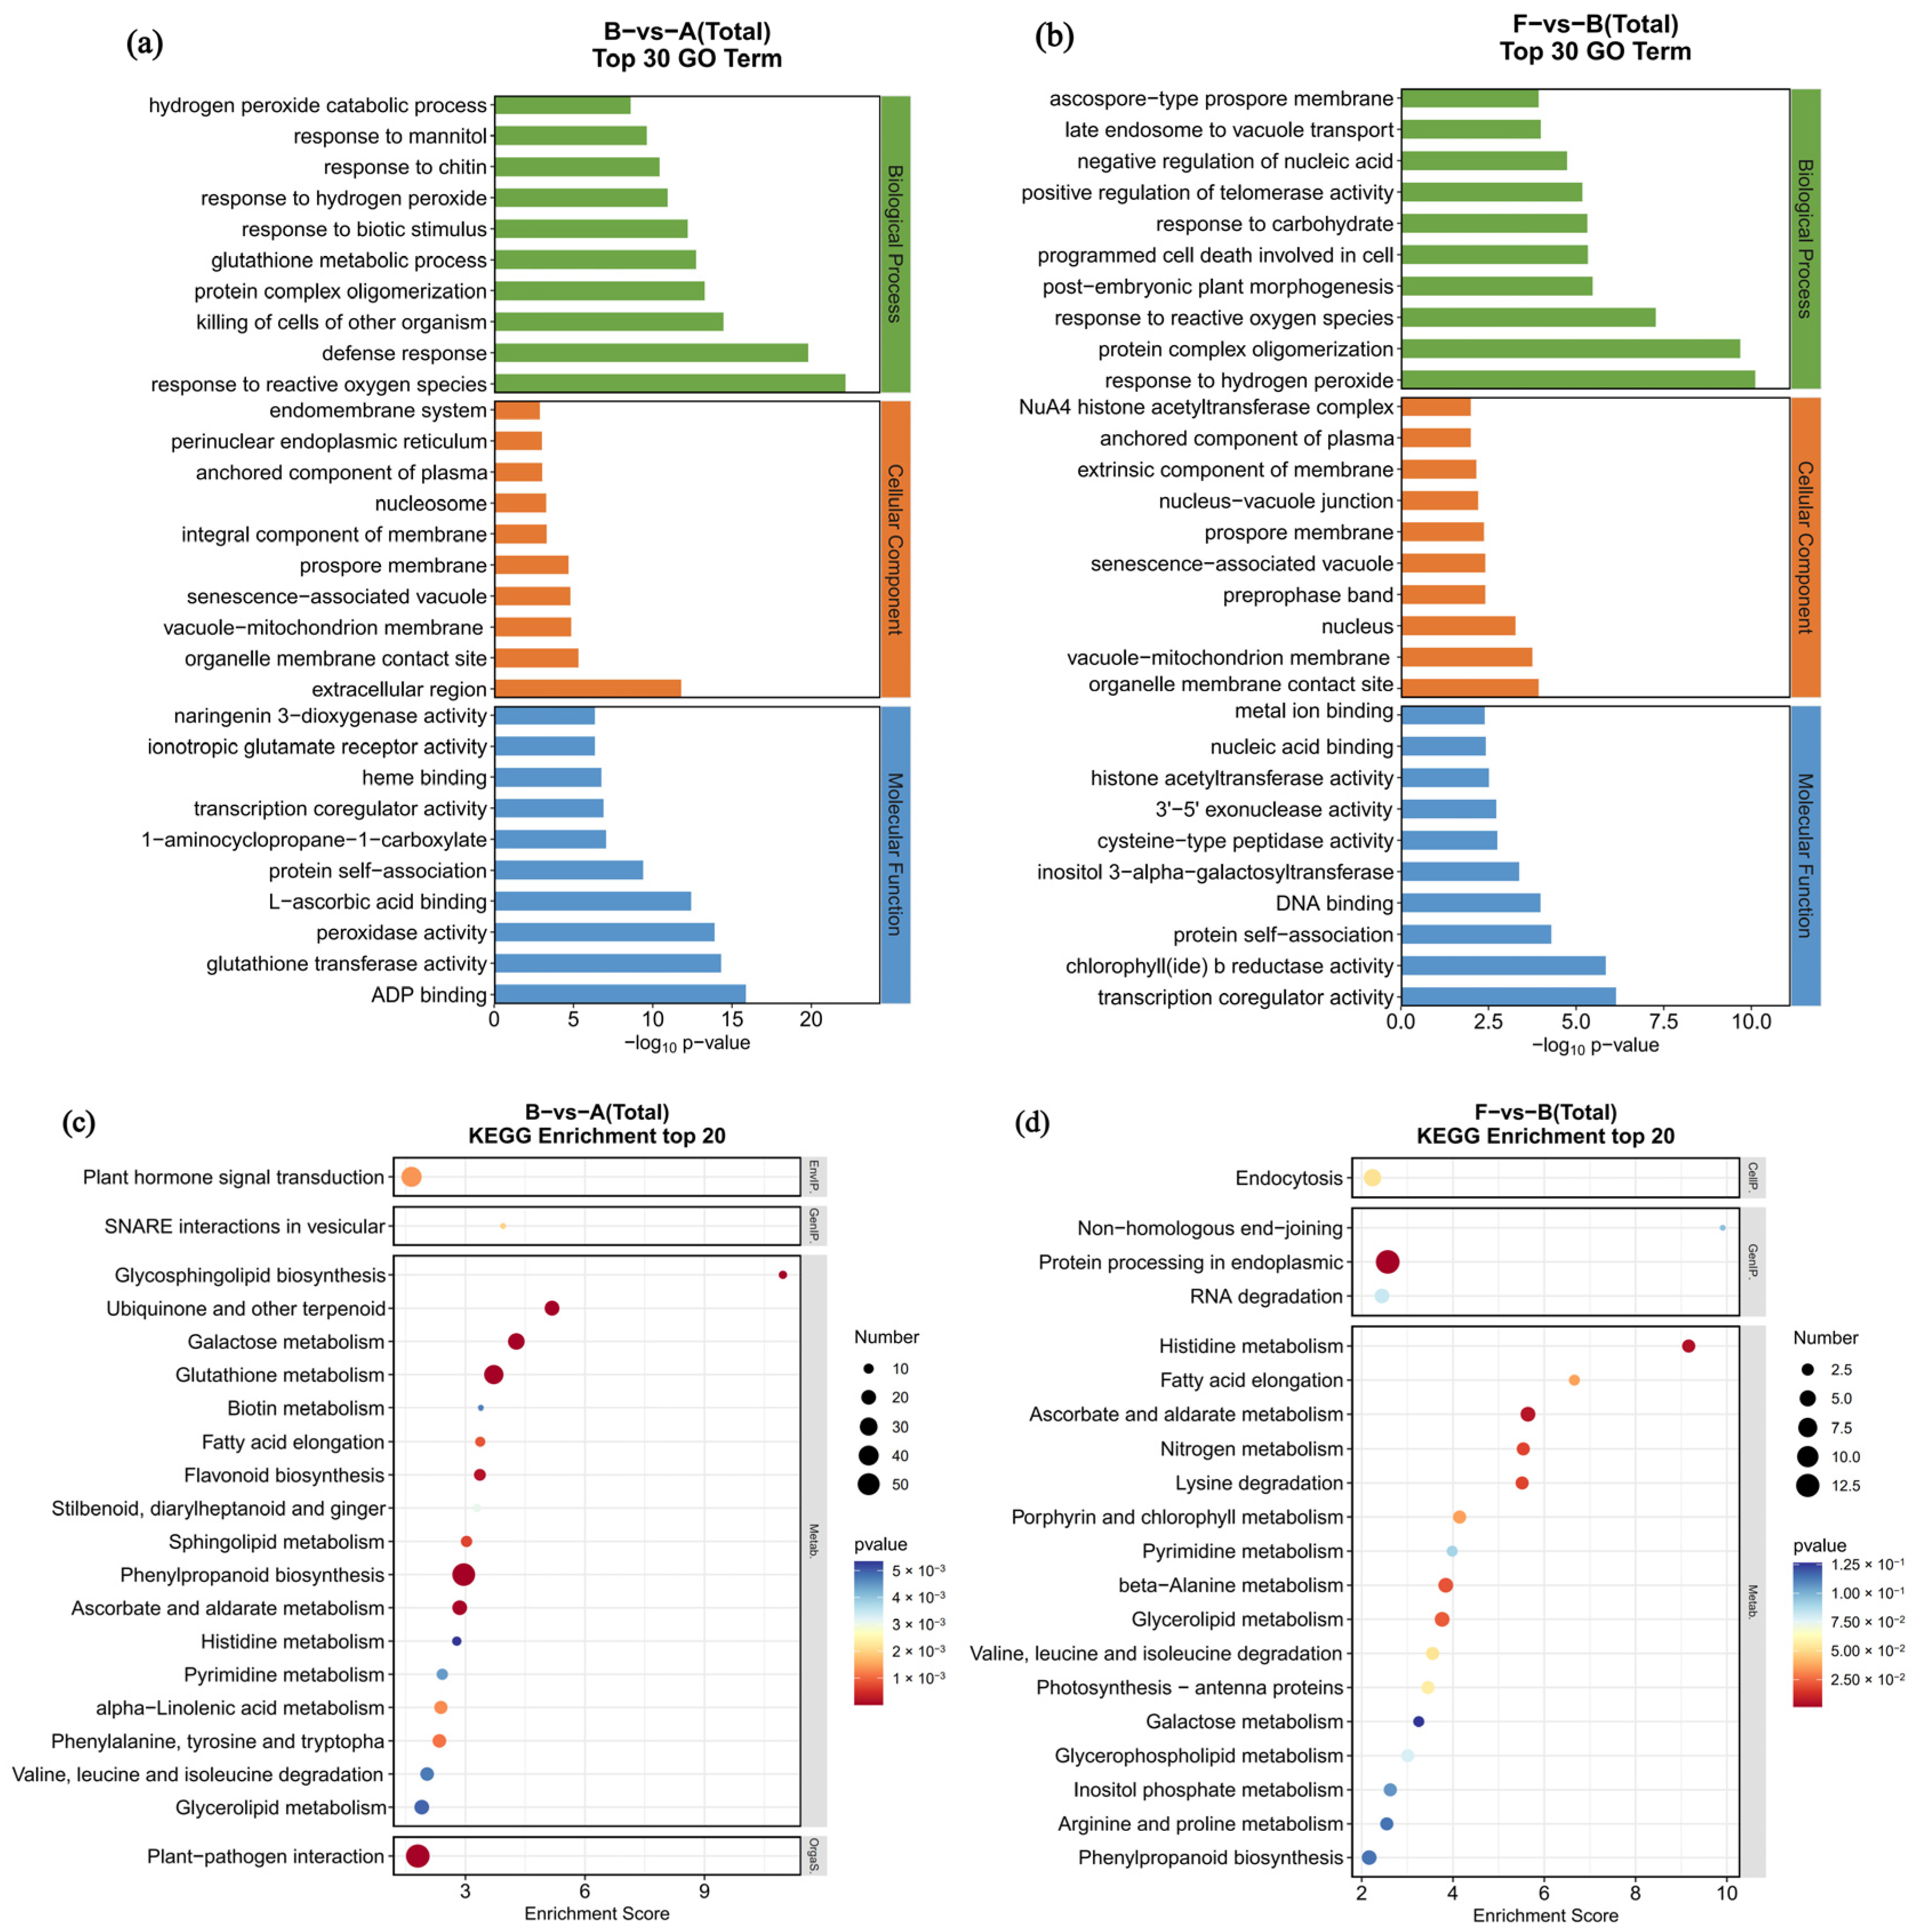
3.5. GO and KEGG Enrichment of DEGs

After identifying our DEGs, we used GO and KEGG enrichment analysis to further understand their biological functions (Figure 5). DEGs were enriched in 2310 terms in the B-vs-A comparison, with a significant enrichment in 415 terms (p < 0.05). Using biological process clustering, many of these DEGs were mainly responsive to oxidative stress and defense responses. Likewise, our molecular functional clustering primarily included ADP binding, glutathione transferase activity, and peroxidase activity (Figure 5a). In the F-vs-B comparison, responses to hydrogen peroxide, protein complex oligomerization, and reactive oxygen species were the top three items in our biological process clustering. In the molecular functional clustering, transcription coregulation activity and chlorophyll b reductase activity were the top two items within this group (Figure 5b).
The pathways significantly enriched in the B-vs-A comparison mainly included plant–pathogen interaction, phenylpropanoid biosynthesis, glutathione metabolism, and flavonoid biosynthesis (Figure 5c). In the F-vs-B comparison, the significantly enriched pathways were related to protein processing in the endoplasmic reticulum, histidine metabolism, ascorbate and aldarate metabolism, nitrogen metabolism, and porphyrin and chlorophyll metabolism (Figure 5d).

3.6. MapMan Analysis of DEGs

To determine the exogenous EBR-induced DEGs involved in the defense response to pathogen inoculation, we characterized the DEGs enriched in the pathogen attack pathway in the F-vs-B comparison according to MapMan analysis (Figure 6). A total of 25 signaling-related DEGs, 7 hormone signaling DEGs, 26 protease hydrolysis DEGs, 15 secondary metabolism DEGs, 19 heat shock protein DEGs, and 5 redox DEGs were identified, highlighting their possible roles in responding to pathogen inoculation with the application of EBR.

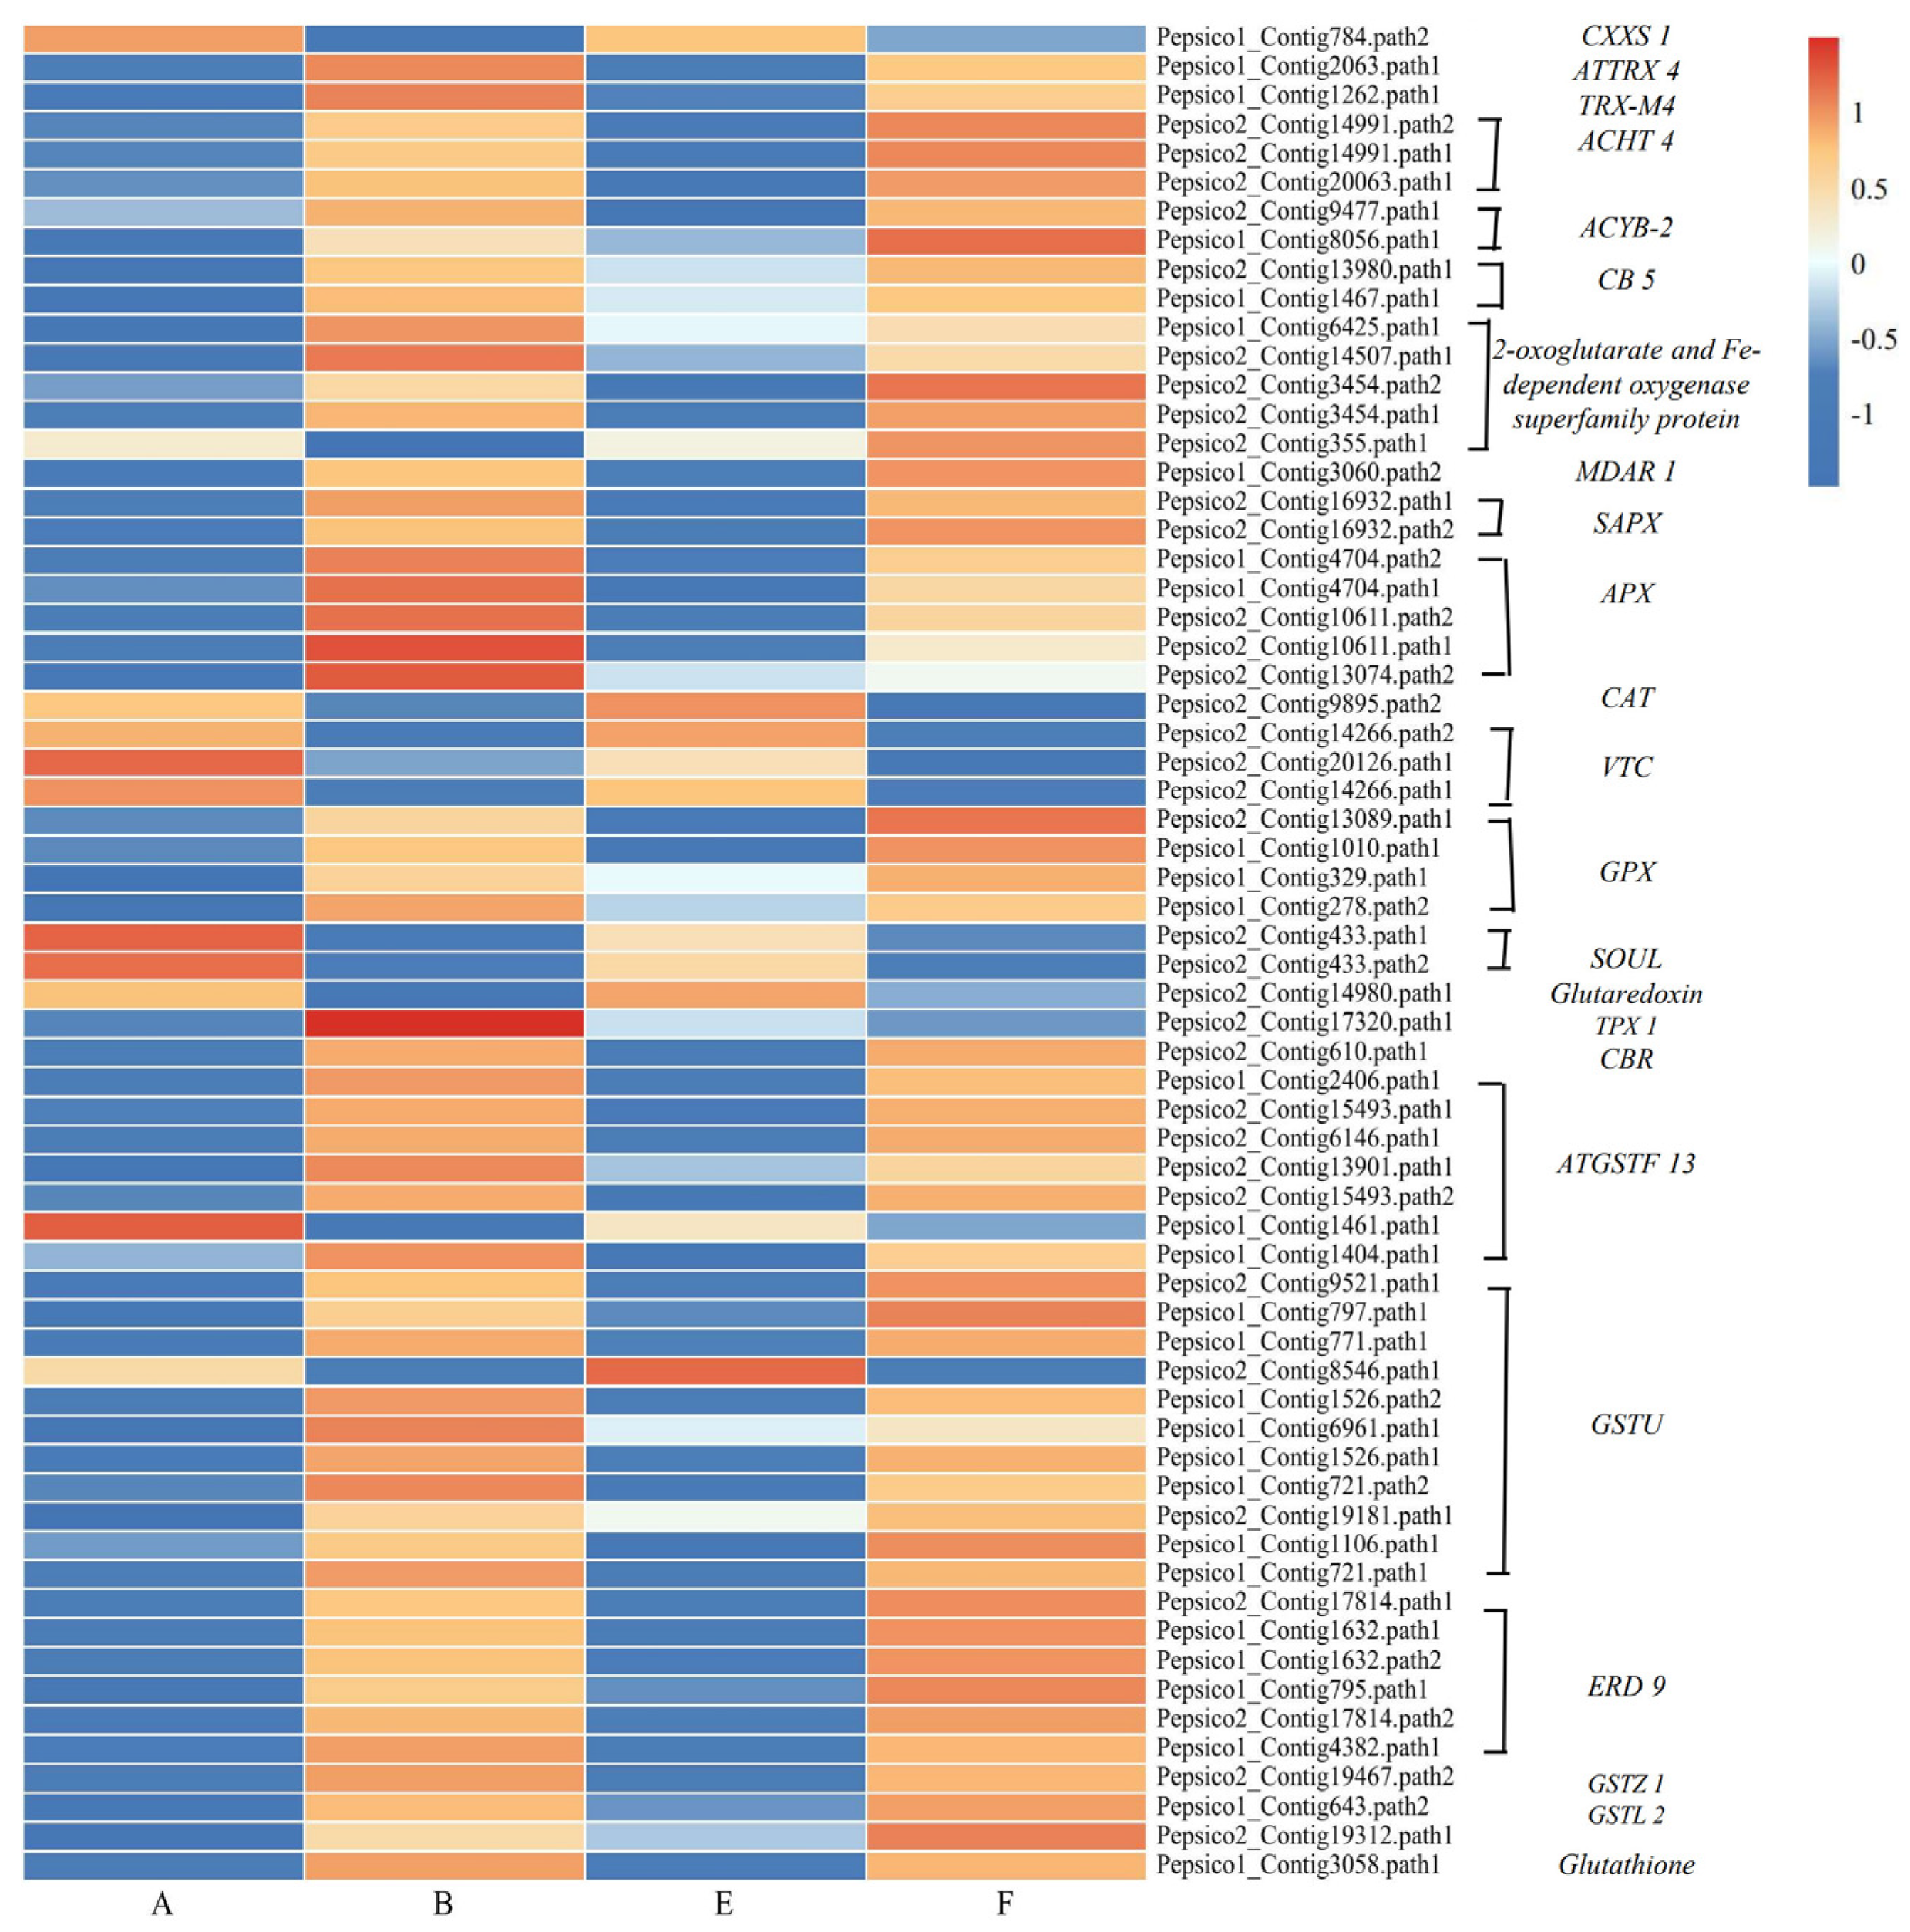
3.7. DEGs Involved in Redox Reactions

Pathogen inoculation in combination with exogenous EBR significantly activated the expression of genes associated with redox reactions (Figure 7). In the B-vs-A comparison group, there were a total of 68 DEGs related to antioxidant enzymes, and most of them were upregulated, such as APX, GPX, GSTF, and GSTU. In the F-vs-B comparison, two DEGs were identified, including the upregulation of the 2-oxoglutarate and Fe dependent oxygenase genes and the downregulation of the TPX1 gene.

3.8. DEGs Involved in Signal Transduction

Compared to the control (group A), genes involved in BR signal transduction were significantly downregulated under pathogen inoculation alone (group B), including BIN2, BRI1, and BAS1 (Figure 8). However, BRI and BRH 1 were significantly upregulated with the application of EBR alone (group E), and the BAS1 gene was significantly upregulated by the combination of EBR and the pathogen inoculation group (F). In the F-vs-B comparison group, we saw a significant upregulation with DEGs involved in other signaling pathways, such as auxin, ABA, and MAPK signaling (Figure 6).

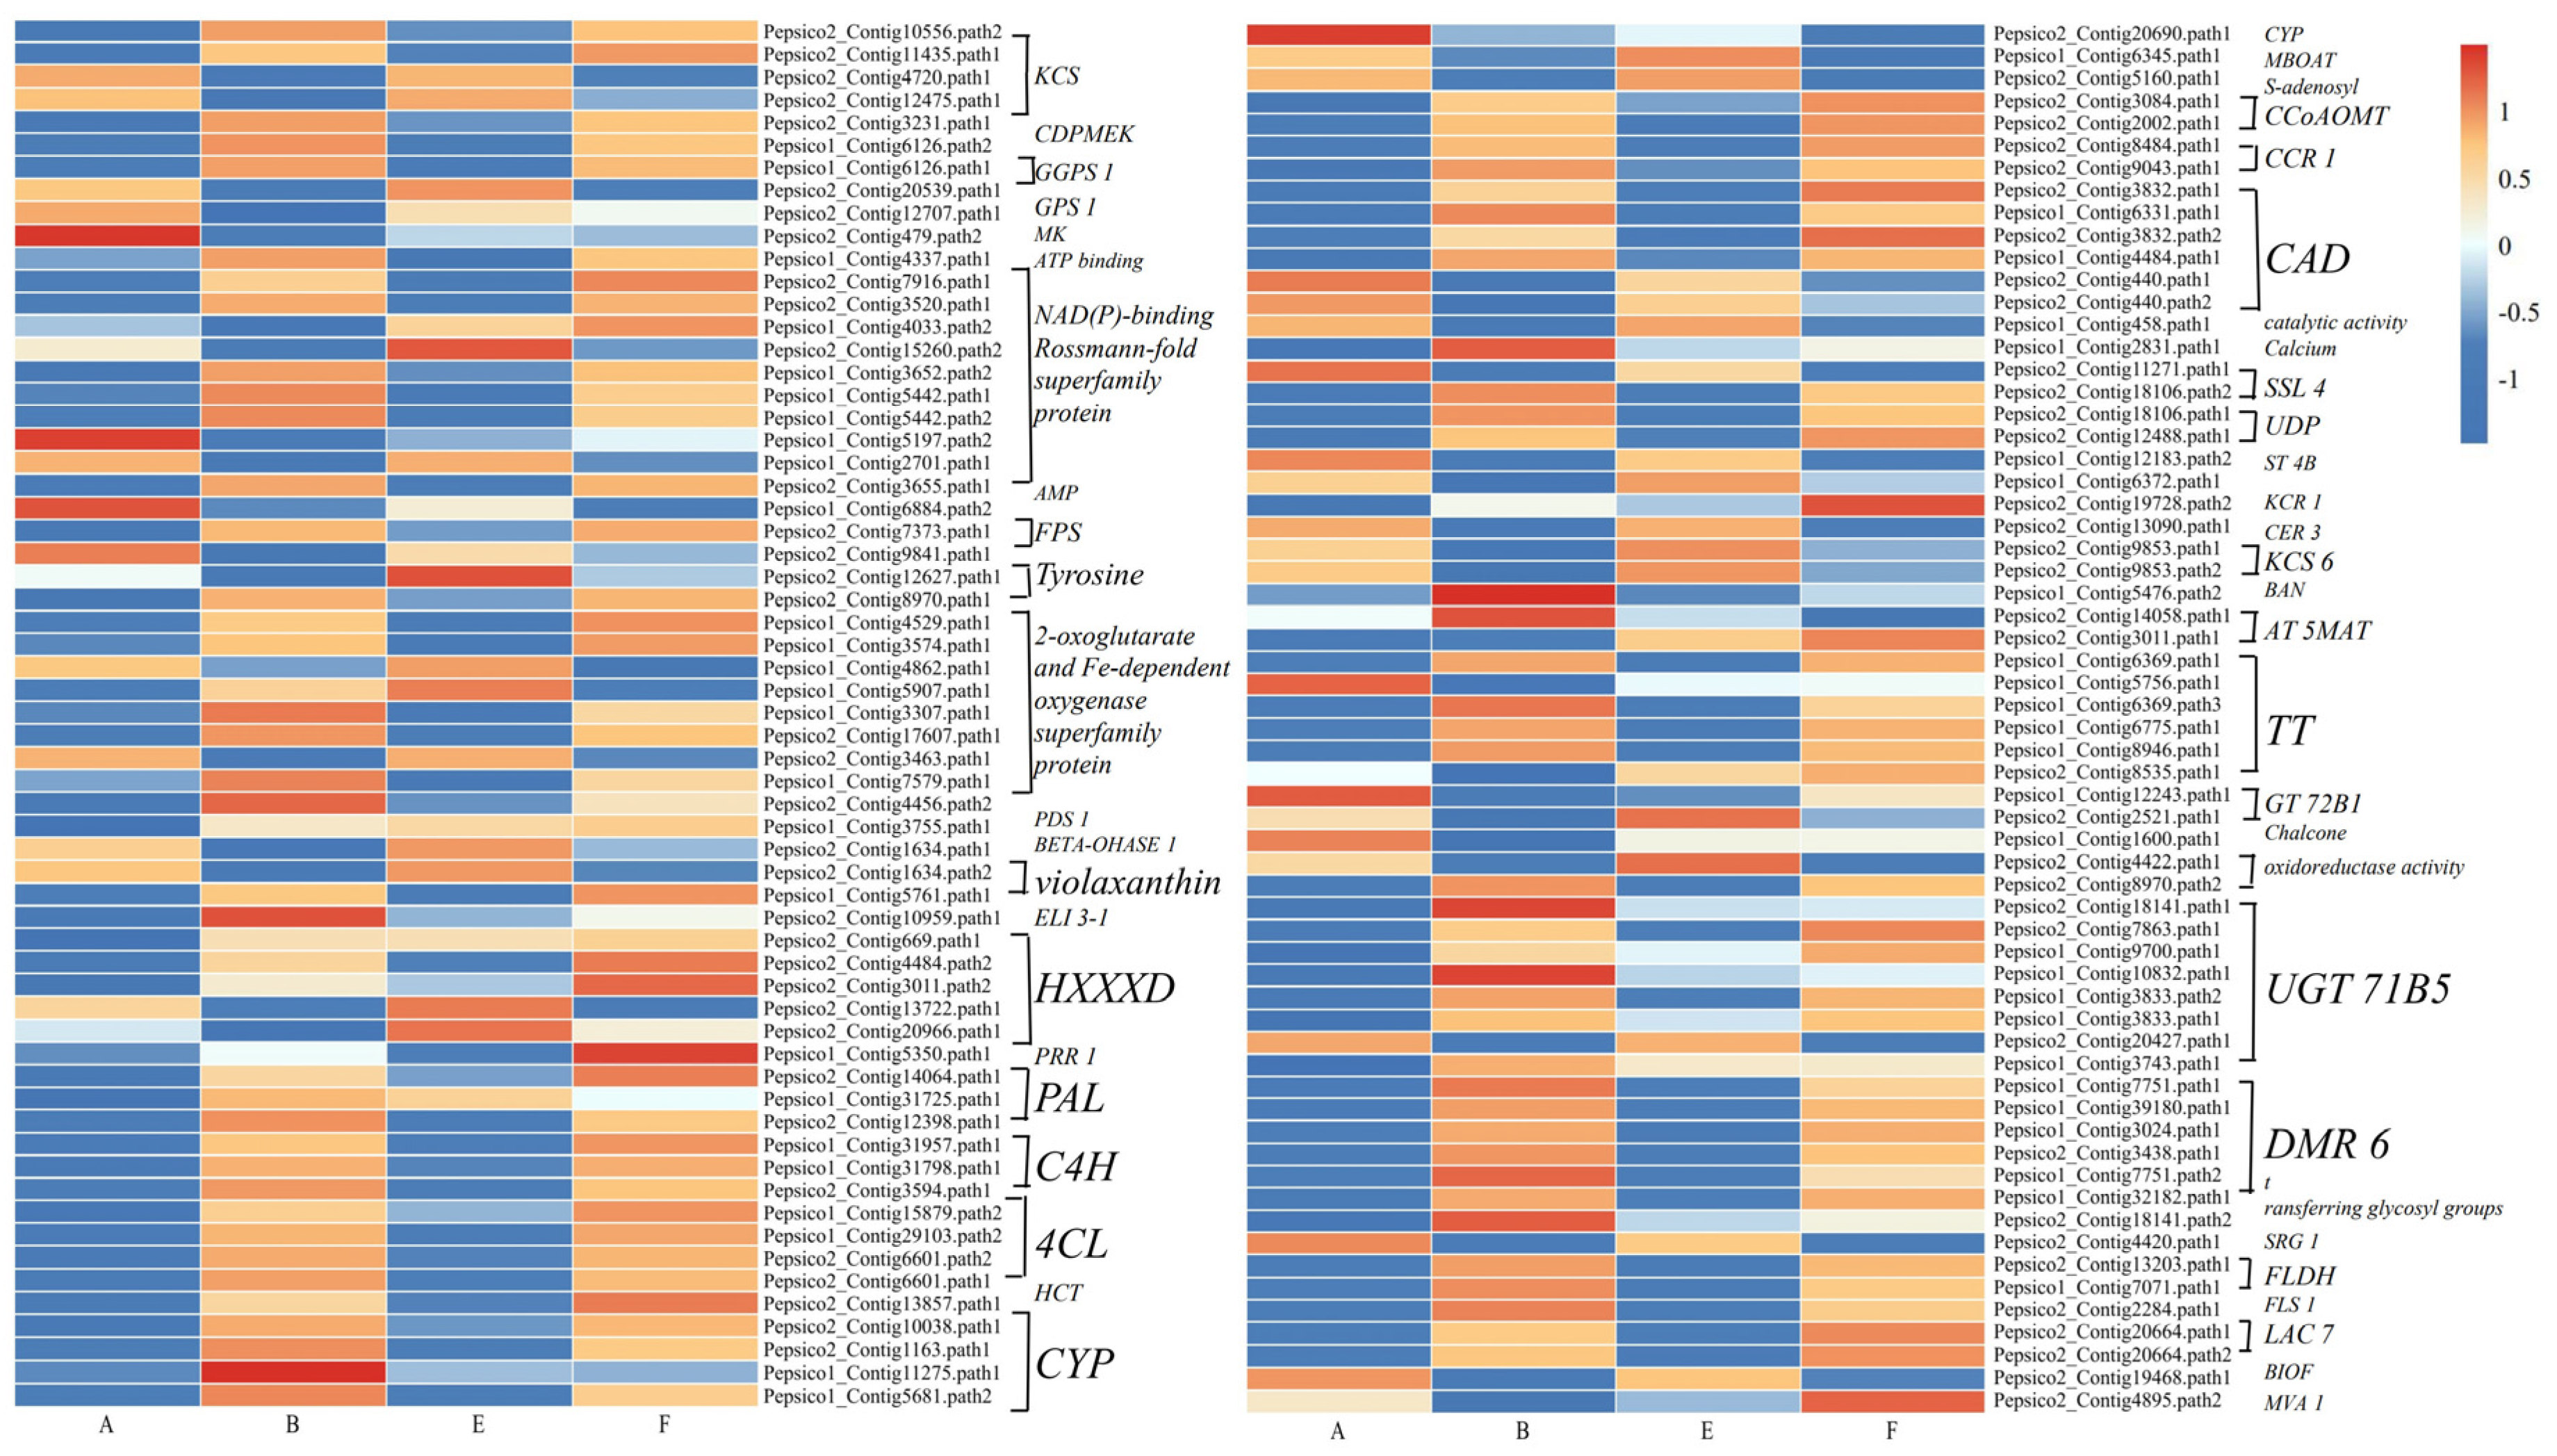
3.9. DEGs Involved in Secondary Metabolism

Most of the DEGs associated with secondary metabolism were upregulated by pathogen inoculation and the combination of EBR compared to the control, such as the PAL, C4H, 4CL, CCR1, CAD, CCoAOMT, KCS, HXXXD, and UGT genes (Figure 9). In the F-vs-B comparison, the upregulated genes were HXXXD, MVA1, TT7, PRR1, and KCS6.
In the phenylpropanoid and lignin-specific pathways, the expression of two PAL genes, two COMT genes, one C4H gene, one CCR gene, and two CAD and POD genes were significantly induced by the combination of pathogen inoculation and EBR application. Gene encoding β-D-glucosidase and COMT genes were also upregulated by the application of exogenous EBR compared to the pathogen inoculation treatment alone (Figure 10).

4. Discussion

Pathogen attack significantly threatens crop production and affects both yield and quality [29]. It has been widely reported that the application of exogenous EBR mitigates adverse impacts due to pathogen inoculation in a number of plants [17,19,20]. In our study, we found that pretreatment with exogenous EBR at 1.0 mg L−1 effectively mitigated leaf spot disease induced by the infection of Drechslera avenae (Figure 1) with regards to phenotype and disease index. To our knowledge, this is the first report of positive effects of exogenous EBR on defense responses against leaf spot disease in plants.

4.1. BR Signaling Involved in Improving Plant Defense Responses Against Plant Disease

BR signaling plays a multifaceted role in plant defense by regulating defense gene expression [30], enhancing cell wall fortification [31], mediating oxidative burst and ROS signaling [32], and interacting with other hormonal pathways [18,33]. Through these mechanisms, BRs help plants mount an effective defense response, although the specific outcomes of BR signaling in defense can vary depending on the pathogen and environmental context [34]. We found that key genes involved in BR signaling, such as BIN2 and BRI1, were significantly downregulated by the infection of Drechslera avenae in oat leaves (Figure 7). Formally, the BRI1 (Brassinosteroid-Insensitive 1) gene encodes a leucine-rich repeat receptor-like kinase (LRR-RLK), which is a primary receptor for BRs on the plasma membrane of plant cells [35]. Previously, enhanced Disease Resistance against necrotrophic and hemibiotrophic pathogens were both observed in BRI1 mutations in both Brachypodium distachyon and Hordeum vulgare [36]. In addition, the BIN2 (Brassinosteroid-Insensitive 2) gene encodes a serine/threonine kinase, which acts as a critical negative regulator within the BR signaling pathway in plants. Unlike BRI1, which promotes BR signaling, BIN2 inhibits BR signaling to ensure a balanced response. Another previous work also demonstrated that the expression of BIN2 was suppressed under Verticillium dahliae infection in cotton (Gossypium hirsutum) [37], and its resistance was significantly enhanced when BIN2 was knocked down [38]. With regards to our work, these findings indicate that BR signaling is likely involved in the defense response against leaf spot disease in oats.
While BR signaling generally promotes growth, excessive activation of defense responses can suppress growth, a phenomenon known as the growth-defense trade-off [39,40]. Plants often balance BR signaling to avoid this trade-off to allow them to allocate resources to immune defenses only when necessary. By fine-tuning BR signaling, plants can achieve an optimal balance to enable effective pathogen defense without exhibiting excessive growth [30]. In this study, we found that the significant upregulation of BR signaling genes BRI1 and BRH1 was induced by the application of EBR alone compared to the control. However, this upregulation was inhibited by the EBR combination with pathogen inoculation. Moreover, this combination of exogenous EBR application and pathogen inoculation significantly upregulated a transcript encoding the BAS1 gene (Figure 1). The BAS1 gene (also known as CYP734A1) encodes a cytochrome P450 enzyme that acts as a negative regulator in the BR pathway by hydroxylating and deactivating active BRs, and the expression of CYP734As could be upregulated by exogenous application of bioactive BRs [41,42]. Together, these data suggest that exogenous EBR induces the expression of BAS1, which may contribute to a growth-defense trade-off, where BR reduction supports enhanced defense response under pathogen attack in oats.
BR signaling cross-talks extensively with other hormonal pathways, such as the salicylic acid (SA), jasmonic acid (JA), and ethylene pathways, which play major roles in pathogen defense [40,43]. This cross-talk between the BR, SA, JA, and ethylene pathways allow plants to tailor their immune responses to activate the most appropriate defenses based on the type of pathogen encountered [44]. In this study, the exogenous EBR treatments induced DEGs involved in other hormonal pathways, including those found in auxin, abscisic acid (ABA), and ethylene. In particular, two transcripts that belong to the ABA signaling pathway were significantly upregulated compared to pathogen inoculation alone (Figure 6). One area where BR and ABA signaling crosstalk is particularly significant is in the regulation of the stomatal aperture [45], which primarily serves as a barrier to pathogen entry [46]. ABA also regulates the production and scavenging activity of ROS [47] and induces callose deposition to strengthen the cell wall against pathogen invasion, playing a dual role in plant defense [48]. Additionally, we found that DEGs involved in other signaling pathways were induced by exogenous EBR under pathogen inoculation. In particular, it upregulated a gene involved in mitogen-activated protein kinase (MAPK) signaling (Figure 6). MAPK cascades are crucial in mounting immune responses against pathogens [49]. The crosstalk between BR and MAPKs is a vital aspect of plant signaling that enables plants to regulate plant immunity [13,50]. Taken together, tour findings suggest that exogenous EBR may mediate the crosstalk of BR with ABA and MAPK signaling pathways to regulate defense responses against the pathogen attack of leaf spot disease in oats.

4.2. Exogenous EBR Alleviates Oxidative Damage by Enhancing Antioxidant Defense System

Pathogen attack in plants triggers a rapid ROS accumulation, often termed an “oxidative burst,” which plays a crucial role in plant defense [51,52]. This rapid ROS production serves multiple protective functions, including directly damaging pathogens, reinforcing cell walls, and activating downstream defense responses through signaling pathways [53,54]. However, while controlled ROS levels can effectively signal and contain pathogens, excessive ROS accumulation results in significant oxidative damage to plant cells. This imbalance between ROS production and scavenging leads to oxidative stress that impairs vital cellular components such as lipids, proteins, and DNA [55,56]. For instance, ROS can initiate lipid peroxidation, which compromises membrane integrity and produces MDA, a marker of cellular damage [57]. Elevated MDA levels indicate membrane instability and are associated with cellular leakage that further exacerbates tissue damage. Several previous studies have widely demonstrated that pathogen attack induced ROS accumulation and an increase in MDA content, which can be alleviated by exogenous EBR to reduce ROS accumulation and MDA content [19,20,58]. Consistently, we found that the application of EBR at 1.0 mg·L−1 significantly reduced •O2 production rate, H2O2, and MDA contents in oat leaves inoculated with Drechslera avenae.
To mitigate such oxidative damage, plants rely on an intricate antioxidant system, including enzymatic defenses like SOD, CAT, and POD, as well as non-enzymatic antioxidants such as ascorbate, glutathione, and flavonoids. In X et al. [59], they found that treating Arabidopsis thaliana with exogenous EBR increased SOD, POD, CAT, and APX activities under Cucumber mosaic virus infection. Previously, it has been shown that these antioxidant enzymes help mitigate ROS accumulation and improve resistance to pathogen inoculation by maintaining ROS homeostasis and enhancing the plant’s overall defense response [60]. In this study, exogenous EBR application significantly increased SOD, CAT, and APX activity compared to pathogen inoculation alone. Moreover, the combination of exogenous EBR application and pathogen inoculation significantly activated the expression of genes encoding antioxidant enzymes, such as APX, GPX, GSTF and GSTU (Figure 6). Together, these findings suggest that exogenous EBR could activate the antioxidant enzyme system in oats to detoxify ROS, which reduces oxidative damage in infected leaves and supports the plant’s defense mechanisms against pathogen inoculation.

4.3. Exogenous EBR Improves Defense Responses by Mediating Phenylpropanoid and Lignin Pathways

Plant secondary metabolism also plays a vital role in defending against pathogen attacks through the production of an array of bioactive compounds that can act directly against pathogens or indirectly by priming the plant’s defense mechanisms [61,62]. We found that most of the DEGs associated with secondary metabolism were upregulated by the combination of EBR application and pathogen inoculation, such as PAL, C4H, 4CL, CCR1, CAD, CCoAOMT, KCS, and UGT. These genes mainly encoded enzymes involved in phenylpropanoid and lignin-specific pathways [17], which highlights that the phenylpropanoid and lignin pathways are central components of plant secondary metabolism that respond to EBR application and pathogen inoculation.
The phenylpropanoid pathway begins with the conversion of the amino acid phenylalanine to cinnamic acid by the enzyme PAL, a key regulatory step that channels primary metabolites into secondary metabolic pathways. Both C4H and 4CL also act as early-phase enzymes in the phenylpropanoid pathway [63,64]. Previously, many studies found that exogenous EBR application upregulated the expression of PAL, C4H, and 4CL and enhanced their activity to improve their resistance to pathogen attack in tea plants [17,19], which is in accordance with our results. This suggests that exogenous EBR application uses the phenylpropanoid pathway to improve plant defense against pathogens. Typically, the phenylpropanoid pathway produces a variety of compounds with defensive and protective functions, including flavonoids, coumarins, tannins, and lignin precursors [62]. For example, phytoalexins like resveratrol in grapevine and camalexin in Arabidopsis act as antimicrobial secondary metabolites that are synthesized in response to pathogen attack and accumulate at infection sites to help localize and restrict pathogen growth [64]. Similarly, flavonoids are synthesized from branches of the phenylpropanoid pathway and also act as antioxidants to scavenge ROS under stress conditions [65].
Lignin, a complex polymer and major structural component of plant secondary cell walls, is synthesized through a branch of the phenylpropanoid pathway [66]. The lignification of cell walls also contributes to structural defense by creating a physical barrier that restricts pathogen entry and spread, particularly against fungi that rely on mechanical force to penetrate cell walls [67]. Upon pathogen attack, lignin deposition can rapidly increase at infection sites—a process known as cell wall lignification. This local lignification response restricts pathogen access to nutrients and prevents further spread within plant tissues [68]. Additionally, the lignin biosynthesis process often involves the production of ROS, particularly H2O2, which acts as a substrate for lignin polymerization enzymes like peroxidase [68]. In this study, the combination of EBR application and pathogen inoculation induced the upregulation of key genes involved in the lignin biosynthesis pathway, such as CCR1 and CAD, to increase the lignin content in oat leaves. Together, our data highlight the crucial role of the lignin biosynthesis pathway in exogenous EBR-induced plant defense under pathogen attack.

5. Conclusions

In our study, we found that exogenous EBR application at 1 mg·L−1 mediates BR signal transduction and improves the expression of genes involved in the antioxidant defense system, as well as the phenylpropanoid and lignin-specific pathways, to increase their activity, which in turn alleviates oxidative damage and enhances defense responses against leaf spot disease in oats. In this work, we are the first to report the resistance-induced effect of exogenous EBR application in oats for leaf spot disease that is induced by Drechslera avenae. Ultimately, our findings can provide a theoretical basis for the non-invasive control of leaf spot disease. Still, its detailed regulation mechanism and the identification of key metabolites responsible for these defense responses need to be further studied in the future.

Author Contributions

Conceptualization, Z.W., K.N. and G.Z.; methodology, Z.W. and K.N.; software, Z.W. and K.N.; validation, Z.W., K.N., G.Z., J.C., Y.Z. and Z.J.; formal analysis, Z.W., K.N., G.Z., J.C., Y.Z. and Z.J.; investigation, Z.W. and K.N.; resources, K.N., G.Z., Y.Z. and J.C.; data curation, Z.W. and K.N.; writing—original draft preparation, Z.W.; writing—review and editing, K.N.; visualization, Y.Z. and J.C.; supervision, G.Z., Y.Z. and J.C.; project administration, K.N., G.Z., Y.Z. and J.C.; funding acquisition, K.N., G.Z., Y.Z. and J.C. All authors have read and agreed to the published version of the manuscript.

Funding

This research was funded by National Center of Pratacultural Technology Innovation (under preparation) Special Fund for Innovation Platform Construction, grant number CCPTZX2023B05, and the National Natural Science Foundation of China, grant numbers 32360342 and 32301491; and The APC was funded by the Chief Scientist and Program in Gansu Province, grant number 23ZDKA013.

Data Availability Statement

The data presented in this study are available on request from the corresponding author.

Acknowledgments

We extend our sincere gratitude to the College of Prataculture at Gansu Agricultural University and the Key Laboratory of Grassland Ecosystems, Ministry of Education, for their invaluable support in facilitating our experimental platform.

Conflicts of Interest

The authors declare no conflicts of interest.

Appendix A

Table A1. Primer design.
PrimerUpstream PrimerDownstream Primer
ActinGAGCGGGAAATTGTAAGGGACATGGATGGCTGGAAGAGGAC
pepsico2_contig1860.path1TCGCACTTCTACTTCGTCGGTGCAGGTATGTCATGGCGAG
pepsico1_contig1010.path1CTGGCACCAACGAGGAGATTCGCCGAAAAGACCACCTTTG
pepsico1_contig31601.path1ATACTTCGCGCTACTGTGGGTGCAACCTGCGAGTCATCTT
pepsico1_contig2831.path1GTGAGAGCTGTGAGCGAAGTTTACCCAGGGCAGCTAGGAT
Pepsico1_Contig11380.path2ACCACCGATGCCGTATGTTTGCCACCTCAGTCTCCAACTC
pepsico1_contig3446.path1GCCATATCTCTGACCCTCGCTACCAAGCTGAGGAGCAAGC
pepsico1_contig4053.path1ACGACATATGGCTCTGCCACGATCGTGATCACCTCCGACG
Pepsico1_Contig4086.path1CTTTCAGCAGTAATCGCCGCTCCCGTTCCATTGTCTGAGC
Pepsico1_Contig4133.path1CCCCTTCCAGAGTGGTTCACGGATCTTCAAGTGGCTGCCT
Pepsico1_Contig4140.path2CGCACCTGGCGATTTGTATGTGAAGTGGCAGTAGCTGACG
Pepsico1_Contig4179.path2AAGGCCGACGTCTTCAGTTTTCTTGTACAGCTTCCAGGCG
Pepsico1_Contig4239.path2GGACGCCATCCCATAAGTGTTCCCTCATGCTCTTGCACTG
Pepsico1_Contig426.path1TGGGCTTTATGCTCGTCTGGACCTGCATCGCCTCGATATG
Pepsico1_Contig4293.path3GGTGGAGCATGCCTATGAGTTTCTGGTCAAGTGCCGTTGT
Pepsico1_Contig4326.path1CAGCAGTTGTGCAGGTAAGCTCTGTGGACAGACAGTTCGC
Pepsico1_Contig4396.path2CAACGTCACCACCCTCCTACGTCTTGGGTGGGGAATAGCC
Pepsico2_Contig20595.path1AGAACTTCAGCCAGCTCGTCATGCCTCAGCAGGATGTTCC
Pepsico2_Contig2061.path1CACATCTACGAGAACGGGGGATAGAGCGACCCTTCCCGAT
Pepsico2_Contig20671.path1AGGCCAGACCCCTATTCCATGAATTCCGACGACATGCAGC
Pepsico2_Contig8925.path1GACGGCTCCACTAGAACCACGGGCAACAAACGTCAGCATT

Appendix B

Figure A1. Expression levels and FPKM values of 20 randomly selected genes. The different lowercase letters represent significant differences among different treatments.
Agronomy 14 03035 g0a1

References

  1. Ibrahim, M.; Ahmad, A.; Sohail, A.; Asad, M. Nutritional and functional characterization of different oat (Avena sativa L.) cultivars. Int. J. Food Prop. 2020, 23, 1373–1385. [Google Scholar] [CrossRef]
  2. Marshall, A.; Cowan, S.; Edwards, S.; Griffiths, S.; White, E. Crops that feed the world 9. Oats a cereal crop for human and livestock feed with industrial applications. Food Secur. 2013, 5, 13–33. [Google Scholar] [CrossRef]
  3. Butt, M.; Tahir-Nadeem, M.; Khan, M.; Shabir, R.; Butt, M. Oat: Unique among the cereals. Eur. J. Nutr. 2008, 47, 68–79. [Google Scholar] [CrossRef]
  4. Shakeel, Q.; Raheel, D.; Bajwa, R.; Rashid, I.; Raza, H.Y.; Saleem, S.R. Etiology and Management of Economically Significant Diseases of Avena sativa; CRC Press: Boca Raton, FL, USA, 2021; pp. 131–163. ISBN 9781003055365. [Google Scholar]
  5. Dietz, J.; Schierenbeck, M.; Simón, M. Impact of foliar diseases and its interaction with nitrogen fertilization and fungicides mixtures on green leaf area dynamics and yield in oat genotypes with different resistance. Crop Prot. 2019, 121, 80–88. [Google Scholar] [CrossRef]
  6. Islam, T.; Danishuddin; Tamanna, N.; Matin, M.N.; Barai, H.R.; Haque, M.A. Resistance mechanisms of plant pathogenic fungi to fungicide, environmental impacts of fungicides, and sustainable solutions. Plants 2024, 13, 2737. [Google Scholar] [CrossRef]
  7. Demiwal, P.; Nabi, S.; Mir, J.; Verma, M.; Yadav, S.; Roy, P.; Sircar, D. Methyl jasmonate improves resistance in scab-susceptible Red Delicious apple by altering ROS homeostasis and enhancing phenylpropanoid biosynthesis. Plant Physiol. Bioch. 2024, 207, 108371. [Google Scholar] [CrossRef]
  8. Verma, V.; Ravindran, P.; Kumar, P. Plant hormone-mediated regulation of stress responses. BMC Plant Biol. 2016, 16, 86. [Google Scholar] [CrossRef]
  9. Coll, Y.; Coll, F.; Amorós, A.; Pujol, M. Brassinosteroids roles and applications: An up-date. Biologia 2015, 70, 726–732. [Google Scholar] [CrossRef]
  10. Yu, M.; Zhao, Z.; He, J. Brassinosteroid signaling in plant–microbe interactions. Int. J. Mol. Sci. 2018, 19, 4091. [Google Scholar] [CrossRef]
  11. Nakashita, H.; Yasuda, M.; Nitta, T.; Asami, T.; Fujioka, S.; Arai, T.; Sekimata, K.; Takatsuto, S.; Yamaguchi, I.; Yoshida, S. Brassinosteroid functions in a broad range of disease resistance in tobacco and rice. Plant J. 2003, 33, 887–898. [Google Scholar] [CrossRef]
  12. Shi, H.; Shen, Q.; Qi, Y.; Yan, H.; Nie, H.; Chen, Y.; Zhao, T.; Katagiri, F.; Tang, D. BR-SIGNALING KINASE1 physically associates with FLAGELLIN SENSING2 and regulates plant innate immunity in Arabidopsis. Plant Cell 2013, 25, 1143–1157. [Google Scholar] [CrossRef]
  13. Shi, H.; Li, Q.; Luo, M.; Yan, H.; Xie, B.; Li, X.; Zhong, G.; Chen, D.; Tang, D. BRASSINOSTEROID-SIGNALING KINASE1 modulates MAP KINASE15 phosphorylation to confer powdery mildew resistance in Arabidopsis. Plant Cell 2022, 34, 1768–1783. [Google Scholar] [CrossRef]
  14. Bharat, B.; Shivakumar, S.; Guido, S. BRASSINOSTEROID-SIGNALING KINASE5 associates with immune receptors and is required for immune responses. Plant Physiol. 2019, 180, 1166–1184. [Google Scholar]
  15. Huang, S.; Nie, S.; Wang, S.; Liu, J.; Zhang, Y.; Wang, X. SlBIR3 negatively regulates PAMP responses and cell death in tomato. Int. J. Mol. Sci. 2017, 18, 1966. [Google Scholar] [CrossRef]
  16. Liu, T.; Xu, H.; Amanullah, S.; Du, T.; Hu, X.; Che, Y.; Zhang, L.; Jiang, Z.; Zhu, L.; Wang, D. Deciphering the enhancing impact of exogenous brassinolide on physiological indices of melon plants under downy mildew-induced stress. Plants 2024, 13, 779. [Google Scholar] [CrossRef]
  17. Zhang, L.; Zhang, Z.; Ahammed, G.J.; Wang, X.; Li, X. 2,4-Epibrassinolide enhances resistance against Colletotrichum fructicola by promoting lignin biosynthesis in Camellia sinensis L. J. Plant Growth Regul. 2023, 42, 1558–1566. [Google Scholar] [CrossRef]
  18. Kang, Y.; Jiang, Z.; Meng, C.; Ning, X.; Pan, G.; Yang, X.; Zhong, M. A multifaceted crosstalk between brassinosteroid and gibberellin regulates the resistance of cucumber to phytophthora melonis. Plant J. 2024, 119, 1353–1368. [Google Scholar] [CrossRef]
  19. Zhang, L.; Ahammed, G.; Li, X.; Wei, J.; Li, Y.; Yan, P.; Zhang, L.; Wen, Y. Exogenous brassinosteroid enhances plant defense against Colletotrichum gloeosporioides by activating phenylpropanoid pathway in Camellia sinensis L. J. Plant Growth Regul. 2018, 37, 1235–1243. [Google Scholar] [CrossRef]
  20. Song, Y.; Hu, C.; Xue, Y.; Gu, J.; He, J.; Ren, Y. 2,4-epibrassinolide enhances mango resistance to Colletotrichum gloeosporioides via activating multiple defense response. Sci. Hortic. 2022, 303, 111249. [Google Scholar] [CrossRef]
  21. Senanayake, I.C.; Rathnayaka, A.R.; Marasinghe, D.S.; Calabon, M.S.; Gentekaki, E.; Lee, H.B. Morphological approaches in studying fungi: Collection, examination, isolation, sporulation and preservation. Mycosphere 2020, 11, 2678–2754. [Google Scholar] [CrossRef]
  22. Niu, K.; Ma, X.; Liang, G.; Ma, H.; Jia, Z.; Liu, W.; Yu, Q. 5-Aminolevulinic acid modulates antioxidant defense systems and mitigates drought-induced damage in Kentucky bluegrass seedlings. Protoplasma 2017, 254, 2083–2094. [Google Scholar] [CrossRef]
  23. Chen, S.; Zhou, Y.; Chen, Y.; Gu, J. Fastp: An ultra-fast all-in-one FASTQ preprocessor. Bioinformatics 2018, 34, i884–i890. [Google Scholar] [CrossRef]
  24. Kim, D.; Langmead, B.; Salzberg, S. HISAT: A fast spliced aligner with low memory requirements. Nat. Methods 2015, 12, 357–360. [Google Scholar] [CrossRef]
  25. Roberts, A.; Trapnell, C.; Donaghey, J.; Rinn, J.; Pachter, L. Improving RNA-Seq expression estimates by correcting for fragment bias. Genome Biol. 2011, 12, R22. [Google Scholar] [CrossRef]
  26. Simon, A.; Theodor, P.; Wolfgang, H. HTSeq—A python framework to work with high-throughput sequencing data. Bioinformatics 2015, 31, 166–169. [Google Scholar]
  27. Love, M.; Huber, W.; Anders, S. Moderated estimation of fold change and dispersion for RNA-seq data with DESeq2. Genome Biol. 2014, 15, 550. [Google Scholar] [CrossRef]
  28. Pan, Y.; Niu, K.; Miao, P.; Zhao, G.; Zhang, Y.; Ju, Z.; Chai, J.; Cui, X.; Zhang, R. Genome-wide analysis of the SWEET gene family and its response to powdery mildew and leaf spot infection in the common oat (Avena sativa L.). BMC Genom. 2024, 25, 995. [Google Scholar] [CrossRef]
  29. Madden, L.; Wheelis, M. The threat of plant pathogens as weapons against U.S. crops. Annu. Rev. Phytopathol. 2003, 41, 155–176. [Google Scholar] [CrossRef]
  30. Lozano-Durán, R.; Zipfel, C. Trade-off between growth and immunity: Role of brassinosteroids. Trends Plant Sci. 2015, 20, 12–19. [Google Scholar] [CrossRef]
  31. Nafisi, M.; Fimognari, L.; Sakuragi, Y. Interplays between the cell wall and phytohormones in interaction between plants and necrotrophic pathogens. Phytochemistry 2015, 112, 63–71. [Google Scholar] [CrossRef]
  32. Sharma, N.; Kour, S.; Kumar, D.; Kaur, R.; Khajuria, A.; Ohri, P. Role of brassinosteroids (BRs) in modulating antioxidative defense mechanism in plants growing under abiotic and biotic stress conditions. Antioxid. Def. Plants 2022, 1, 325–367. [Google Scholar]
  33. Checker, V.; Kushwaha, H.; Kumari, P.; Yadav, S. Role of Phytohormones in Plant Defense: Signaling and Cross Talk; Springer: Singapore, 2018. [Google Scholar]
  34. Janeczko, A.; Saja, D.; Dziurka, M.; Gábor, G.; Balázs, B. Brassinosteroid deficiency caused by the mutation of the HvDWARF gene influences the reactions of barley to powdery mildew. Physiol. Mol. Plant Pathol. 2019, 108, 101438. [Google Scholar] [CrossRef]
  35. Li, J.; Chory, J. A putative leucine-rich repeat receptor kinase involved in brassinosteroid signal transduction. Cell 1997, 90, 929–938. [Google Scholar] [CrossRef] [PubMed]
  36. Goddard, R.; Peraldi, A.; Ridout, C.; Nicholson, P. Enhanced disease resistance caused by BRI1 mutation is conserved between Brachypodium distachyon and barley (Hordeum vulgare). Mol. Plant Microbe Interact. 2014, 27, 1095–1106. [Google Scholar] [CrossRef] [PubMed]
  37. Gao, W.; Long, L.; Zhu, L.; Xu, L.; Gao, W.; Sun, L.; Liu, L.; Zhang, X. Proteomic and virus-induced gene silencing (VIGS) analyses reveal that gossypol, brassinosteroids, and jasmonic acid contribute to the resistance of cotton to Verticillium dahliae. Mol. Cell. Proteom. 2013, 12, 3690–3703. [Google Scholar] [CrossRef]
  38. Song, Y.; Zhai, Y.; Li, L.; Yang, Z.; Ge, X.; Yang, Z.; Zhang, C.; Li, F.; Ren, M. BIN2 negatively regulates plant defence against Verticillium dahliae in Arabidopsis and cotton. Plant Biotechnol. J. 2021, 19, 2097–2112. [Google Scholar] [CrossRef]
  39. Huot, B.; Yao, J.; Montgomery, B. Growth-defense tradeoffs in plants: A balancing act to optimize fitness. Mol. Plant. 2014, 7, 1267–1287. [Google Scholar] [CrossRef]
  40. Nolan, T.; Vukainovi, N.; Liu, D.; Russinova, E.; Yin, Y. Brassinosteroids: Multidimensional regulators of plant growth, development, and stress responses. Plant Cell 2019, 32, 295–318. [Google Scholar] [CrossRef]
  41. Thornton, L.; Peng, H.; Neff, M. Rice CYP734A cytochrome P450s inactivate brassinosteroids in Arabidopsis. Planta 2011, 234, 1151–1162. [Google Scholar] [CrossRef]
  42. Ohnishi, T.; Nomura, T.; Watanabe, B.; Ohta, D.; Yokota, T.; Miyagawa, H.; Sakata, K.; Mizutani, M. Tomato cytochrome P450 CYP734A7 functions in brassinosteroid catabolism. Phytochemistry 2006, 67, 1895–1906. [Google Scholar] [CrossRef]
  43. Wei, L.; Zhong, Y.; Wu, X.; Wei, S.; Liu, Y. Roles of nitric oxide and brassinosteroid in improving fruit quality during postharvest: Potential regulators? J. Agr. Food Chem. 2024, 72, 23671–23688. [Google Scholar] [CrossRef] [PubMed]
  44. Pan, G.; Liu, Y.; Ji, L.; Xiao, Z.; He, J.; Qiu, Z.; Liu, D.; Sun, Z.; Xu, T. Brassinosteroids mediate susceptibility to brown planthopper by integrating with the salicylic acid and jasmonic acid pathways in rice. J. Exp. Bot. 2018, 69, 4433–4442. [Google Scholar] [CrossRef] [PubMed]
  45. Ha, Y.; Shang, Y.; Nam, K. Brassinosteroids modulate ABA-induced stomatal closure in Arabidopsis. J. Exp. Bot. 2016, 67, 6297–6308. [Google Scholar] [CrossRef] [PubMed]
  46. Bharath, P.; Gahir, S.; Raghavendra, A. Abscisic acid-induced stomatal closure: An important component of plant defense against abiotic and biotic stress. Front. Plant Sci. 2021, 12, 615114. [Google Scholar] [CrossRef] [PubMed]
  47. Postiglione, A.; Muday, G. The role of ROS homeostasis in ABA-Induced guard cell signaling. Front. Plant Sci. 2020, 11, 968. [Google Scholar] [CrossRef]
  48. Mauch-Mani, B.; Mauch, F. The role of abscisic acid in plant–pathogen interactions. Curr. Opin. Plant Biol. 2005, 8, 409–414. [Google Scholar] [CrossRef]
  49. Meng, X.; Zhang, S. MAPK cascades in plant disease resistance signaling. Annu. Rev. Phytopathol. 2013, 51, 245–266. [Google Scholar] [CrossRef]
  50. Yan, H.; Zhao, Y.; Shi, H.; Li, J.; Wang, Y.; Tang, D. BRASSINOSTEROID-SIGNALING KINASE1 phosphorylates MAPKKK5 to regulate immunity in Arabidopsis. Plant Physiol. 2018, 176, 2991–3002. [Google Scholar] [CrossRef]
  51. Torres, M.; Jones, J.; Dangl, J. Reactive oxygen species signaling in response to pathogens. Plant Physiol. 2006, 141, 373–378. [Google Scholar] [CrossRef]
  52. Ullah, F.; Yi, M. Mechanisms of ROS regulation of plant development and stress responses. Front. Plant Sci. 2019, 10, 800. [Google Scholar]
  53. Apel, K.; Hirt, H. REACTIVE OXYGEN SPECIES: Metabolism, oxidative stress, and signal transduction. Annu. Rev. Plant Biol. 2004, 55, 373–399. [Google Scholar] [CrossRef] [PubMed]
  54. Jones, M.; Smirnoff, N. Reactive Oxygen Species in Plant Development and Pathogen Defence; Blackwell Publishing Ltd.: Oxford, UK, 2007. [Google Scholar]
  55. Gill, S.; Tuteja, N. Reactive oxygen species and antioxidant machinery in abiotic stress tolerance in crop plants. Plant Physiol. Biochem. 2010, 48, 909–930. [Google Scholar] [CrossRef] [PubMed]
  56. Hasanuzzaman, M.; Bhuyan, M.; Zulfiqar, F.; Raza, A.; Mohsin, S.; Mahmud, J.; Fujita, M.; Fotopoulos, V. Reactive oxygen species and antioxidant defense in plants under abiotic stress: Revisiting the crucial role of a universal defense regulator. Antioxidants 2020, 9, 681. [Google Scholar] [CrossRef] [PubMed]
  57. Noctor, G.; Mhamdi, A.; Foyer, C. Oxidative stress and antioxidative systems: Recipes for successful data collection and interpretation. Plant Cell Environ. 2016, 39, 1140–1160. [Google Scholar] [CrossRef] [PubMed]
  58. Yu, Z.; Zhang, S.; Sun, L.; Liang, S.; Zheng, X.; Ren, H.; Qi, X. Effects of enhanced resistance and transcriptome analysis of twig blight disease by exogenous brassinolide in Myrica rubra. Antioxidants 2024, 13, 61. [Google Scholar] [CrossRef]
  59. Zhang, D.; Deng, X.; Fu, F.; Lin, H. Induction of plant virus defense response by brassinosteroids and brassinosteroid signaling in Arabidopsis thaliana. Planta 2015, 241, 875–885. [Google Scholar] [CrossRef]
  60. Ding, J.; Shi, K.; Zhou, Y.; Yu, J. Effects of root and foliar applications of 2,4-epibrassinolide on Fusarium wilt and antioxidant metabolism in cucumber roots. Hortscience 2009, 44, 1340–1345. [Google Scholar] [CrossRef]
  61. Upadhyay, R.; Saini, R.; Shukla, P.; Tiwari, K. Role of secondary metabolites in plant defense mechanisms: A molecular and biotechnological insights. Phytochem. Rev. 2024, 1–31. [Google Scholar] [CrossRef]
  62. Zaynab, M.; Fatima, M.; Abbas, S.; Sharif, Y.; Umair, M.; Zafar, M.; Bahadar, K. Role of secondary metabolites in plant defense against pathogens. Microb. Pathog. 2018, 124, 198–202. [Google Scholar] [CrossRef]
  63. Vogt, T. Phenylpropanoid biosynthesis. Mol. Plant 2010, 3, 2–20. [Google Scholar] [CrossRef]
  64. Dixon, R.; Achnine, L.; Kota, P.; Liu, C. The phenylpropanoid pathway and plant defence—A genomics perspective. Mol. Plant Pathol. 2002, 3, 371–390. [Google Scholar] [CrossRef] [PubMed]
  65. Treutter, D. Significance of flavonoids in plant resistance: A review. Environ. Chem. Lett. 2006, 4, 147–157. [Google Scholar] [CrossRef]
  66. Neutelings, G. Lignin variability in plant cell walls: Contribution of new models. Plant Sci. 2011, 181, 379–386. [Google Scholar] [CrossRef] [PubMed]
  67. Bonawitz, N.; Chapple, C. The genetics of lignin biosynthesis: Connecting genotype to phenotype. Annu. Rev. Genet. 2010, 44, 337–363. [Google Scholar] [CrossRef] [PubMed]
  68. Bhuiyan, N.; Selvaraj, G.; Wei, Y.; King, J. Role of lignification in plant defense. Plant Signal. Behav. 2009, 4, 158–159. [Google Scholar] [CrossRef]
Figure 1. Effects of exogenous EBR on phenotype (a), disease index (b), and chlorophyll content (c) in oat leaves inoculated with a pathogenic fungus, Drechslera avenae. CK indicates the control plants; BR0 indicates the plants treated with pathogen inoculation alone; BR0.01, BR0.1, BR1, and BR10 indicate plants treated with both pathogen inoculation and foliar application of EBR at the concentrations of 0.01, 0.1, 1.0, 10.0 mg·L−1, respectively. Data presented are the mean ± SD (n = 3). Different letters indicate significant differences among treatments at p < 0.05.
Agronomy 14 03035 g001
Figure 2. The effect of exogenous BR on antioxidant enzyme activity (ac) and oxidative product content (df) in oat leaves inoculated with pathogenic fungus Drechslera avenae. CK indicates the control plants; BR0 indicates the plants treated with pathogen inoculation alone; BR0.01, BR0.1, BR1, and BR10 indicate plants treated with both pathogen inoculation and foliar application of EBR at the concentrations of 0.01, 0.1, 1.0, and 10.0 mg·L−1, respectively. Data presented are the mean ± SD (n = 3). Different letters indicate significant differences among treatments at p < 0.05.
Agronomy 14 03035 g002
Figure 3. The effect of exogenous EBR on the activity of enzymes (ac) and the content of related secondary metabolites (df) related to phenylpropane metabolism in oat leaves inoculated with a pathogenic fungus, Drechslera avenae. CK indicates the control plants; BR0 indicates the plants treated with pathogen inoculation alone; BR0.01, BR0.1, BR1, and BR10 indicate plants treated with both pathogen inoculation and foliar application of EBR at the concentrations of 0.01, 0.1, 1.0, and 10.0 mg·L−1, respectively. Data presented are the mean ± SD (n = 3). Different letters indicate significant differences among treatments at p < 0.05.
Agronomy 14 03035 g003
Figure 4. Principal component analysis (a) and number of DEGs (b) among different comparisons: A, the control group (CK); B, pathogen inoculation group; E, EBR application group; F, the combination of EBR application and pathogen inoculation group.
Agronomy 14 03035 g004
Figure 5. GO and KEGG enrichment of DEGs induced by pathogen inoculation and in combination with exogenous EBR application. (a,b) GO enrichment of DEGs in the B-vs-A comparison and F-vs-B comparison, respectively. The 30 most enriched GO terms in the three categories are shown. (c,d) KEGG enrichment of DEGs in the B-vs-A comparison and F-vs-B comparison, respectively. The 20 most enriched KEGG terms are shown. A high p-value is represented by blue, and a low p-value is represented by red.
Agronomy 14 03035 g005
Figure 6. DEGs involved in pathogen attack pathways based on Mapman analysis in the F-vs-B comparison.
Agronomy 14 03035 g006
Figure 7. Redox-related DEGs among different comparisons. A, control group (CK); B, pathogen inoculation group; E, EBR application group; F, combination of EBR application and pathogen inoculation group.
Agronomy 14 03035 g007
Figure 8. DEGs involved in BR signal transduction among the different comparisons. A, control group; B, pathogen inoculation group; E, EBR application group; F, combination of EBR application and pathogen inoculation group.
Agronomy 14 03035 g008
Figure 9. Secondary metabolism-related DEGs among different group comparisons. A, control group; B, pathogen inoculation group; E, EBR application group; F, combination of EBR application and pathogen inoculation group.
Agronomy 14 03035 g009
Figure 10. Cluster heatmap of DEGs related to phenylpropanoid and lignin pathways. A, control group; B, pathogen inoculation group; E, EBR application group; F, combination of EBR application and pathogen inoculation group.
Agronomy 14 03035 g010
Disclaimer/Publisher’s Note: The statements, opinions and data contained in all publications are solely those of the individual author(s) and contributor(s) and not of MDPI and/or the editor(s). MDPI and/or the editor(s) disclaim responsibility for any injury to people or property resulting from any ideas, methods, instructions or products referred to in the content.

