Abstract
The prediction of floral bud progression in commercial peach cultivars promotes knowledge about the adaptability of cultivars to the climatic conditions in a specific location under a climatic variability context. Phenology is relevant to improving the scheduling of cultural practices in peach orchards. This research aimed to predict the floral bud progression of three peach cultivars: ‘Harvester’, ‘Red Globe’, and ‘Rubyprince’. Floral bud progression was assessed using one-year-old shoots collected from an orchard located at the Chilton Research and Extension Center, Alabama. Samples were evaluated under laboratory and growth chamber conditions. We recorded the flower developmental stages daily to identify the transition among stages. Daily temperature records were used to estimate the heat requirement in terms of Growing Degree Days (GDD). After dormancy release, samples needed between 23 to 39 and 37 to 42 days to reach the petal fall stage for season 1 and season 2, respectively. In terms of heat requirements, cultivars needed between 425.5 to 721.5 and 684.5 to 777 GDD to end flowering. A logistic curve was adjusted to describe the growth of the different floral stages over time. The results are key to supporting peach growers in crop management practices such as orchard establishment, irrigation, fertilization, freeze and frost protection, and pollination under climate variability scenarios.
1. Introduction
Flowering is a process that includes the beginning of flower primordia and the subsequent differentiation and development in mature flowers undergoing anthesis. The flower initiation and differentiation stages in fruit trees are linked to the influence of phytohormones and external environmental factors. Hormone concentrations, for example, play a significant role in bud development, especially during the transition of floral stages, where the growth rate and cellular differentiation of verticils can be influenced [1].
Plants have developed different systems to guarantee flowering at a proper time, such as responding to day length and temperatures. Both are defined as major external variables that influence bloom [2]. Thus, flower bud differentiation can be related to the high values of photosynthetically active radiation (PAR) at the top of the tree [3]. Furthermore, genetic processes are involved in the regulation of flowering. Vernalization, for example, is the process implicated in suppressing floral repressors that prevent the activation of the genes necessary for the change from the meristem to floral development once a plant has completed accumulating its chilling requirement [4]. In temperate trees, blooming occurs the following year after some temperature requirements have been completed [5]. These temperature requirements are one of the principal challenges in fruit growth due to reduced chilling hours under climate variability scenarios. The phenology of the flower reproductive development from induction, growth, and development of reproductive organs goes until a certain point just prior to dormancy [6]. Dormancy season is interposed between flower induction and blooming (requiring the coordination of all the processes including cold acclimation) [6]. Thus, the phenological transition involves adequate crop maintenance, pest and disease control, and cold damage protection mainly during the spring season when flowering begins.
The progression of bud development has been recorded through scales and has been the focus of many researchers. A very common and approved scale is the BBCH (Biologische Bundesanstalt, Bundessortenamt und Chemische Industrie) [7,8,9] scale, studied for at least three decades. The first scale developed for pome fruits had an approach to plant protection. The BBCH coding system is the description of the improved Zadoks coding system, including mono- and dicotyledonous plants. However, the most remarkable disadvantage of the initial scales was a common code for the same growth stages. It was enhanced to obtain a BBCH scale with a uniform coding of the phenological growth stages that were similar for plants [10]. However, a regional scale has been developed to understand the floral progression in specific species such as peaches, for example, the classification defined for peach growth stages of the Southeastern Peach Growers’ Handbook, where ten stages were described starting from Dormant to Shuck off-stage [11].
1.1. Prediction of the Bud Progression
Calendar days have been a tool used to establish the progression among bud stages in species such as peaches, starting on 1 January as a reference [12]. The evaluation of the occurrence between stages, even when comparing different cultivars, exhibits variations relevant to activities such as irrigation, fertilization, and pollination. For instance, a comparison among the peach cultivars ‘Pratap’, ‘Tropic Snow’, ‘Tropic Beauty’, ‘Redhaven’, and ‘July Elberta’, during the 2020–2021 season, under sub-temperate conditions, showed meaningful variation in the transition of the phenological stages to reach the complete fruit development. Thus, the five cultivars ranged from 32 to 58 days to reach bud burst, 34 to 60 days to reach the single floral bud visible, 35 to 61 days for sepals to open, 36 to 63 days for the beginning of flowering, and 39 to 72 and 41 to 78 days to reach full bloom and petal fall stages, respectively [12].
In apricot, days after 1 January were used to compare the blooming date in different cultivars, showing a range between 6 days (in early-blooming cultivars) to 49 days (extra-late-blooming cultivars) during the years 2019–2020 [13]. Similarly, bud progression in capuli cherry has been described through a landmark scale using time. Early inflorescence needed one week after shoot initiation, then early inflorescence with floral buds closed took three weeks, the full bloom was completed on week seven, and finally, the petal fall stage occurred during week eight [8]. In sweet cherries, 4–6 weeks were necessary for the change between bud burst and full bloom stages [14]. After the full bloom stage, the petal fall stage will determine the flowering duration, which has been defined as the difference between the days of full bloom and petal fall [12].
Different events in plant physiology can be defined in terms of thermal time using Growing Degree Days as the accumulation of the difference between the daily average temperature and the base temperature, defined according to species. In a study conducted with ‘Flordastar’ on GF-677 peach rootstock in 3-year-old peach trees during three seasons (2004–2006), the accumulation of 193 GDD above the peach base temperature of 4.5 °C for flower bud swelling was necessary, 234 GDD for Calyx perceptible, 254 GDD for perceivable flower petals, 321 GDD for flowers forming, 329 GDD for full bloom stage, and 366 GDD for petal fall [15].
Before those phenological events, floral buds must complete certain chilling requirements according to the specificity of the cultivar, which is essential in the determination of bloom time. Thus, the chilling requirement in a cultivar can extend the bloom period [16]. For this reason, the initial season of the experiment included the determination of the dormancy release and the chilling requirements needed to complete the process.
1.2. Models to Predict Bud Progression
Models have been relevant in the prediction of peach floral bud development, supporting decisions in cultivar selection. Similarly, models have been used to improve the estimation of full bloom and peach harvest [17]. To characterize phenology, it is necessary to recognize that models assume temperature as the main factor regulating bud development [18]. Mathematically, one of the applied methods is the combination of the sum of effective hourly temperatures above 7 °C starting from January 1 in the prediction of peach tree stages under specific local weather conditions [19]. This method has also been applied to the Mediterranean climate, calculating the heat requirements of each stage in terms of both Growing Degree Hours (GDH) and Growing Degree Days (GDD). The use of these thermal units applied to bud progression allowed comparisons between different locations and years other than the calendar days that had also been used [15]. The Critical Date models (CD) were used to assess the adaptation of peach cultivars to temperate growing areas. It was based only on the action of forcing temperatures accumulated from fitted data, as well as the Critical Chilling models (CC), including the action of chilling temperatures during the dormancy period (initial phase) and a forcing phase [18]. Currently, some research continues to apply the combination of phenological growth stages (in a determined scale) and the GDD. GDD are considered the best indicator for monitoring the phenology during growth development from budbreak to harvest [12]. Also, technology has been applied to assess the progression of peach phenology in different cultivars. Phenology information is collected using web-connected recording cameras in combination with weather stations, which provide flower images and meteorological data from orchards. Also, daily variables based on color ranges in the images, temperature, illuminance, and heat/chilling requirement data are used for testing machine learning models such as random forest (RF), support vector machine (SVM), naïve Bayes (NB), and k-nearest neighbors (KNN) models [20].
The relevance of these methods and models is focused on supporting cultivar adaptation and selection, harvest dates, evaluation of frost risk, and better scheduling of cultural techniques such as pest management and frost protection [18]. Thus, this study aims to predict the bud progression for three commercial peach cultivars using Growing Degree Days (GDD) from dormancy release (budbreak). The budbreak stage was previously calculated with the chilling and heat units needed to fulfil the requirements [21]. The peach floral bud progression is presented in detail and allows us to know that there is no synchronicity for the phenological stages because of the overlapping of several stages through time. Furthermore, a sigmoidal model for the progression of each stage was adjusted.
2. Materials and Methods
2.1. Plant Material
Five cuttings per cultivar with latent buds were randomly sampled every week, for 23 weeks, from September to March in years 2021–2022 and 2022–2023. Ten-year-old peach trees of ‘Rubyprince’, ‘Harvester’, and ‘Red Globe’ cultivars were evaluated in this study. The cultivars were selected according to chilling hours (CH) requirements: ‘Rubyprince’, 850 CH; ‘Red Globe’, 850 CH; and ‘Harvester’, 750 CH [21].
Samples came from a peach orchard located at the Chilton Research and Extension Center in Clanton, Alabama (32°55”14’ N; 86°40”20’ W). Orchard management practices were followed according to the recommendations for the area [22].
Shoots collected were located from 1.8 to 2.4 m from the ground, at 45°angles vertical from the canopy [23]. The cutting lengths ranged between 20–50 cm. Pruners were used to collect the shoots from both the north- and south-facing sides of the tree to homogenize the samples and reduce the effect of sunlight and microclimate. Samples were covered with moistened paper towels and placed into Ziploc bags in a cooler. Once samples arrived in the lab, they were cut diagonally and placed in beakers with 250 mL of water and 10 g of activated carbon to keep them moist.
2.2. Budbreak
According to progressive sampling collection (every week), buds accumulated different amounts of chilling hours from the field, simulating different winter scenarios in a previous study [21]. The budbreak stage was registered under laboratory conditions (2021–2022) and in growth chambers (2022–2023). The dynamics of budbreaks were assessed in 1570 buds, including vegetative and floral buds, during both seasons. No extra chilling was applied for samples. Continued observations of the floral buds were made to determine their progression.
2.3. Controlled Conditions
Shoot samples remained under laboratory conditions during season 1 (2021–2022). During season 2, the shoots were placed in plant growth chambers (Percival and Conviron) (with two shelves and two light bars) with a relative humidity of 60% and a set photoperiod (12 h/24 h). The ambient temperature used was 23 °C for both seasons, in both laboratory and growth chambers [24,25,26].
2.4. Temperature Data
A temperature database from the laboratory and growth chambers was created to establish the thermal requirements for the bud progression once the dormancy release was completed. The temperature was registered as soon as the first sample arrived at the laboratory, and the heat accumulation was calculated for each stage. The database included daily temperature records from early Fall to early Spring in years 2021–2022 and 2022–2023.
2.5. Heat Requirements
The Growing Degree model was used to calculate the heat requirements for bud progression in terms of thermal time (TT) determined as the sum of the differences in the daily average temperature (Ti) above the base temperature (Tb) [27,28] (Equation (1)).
where TT is thermal time, accumulated from the first day (i) of the phenological stage occurrence until the day the next stage happens (n), and Tb represents the base temperature defined as the threshold at which the plant stops growing; in this case, 4.5 °C is widely referenced and used for peaches [21,29,30,31]. GDD for the budbreak stage were calculated using a combination of the temperature from the field and controlled conditions due to the samples being collected gradually, using September 1 as a starting date. GDD for the following stages were determined using the temperature from the laboratory and growth chamber conditions; thus, accumulation occurred from the end of the previous stage until the appearance of the following stage.
2.6. Bud Progression Assessment
Once the samples reached dormancy release during the first experiment [21], they remained in the laboratory under the same conditions. A database was created over time from daily observations to determine the time necessary to reach each subsequent phenological stage. The bud stages identified were as follows: (1) green calyx or budbreak, when the top of the bud opens; (2) inch green, 1/4 of the leaf tissue showing from the leaf buds; (3) pink, as flower buds expanded and elongated in preparation for open blooms; (4) first bloom, when the first flowers open; (5) full bloom, the stage where most of the flowers are open, and (6) petal fall, described as the moment when petals fall off easily [11].
2.7. Floral Progression Percentage
The total percentage of the stages was obtained for each cultivar in terms of days of the year (DOY). A logistic function was used to fit the distribution of the percentages over time (Equation (2)).
where f is the logistic function including the parameters a as the maximum percentage, b as the slope rate, and c as the maximum rate in terms of percentage. The parameter a was standardized due to all the stages reaching 100%.
3. Data Analysis and Floral Bud Prediction
A nonlinear regression procedure (ProcNLIN) in the Statistical Analysis System (SAS version 9.4; SAS Institute Inc., Cary, NC, USA) was used to estimate three different parameters of a logistic curve. We used the Gauss–Newton method to fit the percentages of stages by cultivar and reach the optimal model parameters while the error sum of squares was minimized.
Predicted and observed percentages for a specific phenological stage and associated length of said phase (days) with each combination of parameters were statistically compared using the statistics root mean square error (RMSE) [32,33,34,35] (Equation (3)) and 1:1 regression of the predicted and the observed values for each cultivar.
where Pi and Oi are the predicted and observed percentages for the bud progression (i), and n is the number of days needed to complete them.
4. Results
4.1. Bud Progression
A total of seven stages were characterized for each cultivar evaluated (Figure 1) [11], according to the classification described for peach growth stages in Alabama [36].
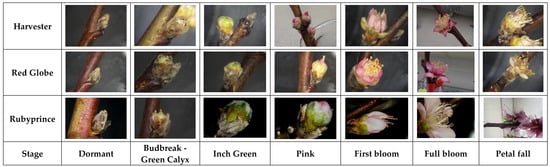
Figure 1.
The phenological scale for three peach commercial cultivars obtained in laboratory and growth chamber conditions.
The dynamics of floral and vegetative budbreaks were assessed on about 1570 buds, in both seasons. A total of 817 buds did not reach dormancy release basically due to the absence of chilling hours required. During season 1 (2021–2022), a total of 173 floral buds reached the budbreak stage and 46 of them completed the full bloom stage during season 1 (2021–2022). For season 2 (2022–2023), 342 buds completed the full bloom stage out of 580 recorded budbreaks.
In our previous study, chilling accumulation was performed using a continued collection of shoots, setting the base for the progression of floral development, where most of the floral buds for all cultivars evaluated needed at least 704 chilling hours for budbreak, and the subsequent floral buds developed until the full bloom stage [21]. For season 1, the last sample of floral buds of ‘Harvester’ and ‘Red Globe’ cultivars came from the field with 985 chilling hours accumulated until 18 February 2022, reaching budbreak and ensuring successive flower development. Rubyprince showed a successful floral development in those buds that accumulated 898 chilling hours. Similarly, during season 2, most of the buds reached the full bloom stage with a previous accumulation from 740 to 792 chilling hours until 24 February 2023. These results showed the relevance of fulfilled chilling accumulation for both budbreak and floral development stages until the full bloom stage.
‘Rubyprince’ was the cultivar with the best performance for both seasons in the progression of the stages as well as in the total number of floral buds that reached the full bloom stage. To determine the full bloom stage, the date on which each flower was completely open was recorded according to the progressive sample collection methodology. A total of 67.39% of ‘Rubyprince’ buds reached the full bloom stage, followed by ‘Red Globe’ and ‘Harvester’ with 23.91% and 8.69%, respectively, during season 1. In season 2, 36.84% of ‘Rubyprince’ buds reached the full bloom stage, while ‘Red Globe’ had 33.91% and ‘Harvester’ had 29.33% of total buds reaching full bloom.
4.2. Thermal Requirements and Base Temperature
The date of appearance of the seven bud stages varied among cultivars. It was defined in terms of Growing Degree Days (GDD) and calendar days. GDD for the budbreak stage were calculated in a previous study [21] for both seasons as the result of the combination of the temperatures from field and controlled conditions due to the samples being collected gradually, using September 1 as a starting date. GDD for the following stages were determined using the temperature from the laboratory and growth chamber conditions (Table 1). After the dormancy break, samples needed between 23–39 and 37–42 days to reach the petal fall stage during season 1 and season 2, respectively.

Table 1.
Bud progression in terms of GDD (using a base temperature of 4.5 °C) and days for each cultivar in both seasons. The GDD and the days required for the budbreak stage were determined in the first part of the experiment [21].
During season 1 (2021–2022), ‘Harvester’ took longer than ‘Red Globe’ and ‘Rubyprince’ in most of the bud stages (inch green, full bloom, and petal fall), while during season 2, ‘Rubyprince’ and ‘Harvester’ were the most delayed. In terms of GDD, the bud progression (between inch green and petal fall stages) in season 1 required 425.5, 536.5, and 721.5 GDD for ‘Red Globe’, ‘Rubyprince’, and ‘Harvester’, cultivars, respectively. For season 2, 684.5, 758.5, and 777 GDD were needed for the ‘Red Globe’, ‘Harvester’, and ‘Rubyprince’ cultivars. Pink, first bloom, full bloom, and petal fall stages had the highest demand for GDD.
‘Harvester’ and ‘Rubyprince’ were the cultivars with the highest heat requirement in terms of GDD during season 1 and season 2 as well as in days to progress from inch green to the petal fall phase. The ranges obtained between cultivars in terms of GDD and days can be explained by the type of methodology used in this experiment, where data collection was progressive. This indicates that climate variation (warm, mild, and cold winters) was simulated by collecting shoots in different weeks consecutively.
4.3. Floral Progression Percentage
For season 1, ‘Rubyprince’ was the first cultivar to reach floral budbreak starting on 16 January 2022, followed by ‘Red Globe’ and ‘Harvester’. For the second evaluation period, ‘Harvester’ had the earliest floral budbreak beginning on 2 January 2023, followed by ‘Rubyprince’ and ‘Red Globe’ (Table 1). In terms of the day of the year, most of the bud stages for ‘Harvester’ (season 1) developed from day 47 to 85 while ‘Red Globe’ and ‘Rubyprince’ displayed stage development during days 39–90 and 13–80, respectively. Season 2 showed most of the stages during days 5 to 95 in the ‘Harvester’ cultivar, 17–95 for ‘Red Globe’, and 15–95 days for ‘Rubyprince”.
According to the adjusted logistic model, the days when the maximum rate of the stages (parameter c) occurred for ‘Harvester’ were between days 58 and 74 during season 1 and days 45 and 67 in season 2. The ‘Red Globe’ cultivar showed a maximum rate in ranges of 56 to 70 days during season 1 and 51 to 71 days in season 2. The highest rate of phenological development in ‘Rubyprince’ ranged between days 48 and 65 in the first evaluation period and between days 44 and 61 during season 2 (Figure 2).

Figure 2.
Model adjusted for the distribution of the total percentages for the bud progression relative to days of the year. Each color represents a phenological stage: BB—budbreak (red), IG—inch green (brown), P—pink (yellow), FB—first bloom (blue), FB1—full bloom (green), and PF—petal fall (pink).
4.4. Modeling the Bud Progression
The sigmoidal trend for the percentage floral bud progression over time was fitted using a logistic adjustment. The logistic model and three different parameters were used to estimate the percentage values for floral bud progression. Evaluation of the model was performed using the statistics of root mean square error (RMSE) and a 1:1 line of observed vs. predicted values for each stage, cultivar, and season. As an example, the 1:1 line is presented in Figure 3 for all stages of the ‘Rubyprince’ cultivar. The graphs for ‘Harvester’ and ‘Red Globe’ cultivars for both seasons are listed in Appendix A. The RMSE varied between 0.375% and 0.620% for the floral bud progression for season 1 and between 0.429% and 0.647% for season 2 (Table 2). The statistics indicated a good fit for both seasons and the overall evaluation ensured that the simulated values were within an acceptable range of the observed data. The models had a significant p-value (<0.0001).
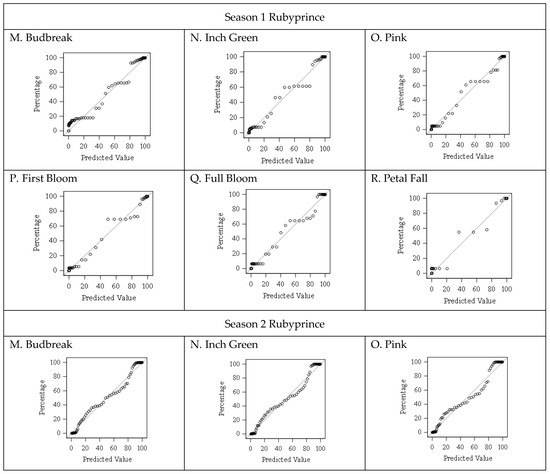
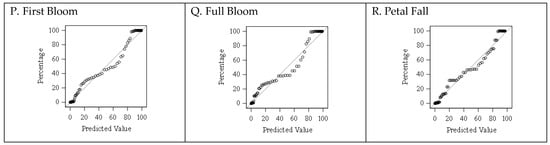
Figure 3.
Comparison between predicted and observed percentages for the floral bud progression in the Rubyprince cultivar.
Table 2.
The RMSE statistic and the logistic equations (where doy = Days of the year) for the Rubyprince cultivar for season 1 (2021–2022) and season 2 (2022–2023).
Using the parameters b and c and 95% confidence limits, the intervals were plotted for each cultivar in both evaluation periods (Figure 4). For season 1 (2021–2022), cultivars showed differences in the slope rate percentage of budbreak and petal fall stages. In contrast, the ‘Red Globe’ and ‘Rubyprince’ cultivars did not show differences in the percentages of inch green, pink, and first bloom stages. ‘Red Globe’ was different from ‘Harvester’ and ‘Rubyprince’ regarding the total percentage of the full bloom stage. Regarding the maximum increase rate in terms of percentage, cultivars showed differences in all bud stages. In season 2 (2022–2023), cultivars were different in the percentages of all stages except petal fall, where ‘Harvester’ and ‘Rubyprince’ did not show differences in percentage. Budbreak and pink stages were not different in the highest increase rate of percentage, contrary to inch green, first bloom, full bloom, and petal fall.

Figure 4.
Confidence intervals for two of the logistic function parameters of the different floral bud stages. The stages are described as BB—budbreak, IG—inch green, P—pink, FB—first bloom, FB1—full bloom, and PF—petal fall.
5. Discussion
The total number of floral buds and the progression of the stages were different in season 1 (2021–2022) compared with season 2 (2022–2023). During season 2, 58.96% of budbreaks reached the full bloom stage while, during season 1, 26.58% of floral buds reached full bloom. These differences could be attributed to the influence of the chilling accumulated under the different winter scenarios simulated in this experiment. Most of the floral buds which came from the field with the highest chilling hour accumulation (samples collected during February for both seasons) reached the full bloom stage. It has been described that flowering could be affected by failure to fulfil chilling requirements, showing a delayed flowering date and extended flowering period [37]. Also, deficient chilling accumulation has been considered a limiting factor for peach adaptation [38]. The flower buds collected during September and October for each season, that had less than 139 CH accumulated, did not reach budbreak and subsequent floral progression.
In addition, the use of a growth chamber during season 2 could have influenced the results, since, during this period, temperature, relative humidity, and light were more strictly controlled. Temperature has been referenced as the primary controlling factor for peach and other fruits like grape [39], and variations in it could affect the results. Therefore, the use of growth chambers to ensure temperature control is suggested, as well as the need to add more years of data to develop a robust model.
In the same way, it is recommended for modeling purposes to use different temperatures to estimate bud progression to determine the effect of temperature. The specific response of bud stages could be characterized accurately based on the individual occurrences of stages and phenophases [39].
Regarding the cultivar with the best performance during the experiment, ‘Rubyprince’ showed a good progression of bud stages as well as a high total number of floral buds that reached the full bloom stage during both evaluation periods. This condition could be explained by the bud conditions among cultivars. For example, the endurance of peach flower buds is related to multiple requirements such as bud preconditioning, bud hardiness, bud development uniformity, and bud density. The number of floral buds varies according to shoot length, the total of nodes per unit length, and flower buds per node [23]. Although this was not the approach of this study, this is valuable information in the determination of cultivar selection because it could assist in decision making during thinning activity and peach quality and yield. Hypothetically, environmental conditions under controlled conditions may encourage more rapid development or the isolation of floral bud samples freed from any inhibitory factor present in the parent tree [40]. The chilling requirement in cultivars is a condition that could also influence results. Although ‘Rubyprince’ has a high chilling requirement, it is considered an early-season cultivar that determines the season of ripening time, varying according to production areas and years [41]. This requirement identification in cultivars is critical in defining adaptation as an element in decisions for future orchard establishment [42].
Another condition attached to buds’ survival under controlled conditions is the possibility of getting dry. Bud dryness was not likely a problem in this study because during the experiment, shoots were trimmed at least once per month longitudinally to obtain the greatest possible surface contact with the water and reduce mortality. Additionally, the water was replaced at least once per week to prevent bacterial growth.
To determine the full bloom stage or date, most of the methodologies in the literature are focused on the moment when the cultivar reaches 50% of fully open flowers [12,15]. In this research, observations were made for each one of the floral buds, and the full bloom dates were recorded individually. This is due to the methodology used, where sampling collection was progressive, once per week for 23 weeks for two seasons. In this way, floral buds did not reach the bloom stage on the same date; it was gradual according to the amount of chilling requirement met from the field and the amount of heat requirement accumulated. One question that remains is how accurately the use of a date determines a specific floral bud stage knowing that there is overlap among stages of the three cultivars in each condition and season.
Factors such as the position of branches, orientation, and the amount of light received can speed up this process in some areas. For example, most floral buds are located at the top and close to the outer edge of the canopy, taking advantage of development, size, color, and solids content once they become fruits. In contrast, those located under shade are susceptible to fruit drops. Similarly, reproductive buds could compete at the top of the tree when they are on the same node [43].
In terms of thermal requirements (GDD), ‘Harvester’ was the most demanding cultivar followed by ‘Red Globe’ and ‘Rubyprince’ during the first evaluation period. These results agree with those presented in previous research [21], where this cultivar took longer for dormancy release, delaying the floral progression. During the second season, ‘Rubyprince’ accumulated more heat than ‘Harvester’ and ‘Red Globe’ during stage development.
The progressive methodology applied in this study allows the simulation of warm, mild, and cold winters because the samples replicated different scenarios with low, mid, and high chilling and heat accumulation. This is necessary in the context of climate variability because unexpected variations in the temperature could lead to a modification in the mean flowering dates of around 7–9 days for species such as apples [44].
6. Conclusions
Successful floral bud development is linked to effective chilling accumulation during the dormancy phase. Thus, warm winters trigger a high reduction in peach yield, as this experiment shows, because chilling requirements established for the cultivars were not met; thus, the full bloom stage was delayed or did not happen. On the other hand, under cold winter scenarios, the heat requirements could be affected when the floral buds receive more chilling hours than they need [45].
Although it was demonstrated that ‘Rubyprince’ was the cultivar with the best performance in the transition of bud progression and the percentage of flower buds that reached full bloom, it is necessary to complement the results with the evaluation of bud density which is relevant information in orchard management practices such as thinning and pruning.
We were able to model the progression of key phenological stages of three peach commercial cultivars using a logistic model and this can be a useful tool to assess the progression of the stages during critical months to assist with orchard cultural practices.
This study showed there was variability in the parameters of the model, depending on season, cultivar, and stage. We found that there were also differences in the number of days required to reach maximum percentages of stages between cultivars and seasons due to temperature differences. This confirms that the use of GDD is a better approach than using calendar days for the estimation of floral bud progression. The results of this study contribute to the understanding of floral bud progression in peaches which is critical for crop management practices.
Author Contributions
Conceptualization, M.R.S.-G.; Methodology, B.C.-C., E.L.V.III and M.R.S.-G.; Formal analysis, A.C.-C., B.C.-C. and M.R.S.-G.; Investigation, A.C.-C. and M.R.S.-G.; Resources, E.L.V.III, E.D.C. and M.R.S.-G. Writing—original draft, A.C.-C. and M.R.S.-G. Writing—review and editing, B.C.-C., E.L.V.III, E.D.C., D.J.C. and M.R.S.-G.; Visualization, B.C.-C.; Funding acquisition, M.R.S.-G. All authors have read and agreed to the published version of the manuscript.
Funding
AAES Awards for Production Agriculture Research (PAR), Seed grant Auburn University Grants # 3702263039272055; 1036263039272055. Southern Sustainable Agriculture Research and Education Program (SARE) Grant # 2457061214012002.
Data Availability Statement
No new data were created or analyzed in this study. Data sharing is not applicable to this article.
Conflicts of Interest
The authors declare no conflict of interest.
Appendix A
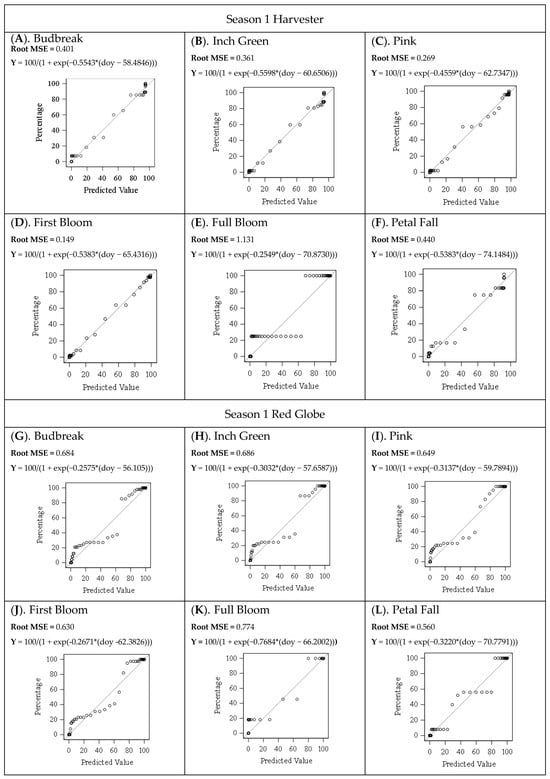
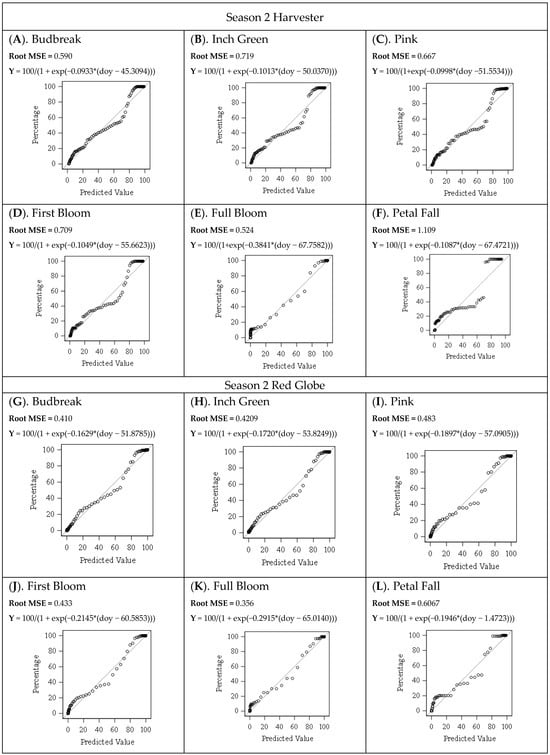
Figure A1.
Predicted and Observed Values of the Floral Bud Progression for Both Seasons for Harvester and Red Globe Cultivars. p-Value (<0.0001).
References
- Luna, V.; Lorenzo, E.; Reinoso, H.; Tordable, M.C.; Abdala, G.; Pharis, R.P.; Bottini, R. Dormancy in peach (Prunus persica L.) flower buds: I. Floral morphogenesis and endogenous gibberellins at the end of the dormancy period. Plant Physiol. 1990, 93, 20–25. [Google Scholar] [CrossRef]
- Lloret, A.; Quesada-Traver, C.; Ríos, G. Models for a molecular calendar of bud-break in fruit trees. Sci. Hortic. 2022, 297, 110972. [Google Scholar] [CrossRef]
- Baraldi, R.; Rossi, F.; Facini, O.; Fasolo, F.; Rotondi, A.; Magli, M.; Nerozzi, F. Light environment, growth and morphogenesis in a peach tree canopy. Physiol. Plant. 1994, 91, 339–345. [Google Scholar] [CrossRef]
- Considine, M.J.; Foyer, C.H. Redox regulation of plant development. Antioxid. Redox Signal. 2014, 21, 1305–1326. [Google Scholar] [CrossRef]
- Cirilli, M.; Gattolin, S.; Chiozzotto, R.; Baccichet, I.; Pascal, T.; Quilot-Turion, B.; Rossini, L.; Bassi, D. The Di2/pet variant in the PETALOSA gene underlies a major heat requirement-related QTL for blooming date in peach [Prunus persica (L.) Batsch]. Plant Cell Physiol. 2021, 62, 356–365. [Google Scholar] [CrossRef]
- Lloret, A.; Badenes, M.L.; Ríos, G. Modulation of dormancy and growth responses in reproductive buds of temperate trees. Front. Plant Sci. 2018, 9, 1368. [Google Scholar] [CrossRef]
- Meier, U. Growth stages of mono- and dicotyledoneous plants. Fed. Biol. Res. Cent. Agric. For. 2001, 204, 962304. [Google Scholar]
- Ramírez, F.; Davenport, T.L. The phenology of the capuli cherry [Prunus serotina subsp. capuli (Cav.) McVaugh] characterized by the BBCH scale, landmark stages and implications for urban forestry in Bogotá, Colombia. Urban For. Urban Green. 2016, 19, 202–211. [Google Scholar] [CrossRef]
- Sakar, E.H.; El Yamani, M.; Boussakouran, A.; Rharrabti, Y. Codification and description of almond (Prunus dulcis) vegetative and reproductive phenology according to the extended BBCH scale. Sci. Hortic. 2019, 247, 224–234. [Google Scholar] [CrossRef]
- Meier, U.; Bleiholder, H.; Buhr, L.; Feller, C.; Hack, H.; Heß, M.; Lancashire, P.D.; Schonock, U.; Stauß, R.; Van Dem Boom, T.; et al. The BBCH system to coding the phenological growth stages of plants–history and publications. J. Für Kult. 2009, 61, 41–52. [Google Scholar]
- Hortan, D.; Johnson, D.T. Southeastern Peach Growers’ Handbook; Cooperative Extension Service; University of Georgia: Athens, Georgia, 2005. [Google Scholar]
- Verma, P.; Singh, J.; Sharma, S.; Thakur, H. Phenological growth stages and growing degree days of peach [Prunus persica (L.) Batsch] in sub-temperate climatic zone of North-Western Himalayan region using BBCH scale. Ann. Appl. Biol. 2022, 182, 284–294. [Google Scholar] [CrossRef]
- Hsiang, T.F.; Lin, Y.J.; Yamane, H.; Tao, R. Characterization of Japanese apricot (Prunus mume) floral bud development using a modified BBCH scale and analysis of the relationship between BBCH stages and floral primordium development and the dormancy phase transition. Sci. Hortic. 2021, 7, 142. [Google Scholar] [CrossRef]
- Fadón, E.; Herrero, M.; Rodrigo, J. Flower development in sweet cherry framed in the BBCH scale. Sci. Hortic. 2015, 192, 141–147. [Google Scholar] [CrossRef]
- Mounzer, O.H.; Conejero, W.; Nicolás, E.; Abrisqueta, I.; Garcia-Orellana, Y.V.; Tapia, L.M.; Vera, J.; Abrisqueta, J.M.; Del Carmen Ruiz-Sánchez, M. Growth pattern and phenological stages of early-maturing peach trees under a Mediterranean climate. HortScience 2008, 43, 1813–1818. [Google Scholar] [CrossRef]
- Okie, W.R.; Blackburn, B. Increasing chilling reduces heat requirement for floral bud break in peach. HortScience 2011, 46, 245–252. [Google Scholar] [CrossRef]
- Schwartz, M.D.; Carbone, G.J.; Reighard, G.L.; Okie, W.R. A Model to predict peach phenology and maturity using meteorological variables. HortScience 1997, 32, 213–216. [Google Scholar] [CrossRef]
- Miranda, C.; Santesteban, L.G.; Royo, J.B. Evaluation and fitting of models for determining peach phenological stages at a regional scale. Agric. For. Meteorol. 2013, 178, 129–139. [Google Scholar] [CrossRef]
- Litschmann, T.; Oukropec, I.; Kirzan, B. Predicting individual phenological phases in peaches using meteorological data. Hortic. Sci. 2008, 35, 65–71. [Google Scholar] [CrossRef]
- Zhu, Y.; Chen, M.; Gu, Q.; Zhao, Y.; Zhang, X.; Sun, Q.; Gu, X.; Zheng, K. Machine learning methods for effi-cient and automated in situ monitoring of peach flowering phenology. Comput. Electron. Agric. 2022, 202, 107370. [Google Scholar] [CrossRef]
- Cifuentes-Carvajal, A.; Chaves-Córdoba, B.; Vinson, E.; Coneva, E.D.; Chavez, D.; Salazar-Gutiérrez, M.R. Modeling the budbreak in peaches: A basic approach using chill and heat accumulation. Agronomy 2023, 13, 2422. [Google Scholar] [CrossRef]
- Blaauw, B.; Brannen, P.; Lockwood, D.; Schnabel, G.; Ritchie, D. Southeastern Peach, Nectarine, and Plum Pest Management and Culture Guide. UGA Cooperative Extension Bulletin 1171. 2023. Available online: https://ssl.acesag.auburn.edu/dept/peaches/peachipm/images/2023_SE_peach_pest_guide.pdf (accessed on 8 October 2022).
- Okie, W.R.; Werner, D.J. Genetic influence on flower bud density in peach and nectarine exceeds that of environment. HortScience 1996, 31, 1010–1012. [Google Scholar] [CrossRef]
- Erez, A.; Lavee, S. The effect of climatic conditions on dormancy development of peach buds. I. Temperature1. J. Am. Soc. Hortic. Sci. 1971, 96, 711–714. [Google Scholar] [CrossRef]
- Horsáková, J.; Krška, B. Evaluation of dormancy break in some selected peach (Prunus persica) cultivars. Hortic. Sci. 2016, 43, 181–187. [Google Scholar] [CrossRef]
- Prudencio, A.S.; Martínez-Gómez, P.; Dicenta, F. Evaluation of breaking dormancy, flowering and productivity of extra-late and ultra-late flowering almond cultivars during cold and warm seasons in South-East of Spain. Sci. Hortic. 2018, 235, 39–46. [Google Scholar] [CrossRef]
- Richardson, E.A.; Seeley, S.D.; Walker, D.R. A model for estimating the completion of rest for “Redhaven” and “Elberta” Peach Trees. HortScience 1974, 9, 331–332. [Google Scholar] [CrossRef]
- Pulido, S.; Bojaca, C.R.; Salazar, M.; Chaves, B. Node appearance model for Lulo (Solanum quitoense Lam.) in the high altitude tropics. Biosyst. Eng. 2008, 101, 383–387. [Google Scholar] [CrossRef]
- Citadin, I.; Raseira, M.C.B.; Herter, F.G. Heat requirement for blooming and leafing in peach. HortScience 2001, 36, 305–307. [Google Scholar] [CrossRef]
- Atagul, O.; Calle, A.; Demirel, G.; Lawton, J.M.; Bridges, W.C.; Gasic, K. Estimating heat requirement for flowering in peach germplasm. Agronomy 2022, 12, 1002. [Google Scholar] [CrossRef]
- Łysiak, G.P.; Szot, I. The use of temperature based indices for estimation of fruit production conditions and risks in temperate climates. Agriculture 2023, 13, 960. [Google Scholar] [CrossRef]
- Willmott, C.J. On the validation of models. Phys. Geogr. 1981, 2, 184–194. [Google Scholar] [CrossRef]
- Willmott, C.J. Some comments on the evaluation of model performance. Bull. Am. Meteorol. Soc. 1982, 63, 1309–1313. [Google Scholar] [CrossRef]
- Willmott, C.J.; Ackleson, S.G.; Davis, R.E.; Feddema, J.J.; Klink, K.M.; Legates, D.R.; O’Donnell, J.; Rowe, C.M. Statistics for the evaluation and comparison of models. J. Geophys. Res. Ocean. 1985, 90, 8995–9005. [Google Scholar] [CrossRef]
- Janssen, P.H.; Heuberger, P.S. Calibration of process-oriented models. Ecol. Model. 1995, 83, 55–66. [Google Scholar] [CrossRef]
- Coneva, E. Peach Growth Stages and Critical Temperatures Alabama. A & M Cooperative Extension Service. 2022. Available online: https://www.aces.edu/blog/topics/crop-production/peach-growth-stages-critical-temperatures (accessed on 5 August 2023).
- Ghrab, M.; Mimoun, M.B.; Masmoudi, M.M.; Mechlia, N.B. Chilling trends in a warm production area and their impact on flowering and fruiting of peach trees. Sci. Hortic. 2014, 178, 87–94. [Google Scholar] [CrossRef]
- Scalisi, A.; Lo Bianco, R.; Pernice, F.; Motisi, A. Climatic characterization and phenology of local peach genotypes in the Udzungwa uplands of Tanzania. Int. J. Fruit Sci. 2014, 14, 388–404. [Google Scholar] [CrossRef]
- Zapata, R.D.M. Modelling the Key Phenological Stages and Dormancy of Individual Grapevine Cultivars. Master’s Thesis, Biological and Agricultural Engineering Washington State University, Prosser, WA, USA, 2015. [Google Scholar]
- Basconsuelo, S.; Reinoso, H.; Lorenzo, E.; Bottini, R. Dormancy in peach (Prunus persica L.) flower buds: IV. Morphogenesis of excised buds as influenced by chilling and gibberellin A 3. Plant Growth Regul. 1995, 16, 113–119. [Google Scholar] [CrossRef]
- Chen, C. (USDA, Agricultural Research Service, Byron, GA, USA). Personal communication, 2023.
- Fadón, E.; Herrera, S.; Guerrero, B.I.; Guerra, M.E.; Rodrigo, J. Chilling and heat requirements of temperate stone fruit trees (Prunus sp.). Agronomy 2020, 10, 409. [Google Scholar] [CrossRef]
- Costa, G.; Vizzotto, G. Fruit thinning of peach trees. Plant Growth Regul. 2000, 31, 113–119. [Google Scholar] [CrossRef]
- Celton, J.M.; Martinez, S.; Jammes, M.J.; Bechti, A.; Salvi, S.; Legave, J.M.; Costes, E. Deciphering the genetic determinism of bud phenology in apple progenies: A new insight into chilling and heat requirement effects on flowering dates and positional candidate genes. New Phytol. 2011, 192, 378–392. [Google Scholar] [CrossRef]
- Kwon, J.H.; Nam, E.Y.; Yun, S.K.; Kim, S.J.; Song, S.Y.; Lee, J.H.; Hwang, K.D. Chilling and heat requirement of peach cultivars and changes in chilling accumulation spectrums based on 100-year records in republic of Korea. Agric. For. Meteorol. 2020, 288, 108009. [Google Scholar] [CrossRef]
Disclaimer/Publisher’s Note: The statements, opinions and data contained in all publications are solely those of the individual author(s) and contributor(s) and not of MDPI and/or the editor(s). MDPI and/or the editor(s) disclaim responsibility for any injury to people or property resulting from any ideas, methods, instructions or products referred to in the content. |
© 2024 by the authors. Licensee MDPI, Basel, Switzerland. This article is an open access article distributed under the terms and conditions of the Creative Commons Attribution (CC BY) license (https://creativecommons.org/licenses/by/4.0/).