
Classification of Popcorn (Zea mays var. everta) Using Near-Infrared Spectroscopy to Assess Zearalenon Risk Mitigation Strategies


Abstract
1. Introduction
2. Materials and Methods
2.1. Popcorn Samples
2.2. Collecting Near-Infrared Spectra
2.3. Statistical Approach and Data Mining
2.3.1. Transformation and Discretization of Zearalenone Levels
2.3.2. Pre-Processing of Near-Infrared Spectra
2.3.3. CART Classification Tree and Confusion Matrix
- True Positive (TP): Number of samples correctly predicted as belonging to class 2. This would mean correctly classifying a corn sample as having mycotoxin levels above the regulatory threshold. This is a desirable classification as it identifies samples that need to be treated or disposed of to meet standards.
- False Positive (FP): Number of samples incorrectly predicted as belonging to class 2 (when they belong to class 1). This would mean incorrectly classifying a corn sample as having mycotoxin levels above the threshold when it is below the threshold. This could lead to unnecessary costs, such as rejecting healthy corn.
- True Negative (TN): Number of samples correctly predicted as not belonging to class 2. This means correctly classifying a corn sample as having mycotoxin levels below the regulatory threshold, which is a desired classification.
- False Negative (FN): Number of samples incorrectly predicted as not belonging to class 2 (when, in fact, they do belong to class 2). This means incorrectly classifying a corn sample as having mycotoxin levels below the threshold when it is above the threshold. This could result in contaminated corn being harvested and distributed.
2.3.4. Presentation of the Six Validation Strategies to Predict Contamination of Popcorn by Zearalenon
3. Results and Discussion
3.1. Zearalenone Levels in Popcorn Samples
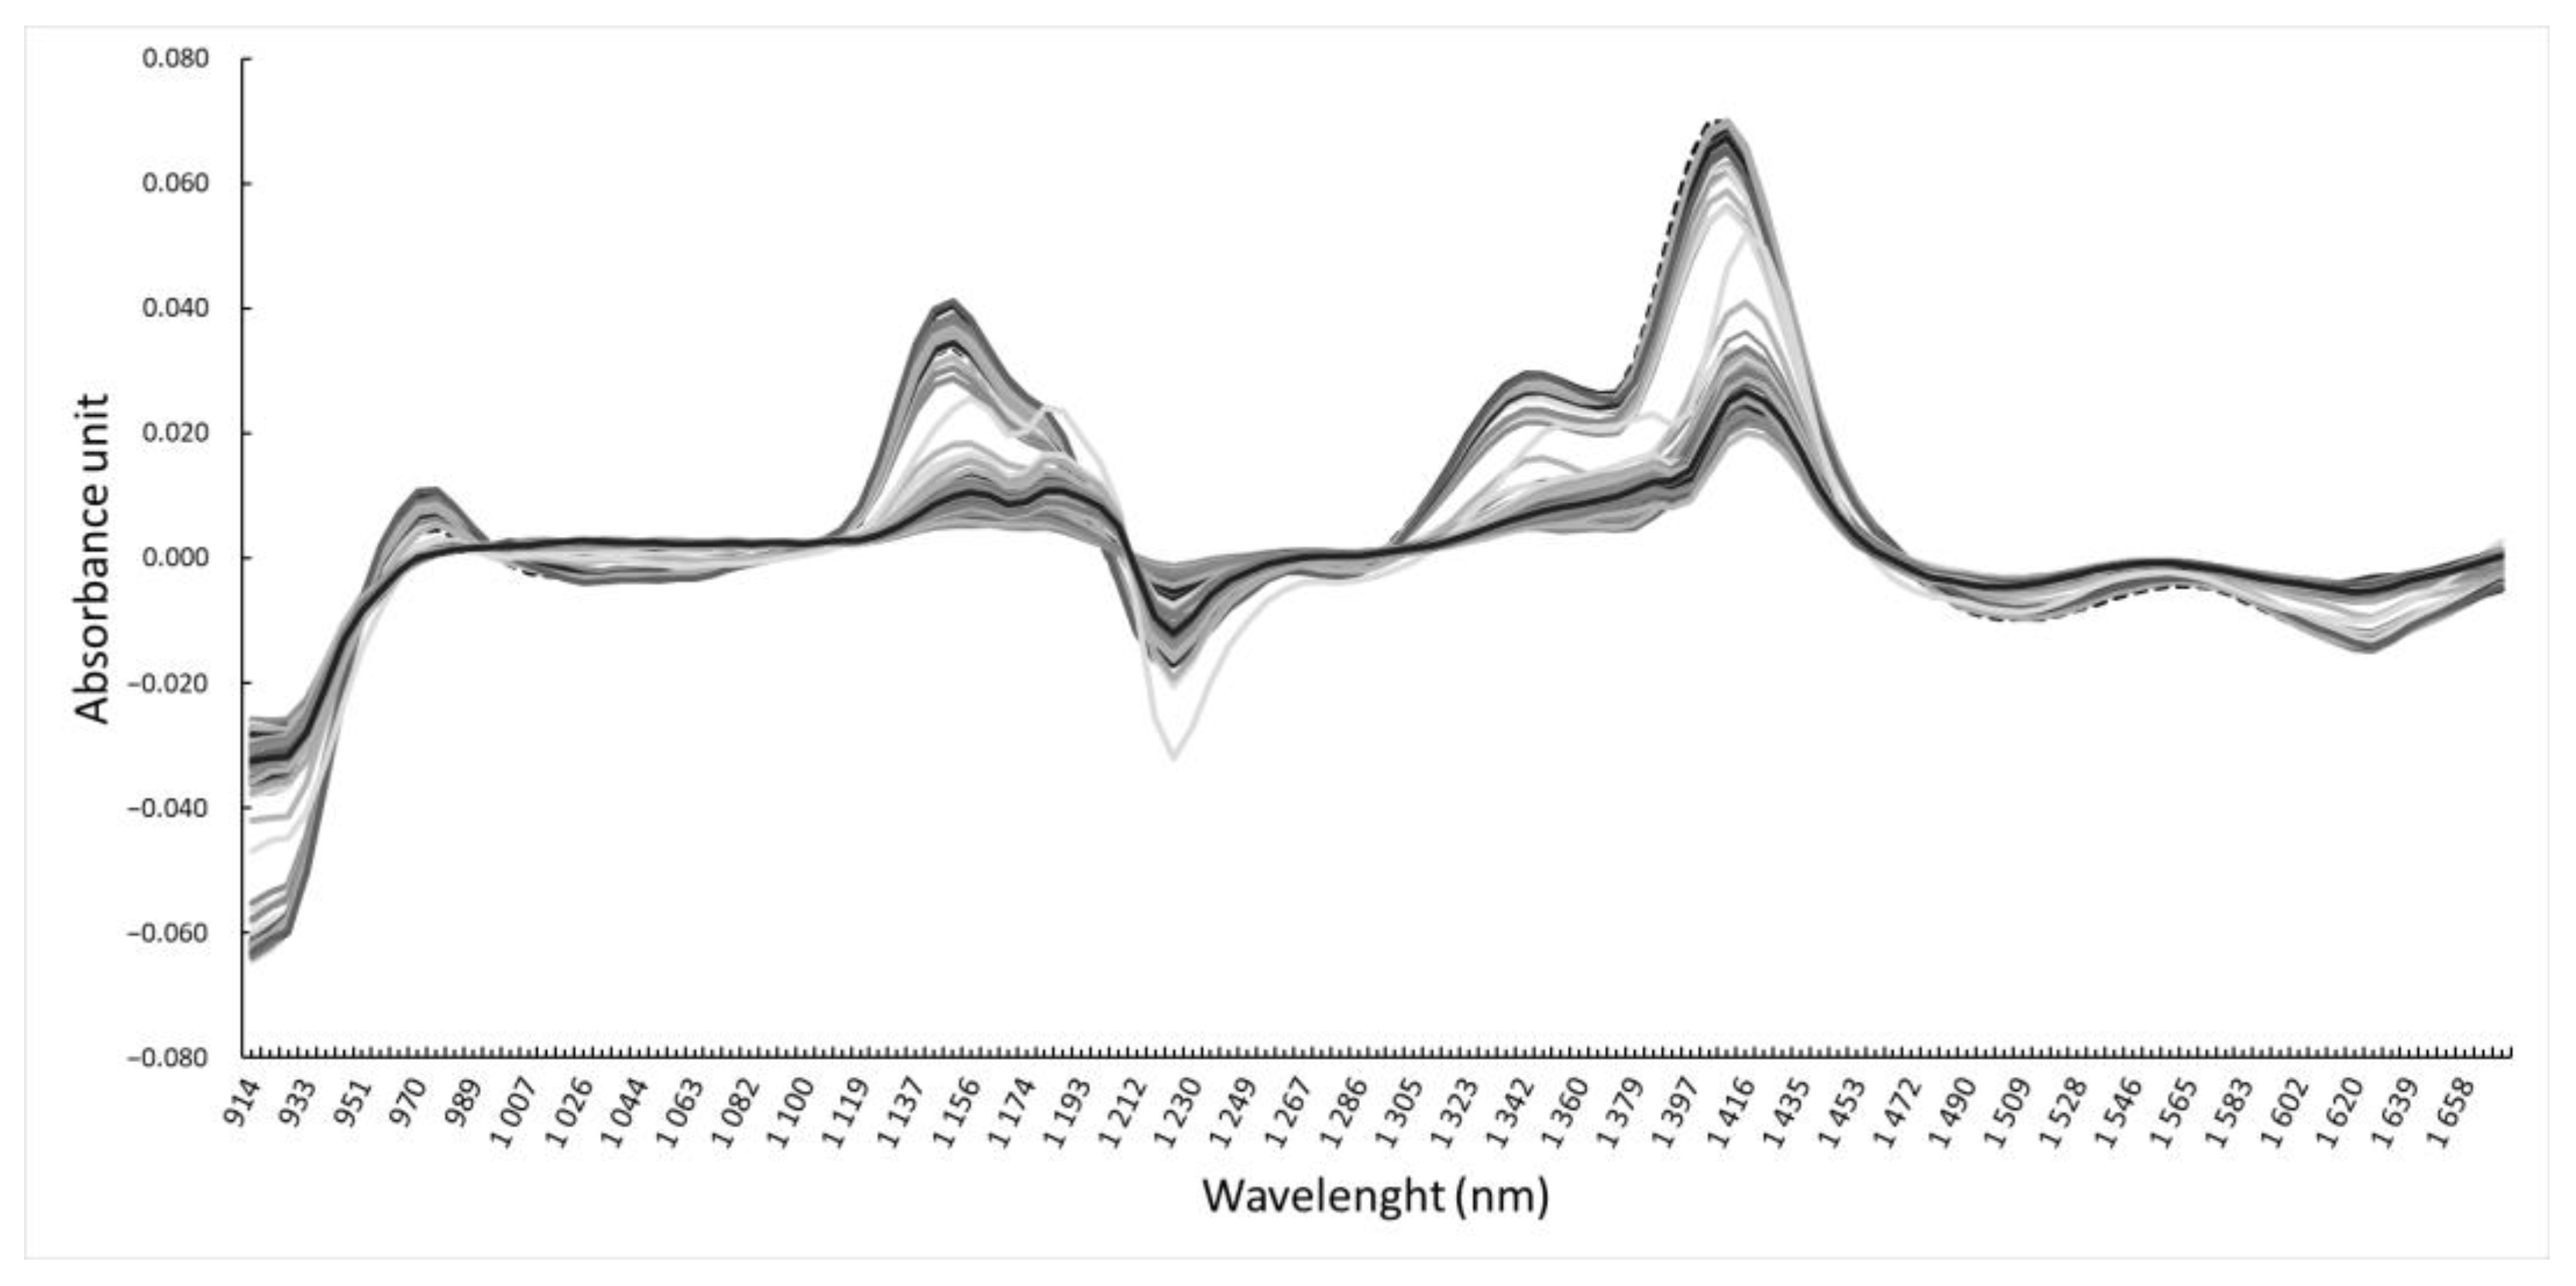
3.2. Near-Infrared Spectra
3.3. CART Model Performance
3.4. The Most Significative Wavelengths for Discriminating Zearalenone-Contaminated Popcorn Samples
4. Conclusions
Author Contributions
Funding
Institutional Review Board Statement
Informed Consent Statement
Data Availability Statement
Conflicts of Interest
References
- Virot, E.; Ponomarenko, A. Popcorn: Critical temperature, jump and sound. J. R. Soc. Interface 2015, 12, 20141247. [Google Scholar] [CrossRef]
- Swarnakar, A.K.; Mohapatra, M.; Das, S.K. A review on processes, mechanisms, and quality influencing parameters for puffing and popping of grains. J. Food Process. Preserv. 2022, 46, e16891. [Google Scholar] [CrossRef]
- Tyska, D.; Mallmann, A.O.; Vidal, J.K.; Almeida, C.A.A.d.; Gressler, L.T.; Mallmann, C.A. Multivariate method for prediction of fumonisins B1 and B2 and zearalenone in Brazilian maize using Near Infrared Spectroscopy (NIR). PLoS ONE 2021, 16, e0244957. [Google Scholar] [CrossRef]
- European Commission. Commission Regulation (EC) No. 1881/2006 setting maximum levels for certain contaminants in foodstuffs. Off. J. Eur. Union 2006, 364, 5–24. [Google Scholar]
- Commission des Communautés Européennes. Commission du 28 septembre 2007 modifiant le réglement (CE) n°1881/2006 portant fixation de teneurs maximales pour certains contaminants dans les denrées alimentaires en ce qui concerne les toxines de Fusarium dans le maïs et les produits à base de maïs. J. Off. L’Union Eur. 2007, 1126/2007, 14–17. [Google Scholar]
- European Commission. Commission Regulation (EC) No 1126/2007 of 28 September 2007 amending Regulation (EC) No 1881/2006 setting maximum levels for certain contaminants in foodstuffs as regards Fusarium toxins in maize and maize products. Off. J. Eur. Union 2007, L255, 14–16. [Google Scholar]
- European Commission. Commission Recommendation of 17 August 2006 on the Presence of Deoxynivalenol, Zearalenone, Ochratoxin A, T-2 and HT-2 and Fumonisins in Products Intended for Animal Nutrition (2006/576/EC as Amended) (OJ. L./229/7). Off. J. Eur. Union. 2006, 229, 7–9. [Google Scholar]
- Ji, F.; He, D.; Olaniran, A.; Mokoena, M.; Xu, J.; Shi, J. Occurrence, toxicity, production and detection of Fusarium mycotoxin: A review. Food Prod. Process. Nutr. 2019, 1, 1–14. [Google Scholar] [CrossRef]
- Braun, M.S.; Wink, M. Exposure, occurrence, and chemistry of fumonisins and their cryptic derivatives. Compr. Rev. Food Sci. Food Saf. 2018, 17, 769–791. [Google Scholar] [CrossRef]
- Ropejko, K.; Twarużek, M. Zearalenone and Its Metabolites—General Overview, Occurrence, and Toxicity. Toxins 2021, 13, 35. [Google Scholar] [CrossRef]
- Mahato, D.K.; Devi, S.; Pandhi, S.; Sharma, B.; Maurya, K.K.; Mishra, S.; Dhawan, K.; Selvakumar, R.; Kamle, M.; Mishra, A.K.; et al. Occurrence, Impact on Agriculture, Human Health, and Management Strategies of Zearalenone in Food and Feed: A Review. Toxins 2021, 13, 92. [Google Scholar] [CrossRef]
- Caglayan, M.O.; Şahin, S.; Üstündağ, Z. Detection strategies of zearalenone for food safety: A review. Crit. Rev. Anal. Chem. 2022, 52, 294–313. [Google Scholar] [CrossRef]
- Ning, H.; Wang, J.; Jiang, H.; Chen, Q. Quantitative detection of zearalenone in wheat grains based on near-infrared spectroscopy. Spectrochim. Acta Part A Mol. Biomol. Spectrosc. 2022, 280, 121545. [Google Scholar] [CrossRef]
- Basile, T.; Mallardi, D.; Cardone, M.F. Spectroscopy, a Tool for the Non-Destructive Sensory Analysis of Plant-Based Foods and Beverages: A Comprehensive Review. Chemosensors 2023, 11, 579. [Google Scholar] [CrossRef]
- Beć, K.B.; Grabska, J.; Huck, C.W. Near-Infrared Spectroscopy in Bio-Applications. Molecules 2020, 25, 2948. [Google Scholar] [CrossRef] [PubMed]
- Brereton, R.G.; Jansen, J.; Lopes, J.; Marini, F.; Pomerantsev, A.; Rodionova, O.; Roger, J.M.; Walczak, B.; Tauler, R. Chemometrics in analytical chemistry—Part II: Modeling, validation, and applications. Anal. Bioanal. Chem. 2018, 410, 6691–6704. [Google Scholar] [CrossRef]
- Morais, C.L.; Lima, K.M.; Singh, M.; Martin, F.L. Tutorial: Multivariate classification for vibrational spectroscopy in biological samples. Nat. Protoc. 2020, 15, 2143–2162. [Google Scholar] [CrossRef]
- Cuq, S.; Lemetter, V.; Kleiber, D.; Levasseur-Garcia, C. Assessing macro-(P, K, Ca, Mg) and micronutrient (Mn, Fe, Cu, Zn, B) concentration in vine leaves and grape berries of vitis vinifera by using near-infrared spectroscopy and chemometrics. Comput. Electron. Agric. 2020, 179, 105841. [Google Scholar] [CrossRef]
- Williams, P. The RPD statistic: A tutorial note. NIR News 2014, 25, 22–23. [Google Scholar] [CrossRef]
- Levasseur-Garcia, C.; Bailly, S.; Kleiber, D.; Bailly, J.D. Assessing Risk of Fumonisin Contamination in Maize Using Near-Infrared Spectroscopy. J. Chem. 2015, 2015, 485864. [Google Scholar] [CrossRef]
- ISO/IEC 17025:2017; General Requirements for the Competence of Testing and Calibration Laboratories. International Organization for Standardization: Vernier, Switzerland, 2017.
- Schambri, P.; Brunet, S.; Bailly, J.-D.; Kleiber, D.; Levasseur-Garcia, C. Effect of Popcorn (Zea mays var. everta) Popping Mode (Microwave, Hot Oil and Hot Air) on Fumonisins and Deoxynivalenol Contamination Levels. Toxins 2021, 13, 486. [Google Scholar] [CrossRef]
- Lumivero. XLSTAT Statistical and Data Analysis Solution. Available online: https://www.xlstat.com/fr (accessed on 17 January 2024).
- Pasquini, C. Near infrared spectroscopy: A mature analytical technique with new perspectives—A review. Anal. Chim. Acta 2018, 1026, 8–36. [Google Scholar] [CrossRef]
- Tangirala, S. Evaluating the impact of GINI index and information gain on classification using decision tree classifier algorithm. Int. J. Adv. Comput. Sci. Appl. 2020, 11, 612–619. [Google Scholar] [CrossRef]
- Rajabi-Sarkhani, M.; Abbaspour-Gilandeh, Y.; Moinfar, A.; Tahmasebi, M.; Martínez-Arroyo, M.; Hernández-Hernández, M.; Hernández-Hernández, J.L. Identifying Optimal Wavelengths from Visible–Near-Infrared Spectroscopy Using Metaheuristic Algorithms to Assess Peanut Seed Viability. Agronomy 2023, 13, 2939. [Google Scholar] [CrossRef]
- Salmon, B.P.; Kleynhans, W.; Schwegmann, C.P.; Olivier, J.C. Proper comparison among methods using a confusion matrix. In Proceedings of the 2015 IEEE International Geoscience and Remote Sensing Symposium (IGARSS), Milan, Italy, 26–31 July 2015; pp. 3057–3060. [Google Scholar]
- Okparanma, R.; Araka, P.; Ayotamuno, J.; Mouazen, A. Towards enhancing sustainable reuse of pre-treated drill cuttings for construction purposes by near-infrared analysis: A review. J. Civ. Eng. Constr. Technol. 2018, 9, 19–39. [Google Scholar] [CrossRef]
- Eskola, M.; Kos, G.; Elliott, C.T.; Hajšlová, J.; Mayar, S.; Krska, R. Worldwide contamination of food-crops with mycotoxins: Validity of the widely cited ‘FAO estimate’of 25%. Crit. Rev. Food Sci. Nutr. 2020, 60, 2773–2789. [Google Scholar] [CrossRef]
- Too, E.C.; Yujian, L.; Njuki, S.; Yingchun, L. A comparative study of fine-tuning deep learning models for plant disease identification. Comput. Electron. Agric. 2019, 161, 272–279. [Google Scholar] [CrossRef]
- Tan, H.; Zhou, H.; Guo, T.; Zhang, Y.; Ma, L. Integrated multi-spectroscopic and molecular modeling techniques to study the formation mechanism of hidden zearalenone in maize. Food Chem. 2021, 351, 129286. [Google Scholar] [CrossRef]
- Yu, H.; Zhang, J.; Chen, Y.; Zhu, J. Zearalenone and Its Masked Forms in Cereals and Cereal-Derived Products: A Review of the Characteristics, Incidence, and Fate in Food Processing. J. Fungi 2022, 8, 976. [Google Scholar] [CrossRef]
- Rogowska, A.; Pomastowski, P.; Sagandykova, G.; Buszewski, B. Zearalenone and its metabolites: Effect on human health, metabolism and neutralisation methods. Toxicon 2019, 162, 46–56. [Google Scholar] [CrossRef]
- Jang, S.; Han, J.; Cho, J.; Jung, J.; Lee, S.; Lee, D.; Kim, J. Estimation of Apple Leaf Nitrogen Concentration Using Hyperspectral Imaging-Based Wavelength Selection and Machine Learning. Horticulturae 2023, 10, 35. [Google Scholar] [CrossRef]
- Rady, A.; Fischer, J.; Reeves, S.; Logan, B.; James Watson, N. The effect of light intensity, sensor height, and spectral pre-processing methods when using NIR spectroscopy to identify different allergen-containing powdered foods. Sensors 2019, 20, 230. [Google Scholar] [CrossRef] [PubMed]
- Sohn, S.-I.; Pandian, S.; Oh, Y.-J.; Zaukuu, J.-L.Z.; Na, C.-S.; Lee, Y.-H.; Shin, E.-K.; Kang, H.-J.; Ryu, T.-H.; Cho, W.-S. Vis-NIR spectroscopy and machine learning methods for the discrimination of transgenic Brassica napus L. and their hybrids with B. juncea. Processes 2022, 10, 240. [Google Scholar] [CrossRef]
- Levasseur-Garcia, C.; Kleiber, D. A method for the allotment of maize contaminated by toxins. J. Near Infrared Spectrosc. 2015, 23, 255–265. [Google Scholar] [CrossRef]

| Predicted Values | Predicted Values | ||
|---|---|---|---|
| Positive: ZEA Content > Threshold Cat. 2 | Negative: ZEA Content < Threshold Cat. 1 | ||
| Actual values | Positive: ZEA content > threshold cat. 2 | True Positive (TP) | False Negative (FN) |
| Actual values | Negative: ZEA content < threshold cat. 1 | False Positive (FP) | True Negative (TN) |
| Repartition of Spectra | Spectral Repetitions Distribution | |
|---|---|---|
| A | all in training | Only one set |
| B | 10-fold cross-validation | Not all repetitions of spectra in the same fold |
| C | 80% in training, randomly selected | Not all repetitions of spectra in the same set |
| D | 80% in training, randomly selected | All repetitions of spectra in the same set |
| E | 80% in training, Kennard and Stone | Not all repetitions of spectra in the same set |
| F | 80% in training, Kennard and Stone | All repetitions of spectra in the same set |
| Type of Validation | No. Selected Variables | No. Important Variables | Area under the ROC Curve (AUC) | Total No. Samples | TP | FN | FP | TN |
| A | 123 | 121 | 0.9658 | 273 | 122 | 12 | 12 | 127 |
| B | 123 | 118 | 0.6225 | 273 | 90 | 61 | 44 | 78 |
| C | 123 | 74 | 0.6442 | 55 | 17 | 11 | 11 | 16 |
| D | 123 | 66 | 0.6281 | 57 | 13 | 13 | 15 | 16 |
| E | 123 | 100 | 0.7114 | 55 | 12 | 8 | 10 | 25 |
| F | 123 | 11 | 0.6 | 54 | 12 | 9 | 12 | 21 |
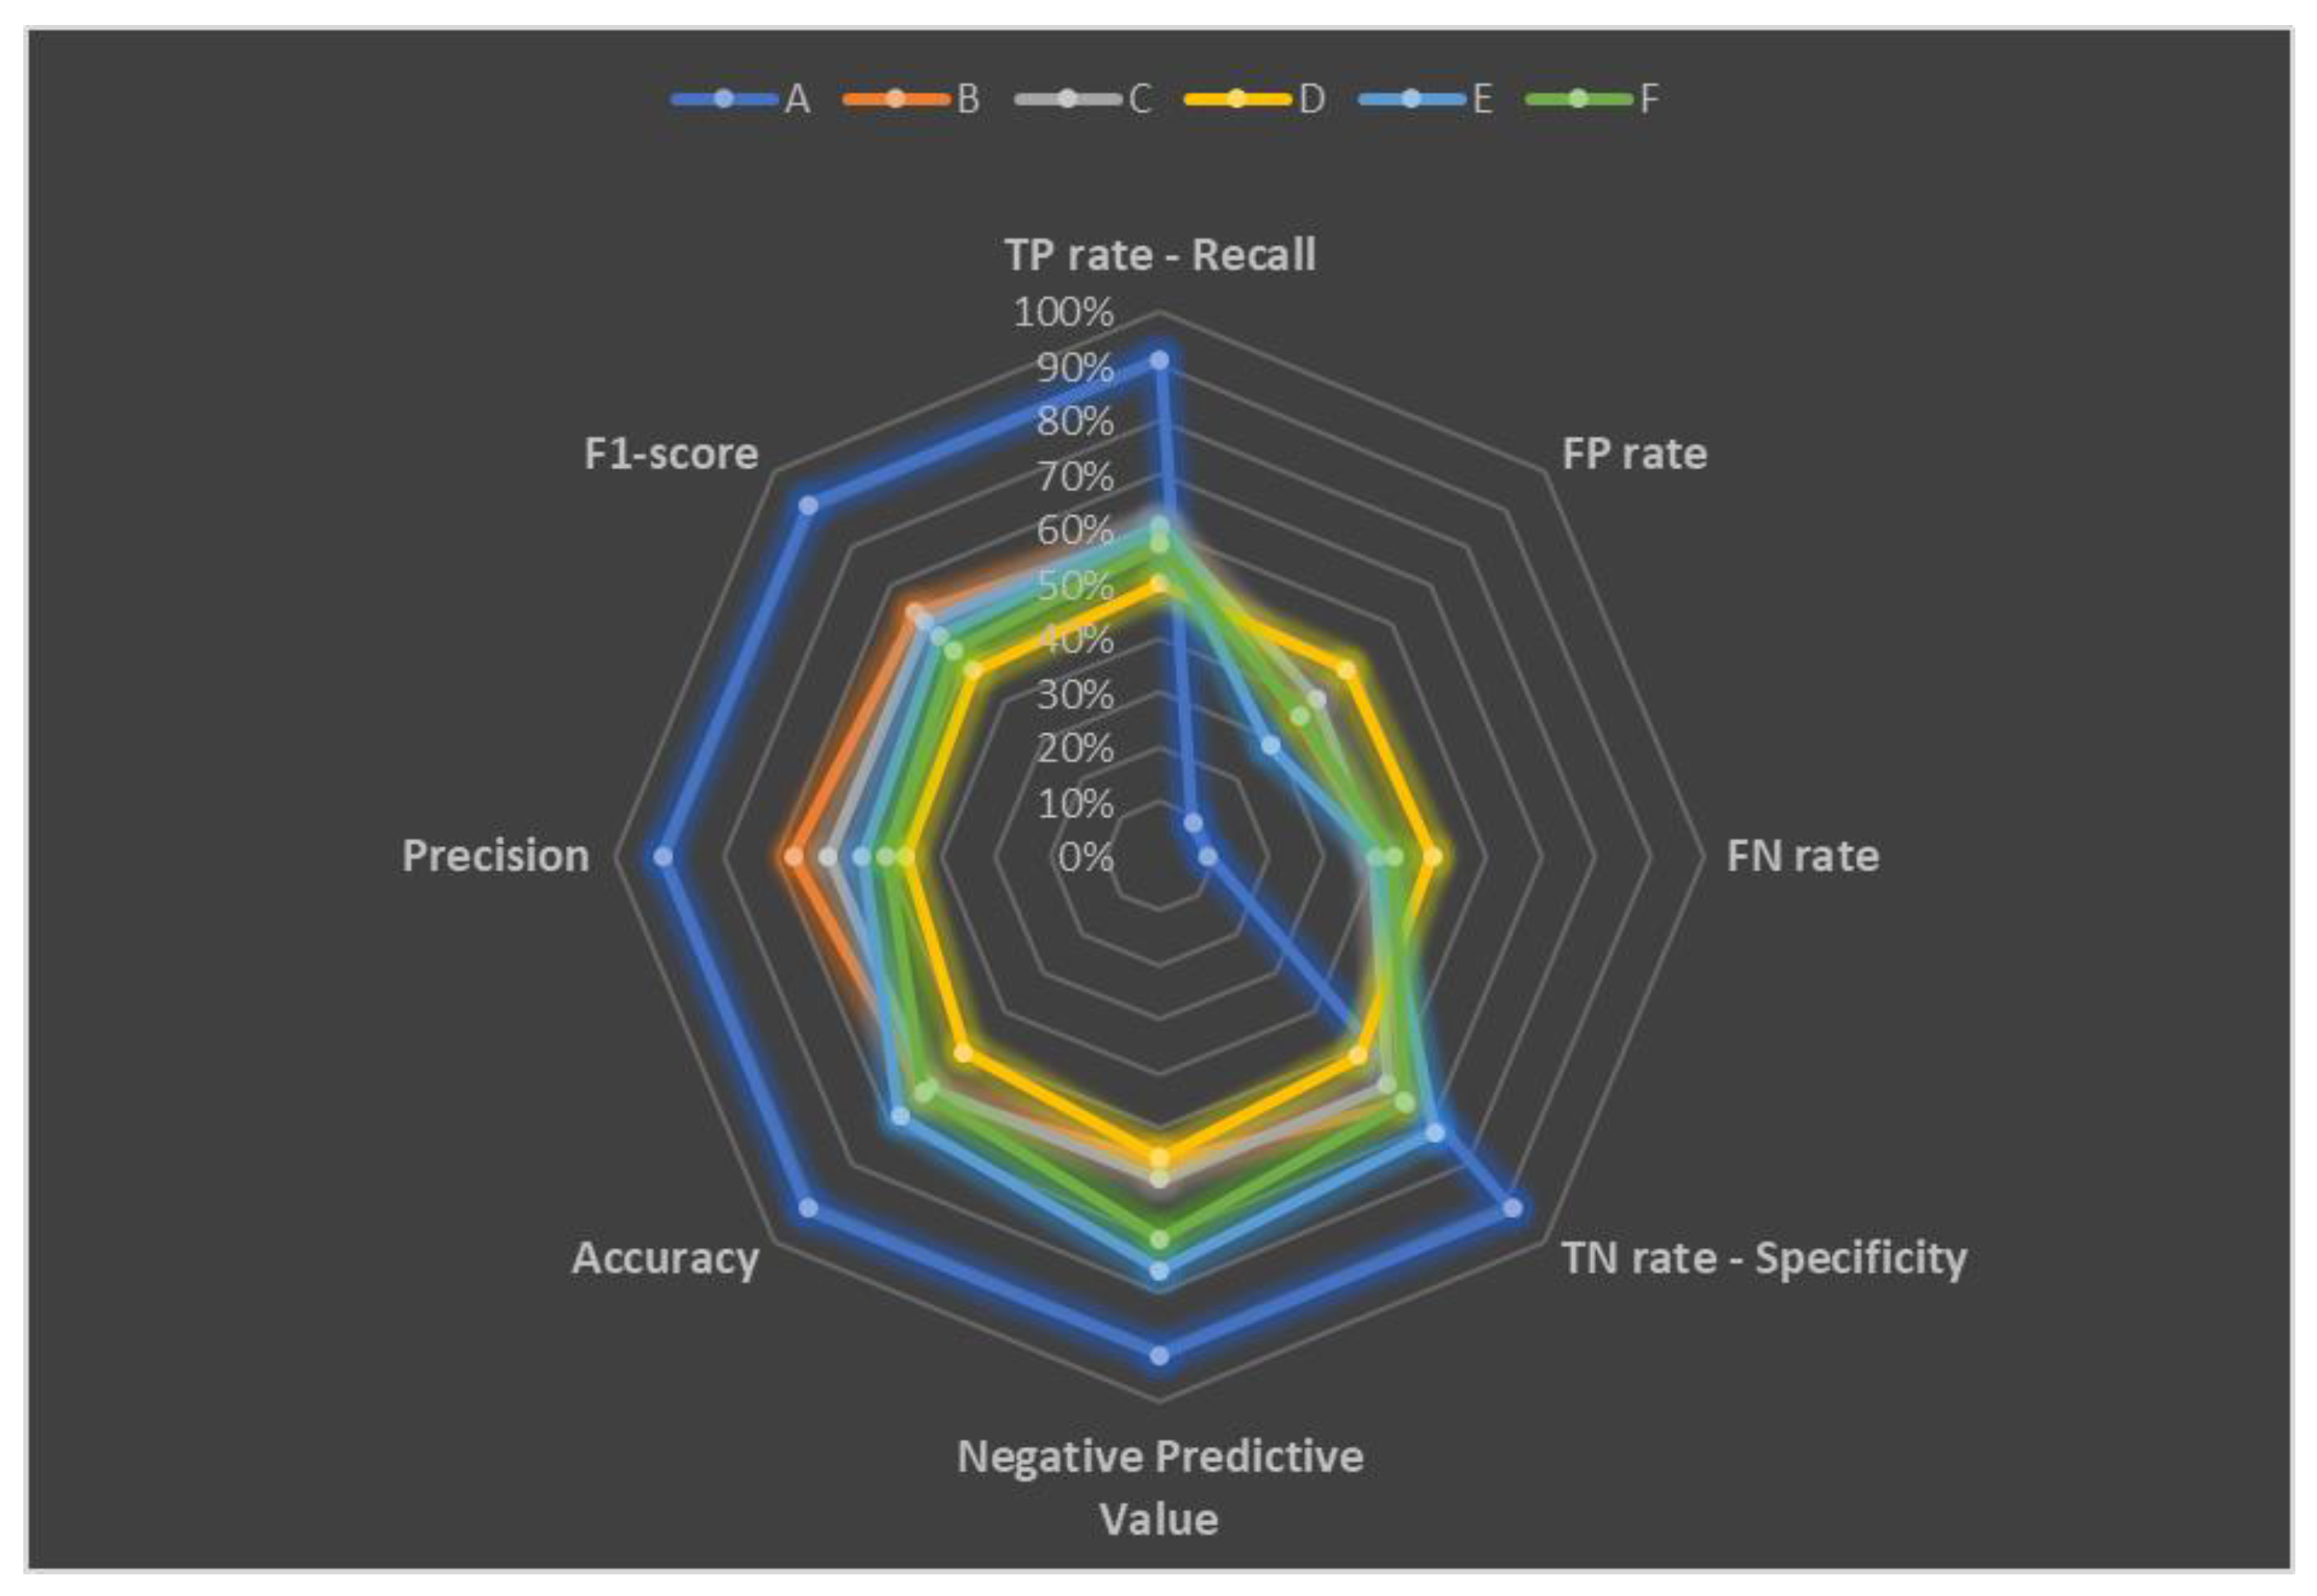
| Type of Validation | TP Rate—Recall | FP Rate | FN Rate | TN Rate—Specificity | Negative Predictive Value | Accuracy | Precision | F-Score |
| A | 91% | 9% | 9% | 91% | 91% | 91% | 91% | 91% |
| B | 60% | 36% | 40% | 64% | 56% | 62% | 67% | 63% |
| C | 61% | 41% | 39% | 59% | 59% | 60% | 61% | 61% |
| D | 50% | 48% | 50% | 52% | 5% | 51% | 46% | 48% |
| E | 60% | 29% | 40% | 71% | 76% | 67% | 55% | 57% |
| F | 57% | 36% | 43% | 64% | 70% | 61% | 50% | 53% |
| Wavelength (nm) | Relative Importance of Variables (%) |
|---|---|
| 1007 | 100 |
| 1025 | 32 |
| 1031 | 29.1 |
| 1001 | 28.8 |
| 1062 | 18.6 |
| 1013 | 14.5 |
| 1657 | 14.4 |
| 1670 | 14.4 |
| 1465 | 7.5 |
| 1459 | 7.2 |
| 1663 | 6.2 |
Disclaimer/Publisher’s Note: The statements, opinions and data contained in all publications are solely those of the individual author(s) and contributor(s) and not of MDPI and/or the editor(s). MDPI and/or the editor(s) disclaim responsibility for any injury to people or property resulting from any ideas, methods, instructions or products referred to in the content. |
© 2024 by the authors. Licensee MDPI, Basel, Switzerland. This article is an open access article distributed under the terms and conditions of the Creative Commons Attribution (CC BY) license (https://creativecommons.org/licenses/by/4.0/).
Share and Cite
Schambri, P.; Kleiber, D.; Levasseur-Garcia, C. Classification of Popcorn (Zea mays var. everta) Using Near-Infrared Spectroscopy to Assess Zearalenon Risk Mitigation Strategies. Agronomy 2024, 14, 277. https://doi.org/10.3390/agronomy14020277
Schambri P, Kleiber D, Levasseur-Garcia C. Classification of Popcorn (Zea mays var. everta) Using Near-Infrared Spectroscopy to Assess Zearalenon Risk Mitigation Strategies. Agronomy. 2024; 14(2):277. https://doi.org/10.3390/agronomy14020277
Chicago/Turabian StyleSchambri, Pierre, Didier Kleiber, and Cecile Levasseur-Garcia. 2024. "Classification of Popcorn (Zea mays var. everta) Using Near-Infrared Spectroscopy to Assess Zearalenon Risk Mitigation Strategies" Agronomy 14, no. 2: 277. https://doi.org/10.3390/agronomy14020277
APA StyleSchambri, P., Kleiber, D., & Levasseur-Garcia, C. (2024). Classification of Popcorn (Zea mays var. everta) Using Near-Infrared Spectroscopy to Assess Zearalenon Risk Mitigation Strategies. Agronomy, 14(2), 277. https://doi.org/10.3390/agronomy14020277