Article

The Identification of Significant Single Nucleotide Polymorphisms for Shoot Sulfur Accumulation and Sulfur Concentration Using a Genome-Wide Association Analysis in Wild Soybean Seedlings

1
Key Laboratory of Biology and Genetics Improvement of Soybean, Ministry of Agriculture, Nanjing Agricultural University, Nanjing 210095, China
2
National Innovation Platform for Soybean Breeding and Industry-Education Integration, Nanjing Agricultural University, Nanjing 210095, China
3
State Key Laboratory of Crop Genetics & Germplasm Enhancement and Utilization, Nanjing Agricultural University, Nanjing 210095, China
4
Zhongshan Biological Breeding Laboratory (ZSBBL), Nanjing 210095, China
*
Authors to whom correspondence should be addressed.
Agronomy 2024, 14(2), 292; https://doi.org/10.3390/agronomy14020292
Submission received: 20 December 2023 / Revised: 14 January 2024 / Accepted: 26 January 2024 / Published: 29 January 2024
(This article belongs to the Special Issue Genetics and Breeding of Field Crops in the 21st Century)

Abstract

:
To understand the genetic basis of soybean sulfur utilization, a genome-wide association study (GWAS) and transcriptome analysis were used to discover new sulfur utilization genes in 121 wild soybeans. The shoot sulfur accumulation (SA) and shoot sulfur concentration (SC) of 121 wild soybean seedlings growing in a Hoagland nutrient solution for 14 days were evaluated in a greenhouse. The maximum coefficients of variation of SA and SC were 66.79% and 49.74%, respectively. An analysis of variance revealed that SA and SC had significant differences among materials. Compared with SC, SA had higher heritability (68%) and was significantly positively correlated with multiple agronomic traits. According to the GWAS, 33 and 18 single nucleotide polymorphisms (SNPs) were significantly associated with SA and SC, respectively. Six quantitative trait loci containing ten SNPs associated with SA were mapped in two or three environments on chromosome 9, 12, 13, 14, 15, and 19. Twenty-seven candidate genes were identified in the six stable loci by searching the low-sulfur-induction soybean transcriptome. A genetic diversity analysis of the ribosomal gene GsRPL35, a candidate gene on chromosome 15, revealed 10 haplotypes (Hap1-10) based on 7 SNPs in 99 wild soybeans. Wild soybeans carrying Hap2 had a higher SA than those carrying Hap6. In general, the results provide novel sulfur accumulation loci and candidate genes for sulfur utilization improvements in soybean in the future.

1. Introduction

Soybean is a globally important food crop providing plant protein and oil for humans and other animals; soybean is also used as a raw material for many high-quality food products. Sulfur (S) is the fourth most necessary microelement after nitrogen (N), phosphorus (P), and potassium (K) for soybean. A lack of sulfur reduces the dry weight of the whole plant, the leaf area, and the chlorophyll content of functional leaves; the efficiency of nitrogen conversion into protein; grain yield; protein content; and the sulfur-containing amino acid content in soybean [1,2,3,4,5]. Soybean, similar to other plants, mainly obtains S from the soil via its roots [6]. However, in China, about one-fifth to one-quarter of farmlands showed sulfur deficiency or potential deficiency [7]. Along with the wide adaptation of high-yield varieties, a high multiple crop index, and the control of sulfur-containing exhaust, the amount of sulfur in the soil is continuously decreasing. Until 2018, in an investigation concerning 345,000 soil samples from the Anhui Province, 13.76%, 20.91%, and 18.43% of the samples showed extreme deficiency, deficiency, and potential deficiency in the available sulfur content, respectively [8]. Therefore, soybean, like other crops, has to deal with sulfur deficiency. Improving sulfur utilization efficiency is an effective approach to overcoming sulfur deficiency for soybean.
Plants take up sulfate from the soil into root cells using sulfate transporters. In cells, sulfate is reduced to organic sulfur in steps by various enzymes, including adenosine 5′-phosphosulfate (APS), ATP sulfurylase (ATPS), serine acetyltransferase (SATase/SERAT) and O-acetylserine sulfhydrylase (OASS/OAS-TL) [9]. In soybean, there are 28 sulfate transporter genes [10]. Of them, 16 are strongly induced by low sulfur [5]. The high affinity sulfate transporter gene GmSULTR1;2b overexpression in tobacco increased plant biomass, thousand-grain weight, cysteine content, and total soluble protein content in leaves and others [10]. Furthermore, six enzyme genes in sulfur metabolism have been reported in soybean. GmATPS and GmAPSR showed high expression and enzyme activity in the early stages of soybean seed development. The GmATPS transcript was reportedly abundant in roots. GmAPSR was found in the roots, leaves, flowers, seeds, and nodules, and it was induced by S and P starvations in the roots [11]. GmSERAT1;1 rescued the phenotype of Escherichia coli SATase gene mutants, and it showed low expression levels in developing seeds and low enzyme activity in both leaves and seeds in soybean [12]. GmOASS1 complemented the function of the E. coli cysteine (Cys) nutrition mutant [13]. The GmOASS gene conferred transgenic soybean high Cys-rich protein content but low plant height and yield [14]. Overall, genetic studies of sulfur absorption and metabolism in soybean are limited.
In addition, a number of QTLs related to S concentration or accumulation in seeds and shoots have been identified in soybean. Using different soybean populations, Ramamurthy et al. and Malle et al. mapped two and three QTLs related to the soybean seed S concentration on different chromosomes [15,16]. Ziegler et al. identified 23 SNPs across 12 chromosomes associated with soybean seed S accumulation in a single environment using 1653 soybeans in three locations from 1999 to 2009 [17]. Dhanapal et al. discovered 16 QTLs on 12 chromosomes associated with the soybean shoot S concentration using 31,748 SNPs and 104 soybean genotypes [18]. Of the 16 QTLs, four were also associated with other nutrients [18]. In general, most of these QTLs were not located in multiple environments or mapping populations, which indicates that the genetic structure governing soybean S concentration and accumulation is very complex. Therefore, more work is required to understand the genetic basis of soybean sulfur utilization.
Annual wild soybean as a close relative species of the cultivated soybean, has abundant genetic diversity and is an excellent material for the identification of genes related to nutrient utilization [19,20]. However, few studies about sulfur utilization were reported in wild soybean. Therefore, there are three objectives of this study: one is to discover the sulfur utilization genes of wild soybean; the second is to identify new candidate loci/genes for soybean sulfur utilization; and the third is to expand the genetic basis of soybean sulfur utilization. In this study, 121 wild soybeans were used as materials to evaluate shoot sulfur accumulation (SA) and shoot sulfur concentration (SC) in the hydroponic system in a greenhouse. The genotype of each wild soybean was analyzed using the NJAU 355K SoySNP array. Three genome-wide association study (GWAS) methods were used to identify markers that are significantly associated with SA and SC based on 239,599 SNPs. Then, soybean low-sulfur-induced transcriptome data and tissue expression profile data were combined to identify the candidate genes within loci. The genetic diversity and haplotypes of one candidate gene on chromosome 15 were analyzed in this wild soybean population, and its optimal haplotype was identified. This study provides new target loci, genes, and materials for soybean sulfur utilization breeding, which is of great significance for understanding the genetic basis of soybean sulfur utilization and improving soybean sulfur utilization.

2. Materials and Methods

2.1. Materials Planting

The materials were 121 annual wild soybeans (Glycine soja Sieb.et Zucc.) from four ecological regions [21]. For each material, 20 seeds with similar size, smooth surface, and no disease spot were selected and sown in a plastic pot with vermiculite. After 4 days, the seedlings with the first pair of fully expanded leaves were transferred to a hydroponic box with a 1/2 Hoagland nutrient solution in the greenhouse with a 16 h/8 h (light/dark) photoperiod and a temperature of 28 °C. The formula of the Hoagland nutrient solution was the same as that used by Wang et al. [22]. The experiment assumed a completely random design with four replications and was conducted three times in July 2017 (environment 1, E1), March 2018 (E2), and July 2018 (E3), respectively.

2.2. Traits Measurement

After two weeks, the seedlings were sampled to measure plant height (PH, cm), root length (RL, cm), fresh weight of the shoot (FWS, g), and fresh weight of the root (FWR, g). The shoot and root of a seedling were divided from the cotyledonary node. Plant height is the distance from the cotyledon node to the stem apex, and the root length is the distance from the cotyledon node to the root tip. Then, the fresh shoot and root were separately put into two different brown paper bags and dried at 105 °C for 30 min and then at 75 °C to achieve constant weight in the oven. The dry weight of the shoot (DWS, g) and root (DWR, g) was measured. The measurement method for agronomic traits is that of Qiu and Chang [23].
The method for measuring the sulfur content is based on Ziegler et al., with slight changes as follows [24]: After grinding, about 0.1 g of the powdered dry shoot was transferred into a tube, and 5 mL HNO3 was added to the tube. Then, the tube was put into the microwave digestion system (Milestone Ethos UP, Italy) at 150 °C for 30 min. After cooling to below 50 °C, ddH2O was added into the tube to fix the volume to 50 mL. The sulfur concentration (SC, mg/g) of the shoot was determined by using an Inductively Coupled Plasma Mass Spectrometer (ICP-MS, NextION 2000, PerkinElmer, MA, USA). With reference to Chea et al. [25], the total sulfur accumulation (SA, mg) of the shoot was calculated as follows: SA = DWS × SC.

2.3. Data Analysis

The mean value, maximum, minimum, standard deviation (SD), and frequency distributions of the data were calculated by using the AVERAGE, MAX, MIN, STDEV.S, and FREQUENCY statistic functions in Microsoft’s Excel 2016. The frequency distribution plot was also drawn by using Microsoft’s Excel 2016. The coefficient of variation (CV) of the data was calculated based on the mean value and SD. Pearson’s correlation analysis was performed by using PROC CORR in SAS 9.2.
The linear model for analysis of variance (ANOVA) is Yijk = Gi + Ej + GEij + eijk, where Yijk is the kth observation of the ith genotype in the J environment, Gi is the genotype effect, Ej is the environment effect, GEij is the genotype-by-environment interaction effect, and eijk is the residual error. Gi, Ej, and GEij are all considered random effects. Variance components (Vg, Vgy, and Ve) and the best linear unbiased prediction (BLUP) values of SA and SC under three environments as combining data of environments (CE) were obtained using PROC MIXED in SAS 9.2. The broad sense heritability was calculated as follows: H 2 = V g / ( V g + V g y / y + V e / y r ) . Vg is the genotypic variance, Vgy is the genotype-by-environment interaction variance, Ve is the error variance, y is the number of environments, and r is the number of replications.

2.4. Genome-Wide Association Study

Of the 121 wild soybeans, 105 were genotyped using the NJAU 355K SoySNP array (NJAU 355K SoyaSNP Array, https://www.soybase.org/projects/SoyBase.C2021.03.php, accessed on 30 August 2023) [21]. The SNPs with a minimum allele frequency of less than 0.05 were filtered out. The SA and SC of 105 wild soybeans in July 2017 (E1), March 2018 (E2), July 2018 (E3), and BLUP values (CE) were used for a genome-wide association study (GWAS). GWAS was performed using a multi-locus mixed linear model (MLMM) in the Genome Association and Prediction Integrated Tool (GAPIT) 3.0 package with −log10(p) ≥ 4.0 as the threshold for SNPs significantly associated with traits [26]. The mixed linear model (MLM) and Fixed and random model circulating probability unification (FarmCPU) in the R memory-efficient, visualization-enhanced, and parallel-accelerated Tool (rMVP) package version 1.0.8 were used to confirm the GWAS results using MLMM [27]. The Circle Manhattan Plot (CMplot) version 4.5.0 and UpSetR version 1.4.0 R packages were used to draw the Manhattan plot and significant association marker statistical map, respectively [27,28].

2.5. Candidate Gene Prediction and Genetic Diversity Analysis

Based on the linkage disequilibrium (LD) decay in the wild soybeans calculated by Wang et al. [21], all genes within 80 kilobase pairs (kb) upstream and downstream of significant single nucleotide polymorphisms (SNPs) were predicted according to Glycine soja genome v1.1 (PI 483463) (https://phytozome-next.jgi.doe.gov/, accessed on 20 September 2023). The homologous gene of each wild soybean gene in the cultivated soybean was obtained using basic local alignment search tools (BLAST) Glycine max genome Wm82. a4. v1 (Williams 82) (https://phytozome-next.jgi.doe.gov/, accessed on 20 September 2023). Using the homologous gene names in the cultivated soybean, the genes that responded to low sulfur were predicted by searching the low-sulfur transcriptome data [5], and the function and tissue expression pattern of the genes’ response to low sulfur were annotated by searching SoyBase (https://www.soybase.org/, accessed on 20 September 2023) [29]. The heatmaps of gene expression were draw by using online software Morpheus (https://software.broadinstitute.org/morpheus/, accessed on 20 September 2023). The genetic diversity and haplotype of GlysoPI483463.15G039600 were analyzed using the NJAU 355K SoySNP array [21]. The two-tailed t-test in Microsoft’s Excel 2016 was used to analyze the significance between the haplotypes.

3. Results

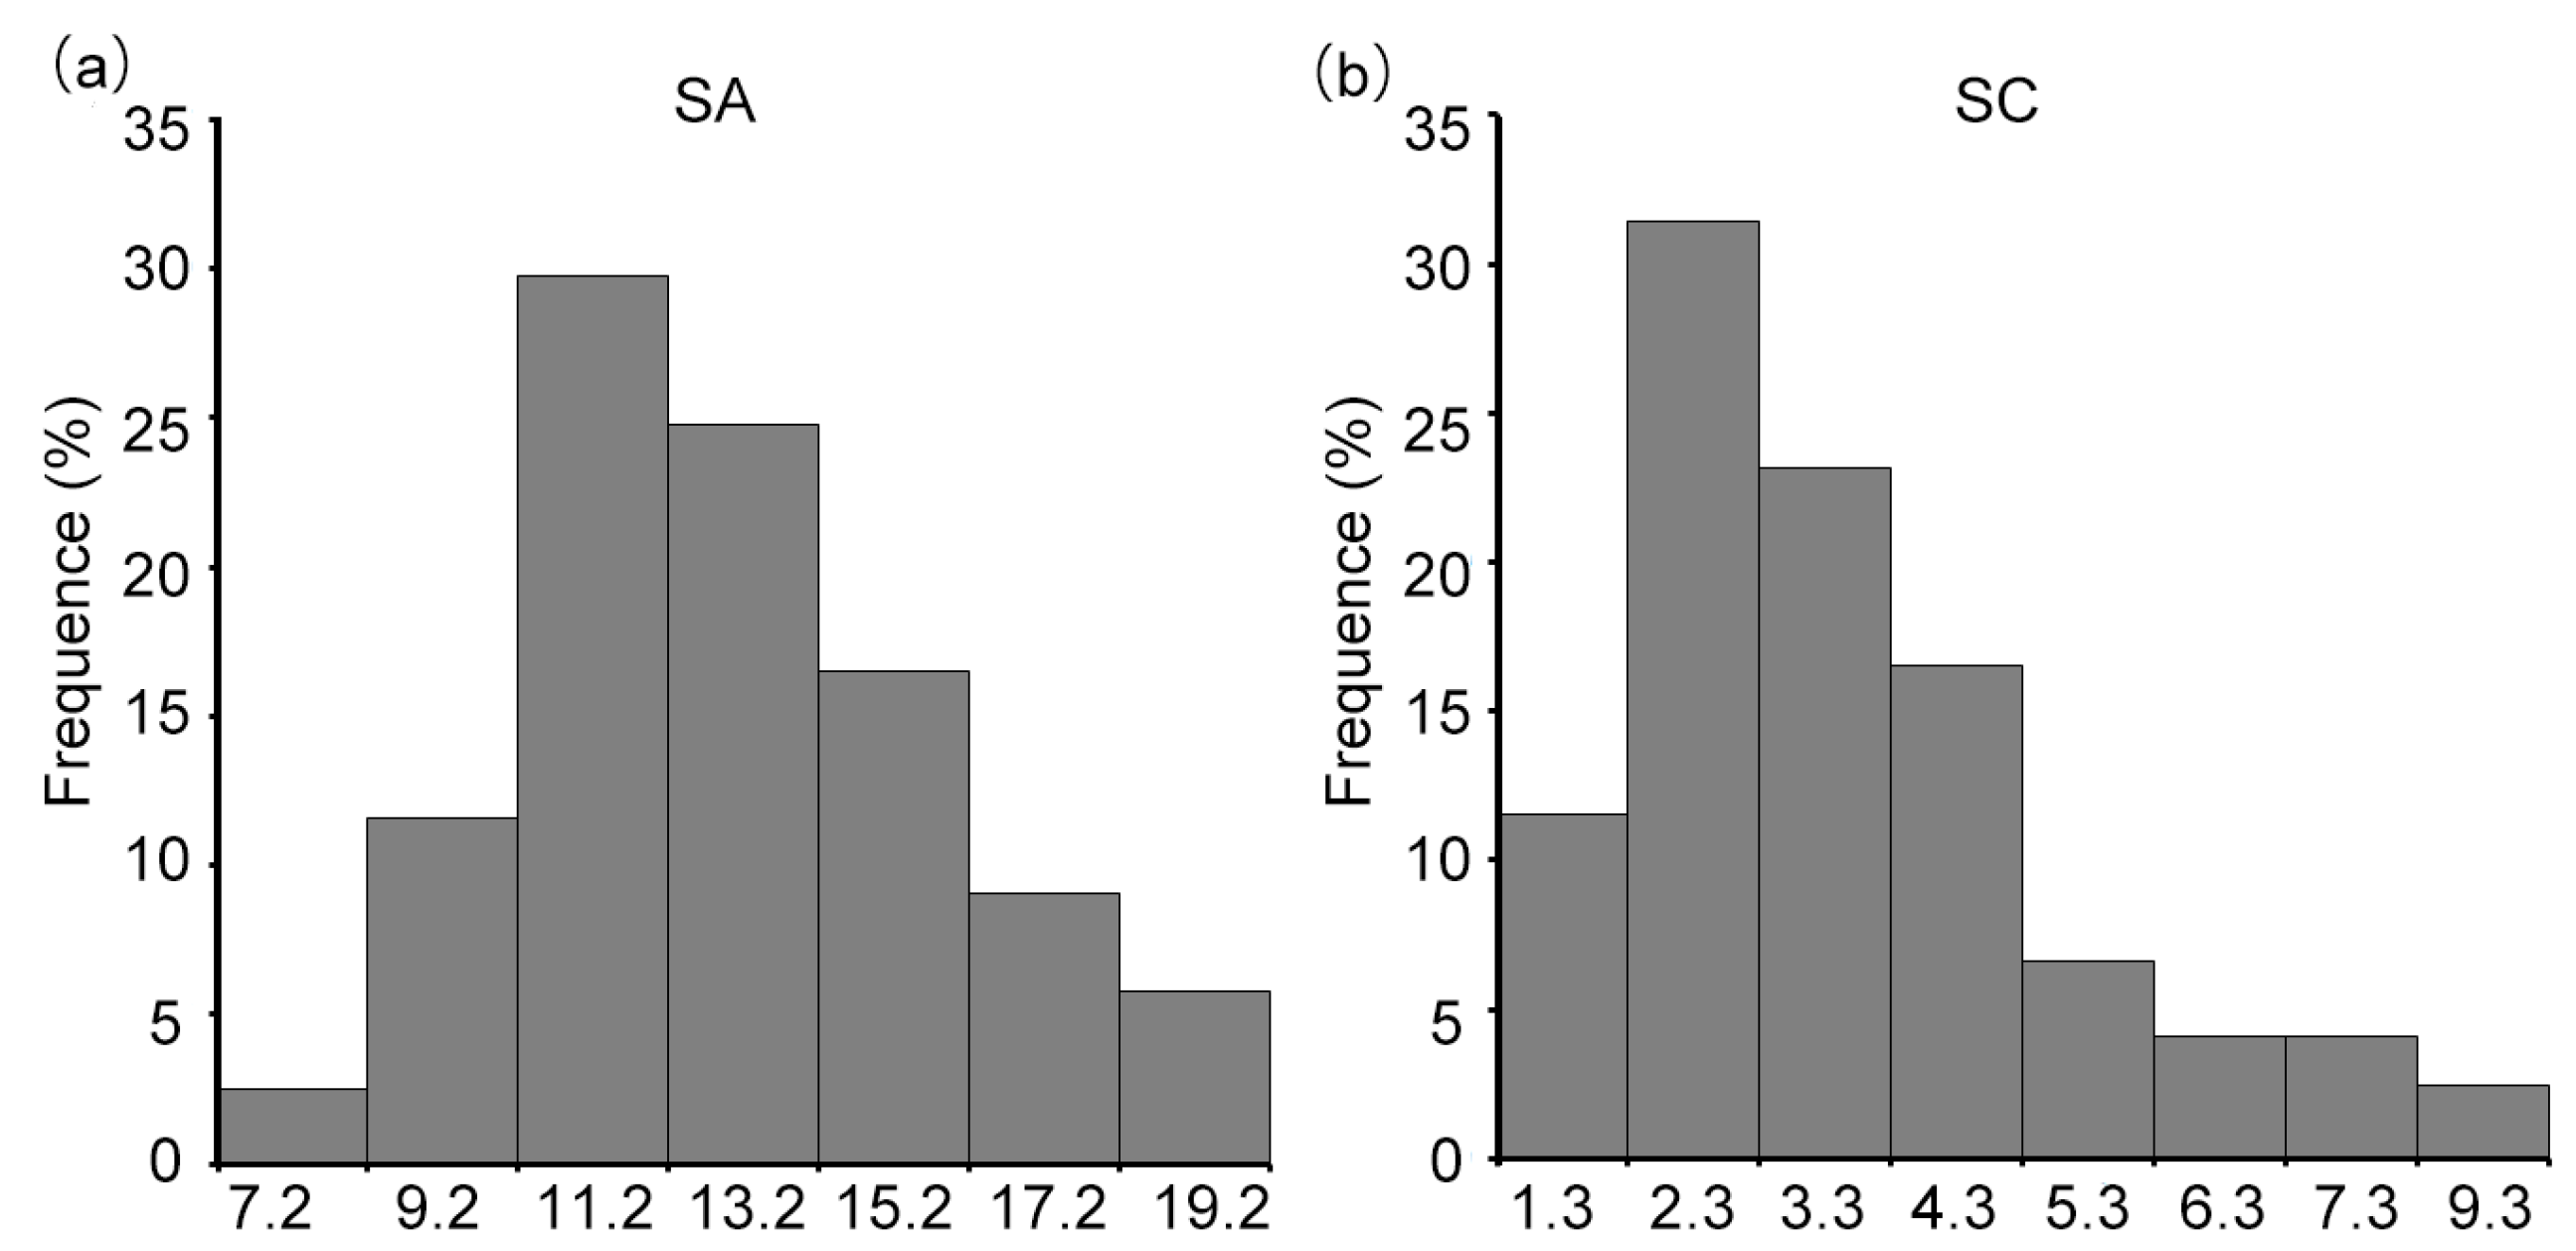
3.1. Shoot Sulfur Concentration and Sulfur Accumulation in Wild Soybean Seedling

The frequencies SC and SA were continuous, which indicated that the two traits were quantitative traits (Figure 1). SA varied from 0.4 mg in E2 to 14.7 mg in E3, and the mean value of SA ranged from 2.1 ± 1.3 mg in E2 to 4.3 ± 2.9 mg in E3. SC varied from 4.4 mg/g in E2 to 40.7 mg/g in E3, and the mean value of SC ranged from 10.8 ± 3.3 mg/g in E2 to 15.2 ± 7.6 mg/g in E3. The coefficient of variation of SA was larger than that of SC. The coefficient variation of SA exceeded 50% in all three environments (Table 1). The results of the ANOVA showed that SA and SC differed significantly among materials (Table 1). The heritability of SA was high, up to 68%.

3.2. SA Was Significantly Associated with Multiple Traits

Correlation coefficients between SA and other traits were analyzed using the mean of the traits across three environments. All traits were significantly and positively correlated with SA (Table 2). No agronomic traits had a significant correlation with SC (Table 2). This indicates that the absorption and accumulation of sulfur promoted wild soybean seedling growth and biomass accumulation; therefore, the higher the sulfur concentration, the more total sulfur was accumulated in the shoot.

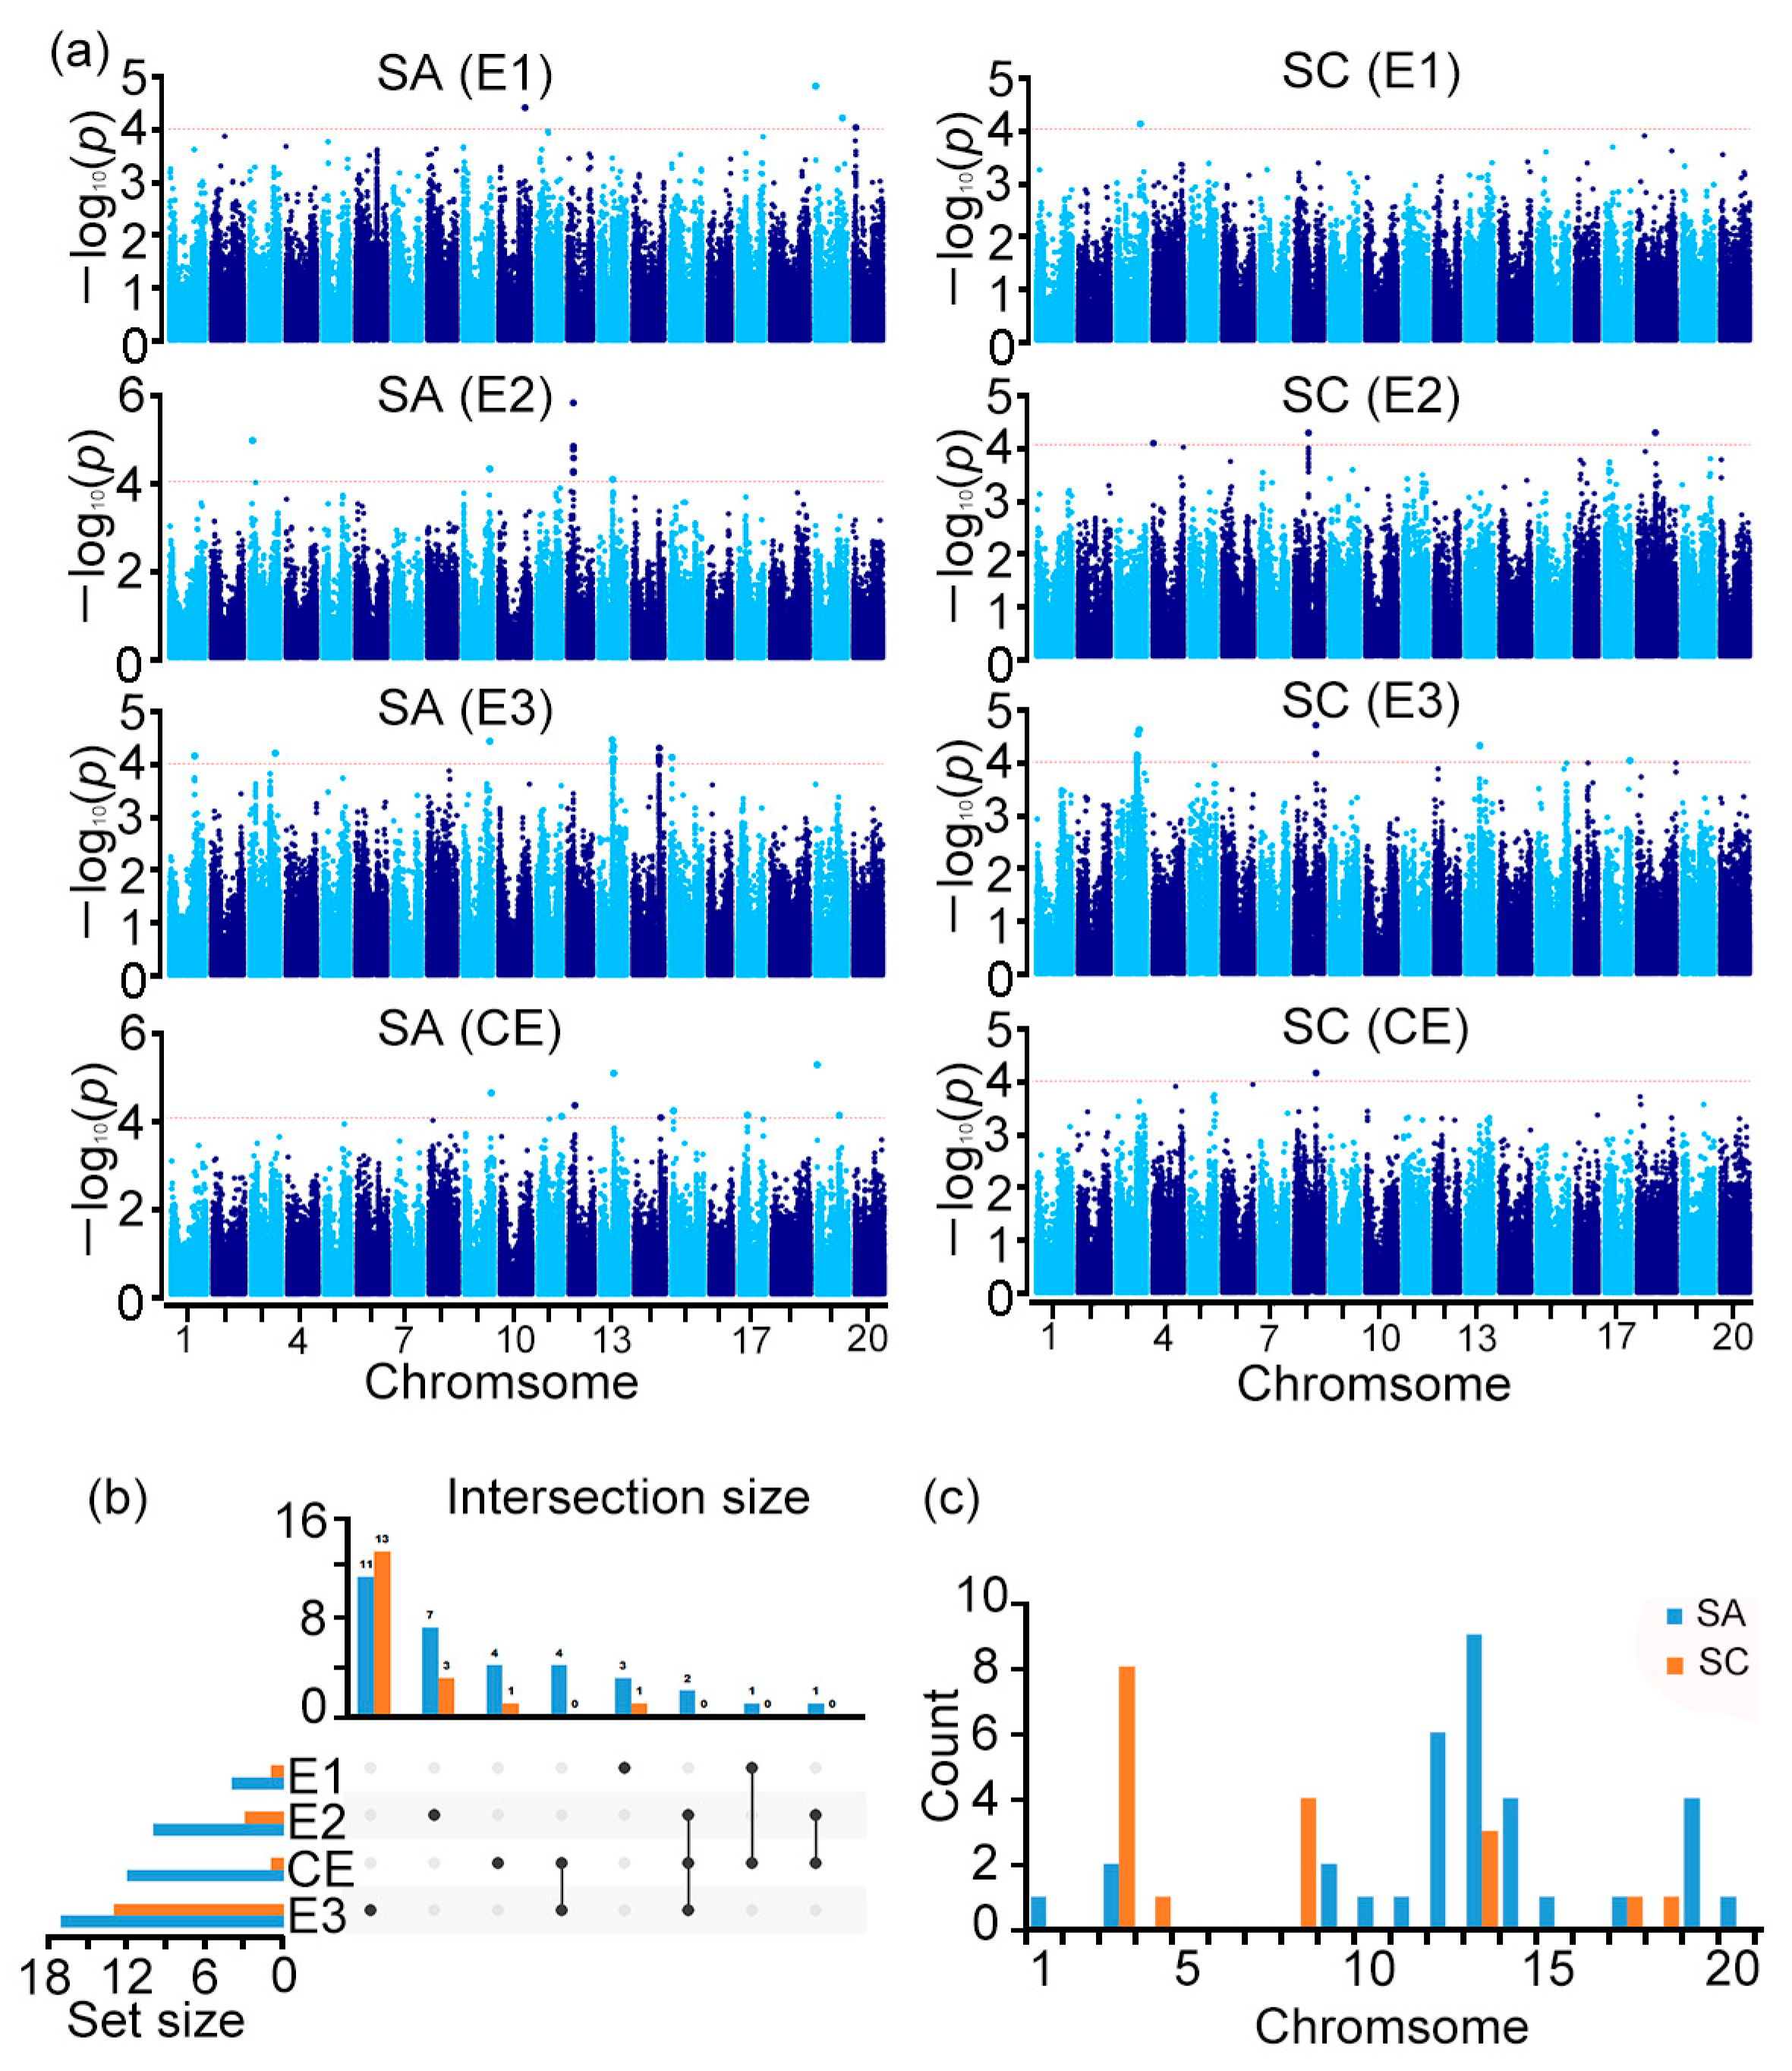
3.3. Six Stable Loci Were Identified by GWAS

After filtering SNPs with minimum alleles less than 5%, a total of 239,599 SNPs were left. The SNP number of chromosomes ranged from 9907 in chromosome 11 to 16,763 in chromosome 18. Chromosomes 1 with 212.60 SNPs/Mb and 13 with 292.26 SNPs/Mb had the lowest and highest SNP densities, respectively. For each chromosome, the SNP density in both sides was higher than that in the middle (Supplementary Table S1).
From the genome-wide association analysis, 33 and 18 SNPs were significantly associated with SC and SA, respectively (Figure 2a and Supplementary Table S2). Of the significant SNPs, 40 had significant association with traits by MLM and/or FarmCPU GWAS methods (Supplementary Tables S2–S4). Most of the SNPs were identified in the E3 environment (Figure 2b). The SNPs associated with SA were distributed on chromosomes 1, 3, 9, 10, 12, 13, 14, 15, 17, 19, and 20 (Figure 2c). Furthermore, 4, 10, 17, and 12 SNPs were found in E1, E2, E3, and CE, respectively (Figure 2b). Based on the extent of LD, six stable QTLs consisting of ten SNPs associated with SA on chromosome 9, 12, 13, 14, 15, and 19 were detected in two or more environments by multiple GWAS methods (Figure 2a and Table 3). Within the 80 kb interval upstream and downstream of representative SNPs, there were two significant SNPs (AX-93772096 and AX-94068640) on chromosome 9, three SNPs (AX-93799340, AX-94096012, and AX-93799353) on chromosome 12 and two SNPs (AX-914108622 and AX-93811849) on chromosome 13 (Table 4 and Supplementary Table S2).
Eighteen SNPs on chromosomes 3, 4, 8, 13, 17, and 18 were significantly associated with SC (Figure 2b,c). No SNPs were found in two or more environments (Figure 2b).

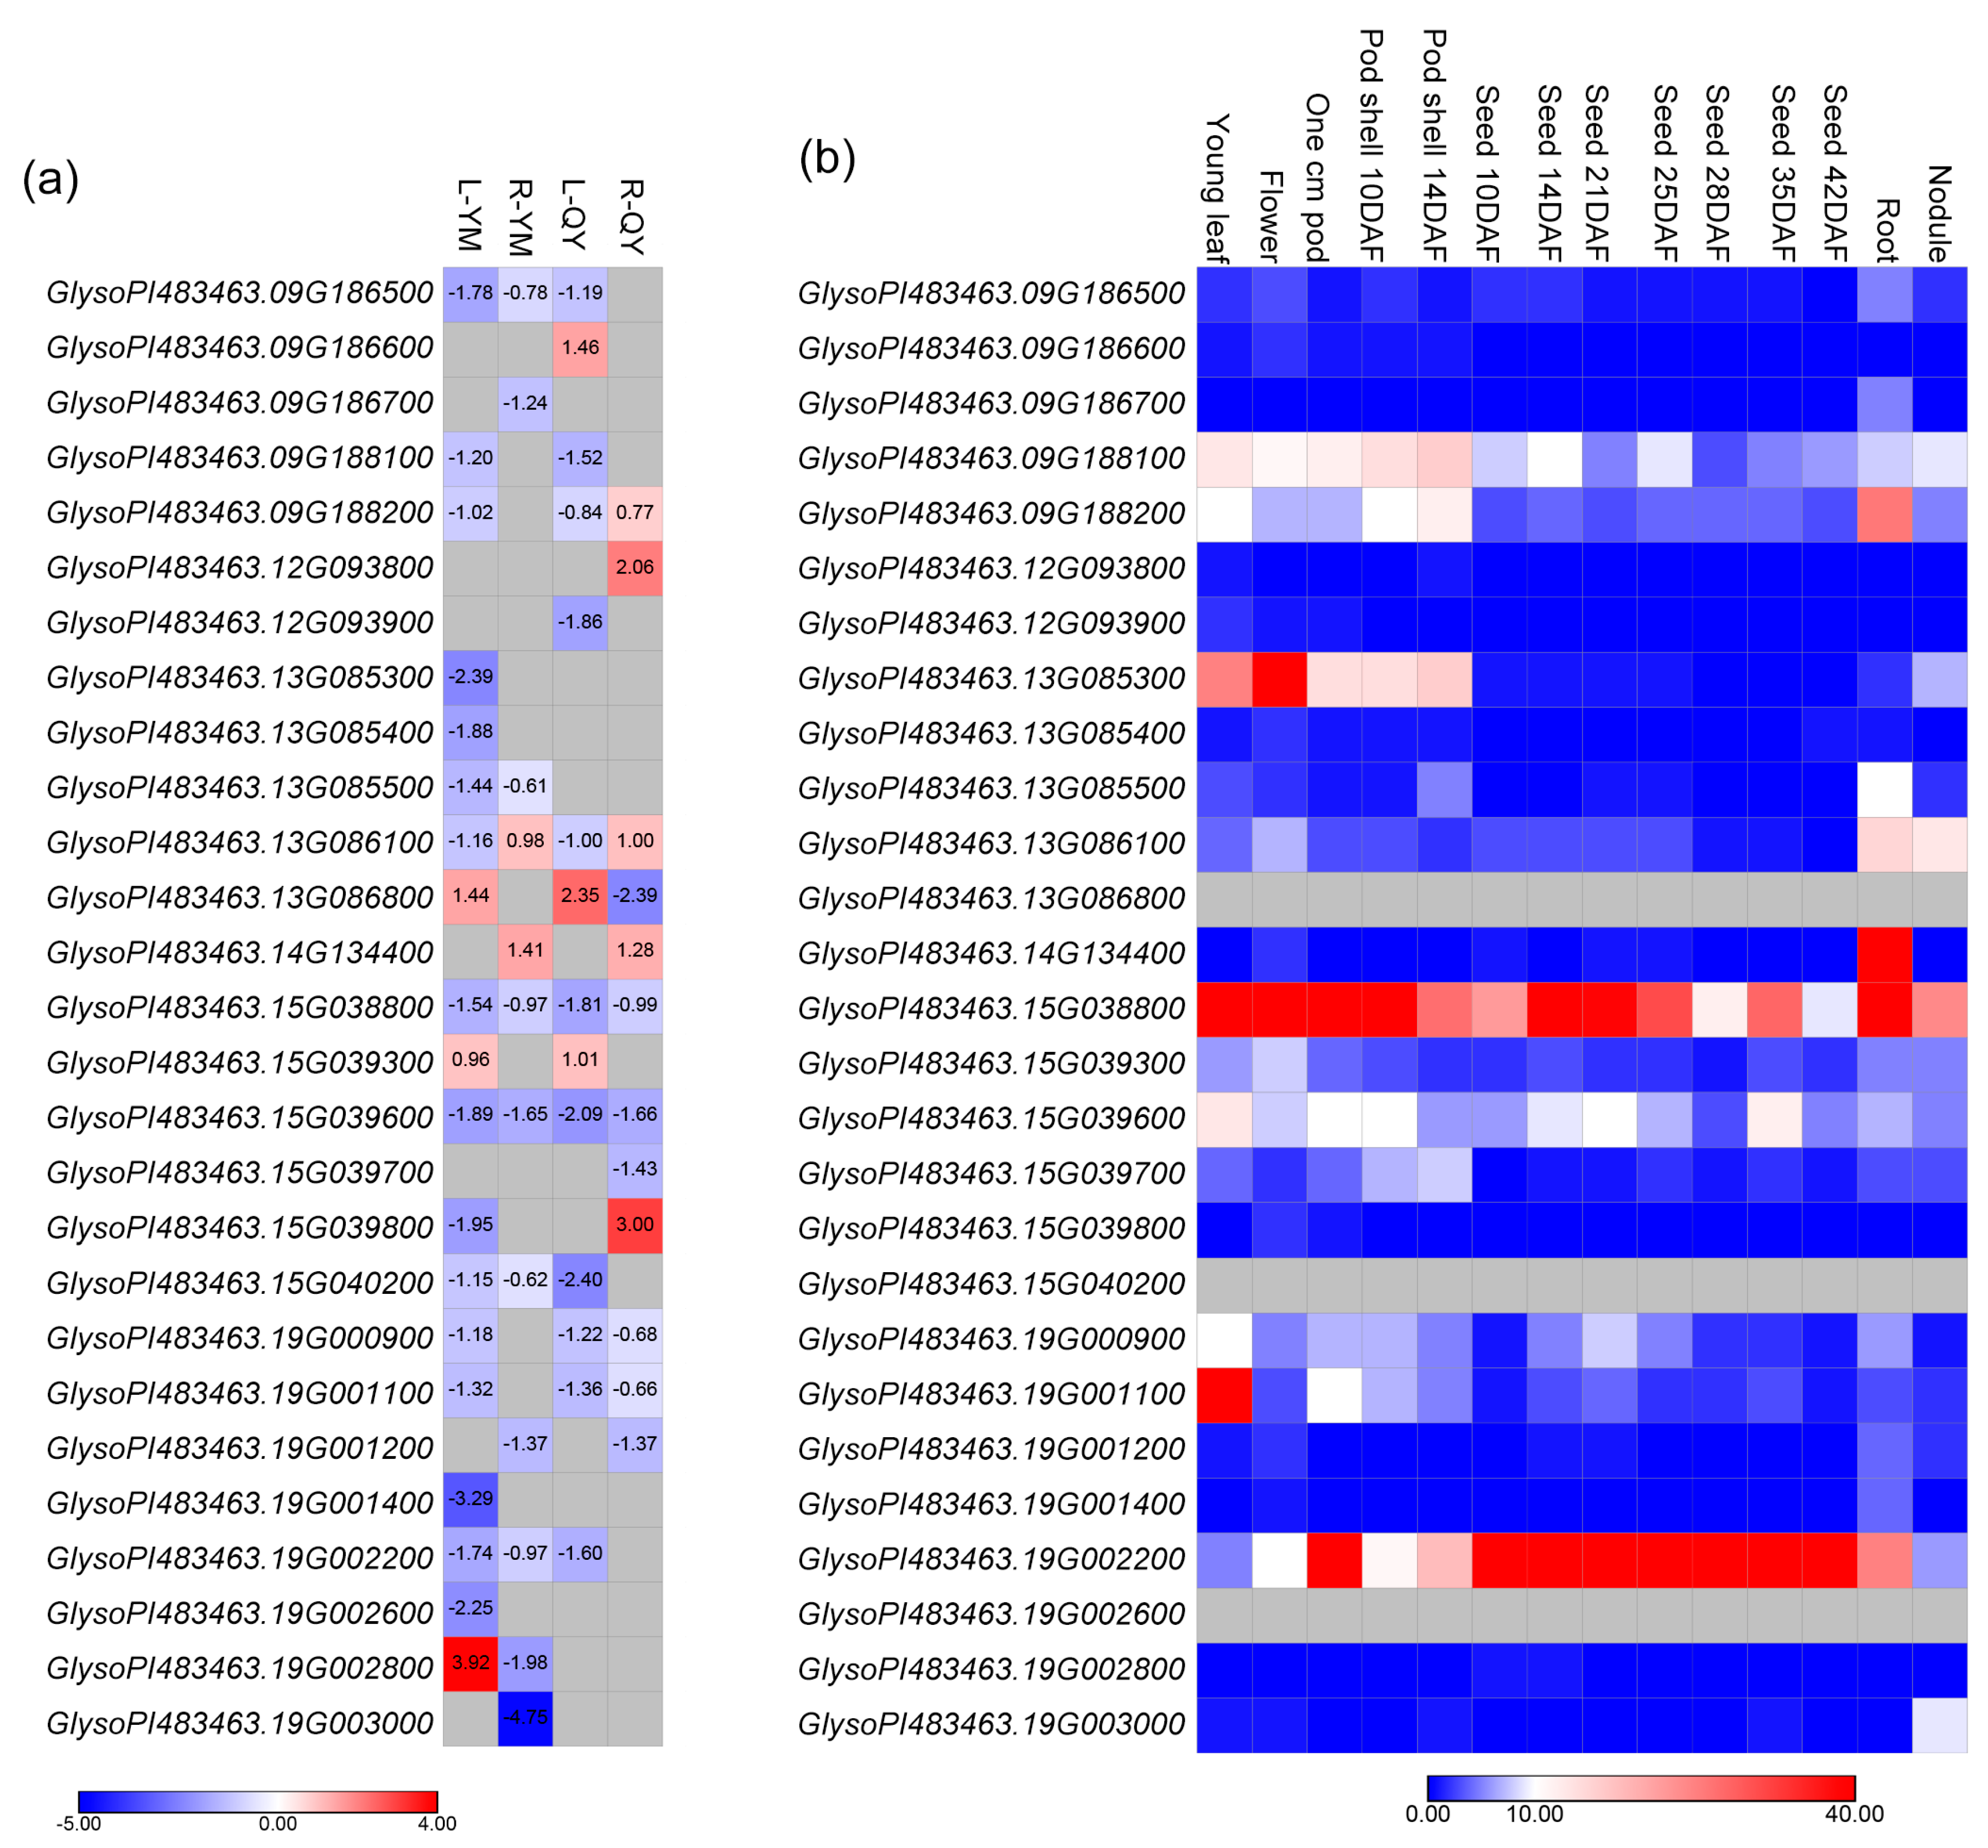
3.4. Candidate Genes

A total of ninety-six genes were predicted within the genomic regions of the six stable QTLs. qSA9, qSA13, qSA15, and qSA19 included 21, 19, 19, and 26 genes, respectively, which were more than those in qSA12 (6 genes) and qSA14 (5 genes) (Supplementary Table S5). The representative SNPs of the four QTLs were in gene coding sequences (Supplementary Table S2). Among the 96 genes, 27 genes might respond to low-sulfur treatment (Figure 3a and Supplementary Table S6). Functional annotation demonstrates that most of the 27 genes respond to stress response and participate in growth and development, and a few genes respond to nutritional stresses, such as GlysoPI483463.13G086800, which is related to Fe homeostasis, GlysoPI483463.19G002800, which regulates nitrogen deficiency-induced leaf senescence and shoot phosphorus status (Table 4 and Supplementary Table S7). In addition, 11 of the 27 genes had high expression levels in soybean shoots and/or roots (Figure 3b and Supplementary Table S8).
Of the 27 genes, the GlysoPI483463.15G039600 (GsRPL35) gene which encoded a large subunit ribosomal protein L35e contained the representative SNP (AX-93664677) of qSA15 (Table 3 and Supplementary Table S5). In addition to AX-93664677, the six other SNPs in the NJAU 355K SoySNP array data were also located in the intron sequence of the gene (Figure 4a). Based on the 7 SNPs, 10 haplotypes of the gene were found in 99 wild soybeans (Figure 4b and Supplementary Table S9). Hap2 (N = 19) and Hap6 (N = 10) were significant difference in SA in three environments and CE (Figure 4c and Supplementary Table S10). Hap2 with higher SA in wild soybean was an excellent haplotype (Figure 4c).

4. Discussion

4.1. Four New Loci Correlated with Shoot Sulfur Accumulation in Wild Soybean

In this study, six stable QTLs related to SA were identified in wild soybean. Based on the physical location of the significant SNP on the soybean reference genome, we compare the six loci with others reported in previous results by searching the literature and SoyBase (www.soybase.org, accessed on 20 September 2023). Dhanapal et al. reported 16 loci associated with shoot S concentration distribution on 12 chromosomes [18]. Of the 16 loci, two QTLs were near the location of qSA9 on chromosome 9 and qSA13 on chromosome 13, respectively, and none were in or near the interval of qSA12, qSA15, and qSA19 (Table 3). This indicated that the four loci for SA were newly identified in wild soybean. Six QTLs related to the soybean seed S concentration on chromosomes 10, 15, 16, 18, and 20 were reported previously [15,16,17]. None of them physically overlapped with the QTLs identified in our study. The genetic basis of the accumulation of S in the vegetative stage might be different from that in soybean seed.
Dhanapal et al. reported 22 SNPs associated with two or more elements. For example, they found two SNPs with the shoot P and S content and an SNP with the shoot K and S content [18]. Malle et al. also reported a QTL associated with the P and K content in the seed [16]. Thus, we further compared the location of our six QTLs with other soybean nutrient element utilization-related loci. The regions of our six QTLs overlap with that of those of several loci underlying P, K, and Fe utilization (Table 3). qSA13 and qSA15 colocalize with P utilization-related loci, qSA12 and qSA19 colocalize with Fe utilization-related loci, qSA9 colocalizes with P and K utilization-related loci, and qSA14 colocalizes with P and Fe utilization-related loci [18,30,31,32,33,34]. The colocalization of various nutrient utilization-related loci provided a genetic basis for improving plant nutrient utilization in a coordinated way.

4.2. Candidate Genes Associated with Shoot Sulfur Accumulation

In the previous study, soybean low-sulfur induction transcriptome data were obtained using RNA-seq [5]. According to the transcriptome data, 27 genes in the six stable loci responded to the low-sulfur induction in this study (Figure 3 and Supplementary Table S6). Among these genes, four genes were annotated as regulating root development (Table 4). GlysoPI483463.09G186700 encodes an AGL gene from the MADS-box family, which is known as the key transcription factor family regulating the translation of plant flowering and flower development. Recently, MADS-box family genes have also been found to play roles in root development and nutrient element metabolism. Notably, Arabidopsis AGL21 regulated lateral root development, responded to N starvation and S starvation, and remodeled root development under nutrient stresses in lateral root primordia [35]. In addition, rice OsMADS57 was directly involved in the long-distance transportation of nitrate from the root to the stem. The nitrate content was less than 31% in the xylem of the osmads57 mutant and increased 2-fold in the OsMADS57 overexpression lines compared with the control [36]. GlysoPI483463.15G039700 is an EXOCYST COMPLEX PROTEIN EXO70 gene, which is a vital component of the exocytosis complex and participates in biological processes ranging from plant cell division to polar growth. In rice, the EXO70 gene SR1 is critical to cell division and tracheary element development in roots [37]. Another EXO70 gene OsEXO70A1 mutation affects the assimilation of N, P, and K in a tissue specific manner [38]. GlysoPI483463.19G002800 is an NAC domain gene. The annotation highlighted that in addition to promoting lateral root increase, this gene may also respond to Pi deficiency and affect grain nutrient concentrations. Based on their homologues, we inferred that these genes might play a role in sulfur accumulation and could be candidate genes in wild soybean.
Among the 27 candidate genes, the functional annotation revealed that GlysoPI483463.13G086800 is involved in the regulation of Fe homeostasis and Cd-responsiveness (Table 4). The assimilation of Fe and S have been reported in plants. In barley, the sulfate uptake capacity was increased by iron deficiency [39]. The expression levels of genes involved in the sulfur absorption and assimilation processes were regulated by the level of iron supply. In particular, the expression of the high-affinity sulfate transporter TdSultr1.3 and the genes of the S assimilatory pathway (i.e., TdATPSul1, TdAPR, TdSir, TdSAT1, and TdSAT2) were significantly induced by Fe deficiency both in the shoots and roots of durum wheat plants [40]. Similarly, the expression of most of the tomato sulfate transporter genes SlST 1.1/1.2/2.1/4.1 was significantly upregulated in Fe-deficient roots [41]. In this study, the cultivated soybean homologue of GlysoPI483463.13G086800 responded to low sulfur treatment (Figure 3a and Supplementary Table S6). To sum up, the gene may be involved in sulfur accumulation in wild soybean.
Sulfur is an important and essential nutritional element for plant health, growth, and development. Many sulfur-containing compounds are involved in plant responses to stresses [42,43,44]. Many genes in sulfur signaling are involved in the regulation of multiple stress responses [45]. In return, biotic and abiotic stresses, such as drought, also affect the allocation of sulfate, sulfate assimilation, cysteine synthesis, and sulfate transport systems [46]. In this study, about half of the 27 candidate genes were related to plant biotic and abiotic stresses, including water deprivation, high salinity, freezing, drought, and so on (Table 4). These genes may also be involved in the regulation of shoot sulfur accumulation in wild soybean, which needs to be studied in the future.

4.3. Ribosomal Genes May Play a Key Role in Sulfur Accumulation in Wild Soybean

The number of plant ribosomal genes is large [47]. Except for those involved in cellular protein synthesis, some ribosomal genes are directly involved in the regulation of plant growth and development, flowering, response to stresses, absorption and metabolism of plant nutrients, etc. [48,49,50,51]. The deletion of the Arabidopsis ribosomal gene LEP2 (LOW PHOTOSYNTHETIC EFFICIENCY2) altered the expression of genes’ response to the balance of carbon and nitrogen [49]. One hundred and thirty-four Arabidopsis ribosomal protein genes were upregulated by low sulfur [52]. In soybean, 383 and 163 ribosomal genes responded to low-sulfur treatment in the leaves and roots of sulfur-tolerant soybean, respectively, and similar results were found in sulfur-sensitive soybean [5]. In our previous study, the soybean 50S ribosomal gene GmRPL12 responded to low-sulfate stress, promoted the absorption of sulfur elements in a low-sulfur environment, and increased the sulfur accumulation in soybean shoots and roots [53]. In this study, wild soybean carrying the elite haplotype of GsRPL35, ribosomal large subunit L35e gene, accumulated higher sulfur, and its cultivated soybean homologous responded to low-sulfur treatment (Figure 3a, Figure 4c and Supplementary Table S6). Apparently, ribosomal genes might play a key role in sulfur accumulation in soybean. These results suggest that ribosomal genes could be adopted in soybean sulfur utilization breeding in the future.

5. Conclusions

Using a genome-wide association analysis, 33 and 18 SNPs were significantly associated with shoot sulfur accumulation (SA) and sulfur concentration (SC), respectively, in 105 wild soybeans. Of these SNPs, ten associated with SA were identified in multiple environments and constituted six stable QTLs on chromosome 9, 12, 13, 14, 15, and 19. Twenty-seven candidate genes were uncovered in the six stable loci. For a candidate gene GsRPL35, ten haplotypes (Hap1-10) were identified in 99 wild soybeans by genetic diversity analysis. The elite haplotype Hap2 had higher SA. In the future, the function of the candidate genes will be further studied in soybean by genetic transformation. Overall, the results provide novel loci and genes for improving soybean sulfur utilization, which are of great significance for understanding the genetic basis of the trait.

Supplementary Materials

The following supporting information can be downloaded at: https://www.mdpi.com/article/10.3390/agronomy14020292/s1, Table S1: Distribution of SNPs in 20 chromosomes. Table S2: SNPs significantly associated with SA and SC by multiple GWAS methods. Table S3: SNPs significantly associated with SA and SC by FarmCPU model in rMVP. Table S4: SNPs significantly associated with SA and SC by MLM model in rMVP. Table S5: Ninety-six genes in the 6 stable QTLs were annotated using Glycine soja genome v1.1 (PI 483463) (https://phytozome-next.jgi.doe.gov/, accessed on 20 September 2023) annotation files. Table S6: Twenty-seven genes response to low sulfur. Table S7: Twenty-seven candidate genes were annotated by searching SoyBase (https://www.soybase.org/, accessed on 20 September 2023). Table S8: Tissue expression of 27 candidate genes predicted in SoyBase (https://www.soybase.org/, accessed on 20 September 2023). Table S9: Haplotypes of GsRPL35 (GlysoPI483463.15G039600). Table S10: Phenotypic values of GsRPL35 haplotypes.

Author Contributions

Conceptualization, H.W. and D.Y.; formal analysis, H.W., Y.Z. and Y.C.; investigation, H.W., Y.Z., K.R. and J.C.; writing—Original draft preparation, H.W.; writing—Review and editing, H.W., G.K. and D.Y.; visualization, H.W.; supervision, H.W. and D.Y.; project administration, H.W. and D.Y. All authors have read and agreed to the published version of the manuscript.

Funding

This research was supported by Jiangsu Agriculture Science and Technology Innovation Fund (CX (22) 3088 awarded to H.W.).

Institutional Review Board Statement

Not applicable.

Informed Consent Statement

Not applicable.

Data Availability Statement

The data presented in this study are available in the Supplementary Materials.

Conflicts of Interest

The authors declare no conflicts of interest.

References

  1. Li, Y. Characteristics of soybean requirement to sulphur and effects of sulphur on the physiology of soybean. Heilongjiang Agric. Sci. 1998, 5, 12–15. [Google Scholar]
  2. Li, J.; Zhang, Y.; Wang, J. Study on the effect of sulfur on the growth and physiology of soybean. Chin. J. Soil. Sci. 2004, 35, 612–616. [Google Scholar]
  3. Liu, L. Effect of Sulfur on Yields and Quality of Soybean (Glycine max (L.) Merrill). Ph.D. Thesis, Northeast Agricultural University, Harbin, China, 2005. [Google Scholar]
  4. Wu, M.; Xiao, C. Sulphur nutrition of soybean. Soybean Sci. 1998, 17, 299–304. [Google Scholar]
  5. Wang, H.; Wu, Z.; Zhang, Y.; Yu, D. Transcriptional expression profiling of soybean genes under sulfur-starved conditions by RNA-seq. Acta Agron. Sin. 2023, 49, 105–118. [Google Scholar]
  6. Kopriva, S.; Malagoli, M.; Takahashi, H. Sulfur nutrition: Impacts on plant development, metabolism, and stress responses. J. Exp. Bot. 2019, 70, 4069–4073. [Google Scholar] [CrossRef]
  7. Liu, C.Q.; Cao, S.Q.; Chen, G.A.; Wu, X.J. Sulphur in the agriculture of China. Acta Pedol. Sin. 1990, 27, 398–404. [Google Scholar]
  8. Qian, X.H.; Yang, P.; Zhou, X.J.; Hu, R.G.; Sun, H.L.; Zhang, Z.K.; Sun, X.J. Current situation and spatial-temporal distribution of soil available sulfur in Anhui province. J. Plant Nutr. Fert. 2018, 24, 1357–1364. [Google Scholar]
  9. Li, Q.; Gao, Y.; Yang, A. Sulfur homeostasis in plants. Int. J. Mol. Sci. 2020, 21, 8926. [Google Scholar] [CrossRef] [PubMed]
  10. Ding, Y.; Zhou, X.; Zuo, L.; Wang, H.; Yu, D. Identification and functional characterization of the sulfate transporter gene GmSULTR1;2b in soybean. BMC Genom. 2016, 17, 373. [Google Scholar] [CrossRef] [PubMed]
  11. Phartiyal, P.; Kim, W.S.; Cahoon, R.E.; Jez, J.M.; Krishnan, H.B. The role of 5′-adenylylsulfate reductase in the sulfur assimilation pathway of soybean: Molecular cloning, kinetic characterization, and gene expression. Phytochemistry 2008, 69, 356–364. [Google Scholar] [CrossRef]
  12. Chronis, D.; Krishnan, H.B. Sulfur assimilation in soybean (Glycine max [L.] Merr): Molecular cloning and characterization of a cytosolic isoform of serine acetyltransferase. Planta 2003, 218, 417–426. [Google Scholar] [CrossRef]
  13. Chronis, D.; Krishnan, H.B. Sulfur assimilation in soybean: Molecular cloning and characterization of O-acetylserine (thiol) lyase (Cysteine synthase). Crop Sci. 2003, 43, 1819–1827. [Google Scholar] [CrossRef]
  14. Krishnana, H.B.; Jez, J.M. Review: The promise and limits for enhancing sulfur-containing amino acid content of soybean seed. Plant Sci. 2018, 272, 14–21. [Google Scholar] [CrossRef]
  15. Ramamurthy, R.K.; Jedlicka, J.; Graef, G.L.; Waters, B.M. Identification of new QTLs for seed mineral, cysteine, and methionine concentrations in soybean [Glycine max (L.) Merr.]. Mol. Breed. 2014, 34, 431–445. [Google Scholar] [CrossRef]
  16. Malle, S.; Morrison, M.; Belzile, F. Identification of loci controlling mineral element concentration in soybean seeds. BMC Plant Biol. 2020, 20, 419. [Google Scholar] [CrossRef] [PubMed]
  17. Ziegler, G.; Nelson, R.; Granada, S.; Krishnan, H.B.; Gillman, J.D.; Baxter, I. Genomewide association study of ionomic traits on diverse soybean populations from germplasm collections. Plant Direct. 2018, 2, e00033. [Google Scholar] [CrossRef] [PubMed]
  18. Dhanapal, A.P.; Ray, J.D.; Smith, J.R.; Purcell, L.C.; Fritschi, F.B. Identification of novel genomic loci associated with soybean shoot tissue macro- and micronutrient concentrations. Plant Genome 2018, 11, 170066. [Google Scholar] [CrossRef] [PubMed]
  19. Li, Y.H.; Zhou, G.; Ma, J.; Jiang, W.; Jin, L.G.; Zhang, Z.; Guo, Y.; Zhang, J.; Sui, Y.; Zheng, L.; et al. De novo assembly of soybean wild relatives for pan-genome analysis of diversity and agronomic traits. Nat. Biotechnol. 2014, 32, 1045–1052. [Google Scholar] [CrossRef]
  20. Liu, Y.; Du, H.; Li, P.; Shen, Y.; Peng, H.; Liu, S.; Zhou, G.A.; Zhang, H.; Liu, Z.; Shi, M.; et al. Pan-genome of wild and cultivated soybeans. Cell 2020, 182, 162–176. [Google Scholar] [CrossRef]
  21. Wang, J.; Chu, S.S.; Zhang, H.R.; Zhu, Y.; Cheng, H.; Yu, D. Development and application of a novel genome-wide SNP array reveals domestication history in soybean. Sci. Rep. 2016, 6, 20728. [Google Scholar] [CrossRef]
  22. Wang, Q.; Wang, J.; Yang, Y.; Du, W.; Zhang, D.; Yu, D.; Cheng, H. A genome-wide expression profile analysis reveals active genes and pathways coping with phosphate starvation in soybean. BMC Genom. 2016, 17, 192. [Google Scholar] [CrossRef] [PubMed]
  23. Qiu, L.J.; Chang, R.Z. Descriptors and Data Standard for Soybean (Glycine spp.); China Agriculture Press Co., Ltd.: Beijing, China, 2006; pp. 54–63. [Google Scholar]
  24. Ziegler, G.; Terauchi, A.; Becker, A.; Armstrong, P.; Hudson, K.; Baxter, I. Ionomic screening of field-grown soybean identifies mutants with altered seed elemental composition. Plant Genome 2013, 6, 1–9. [Google Scholar] [CrossRef]
  25. Chea, L.; Meijide, A.; Meinen, C.; Pawelzik, E.; Naumann, M. Cultivar-dependent responses in plant growth, leaf physiology, phosphorus use efficiency, and tuber quality of potatoes under limited phosphorus availability conditions. Front. Plant Sci. 2021, 12, 723862. [Google Scholar] [CrossRef] [PubMed]
  26. Lipka, A.E.; Tian, F.; Wang, Q.; Peiffer, J.; Li, M.; Bradbury, P.J.; Gore, M.A.; Buckler, E.S.; Zhang, Z. GAPIT: Genome association and prediction integrated tool. Bioinformatics 2012, 28, 2397–2399. [Google Scholar] [CrossRef]
  27. Yin, L.; Zhang, H.; Tang, Z.; Xu, J.; Yin, D.; Zhang, Z.; Yuan, X.; Zhu, M.; Zhao, S.; Li, X.; et al. rMVP: A memory-efficient, visualization-enhanced, and parallel-accelerated tool for genome-wide association study. Genom. Proteom. Bioinform. 2021, 19, 619–628. [Google Scholar] [CrossRef]
  28. Conway, J.R.; Lex, A.; Gehlenborg, N. UpSetR: An R package for the visualization of intersecting sets and their properties. Bioinformatics 2017, 33, 2938–2940. [Google Scholar] [CrossRef]
  29. Severin, A.J.; Woody, J.L.; Bolon, Y.T.; Joseph, B.; Diers, B.W.; Farmer, A.D.; Muehlbauer, G.J.; Nelson, R.T.; Grant, D.; Specht, J.E.; et al. RNA-Seq Atlas of Glycine max: A guide to the soybean transcriptome. BMC Plant Biol. 2010, 10, 160. [Google Scholar] [CrossRef]
  30. Zhang, D.; Li, H.; Wang, J.; Zhang, H.; Hu, Z.; Chu, S.; Lv, H.; Yu, D. High-density genetic mapping identifies new major loci for tolerance to low-phosphorus stress in soybean. Front. Plant Sci. 2016, 7, 372. [Google Scholar] [CrossRef]
  31. Lin, S.; Cianzio, S.; Shoemaker, R. Mapping genetic loci for iron deficiency chlorosis in soybean. Mol. Breed. 1997, 3, 219–229. [Google Scholar] [CrossRef]
  32. Lin, S.F.; Grant, D.; Cianzio, S.R.; Shoemaker, R.C. Molecular characterization of iron deficiency chlorosis in soybean. J. Plant Nutr. 2000, 23, 1929–1939. [Google Scholar] [CrossRef]
  33. Liang, Q.; Cheng, X.; Mei, M.; Yan, X.; Liao, H. QTL analysis of root traits as related to phosphorus efficiency in soybean. Ann. Bot. 2010, 106, 223–234. [Google Scholar] [CrossRef] [PubMed]
  34. Charlson, D.V.; Bailey, T.B.; Cianzio, S.R.; Shoemaker, R.C. Molecular marker Satt481 is associated with iron-deficiency chlorosis resistance in a soybean breeding population. Crop Sci. 2005, 45, 2394–2399. [Google Scholar] [CrossRef]
  35. Yu, L.H.; Miao, Z.Q.; Qi, G.F.; Wu, J.; Cai, X.T.; Mao, J.L.; Xiang, C.B. MADS-Box transcription factor AGL21 regulates lateral root development and responds to multiple external and physiological signals. Mol. Plant 2014, 7, 1653–1669. [Google Scholar] [CrossRef]
  36. Huang, S.; Liang, Z.; Chen, S.; Sun, H.; Fan, X.; Wang, C.; Xu, G.; Zhang, Y.A. Transcription factor, OsMADS57, regulates long-distance nitrate transport and root elongation. Plant Physiol. 2019, 180, 882–895. [Google Scholar] [CrossRef]
  37. Xing, Y.; Wang, N.; Zhang, T.; Zhang, Q.; Du, D.; Chen, X.; Lu, X.; Zhang, Y.; Zhu, M.; Liu, M.; et al. SHORT-ROOT 1 is critical to cell division and tracheary element development in rice roots. Plant J. 2021, 105, 1179–1191. [Google Scholar] [CrossRef]
  38. Tu, B.; Hu, L.; Chen, W.; Li, T.; Hu, B.; Zheng, L.; Lv, Z.; You, S.; Wang, Y.; Ma, B.; et al. Disruption of OsEXO70A1 causes irregular vascular bundles and perturbs mineral nutrient assimilation in rice. Sci. Rep. 2015, 5, 18609. [Google Scholar] [CrossRef]
  39. Astolfi, S.; Zuchi, S.; Cesco, S.; Di Toppi, L.S.; Pirazzi, D.; Badiani, M.; Varanini, Z.; Pinton, R. Iron deficiency induces sulfate uptake and modulates redistribution of reduced sulfur pool in barley plants. Funct. Plant Biol. 2006, 33, 1055–1061. [Google Scholar] [CrossRef]
  40. Ciaffi, M.; Paolacci, A.R.; Celletti, S.; Catarcione, G.; Kopriva, S.; Astolfi, S. Transcriptional and physiological changes in the S assimilation pathway due to single or combined S and Fe deprivation in durum wheat (Triticum durum L.) seedlings. J. Exp. Bot. 2013, 64, 1663–1675. [Google Scholar] [CrossRef]
  41. Paolacci, A.R.; Celletti, S.; Catarcione, G.; Hawkesford, M.J.; Astolfi, S.; Ciaffi, M. Iron deprivation results in a rapid but not sustained increase of the expression of genes involved in iron metabolism and sulfate uptake in tomato (Solanum lycopersicum L.) seedlings. J. Integr. Plant Biol. 2014, 56, 88–100. [Google Scholar] [CrossRef]
  42. Burow, M.; Halkier, B.A. How does a plant orchestrate defense in time and space? Using glucosinolates in Arabidopsis as case study. Curr. Opin. Plant Biol. 2017, 38, 142–147. [Google Scholar] [CrossRef]
  43. Chan, K.X.; Phua, S.Y.; Van Breusegem, F. Secondary sulfur metabolism in cellular signalling and oxidative stress responses. J. Exp. Bot. 2019, 70, 4237–4250. [Google Scholar] [CrossRef]
  44. Del Carmen Martínez-Ballesta, M.; Moreno, D.A.; Carvajal, M. The physiological importance of glucosinolates on plant response to abiotic stress in Brassica. Int. J. Mol. Sci. 2013, 14, 11607–11625. [Google Scholar] [CrossRef]
  45. Ristova, D.; Kopriva, S. Sulfur signaling and starvation response in Arabidopsis. iScience 2022, 25, 104242. [Google Scholar] [CrossRef]
  46. Ahmad, N.; Malagoli, M.; Wirtz, M.; Hell, R. Drought stress in maize causes differential acclimation responses of glutathione and sulfur metabolism in leaves and roots. BMC Plant Biol. 2016, 16, 247. [Google Scholar] [CrossRef]
  47. Barakat, A.; Szick-Miranda, K.; Chang, I.F.; Guyot, R.; Blanc, G.; Cooke, R.; Delseny, M.; Bailey-Serres, J. The organization of cytoplasmic ribosomal protein genes in the Arabidopsis genome. Plant Physiol. 2001, 127, 398–415. [Google Scholar] [CrossRef]
  48. Luo, A.; Zhan, H.; Zhang, X.; Du, H.; Zhang, Y.; Peng, X. Cytoplasmic ribosomal protein L14B is essential for fertilization in Arabidopsis. Plant Sci. 2020, 292, 110394. [Google Scholar] [CrossRef]
  49. Sha, A.H.; Chen, Y.H.; Shan, Z.H.; Zhang, X.J.; Wu, X.J.; Qiu, D.Z.; Zhou, X.A. Identification of photoperiod-regulated gene in soybean and functional analysis in Nicotiana benthamiana. J. Genet. 2014, 93, 43–51. [Google Scholar]
  50. Zhang, J.; Yuan, H.; Yang, Y.; Fish, T.; Lyi, S.M.; Thannhauser, T.W.; Zhang, L.; Li, L. Plastid ribosomal protein S5 is involved in photosynthesis, plant development, and cold stress tolerance in Arabidopsis. J. Exp. Bot. 2016, 67, 2731–2744. [Google Scholar] [CrossRef]
  51. Dong, X.; Duan, S.; Wang, H.B.; Jin, H.L. Plastid ribosomal protein LPE2 is involved in photosynthesis and the response to C/N balance in Arabidopsis thaliana. J. Integr. Plant Biol. 2020, 62, 1418–1432. [Google Scholar] [CrossRef] [PubMed]
  52. Tarnowski, L.; Rodriguez, M.C.; Brzywczy, J.; Cysewski, D.; Wawrzynska, A.; Sirko, A. Overexpression of the selective autophagy cargo receptor NBR1 modifies plant response to sulfur deficit. Cells 2020, 9, 669. [Google Scholar] [CrossRef] [PubMed]
  53. Chen, Y.; Wu, Z.; Yuan, W.; Kan, G.; Huang, F.; Yu, D.; Wang, H. Research on the regulation effect of ribosomal gene GmRPL12 on low sulfur tolerance in soybean. Soybean Sci. 2020, 39, 518–526. [Google Scholar]
Figure 1. Frequency distribution diagrams of SA and SC. (a) Shoot sulfur accumulation (SA). (b) Shoot sulfur concentration (SC). The mean values of the traits in 121 wild soybeans across three environments were used to draw the diagrams.
Agronomy 14 00292 g001
Figure 2. Visualization of genome-wide association analysis results. (a) Manhattan plots. (b) The number and distribution of significant association SNPs in different environments. (c) The number of significant association SNPs on chromosomes. SA: shoot sulfur accumulation, SC: shoot sulfur concentration.
Agronomy 14 00292 g002
Figure 3. The heatmaps of low-sulfur induction expression and tissue expression of 27 candidate genes. (a) The heatmap of the induction expression of genes in soybean leaves and roots. L: leaf; R: root; YM (Yunmengliuyuehuaye) and QY (Qinyangdadou) are soybean varieties used in low-sulfur transcriptome [5]. The number shows the log2-transformed fold change value of genes between the control and low-sulfur treatments. The gray blank represents not significant. (b) The heatmap of tissue expression of genes predicted in SoyBase (https://www.soybase.org/, accessed on 20 September 2023). The normalized values were used here [29]. The gray blank represents no data.
Agronomy 14 00292 g003
Figure 4. Gene structure and haplotype analysis of GsRPL35 (GlysoPI483463.15G039600). (a) The distribution of seven SNPs in GsRPL35. The white box, black box, and black line indicate the untranslated region, exon, and intron, respectively. ATG: initiation codon. SNP 1-7 separately corresponded to AX-94131297, AX-94131298, AX-93664677, AX-93664676, AX-93960843, AX-94288562, and AX-93834222. (b) Ten haplotypes of GsRPL35. Different colors indicate different alleles. (c) Hap2 and Hap6 were significantly different in SA under multiple environments. H2: Hap2; H6: Hap6; SA: sulfur accumulation; E1, E2, and E3 represent three different environments; CE: combining environments. *: significant at 0.05; **: significant at 0.01.
Agronomy 14 00292 g004
Table 1. Descriptive statistics, analysis of variance, and broad sense heritability of SA and SC of 121 wild soybeans.
TraitEnv.Max.Min.MeanSDCV (%)GG × EH2 (%)
SAE19.83 mg0.94 mg3.80 mg2.0052.65******68.01
E29.21 mg0.42 mg2.15 mg1.2960.04
E314.75 mg0.54 mg4.32 mg2.8866.79
SCE125.23 mg/g5.26 mg/g13.25 mg/g3.7027.95******38.23
E227.84 mg/g4.41 mg/g10.82 mg/g3.2930.41
E340.73 mg/g6.03 mg/g15.20 mg/g7.5649.74
SA: shoot sulfur accumulation; SC: shoot sulfur concentration. Env.: environment; Max.: maximum; Min.: minimum; SD: standard deviation; CV: coefficient of variation; G: genotype. ***: significance level of 0.001.
Table 2. Pearson’s correlation analysis results between traits.
TraitsSASC
PH0.19 *
0.04
−0.063
0.49
RL0.32 **
0.0004
−0.09
0.28
FWS0.88 **
<0.0001
0.10
0.27
FWR0.79 **
<0.0001
0.16
0.08
DWS0.86 **
<0.0001
0.02
0.79
DWR0.79 **
<0.0001
−0.01
0.95
SC0.46 **
<0.0001
PH: plant height; RL: root length; FWS: fresh weight of shoot; FWR: fresh weight of root; DWS: dry weight of shoot; DWR: dry weight of root; SA: shoot sulfur accumulation; SC: shoot sulfur concentration. * and ** represent significance levels of 0.05 and 0.01.
Table 3. Stable QTLs associated with SA, its candidate genes, and adjacent or overlapping QTLs.
QTLRepresentative SNPChr.Position (bp) aNumber of Significant SNPsEnv.Genes Containing the SNPNeighbor/Overlapping QTL
qSA9AX-94068640943,282,1092E2/E3/CEGlysoPI483463.09G187200Shoot S 1-g8 [18]; Shoot K 1-g19 [18]; Acid phosphatase activity, variable P [30]
qSA12AX-93799340129,828,9003E2/CE Fe effic 8-3, 4-3, 11-3 [31,32]
qSA13AX-941086221322,470,3592E3/CEGlysoPI483463.13G085900Shoot S 1-g22 [18], shoot P [33]; shoot P 1-3 [18]; Root weight, dry, variable P [30]
qSA14AX-941274101442,849,1381E3/CE Root weight, dry, variable P 1-16 [30]; Fe effic 3-1, 10-3 [31,32]
qSA15AX-93664677153,334,7041E3/CEGlysoPI483463.15G039600P use efficiency, variable P 1-4, 1-6, 1-10 [30]
qSA19AX-9418312919144,2671E1/CEGlysoPI483463.19G132700Fe effic 13-2 [34];
a: the position of SNP in Glycine soja V1.1 (PI 483463). Chr.: chromosome; Env.: Environments.
Table 4. GO biological process descriptions of the 27 candidate genes.
No.Gene ID in G. soja v1.1GO Biological Process Descriptions
1GlysoPI483463.09G186500Trehalose biosynthetic process; crop yield; Improving photosynthesis
2GlysoPI483463.09G186600Sucrose metabolic process; response to water deprivation; response to bacterium; response to salt stress; response to abscisic acid; abscisic acid-activated signaling pathway; cellular response to gibberellin stimulus
3GlysoPI483463.09G186700Multicellular organism development; flower development; vegetative to reproductive phase transition of meristem; regulation of growth; positive regulation of transcription by RNA polymerase II; root development
4GlysoPI483463.09G188100Spliceosomal snrnp assembly; chloride transport; cell volume homeostasis
5GlysoPI483463.09G188200Chloroplast organization; chromoplast organization; carotene biosynthetic process; protein stabilization; positive regulation of carotenoid biosynthetic process; resistance to TYLCV; response to biotic and abiotic stresses
6GlysoPI483463.12G093800Response to cold; cell differentiation; positive regulation of transcription, DNA-templated; response to freezing
7GlysoPI483463.12G093900Regulation of cyclin-dependent protein serine/threonine kinase activity; mitotic cell cycle phase transition; cell division
8GlysoPI483463.13G085300Biological process; MAPK phosphatase
9GlysoPI483463.13G085400Biological process
10GlysoPI483463.13G085500Purine nucleoside catabolic process; response to drought
11GlysoPI483463.13G086100Triglyceride biosynthetic process; plant development
12GlysoPI483463.13G086800Transmembrane transport; Fe homeostasis; Cd-responsive gene; respond to drought, cadmium, and salt stresses
13GlysoPI483463.14G134400Unknown
14GlysoPI483463.15G038800Ribosomal large subunit assembly; translation; response to oxidative stress; response to cold; response to high light intensity; tolerance to drought and salt stresses
15GlysoPI483463.15G039300Seed germination; root development
16GlysoPI483463.15G039600Maturation of LSU-rRNA from tricistronic rRNA transcript (SSU-rRNA, 5.8S rRNA, LSU-rRNA); translation
17GlysoPI483463.15G039700Exocytosis; protein transport; cell division to polar growth; response to biotic/abiotic stresses; seed development; defense response (the soybean cyst nematode); root development
18GlysoPI483463.15G039800Fatty acid biosynthetic process; cuticular wax formation; late stage of leaf and flower development
19GlysoPI483463.15G040200Unknown
20GlysoPI483463.19G000900Unknown
21GlysoPI483463.19G001100Translation; ribosome assembly
22GlysoPI483463.19G001200Formation of translation preinitiation complex; formation of cytoplasmic translation initiation complex; cold temperatures and freezing tolerance; regulating cell division, cell growth, and cell death; anti-virus
23GlysoPI483463.19G001400Cellular response to hypoxia
24GlysoPI483463.19G002200Lipid transport; response to disease and salt stress; tolerance to abiotic and biotic stress
25GlysoPI483463.19G002600Carbohydrate metabolic process; phosphorylation
26GlysoPI483463.19G002800Regulation of transcription, DNA-templated; regulate nitrogen deficiency-induced leaf senescence; response to Pi deficiency; affects grain nutrient concentrations; promote lateral root number
Note: descriptions related to root development and nutrient were shown in bold font.
Disclaimer/Publisher’s Note: The statements, opinions and data contained in all publications are solely those of the individual author(s) and contributor(s) and not of MDPI and/or the editor(s). MDPI and/or the editor(s) disclaim responsibility for any injury to people or property resulting from any ideas, methods, instructions or products referred to in the content.

