Article

Effects of Drought Stress and Postdrought Rewatering on Winter Wheat: A Meta-Analysis

1
Collaborative Innovation Center of Forecast and Evaluation of Meteorological, Nanjing University of Information Science & Technology, Nanjing 210044, China
2
School of Applied Meteorology, Nanjing University of Information Science & Technology, Nanjing 210044, China
*
Author to whom correspondence should be addressed.
Agronomy 2024, 14(2), 298; https://doi.org/10.3390/agronomy14020298
Submission received: 30 November 2023 / Revised: 15 December 2023 / Accepted: 27 January 2024 / Published: 29 January 2024
(This article belongs to the Section Plant-Crop Biology and Biochemistry)

Abstract

:
Drought is a major stress that restricts the growth and development of winter wheat (Triticum aestivum L.), and recovery after drought is the key to coping with adversity. So, we used a meta-analysis to quantitatively evaluate the responses of winter wheat to drought stress and rewatering and investigated the differences caused by several moderators (e.g., stress intensity, treatment durations, growth stages, planting methods, and experimental areas). The results show that drought can cause many negative effects on winter wheat. However, in most cases, rewatering can offset these adverse effects. Winter wheat under short-term or mild stress was less affected, and rewatering can restore it to the control level. Net photosynthetic rate (Pn), transpiration rate (Tr), and stomatal conductance (gs) are sensitive to environmental water change. Drought reduced the quantum yield of electron transport (ΦPSII), with insignificant effects on the efficiency of PSII (Fv/Fm). Additionally, the responses to drought and rewatering also varied with different growth stages. The regreening stage and the anthesis-filling stage are both critical water management periods. Rewatering after the jointing stage had no significant effect on leaf area (LA) and plant height (PH). The drought tolerance and recovery ability of field-grown wheat were better than those of pot-grown wheat. Winter wheat planted on the Loess Plateau was less affected than that on the Huang-Huai-Hai Plain and the Middle–Lower Yangtze Plain. Overall, different moderators may lead to different degrees of responsiveness of wheat to drought stress and postdrought rewatering. This study provides a reference for winter wheat to cope with drought stress and a useful guidance to wheat breeding programs.

1. Introduction

Wheat constitutes a pivotal grain crop for China, and its yield holds an intimate correlation to the nation’s food security strategy [1]. Under the influence of the monsoon climate, precipitation is generally low during the growing season of wheat in China, and the asynchrony between the rainy season and the critical water-demanding period of wheat leads to frequent drought stress during the growth of winter wheat [2]. Drought is one of the most principal abiotic stresses affecting wheat growth and development, which is the main factor limiting the high and stable yield of winter wheat [3]. Therefore, the response of winter wheat to drought stress has attracted much attention in the study of high and stable yield of winter wheat. So far, many scholars have studied the effects of drought on different morphological-, physiological-, and biochemical characteristics, yield, and yield components of winter wheat. Some studies have shown that drought stress leads to soil water deficit, which alters water content in winter wheat, thereby affecting net photosynthetic rate (Pn), stomatal conductance (gs), transpiration (Tr), and water use efficiency (WUE) [4,5,6,7,8,9,10]. Not only that, drought stress also reduces the chlorophyll content and the PSII fluorescence quantum yield of wheat flag leaves, and severe drought can reduce the leaf water content and the quantum efficiency of PSII photochemistry in the dark-adapted state of flag leaves, resulting in reduced photosynthetic capacity [11,12,13,14,15,16,17]. Meanwhile, the division and expansion of leaf cells are limited under drought stress, leading to a reduction in leaf area (LA) [18]. Lack of water also shortens the growth and growth cycle of winter wheat and reduces plant height (PH) and biomass, thus affecting the final yield of winter wheat [19,20]. When plants are subjected to drought stress, a large amount of reactive oxygen species (ROS) can be produced in the body, then the activities of superoxide dismutase (SOD), peroxidase (POD), catalase (CAT), and glutathione reductase (GR) can be significantly elevated, which is an adaptive response produced by plants in response to adversity [21,22,23,24,25]. The concentration of malondialdehyde (MDA) can indicate the degree of oxidative stress to which the crop is subjected, and as drought intensifies, the level of malondialdehyde rises rapidly, causing cellular damage and thus affecting the normal growth and development of the crop [26]. Plants exhibited positive osmoregulation through the synthesis of soluble protein, soluble sugar (SS), and proline (Pro) to improve membrane stability [27,28]. Therefore, photosynthesis, plant morphology, antioxidant properties, and osmoregulation are essential indicators for studying the effects of drought stress on winter wheat.
Some scholars have suggested that the ability of crops to recover quickly from drought stress is critical for growth and survival [29]. The recovery of plants from drought stress requires a variety of metabolic adjustments to repair the damage caused by drought stress, and this type of recovery of plant growth is defined as “drought recovery” [30,31]. It has been shown that stomatal conductance and photosynthesis are usually reversible under rewatering conditions, and that postdrought rewatering promotes plant growth and dry matter accumulation and reduces peroxidation of lipid membrane by maintaining antioxidant activity for effective scavenging of ROS [32,33]. The osmoregulation that accumulates in cells, such as proline and soluble sugars, decreases rapidly after stress relief [26]. In addition, after drought stress at the regreening and jointing stages, winter wheat that was rewatered at the booting and grain-filling stages was able to increase the number of spikes, the number of grains in a spike, and the weight of 1000 grains at the harvesting stage, resulting in higher yield [34]. Several simulation studies have been conducted to demonstrate that postdrought rewatering restores most physiological processes in winter wheat, but fewer studies are comparing the responses to drought stress and postdrought rewatering [35].
In recent years, meta-analysis has been more and more widely used in the field of agronomy in China, and as a statistical tool of larger spatial and temporal scales, it continues to play a unique and important role [36,37,38]. Some scholars have used meta-analysis to unite several independent and relevant studies to analyze the general trend of the effects of drought stress on winter wheat [39,40]. However, the available articles are limited to the effects of drought stress on winter wheat, have not analyzed the effects of postdrought rewatering, and are not comprehensive enough in the types of impact indicators involved. In addition, winter wheat’s adaptation to drought and its ability to recover from postdrought rewatering mainly depend on the growth stage, stress intensity, and duration [41,42]. The planting method and experimental area may also have different effects on winter wheat under drought stress. Therefore, we used meta-analysis to study the changes in 20 physiological indicators, including photosynthesis, chlorophyll content, antioxidant system, cellular osmoregulation, plant morphology, yield, and yield components, under drought stress and postdrought rewatering in winter wheat in China. We also conducted subgroup analyses with different stress intensities, stress (or rewatering) durations, growth stages, planting methods, and experimental areas to gain further insights into differences in the response of winter wheat to drought stress and postdrought rewatering. It aims to provide a theoretical reference for winter wheat to cope with drought stress, and is helpful to construct selection criteria for drought-tolerant winter wheat genotypes in the future.

2. Materials and Methods

2.1. Data Search and Collection

For meta-analysis, we conducted a literature search with the keywords “winter wheat”, “drought”, “water deficit”, “water stress”, “rewatering”, and “drought recovery” by reviewing the Web of Science and the China Knowledge Resource Integrated Databases. There was no restriction on the year of publication of the literature, but literature from October 2023 onwards was excluded. Relevant articles were obtained, and duplicates were removed, which in turn excluded noncompliant articles by title and abstract, and articles that did not meet the inclusion criteria were removed by reading the full text (these criteria are explained in Section 2.2). Finally, 132 articles that met the criteria were identified to build the database (excluding conference proceedings and reviews). The literature data should contain the number of replicates, mean, and standard deviation (or standard error) of the control and treatment groups. When extracting data from the literature, if the data were listed in the original literature, they were extracted directly; if the data in the original literature were presented in the form of graphs, they were digitized using GetData Graph Digitizer (Shanghai, CHN); if the standard deviation (standard error) was not provided directly in the original literature, the standard deviation was estimated by the p-value method [43].

2.2. Inclusion Criteria

To improve the representativeness and accuracy of the data and to ensure the validity of the conclusions of this study, all literature included in the database was screened and evaluated according to the following criteria:
(1)
The experimental crop was defined as winter wheat;
(2)
The planting methods must be field-grown or pot-grown;
(3)
The experiment sites are located within the Huang-Huai-Hai Plain, the Middle–Lower Yangtze Plain, and the Loess Plateau in China (The specific geographical division refers to the literature of Pan et al. [44], as shown in Figure 1);
(4)
The experiment must include a well-watered control group and a drought stress (or postdrought rewatering) treatment group;
(5)
Must be a controlled experiment with rain protection to prevent natural precipitation;
(6)
The intensity of drought stress must be delineated by relative soil water content (RSWC) from 0–20 cm;
(7)
The data contain any of the plant growth parameters for winter wheat listed in Table 1;
(8)
Data from the same experiment appearing in different papers were included only once.

2.3. Data Classification and Subgroup Analysis

In order to study the differences in response of winter wheat caused by different factors, the data in the established database were divided into two subdatabases of drought stress (D) and postdrought rewatering (R) according to the time of measurement. Then subgroup analyses were carried out according to stress intensities, the durations of stress (or rewatering), the growth stages exposed to drought, the planting methods, and the experimental areas within the two subdatabases, respectively. The subgroups are as follows:
(1)
According to the 0–20 cm of RSWC, it was divided into three drought stress intensities: mild stress (55% < RSWC ≤ 65%), moderate stress (45% < RSWC ≤ 55%), and severe stress (RSWC ≤ 45%). The relative soil water content was calculated as follows:
R S W C = s o i l   w a t e r   c o n t e n t f i l e d   c a p a c i t y × 100 %
(2)
The drought stress subdatabase was divided according to the duration of drought stress, and the rewatering subdatabase was divided according to the duration of rewatering. The number of days of duration was calculated from the beginning of the corresponding treatment to the end of the day of the measurement, which was divided into the following categories: 1–3 days, 4–7 days, 8–15 days, and >15 days;
(3)
The growth stages were divided as shown in Table 2, which includes single-stage drought and multi-stage successive drought;
(4)
The planting methods are classified as field and pot;
(5)
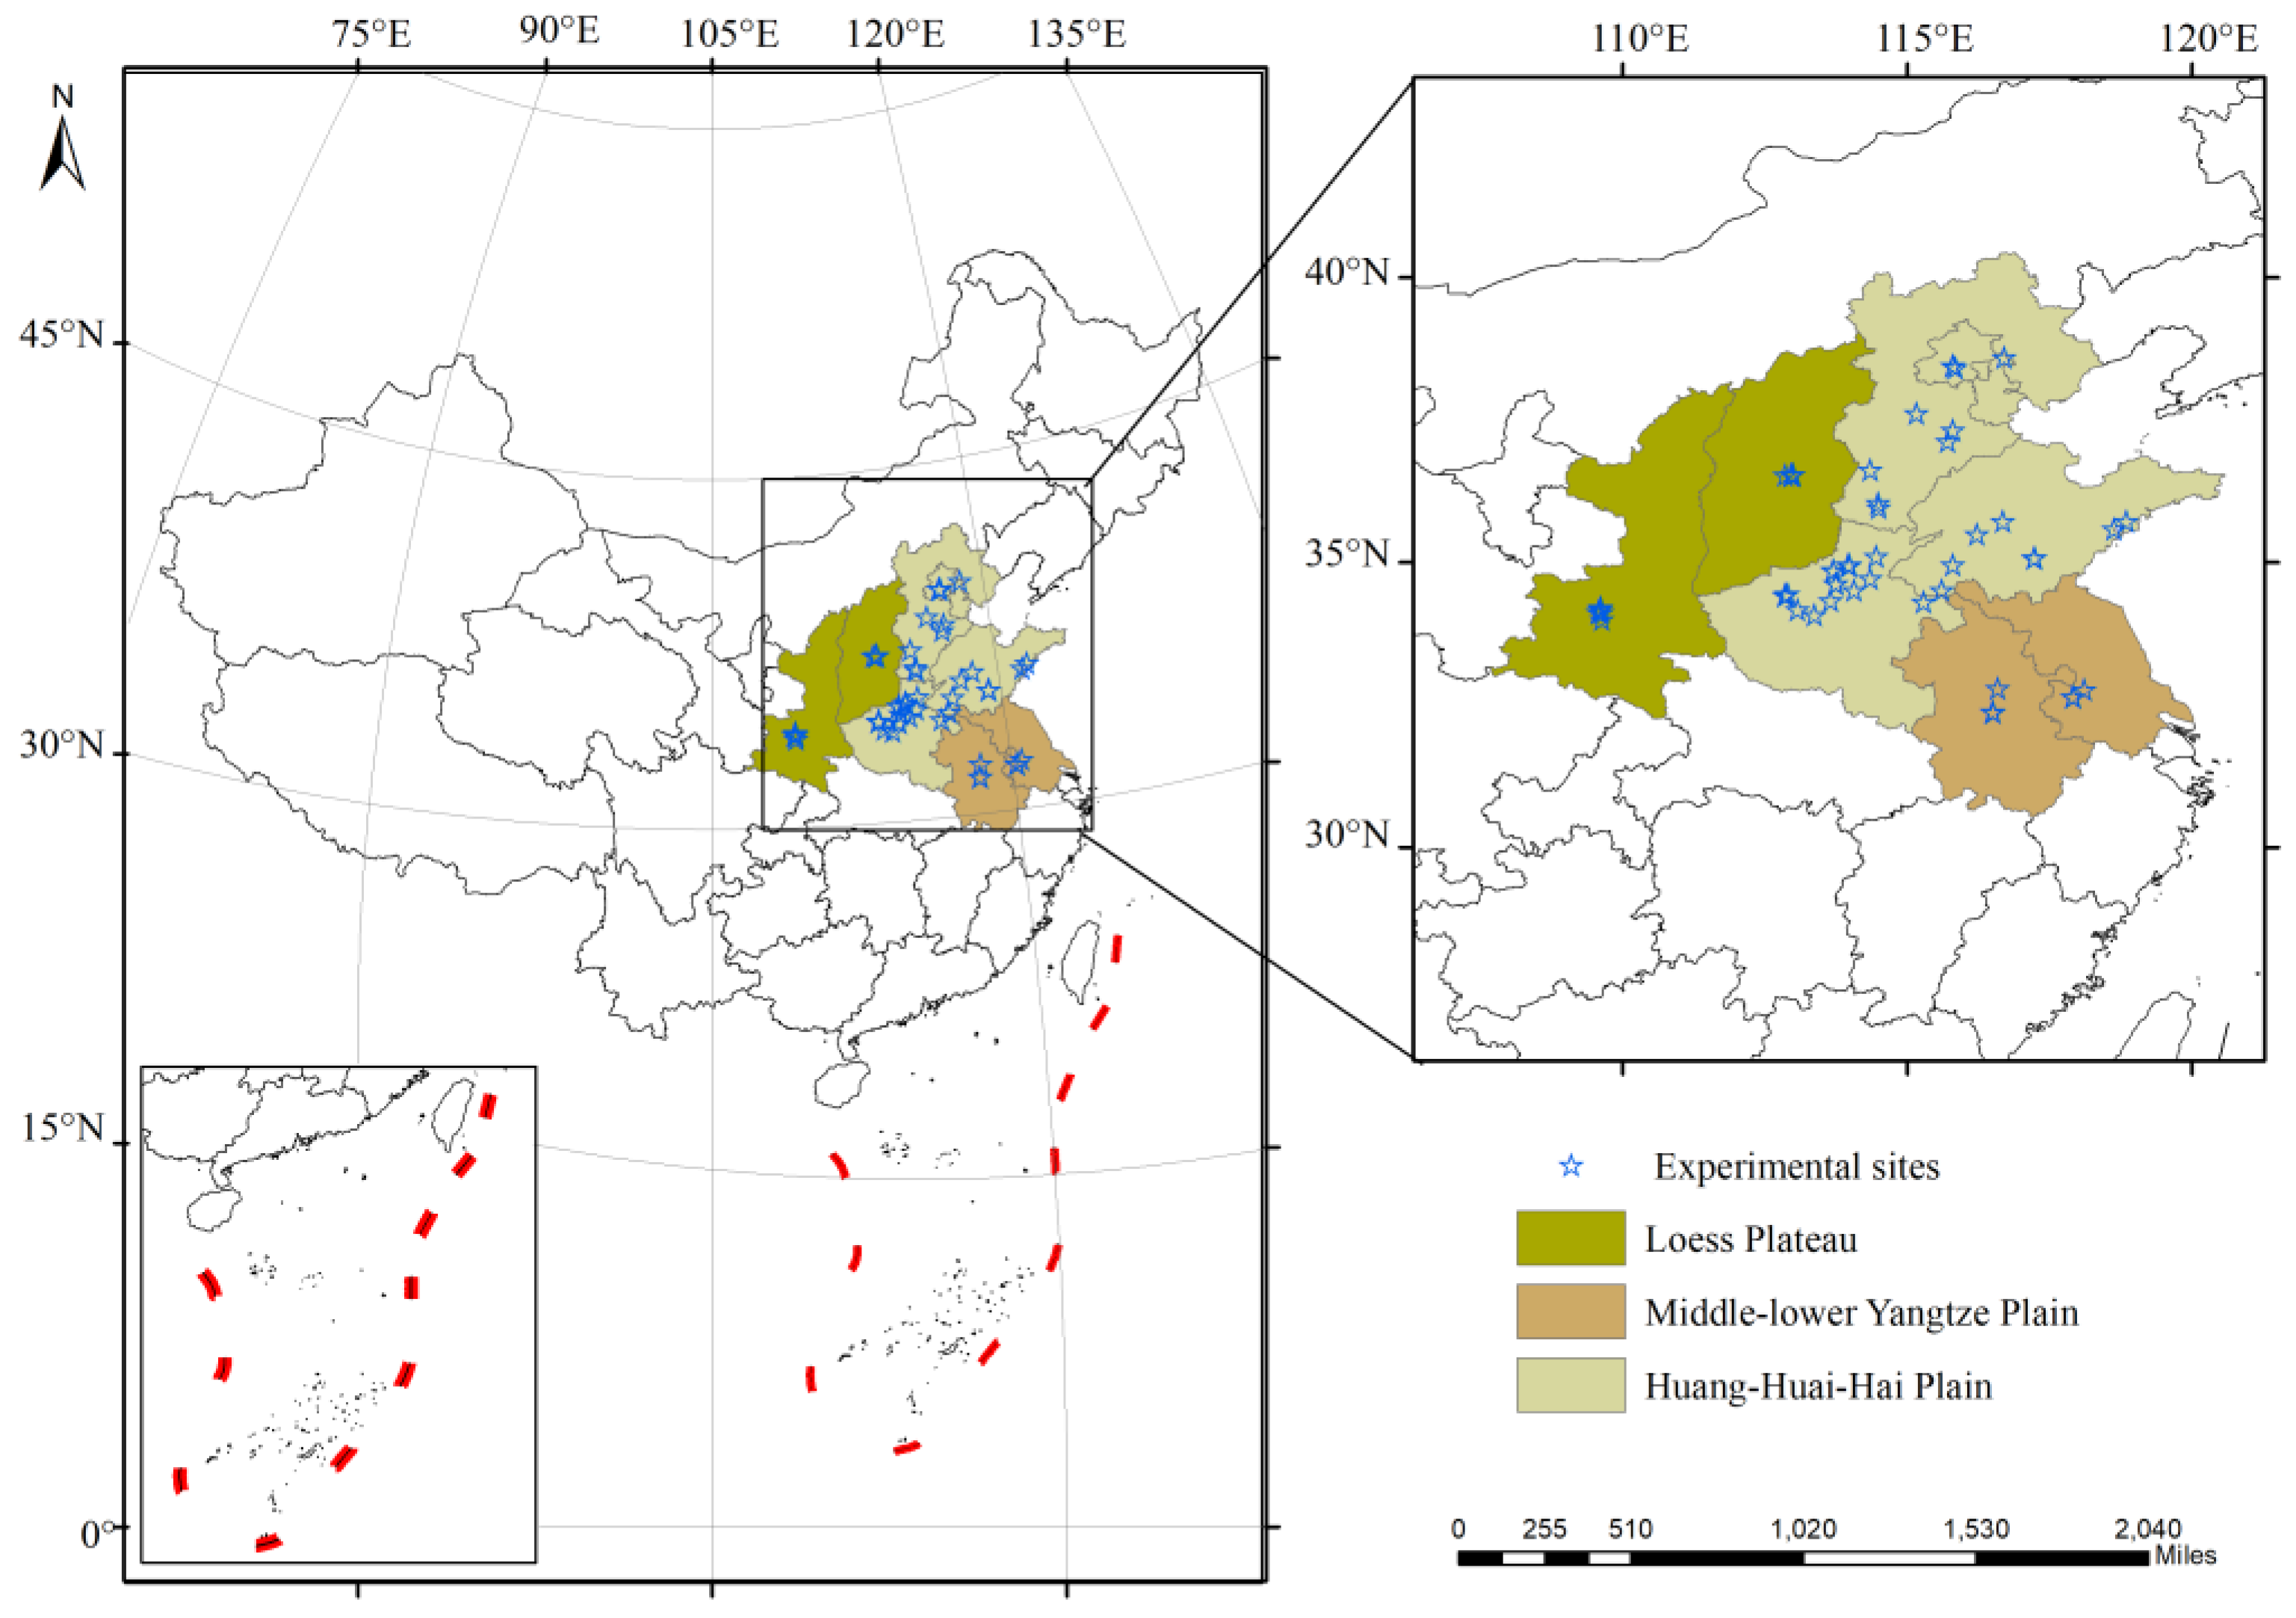
The experimental areas were divided into the Loess Plateau, the Huang-Huai-Hai Plain, and the Middle–Lower Yangtze Plain.
In addition, to analyze the results more reliably, we excluded categorical groups with sample sizes less than 3 from the study.

2.4. Statistical Analyses

In order to reduce the differences in meta-analysis, log response ratio was used as the effect value to measure the effects of drought stress and postdrought rewatering on each physiological indicator of winter wheat. The log response ratio was calculated as follows [45,46]:
R = l n X e X c = ln X e ln X c
where R is the log response ratio; X e and X c are the means of the treatment and control groups. Resampling procedures [bootstrap (n = 999)] were used to generate the mean effect and 95% confidence intervals (CI) for each grouping category. A mixed-effects model was used to determine whether or not the effect of drought stress was significant for each indicator [47]. To facilitate a comparison of the magnitude of impacts, the log response ratio was transformed back to the percentage change as:
Z = e x p R 1 × 100 %
In the formula, a positive value of Z means that this stress has a tendency to increase an indicator in winter wheat, and the opposite means that the indicator decreases. If 95% CI did not overlap 0, the effect value was considered significant (95% CI > 0, significant increase; 95% CI < 0, significant decrease) (p < 0.05); if the two 95% CIs do not overlap, these two groups are considered to be significantly different from each other [48].
For the validity and reliability of the results of the meta-analysis, this study used Rosenthal’s fail-safe number method to evaluate publication bias [47], and if the fail-safe number > 5n + 10 (N is the sample size), it was considered that the likelihood of publication bias would be minimal [49]. After calculation, the fail-safe numbers of each analysis in this meta-analysis meet the requirements, so there is no literature bias. We use the homogeneity statistic Q, an estimate of the among-study variance, to test whether the variances were significantly different or not; if p < 0.05 (tested against a chi-square distribution). When conducting subgroup analyses, total heterogeneity of effect value among studies (QT) was generated and partitioned into heterogeneity within categorical variables (Qw), and heterogeneity between group variables (Qb). Comparison between categorical variables was examined by Qb [50]. Qb was calculated for all subgroups (Table 3).
This study used MetaWin 2.1 (New York, NY, USA) software for analysis and Microsoft Excel 2010 software (Redmond, WA, USA) and Origin 2021 software (Northampton, MA, USA) for database building and plotting, respectively. ArcGIS 10.7 was used to create maps of the region division and experimental site distribution.

3. Results

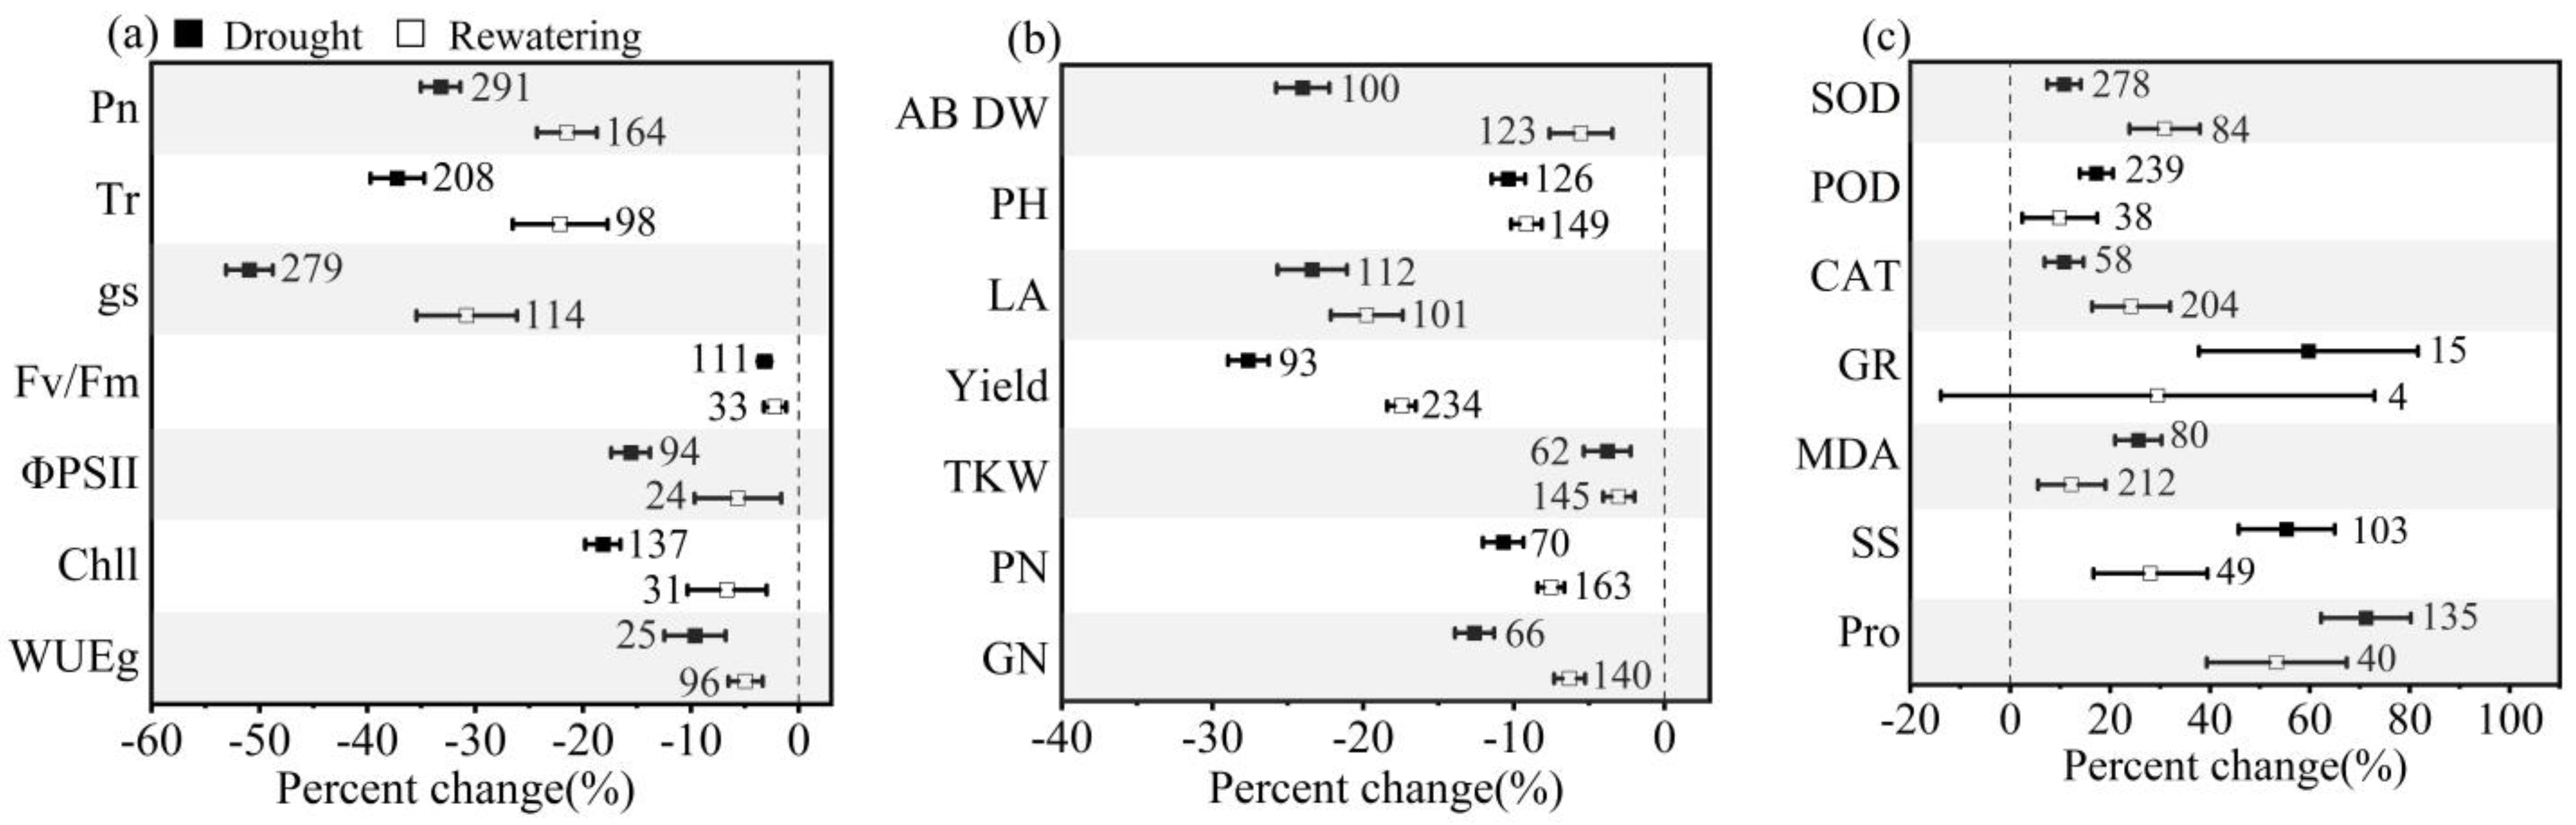
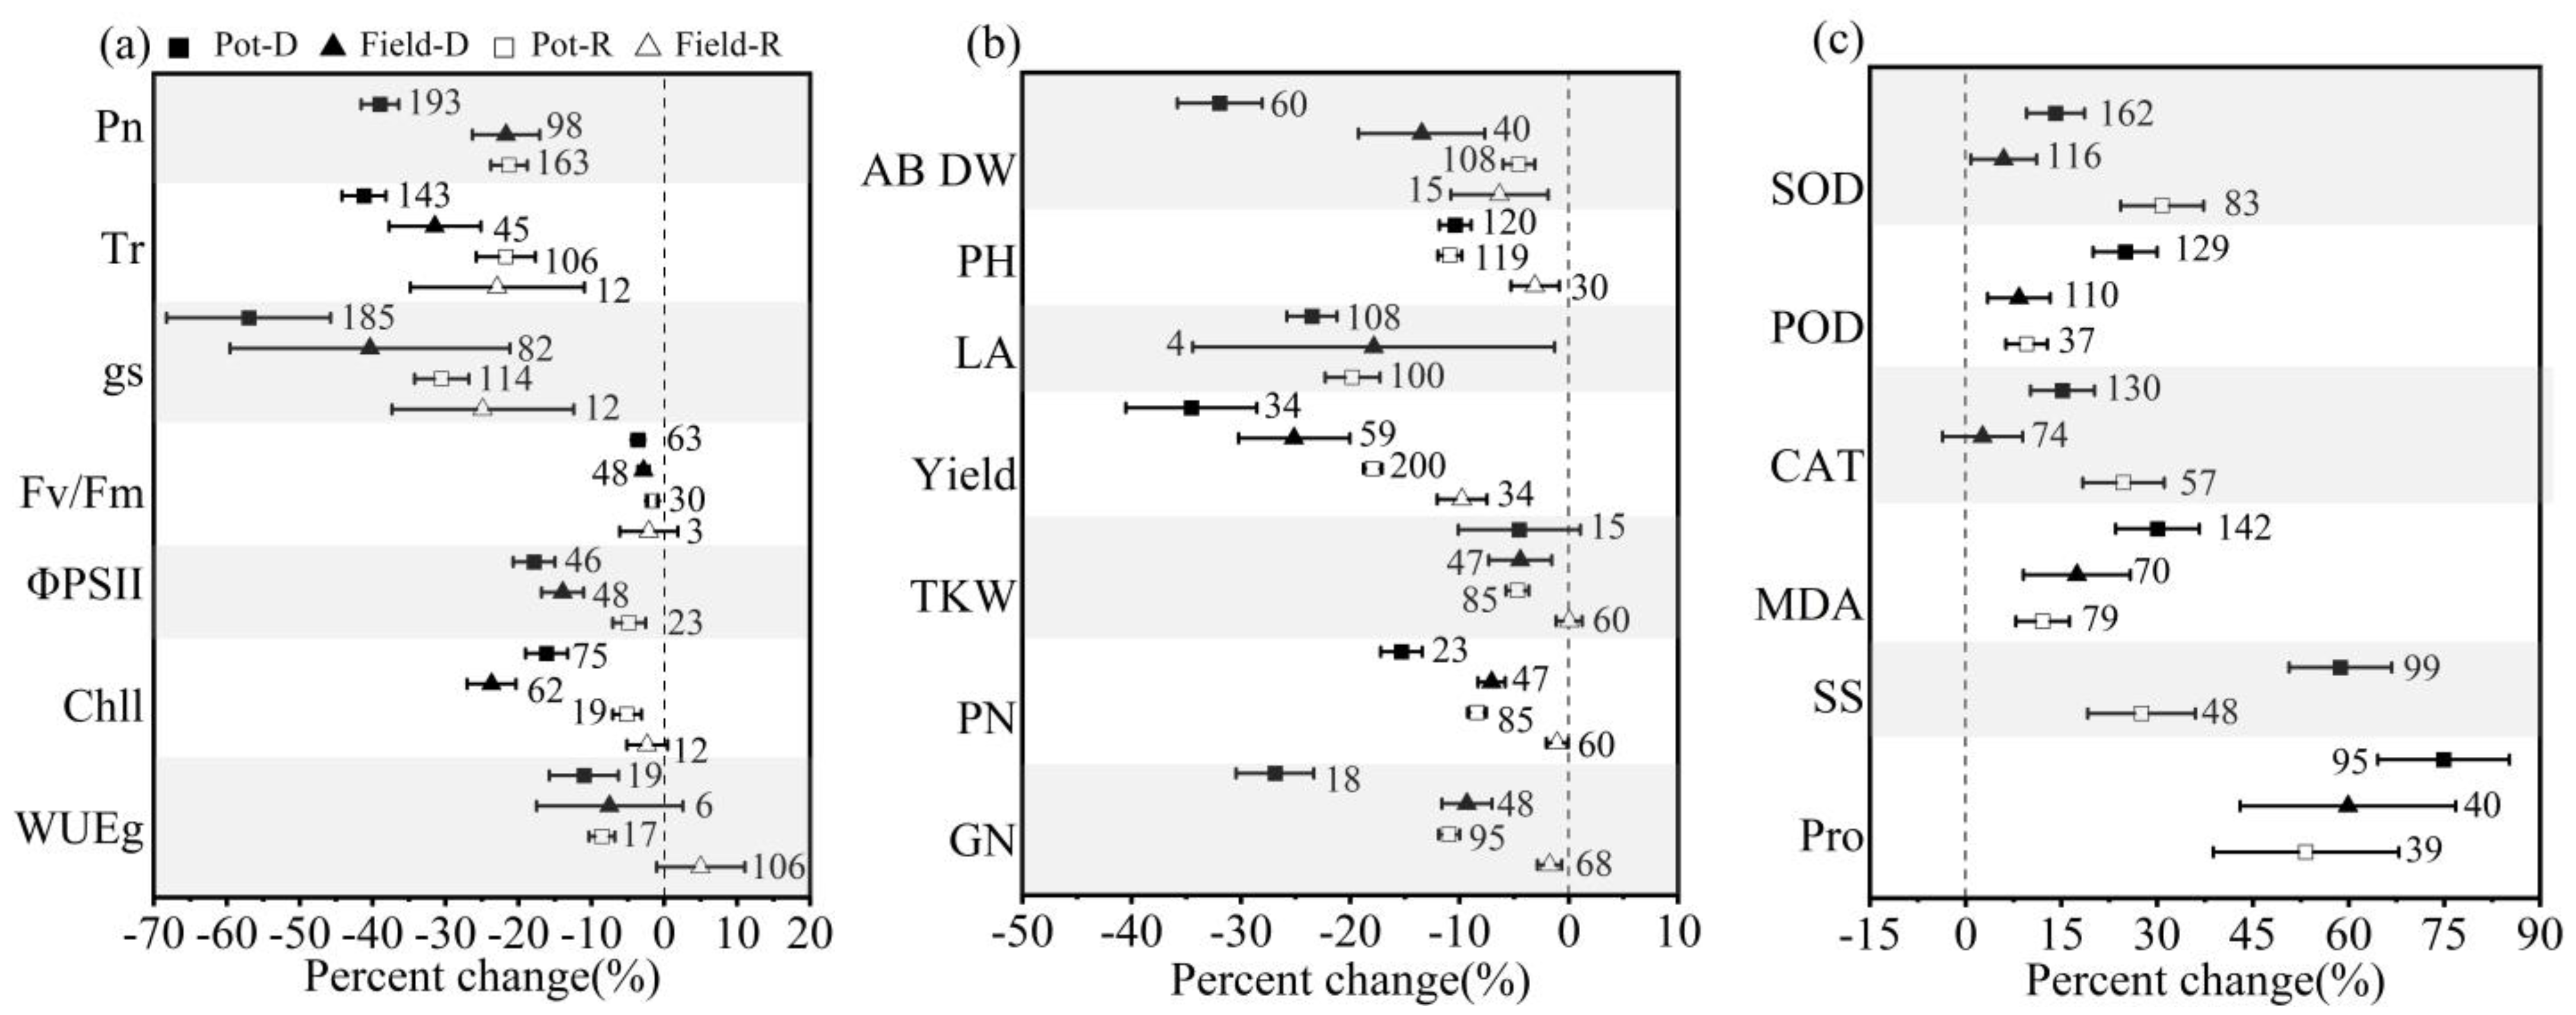
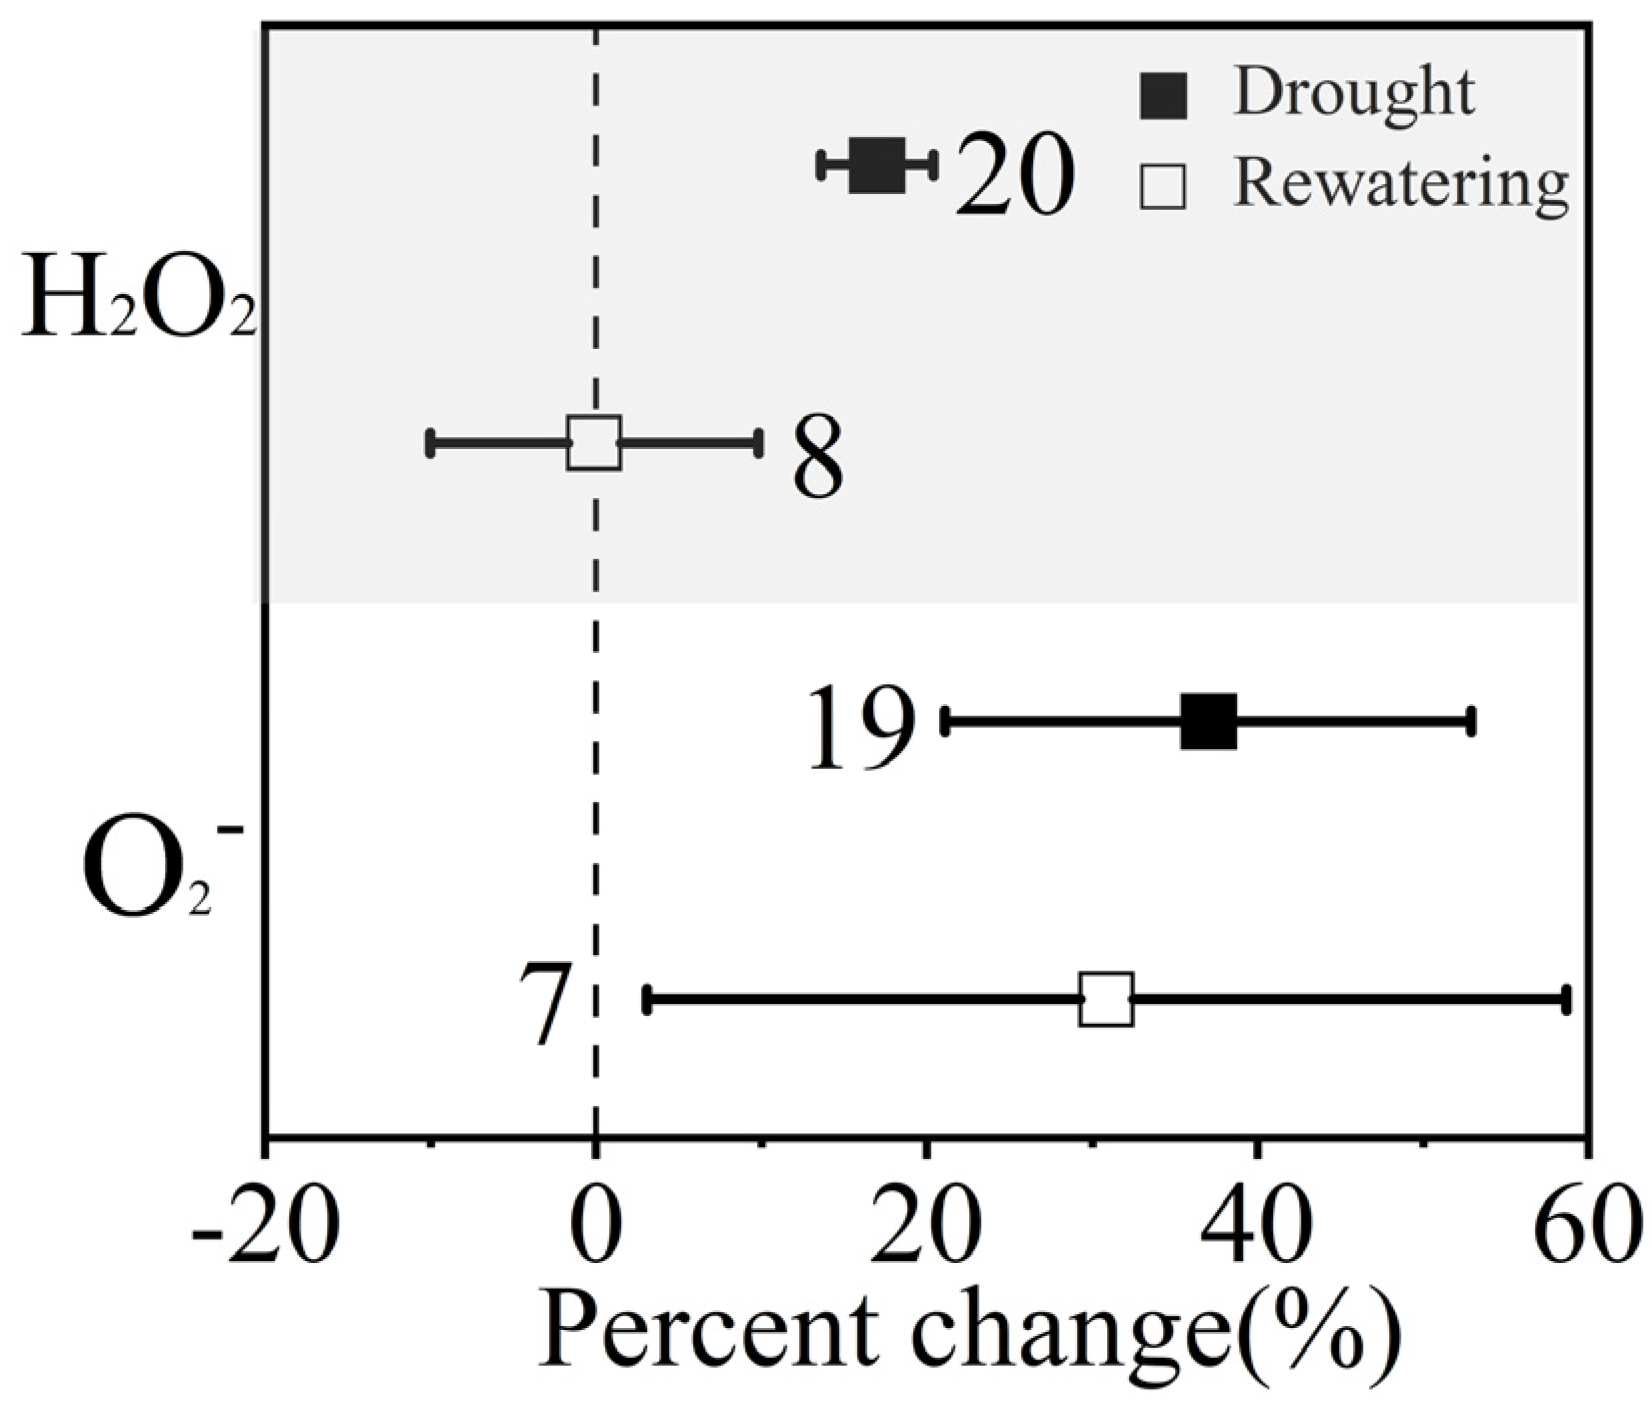
3.1. Overall Effects of Drought Stress and Postdrought Rewatering on Winter Wheat

There were significant differences in all indicators of winter wheat between drought stress groups and control groups (Figure 2), which showed that drought stress significantly affected the growth and development of winter wheat. Compared to the stress groups, the differences between the rewatering groups and the control level were reduced. It can be found that rewatering has different degrees of recovery effects on morphophysiological traits, biochemical characteristics, yield, and yield components of winter wheat. Drought stress decreased Pn, Tr, and gs significantly by −33.2% (CI: −35.0 to −31.4%), −37.2% (CI: −39.7% to −34.7%), and −50.9% (CI: −53.1% to −48.8%), respectively, and gs had the largest decrease (Figure 2a). Compared with drought stress, Pn (−21.5%, CI: −24.3% to −18.7%), Tr (−22.1%, CI: −26.5% to −17.7%), and gs (−30.8%, CI: −35.4% to −26.1%) recovered significantly during the period of rewatering (Figure 2a). According to Table 3, Pb of treatment of Pn, Tr, gs were all less than 0.001. It showed that net photosynthetic rate, stomatal conductance, and transpiration were more capable of recovery after drought. When imposing water stress, Fv/Fm only decreased by −3.2% (CI: −3.8% to −2.6%) compared to the control level. As Pb of Fv/Fm > 0.05 as given in Table 3, there was no significant difference between the stress group and rewatering group of Fv/Fm. While ΦPSII (−15.6%, CI: −17.4% to −13.8%) was reduced by stress to a large extent and the recovery of ΦPSII (−5.6%, CI: −9.7% to −1.2%) after rewatering was significant (Pb < 0.001). There was a significant difference between the change in Chll during the drought stress period (−18.2%, CI: −19.8% to −16.5%) and the rewatering period (−6.6%, CI: −10.3% to −3.0%), and Pb < 0.001 which shows that Chll can recover rapidly after rewatering. Differences in the response of WUEg to drought stress and postdrought rewatering also reached a significant level (Pb < 0.01).
In crop morphology, drought stress caused much greater decreases in leaf area (−23.4%, CI: −25.7% to −21.1%) than in plant height (−10.4%, CI: −11.5% to −9.2%), and recovery of both after rewatering was not significant (Figure 2b). Drought stress produced a large reduction in aboveground dry matter and yield as well, with reductions of −24.0% (CI: −25.8% to −22.2%) and −27.6% (CI: −29.0% to −26.3%). The yield reduction was mainly due to a combination of decreases in TKW (−3.8%, CI: −5.4% to −2.2%), PN (−10.7%, CI: −12.1% to −9.4%), and GN (−12.6%, CI: −13.9% to −11.3%). Both dry matter and yield had a large and significant recovery after rewatering but did not recover to control levels (Pb both < 0.001).
For MDA, drought stress resulted in a 25.6% (CI: 21.0% to 30.3%) increase (Figure 2c). To protect the cells, SOD (10.7%, CI: 7.4% to 14.1%), POD (17.2%, CI: 13.9% to 20.6%), CAT (10.8%, CI: 6.9% to 14.6%), GR (59.7%, CI: 37.7% to 81.6%), SS (55.3%, CI: 45.7% to 64.9%) and Pro (71.2%, CI: 62.2% to 80.1%) increased under drought stress to varying extents, with greater increases in GR, SS, and Pro. The MDA (12.3%, 5.5% to 19.1%) tended to converge to the control level after rewatering (Pb of treatment < 0.01). During the recovery period, POD (9.9%, CI: 2.4% to 17.4%), GR (29.5%, CI: −13.9% to 72.9%), and Pro (53.3, CI: 39.3% to 67.4%) decreased but did not reach a significant level, and the decrease in SS (55.3%, CI: 45.7% to 64.9%) reached a significant level (Pb < 0.001). While SOD (30.9%, CI: 23.8% to 38.0%) and CAT (24.2%, CI: 16.4% to 32.0%) after rewatering were significantly different from those in the drought group (Pb of SOD < 0.001, Pb of CAT < 0.01), but still maintained higher activity.

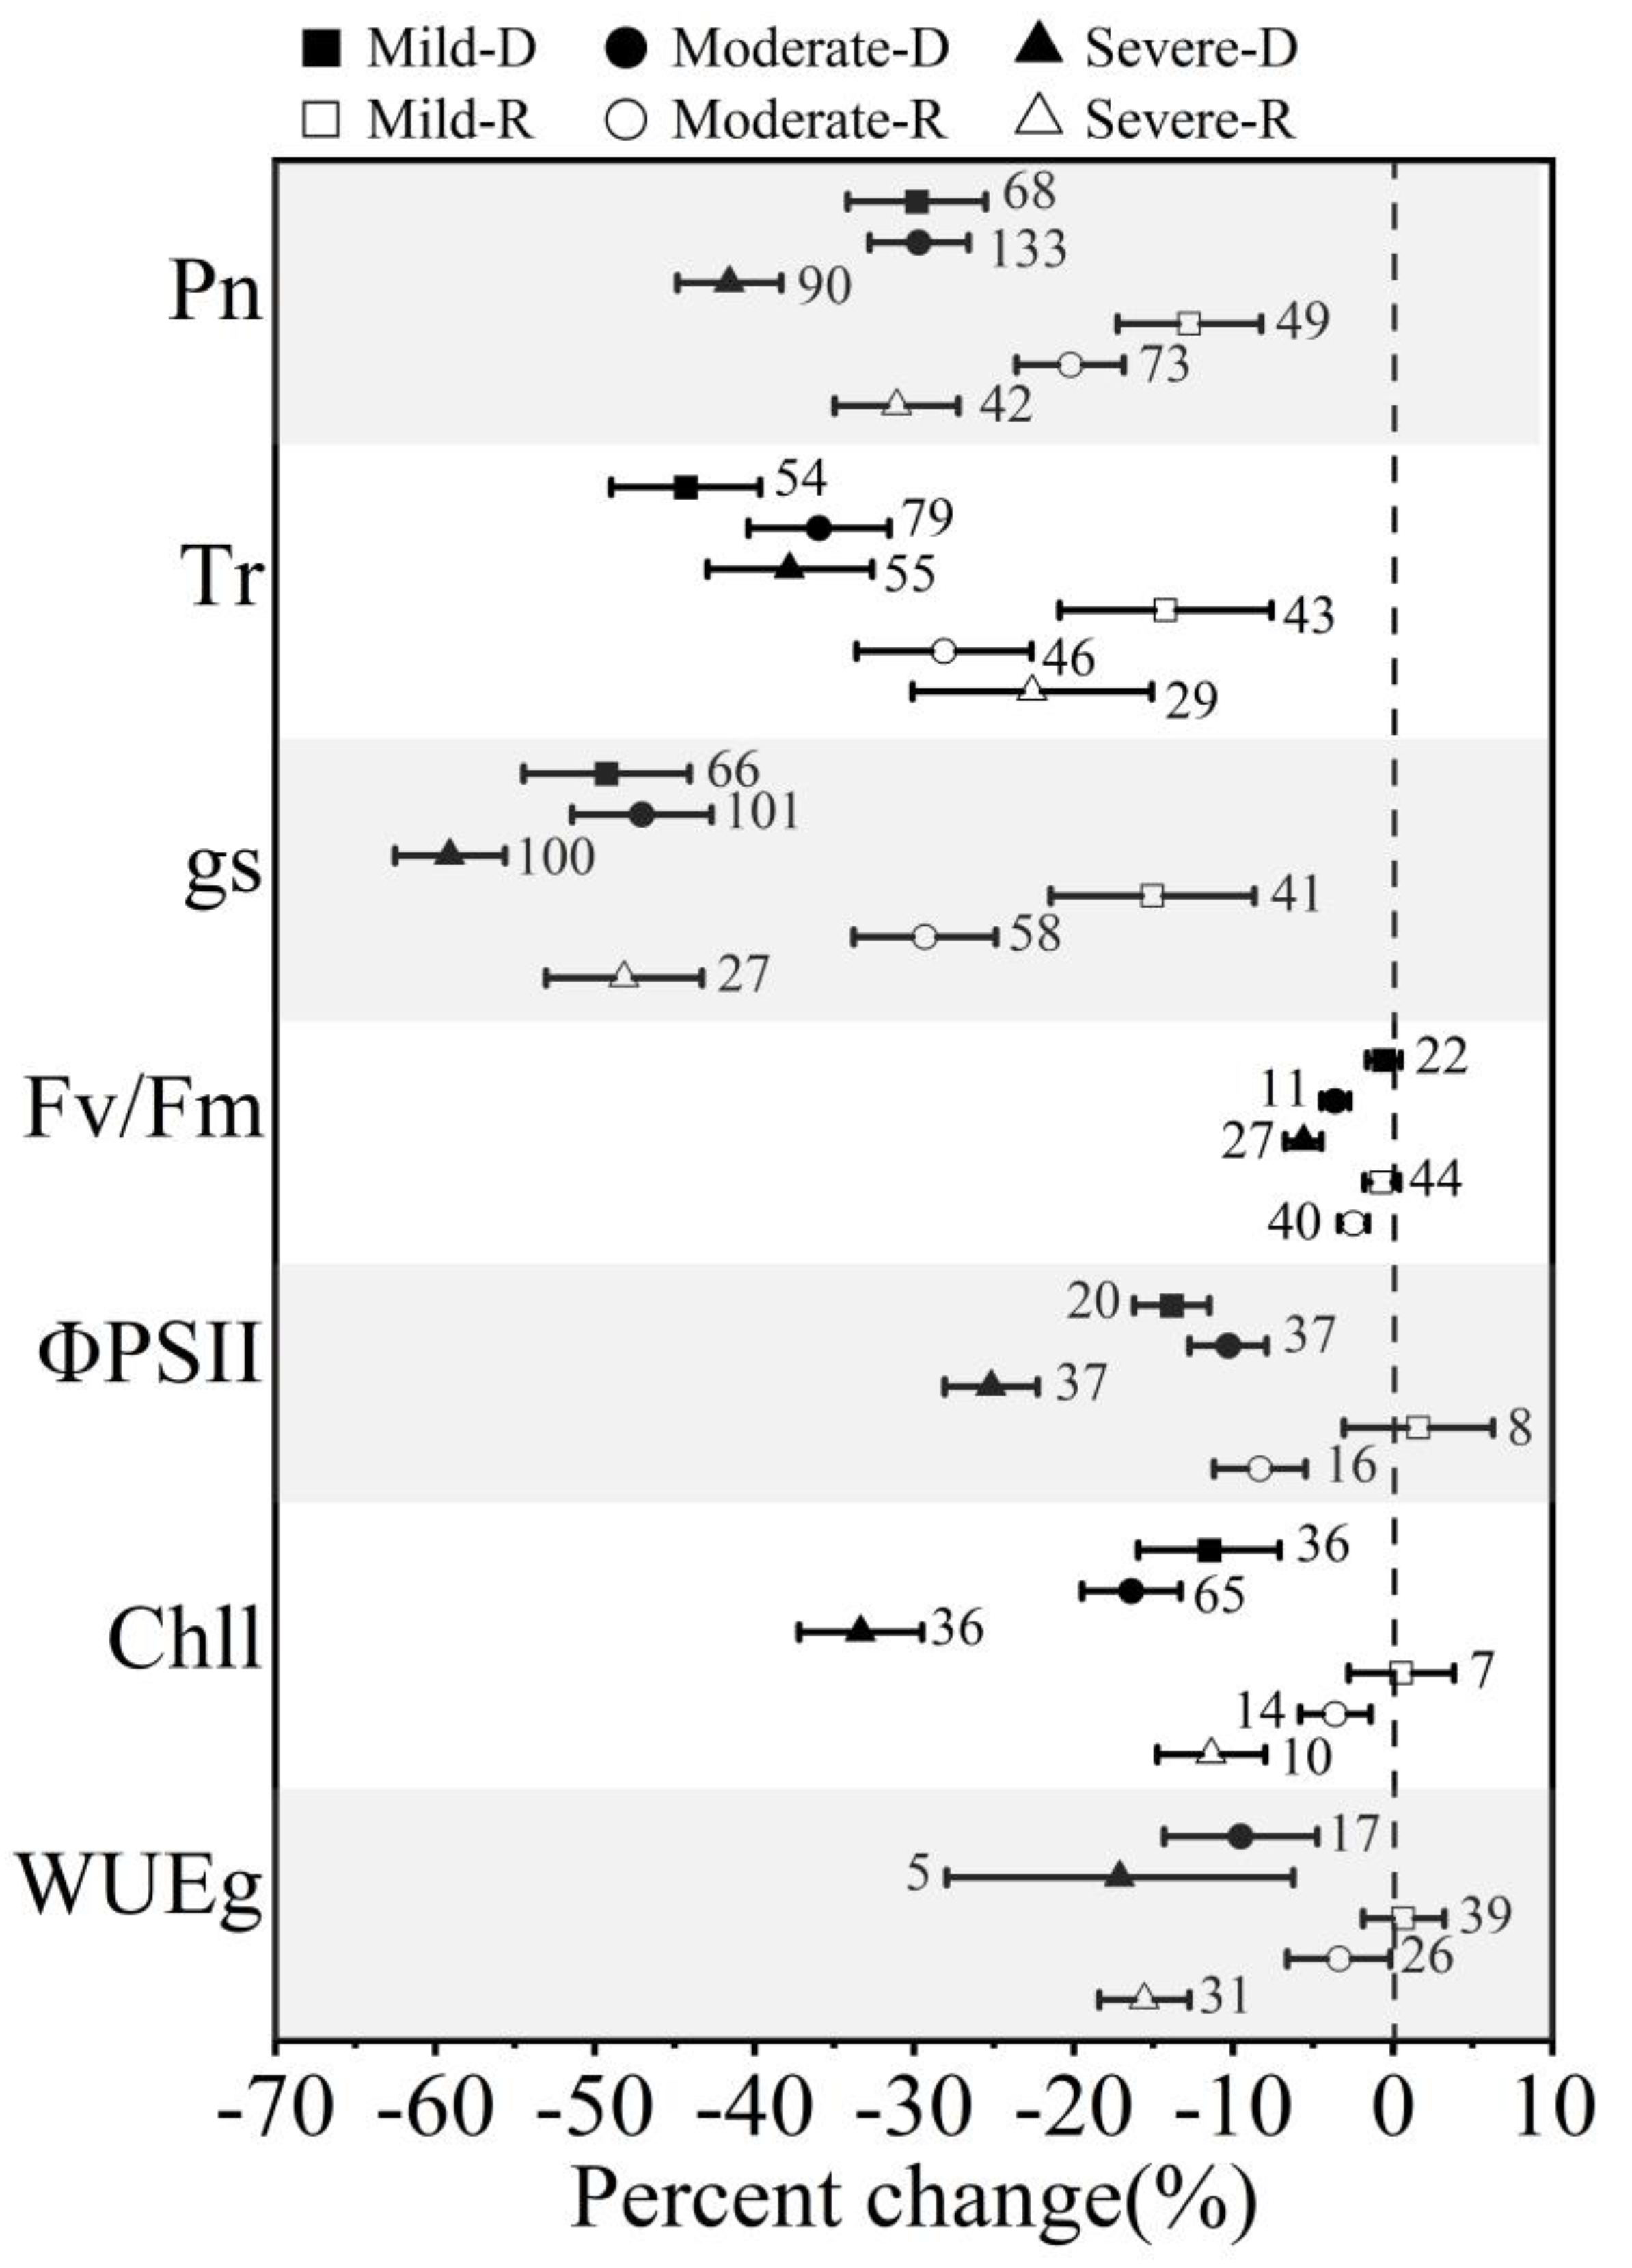
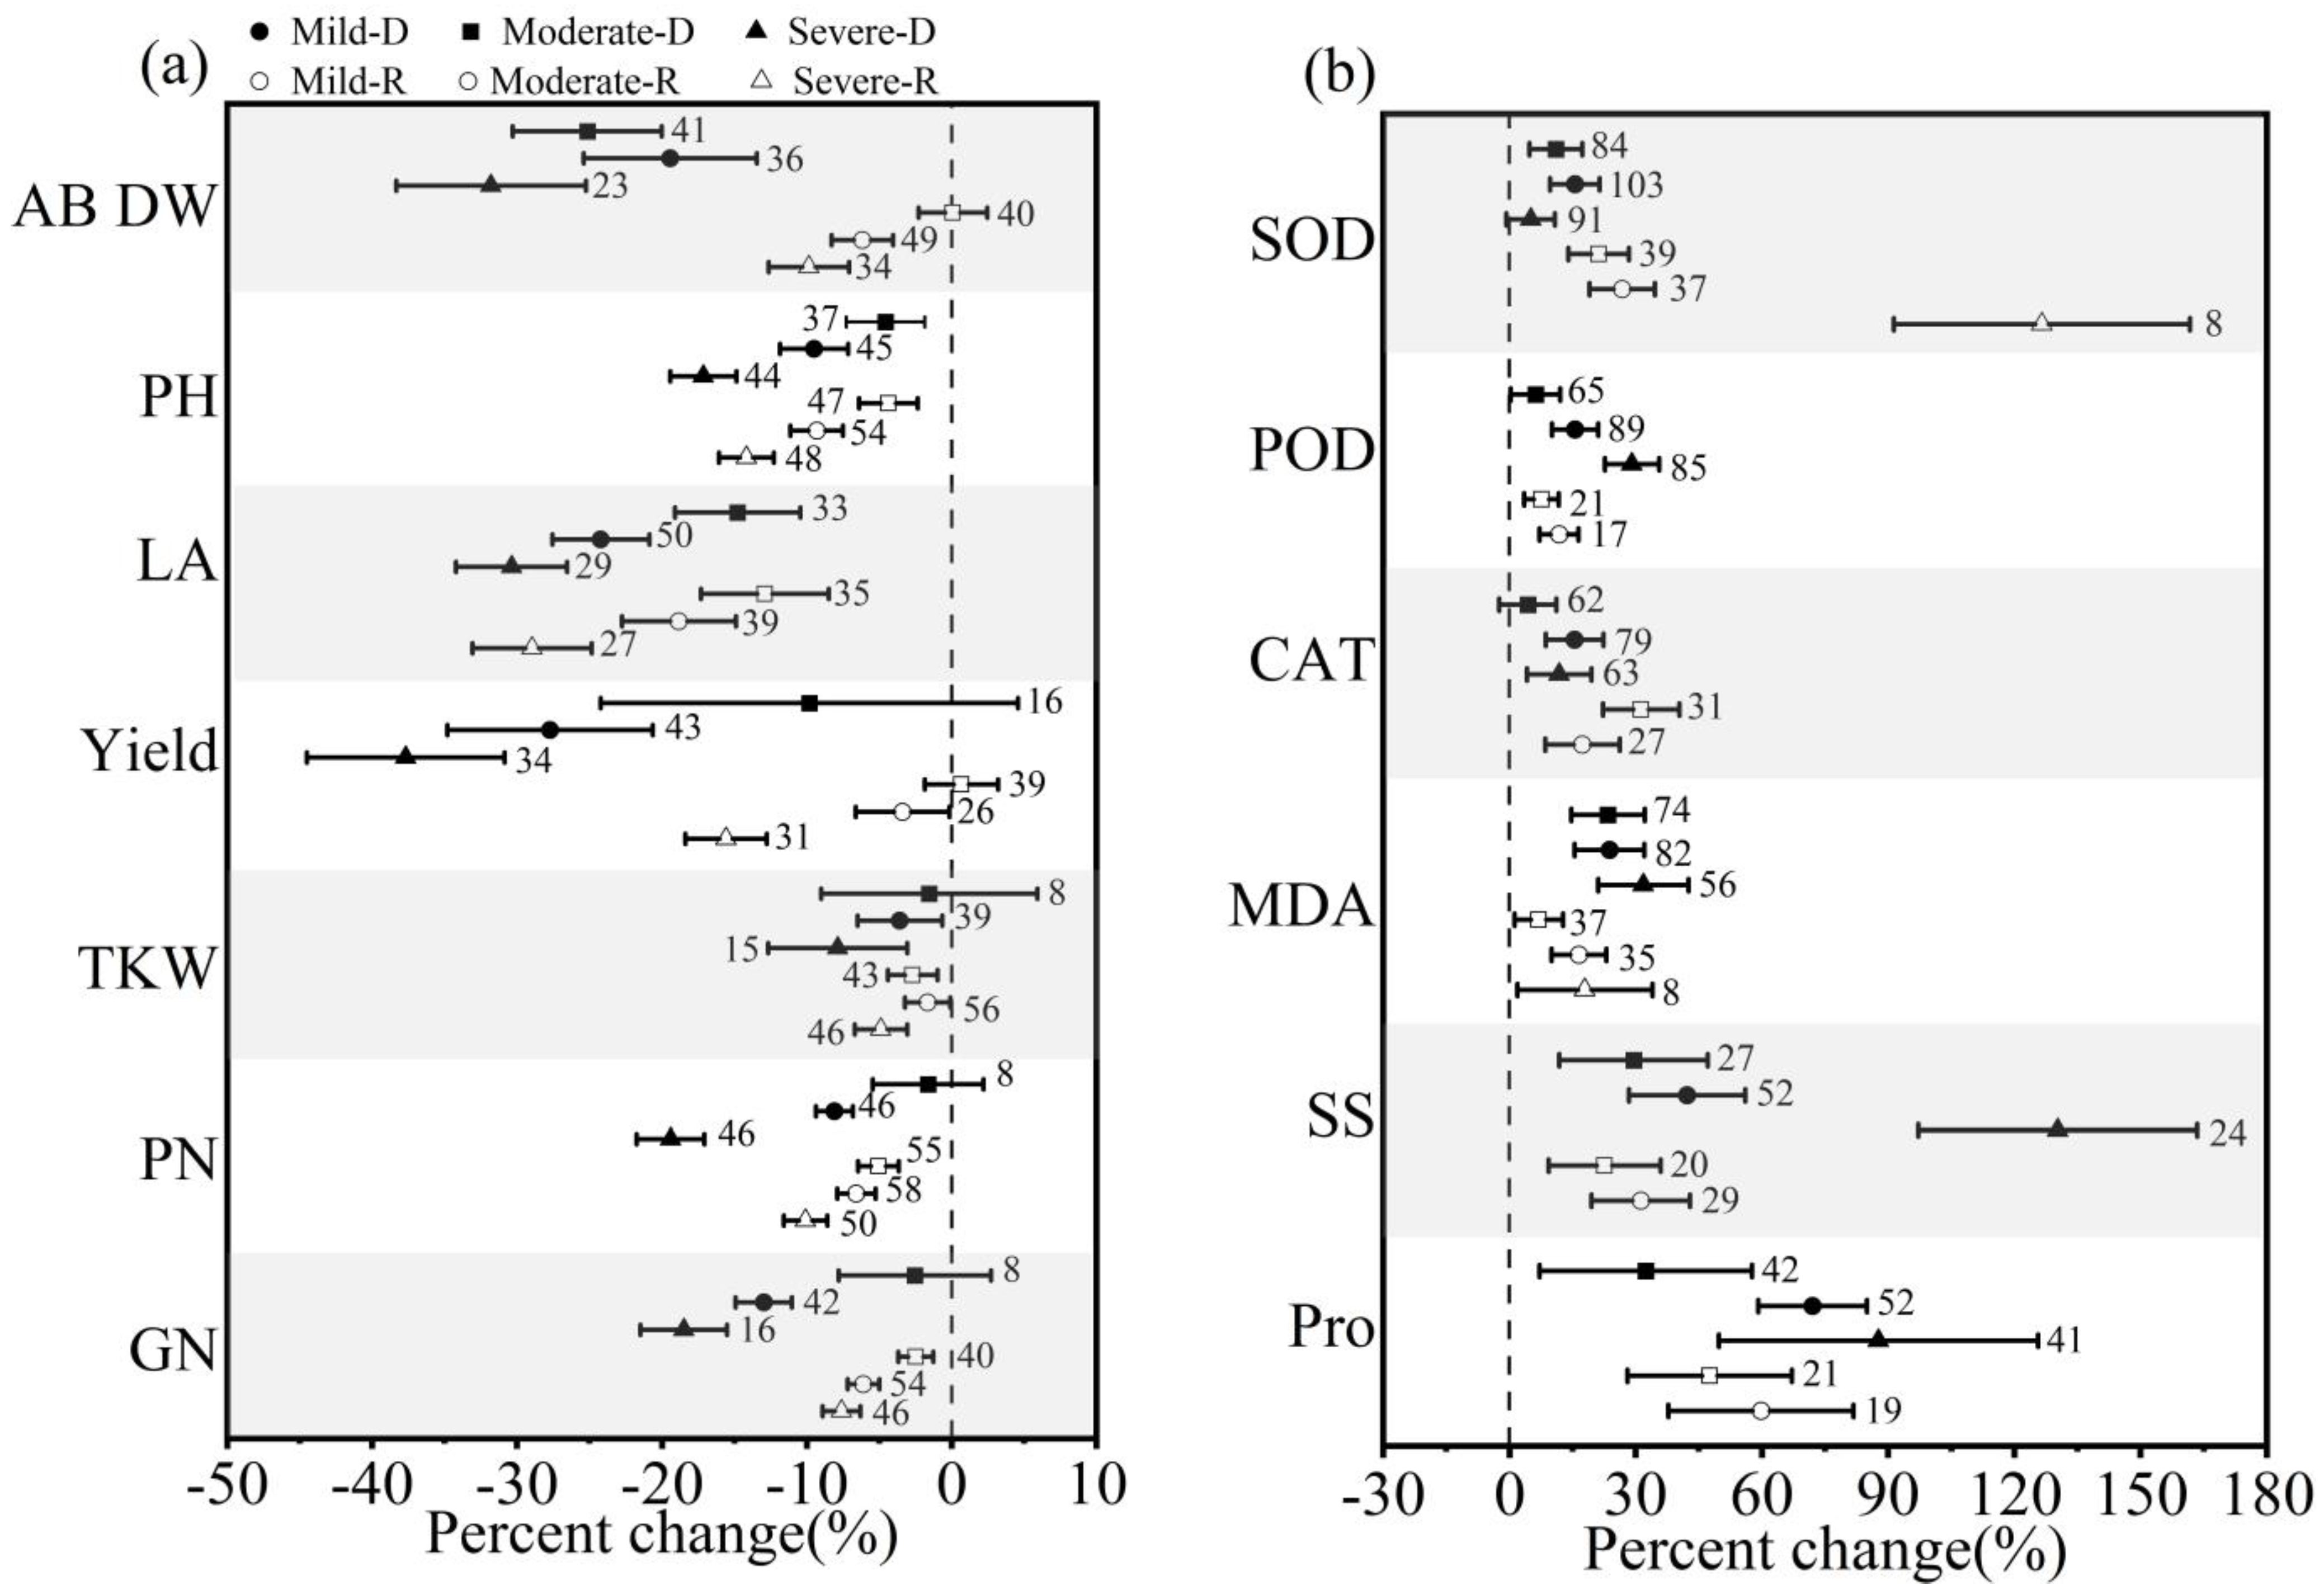
3.2. Effect of Stress Intensities on Winter Wheat in Response to Drought and Postdrought Rewatering

As the intensity of stress increased, the detrimental effects of drought on winter wheat gradually increased, while the ability to recover from rewatering of various physiological processes deteriorated (Figure 3 and Figure 4). For Pn, gs, ΦPSII, and Chll, there was no significant difference between mild stress and moderate stress (Figure 3). When the intensity increased to severe, the decreases in Pn (−41.6%, CI: −44.8% to −38.3%), gs (−59.0%, CI: −62.5% to −55.6%), ΦPSII (−25.1%, CI: −28.1% to −22.2%), and Chll (−33.3%, CI: −37.2% to −29.5%) increased sharply (Figure 3). Notably, Tr exposure to mild stress (−44.3%, CI: −49.0% to −40.0%) showed a slightly greater reduction than moderate (−36.0%, CI: −40.4% to −39.3%) and severe stress (−37.8%, CI: −42.9% to −32.6%). After rewatering, there were significant differences between Pn, Tr, gs, and those of the corresponding stress period, which indicated that Pn, Tr, and gs had stronger recovery ability, especially after mild stress. Under any intensity of drought stress, Chll after rewatering can produce extremely significant differences from the stress period. The effect of the arbitrary stress intensity on ΦPSII was much higher than the effect on Fv/Fm. Fv/Fm was not significantly different from the control under mild stress, and the degree of unfavorable effects from moderate and severe stress was less. Additionally, ΦPSII, Chll, and WUEg have the ability to recover to the control level after rewatering under mild stress.
Different intensities of stress led to a sharp decrease in aboveground dry matter, and after rewatering the aboveground dry matter of each group had significantly increased from that of the stress period (Figure 4a). It is worth mentioning that postdrought rewatering of mild drought made the aboveground dry matter restore to the level of the control group. In stark contrast, leaf area and plant height of winter wheat recovered poorly after rewatering. Mild stress failed to bring about a significant reduction in yield and yield components. However, moderate and severe drought stress resulted in a sharp reduction in yield (−27.7%, CI: −34.8% to −20.6%; −37.7%, CI: −44.5% to −30.8%), PN (−8.1%, CI: −9.4% to −6.8%; −19.4%, CI: −21.7% to −17.1%), and GN (−13.0%, CI: −14.9% to −11.0%; −18.5%, CI: −21.5% to −15.5%). Postrewatering had a significant effect on yield, so that it was equal to that obtained under normal irrigation.
Drought stress stimulated the enzyme activities of SOD, POD, and CAT. As shown in Figure 4b, the changes in SOD and CAT were synchronized: with the increase in the stress intensity, both showed a trend of increasing and then decreasing. The maximum values of SOD (15.6%, CI: 9.7% to 21.4%) and CAT (15.5%, CI: 8.6% to 22.3%) appeared in the moderate-stress group. Not only that, SOD and CAT still had a tendency to increase after rewatering. There was no significant difference between POD and control levels under mild stress. After rewatering, POD did not significantly differ from drought. MDA varied little between mild stress (23.4%, CI: 14.6% to 32.2%) and moderate stress (23.8%, CI: 15.5% to 32.0%), with a slight increase in severe stress (31.8%, CI: 21.1% to 42.6%). After rewatering, there was a slight easing of MDA. Drought stress caused a sharp increase in SS and Pro accumulation, corresponding to the intensity of drought. Among them, SS increased up to 130.3% (CI: 97.2% to 163.4%) under severe stress. After the restoration of water supply, a decrease in SS and Pro content occurred. It is evident that antioxidant protective enzymes and osmoregulatory substances in winter wheat leaves are reversible under certain drought-rewatering conditions.

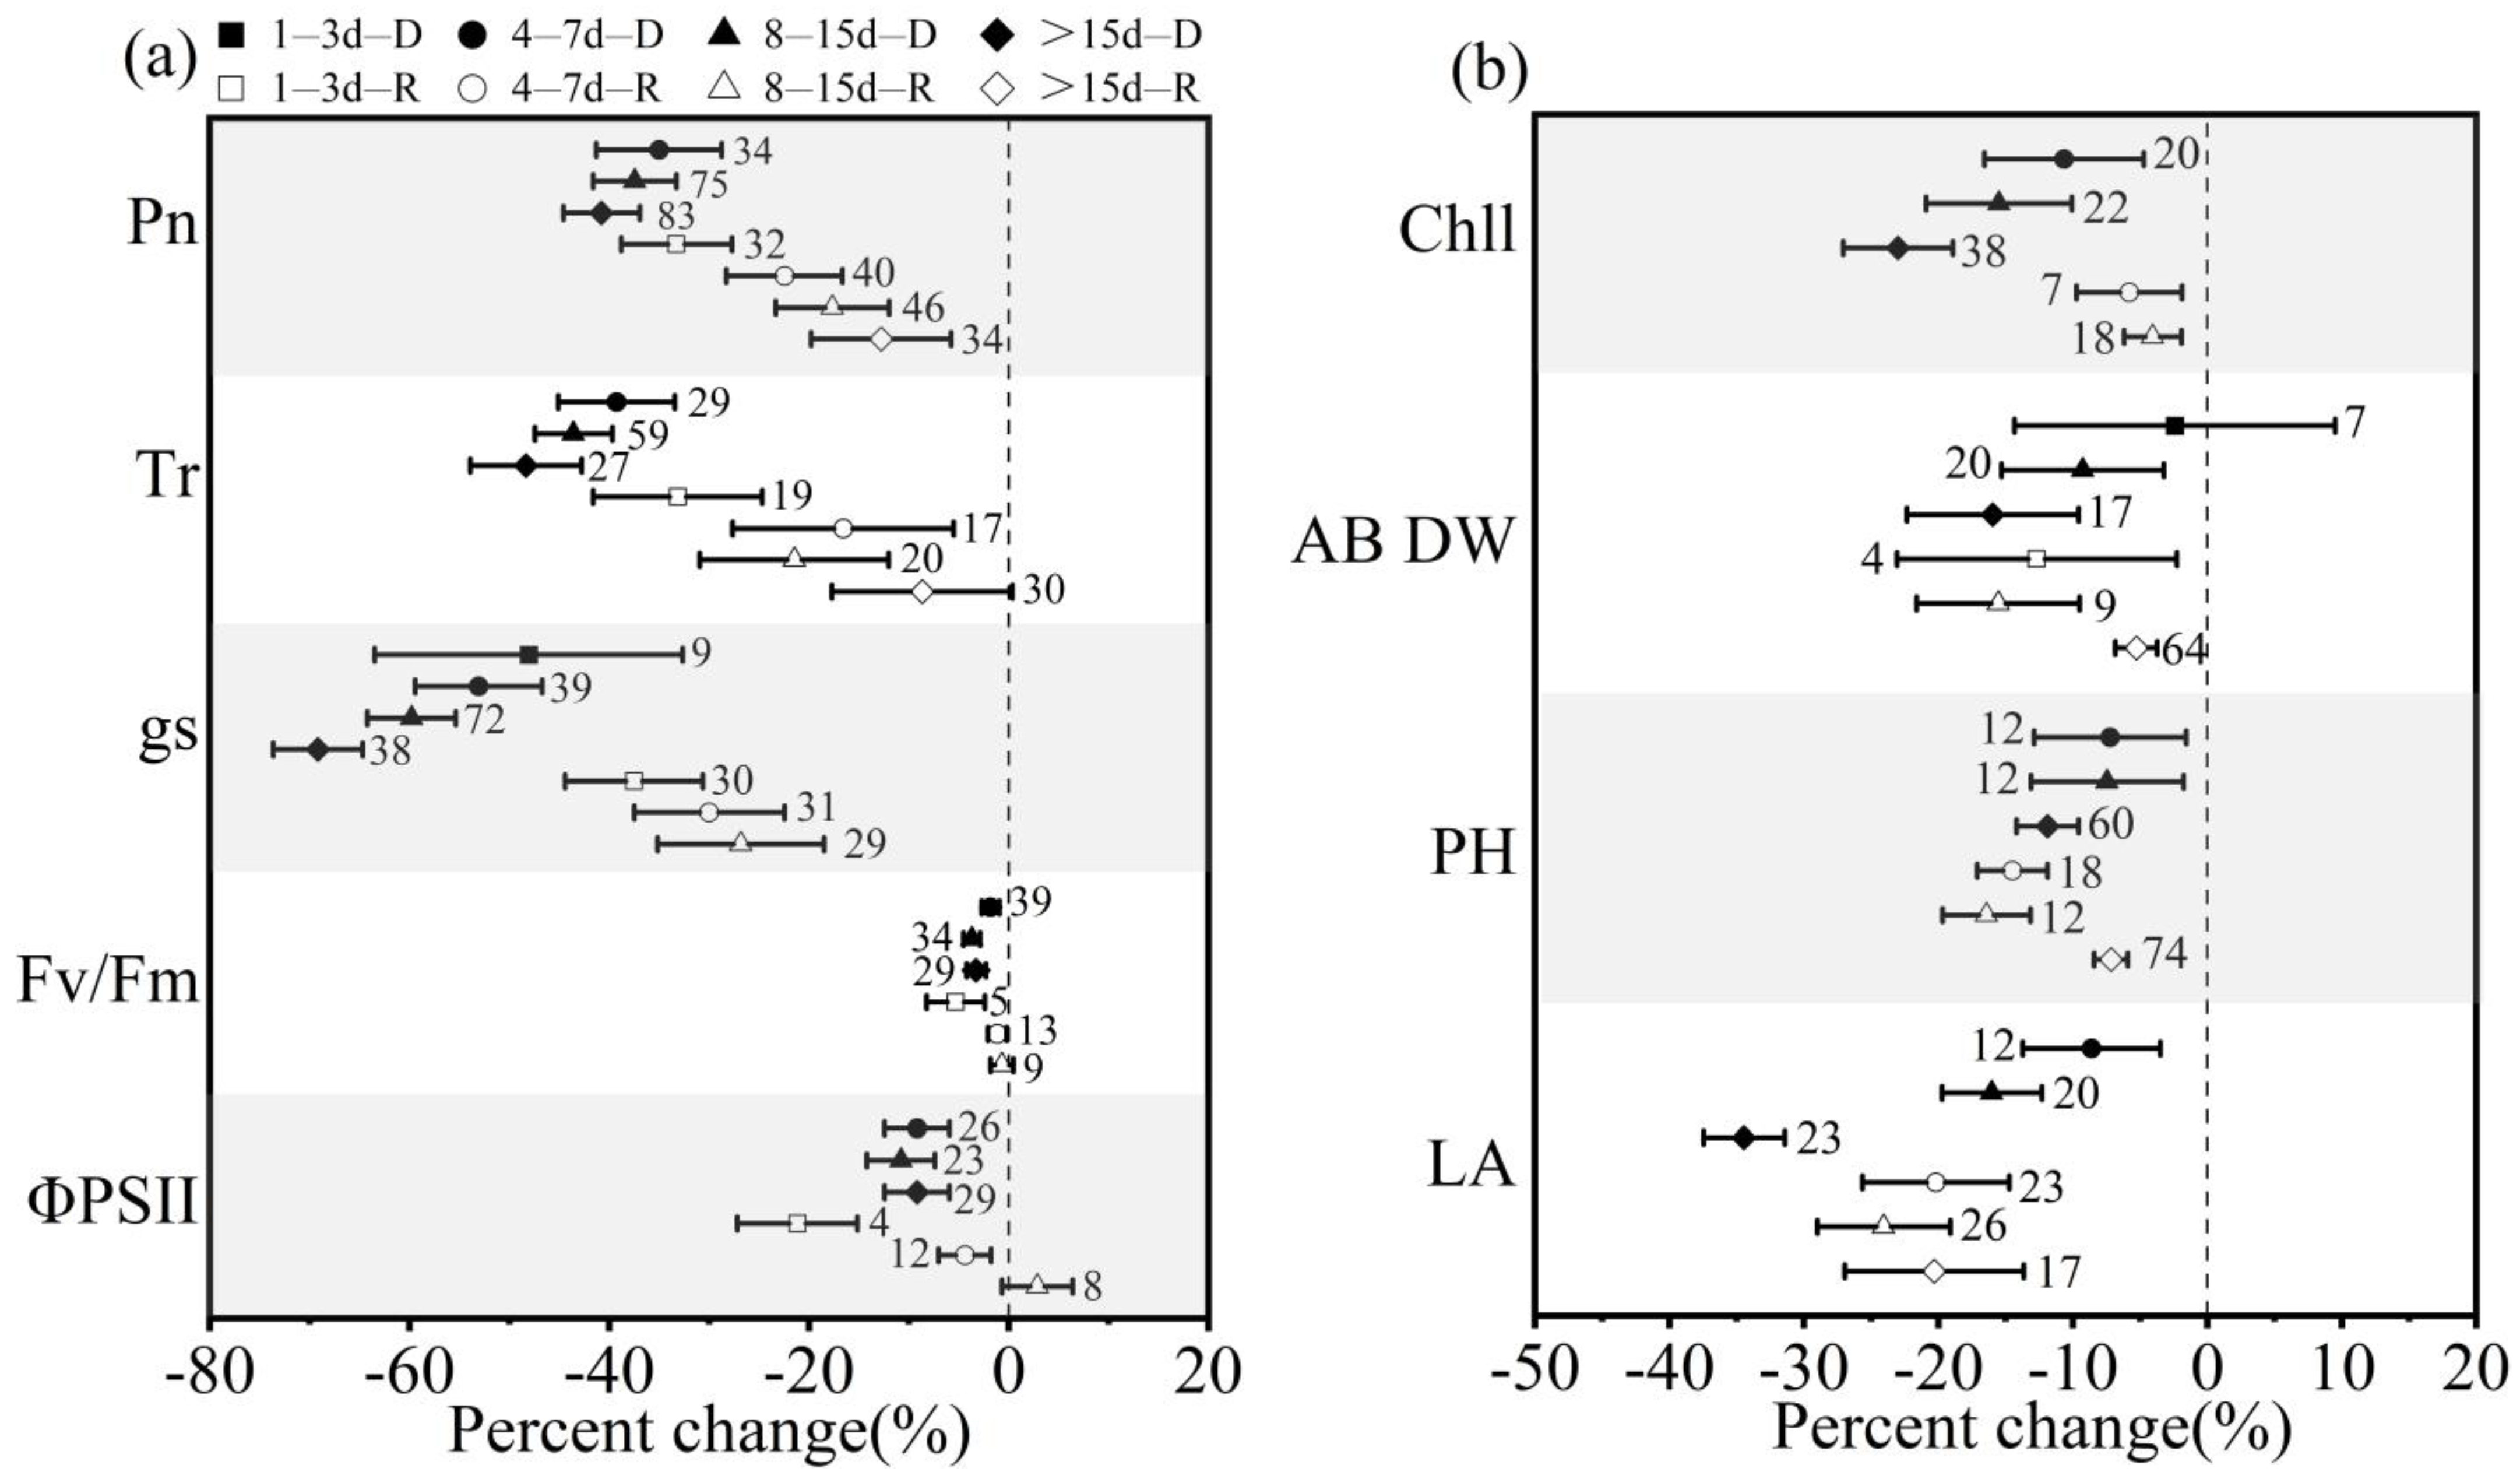
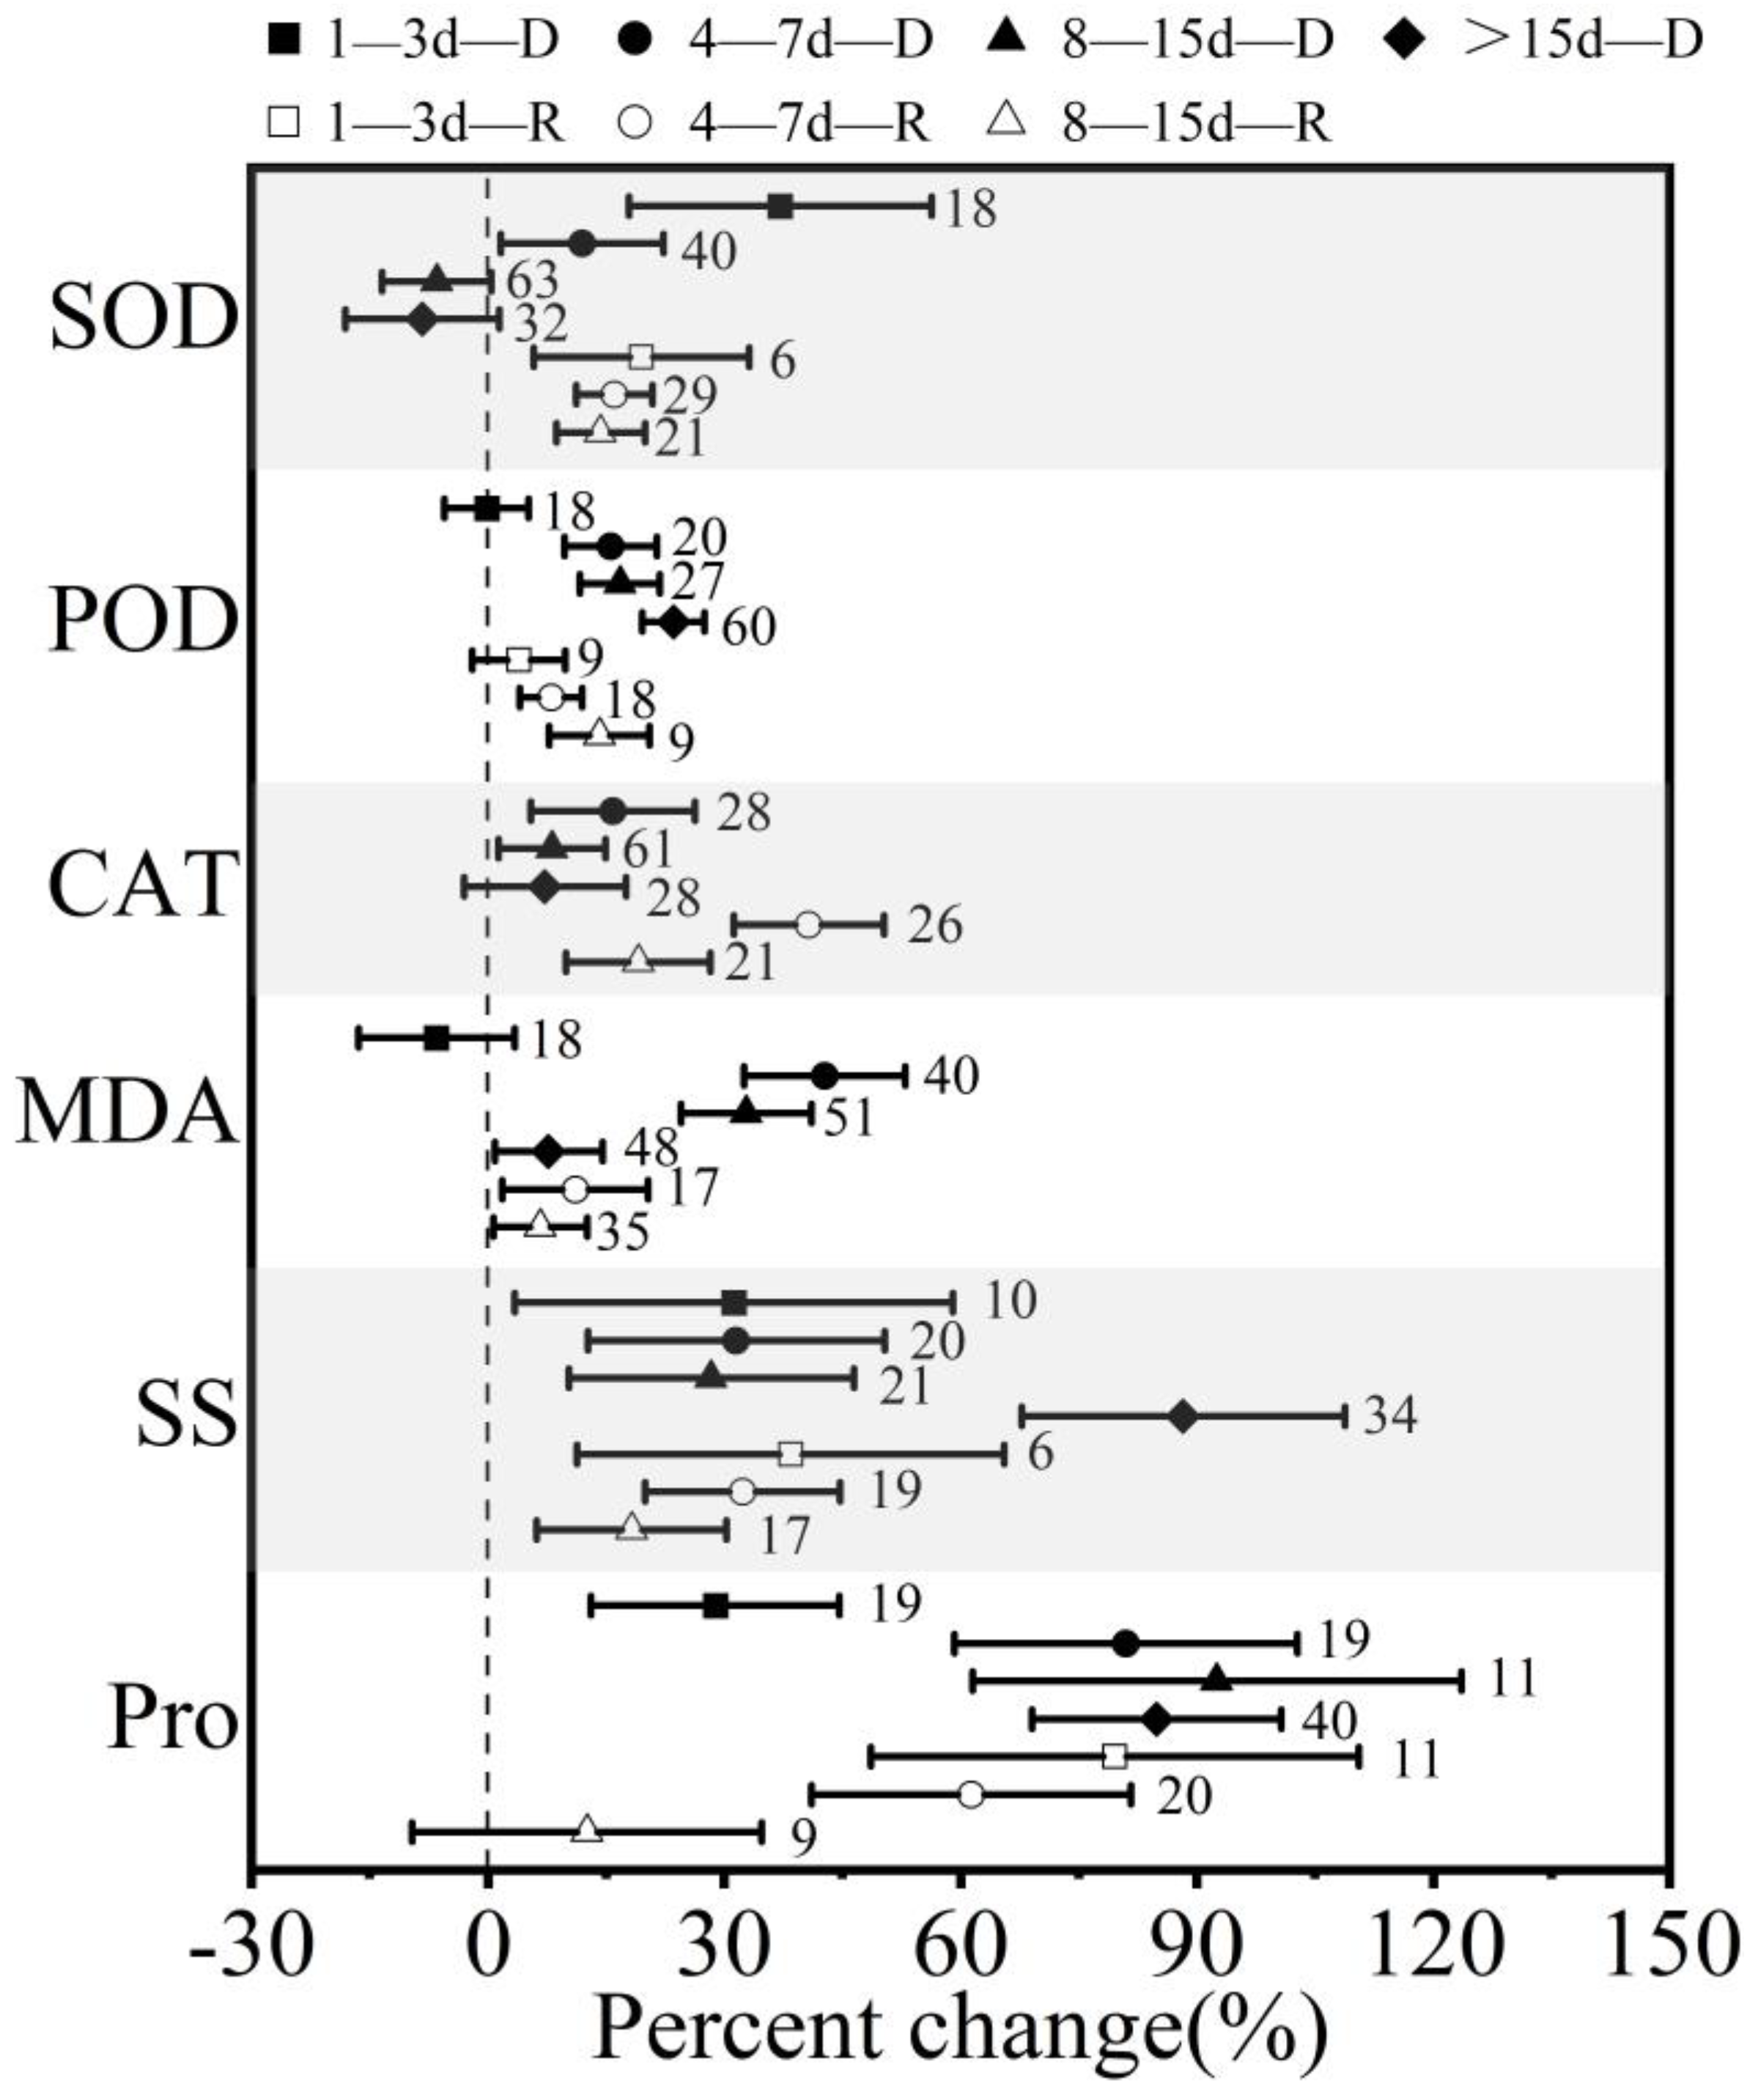
3.3. Effect of Drought (Rewatering) Treatment Durations on Winter Wheat in Response to Drought and Postdrought Rewatering

Overall, adverse effects on winter wheat increased with the duration of stress. In addition, the longer the duration of rewatering, the greater the degree of recovery of winter wheat (Figure 5 and Figure 6). With the increase in stress time, Pn, Tr, and gs continuously decreased (Figure 5a). Pn, Tr, and gs showed an overall increasing trend with the duration of rewatering treatments, but they all failed to recover to the control level within 15 days of rewatering. It might be due to insufficient time for rewatering, or the photosynthetic organs might have been damaged and destroyed during drought stress and could not be fully recovered.
Fv/Fm remained unaffected under any groups. The changes in ΦPSII under different stress durations were insignificant. However, rewatering can significantly promote the recovery of ΦPSII with the passage of time.
Chlorophyll content, aboveground dry matter, plant height, and leaf area were negatively affected by drought stress with increasing stress duration (Figure 5b). Chlorophyll content tended to recover with increasing rewatering time. Above-ground dry matter did not change significantly during 1–3 days of drought stress and showed a tendency to decrease and then increase after rewatering. Leaf area increases observed with the time of rewatering were not considerably different. Rewatering increased plant height significantly when rehydrated 15 days later.
SOD and CAT showed the same trend of increasing and then decreasing with the time of stress. The activity of SOD (37.1%, CI: 17.9 to 56.3%) was significantly higher than that of the control under 1–3 days of stress and then began to decrease gradually (Figure 6). After rewatering, SOD and CAT decreased with the increase in rewatering time, but their values were still higher than those of the control group in 8–15 days of rewatering, which showed that winter wheat could still maintain high antioxidant enzyme activities after the stress was lifted.
POD did not differ significantly from the control group at 1–3 days of stress, but with the increase in stress time, POD continued to rise, and the rise could reach 23.6% (CI: 19.6% to 27.5%) after greater than 15 days of stress. Within 1–15 days of rewatering, POD still had a weak tendency to rise. MDA showed an increase followed by a decrease with the passage of stress time. MDA was not significantly different from the control at 1–3 days of stress, and it can reach a maximum (42.8%, CI: 32.5% to 53.0%) at 4–7 days. With the increase in rewatering time, MDA gradually reduced. SS and Pro increased gradually with stress duration increasing. The effect of stress duration on SS was weaker than that of Pro. SS and Pro were inversely correlated with the duration of rewatering, where Pro could return to the control level at 8–15 days of rewatering.

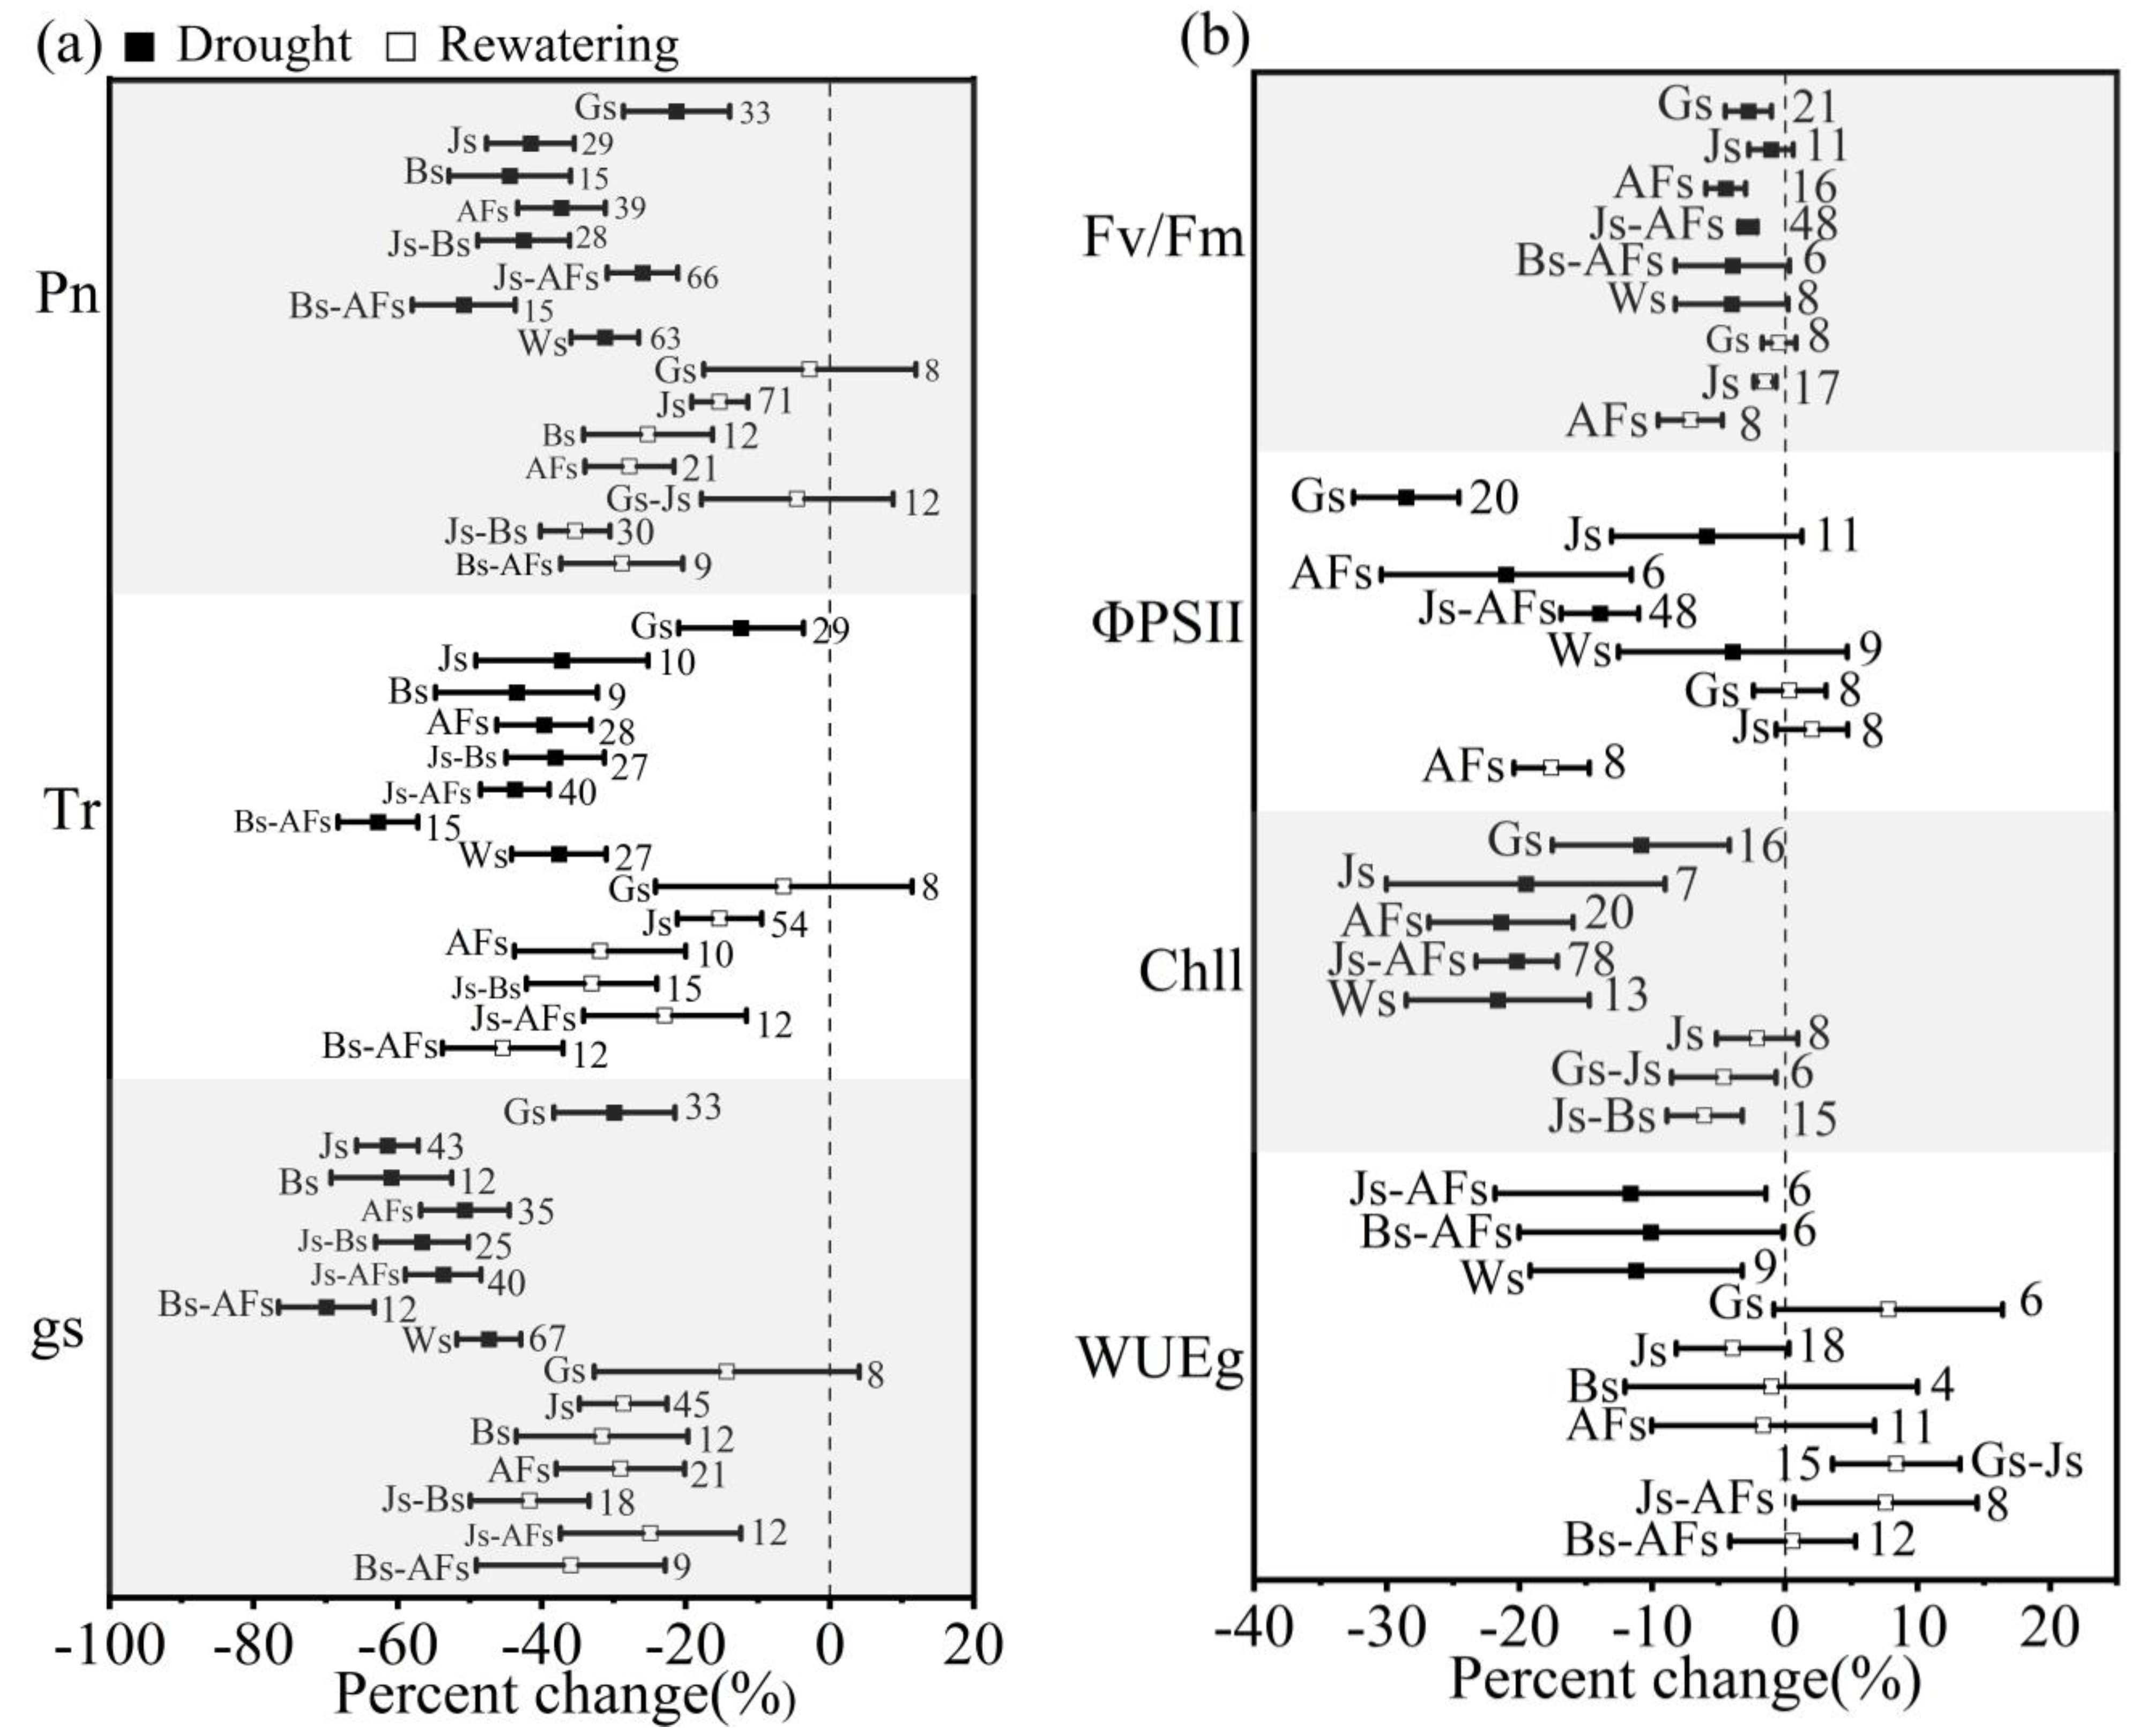
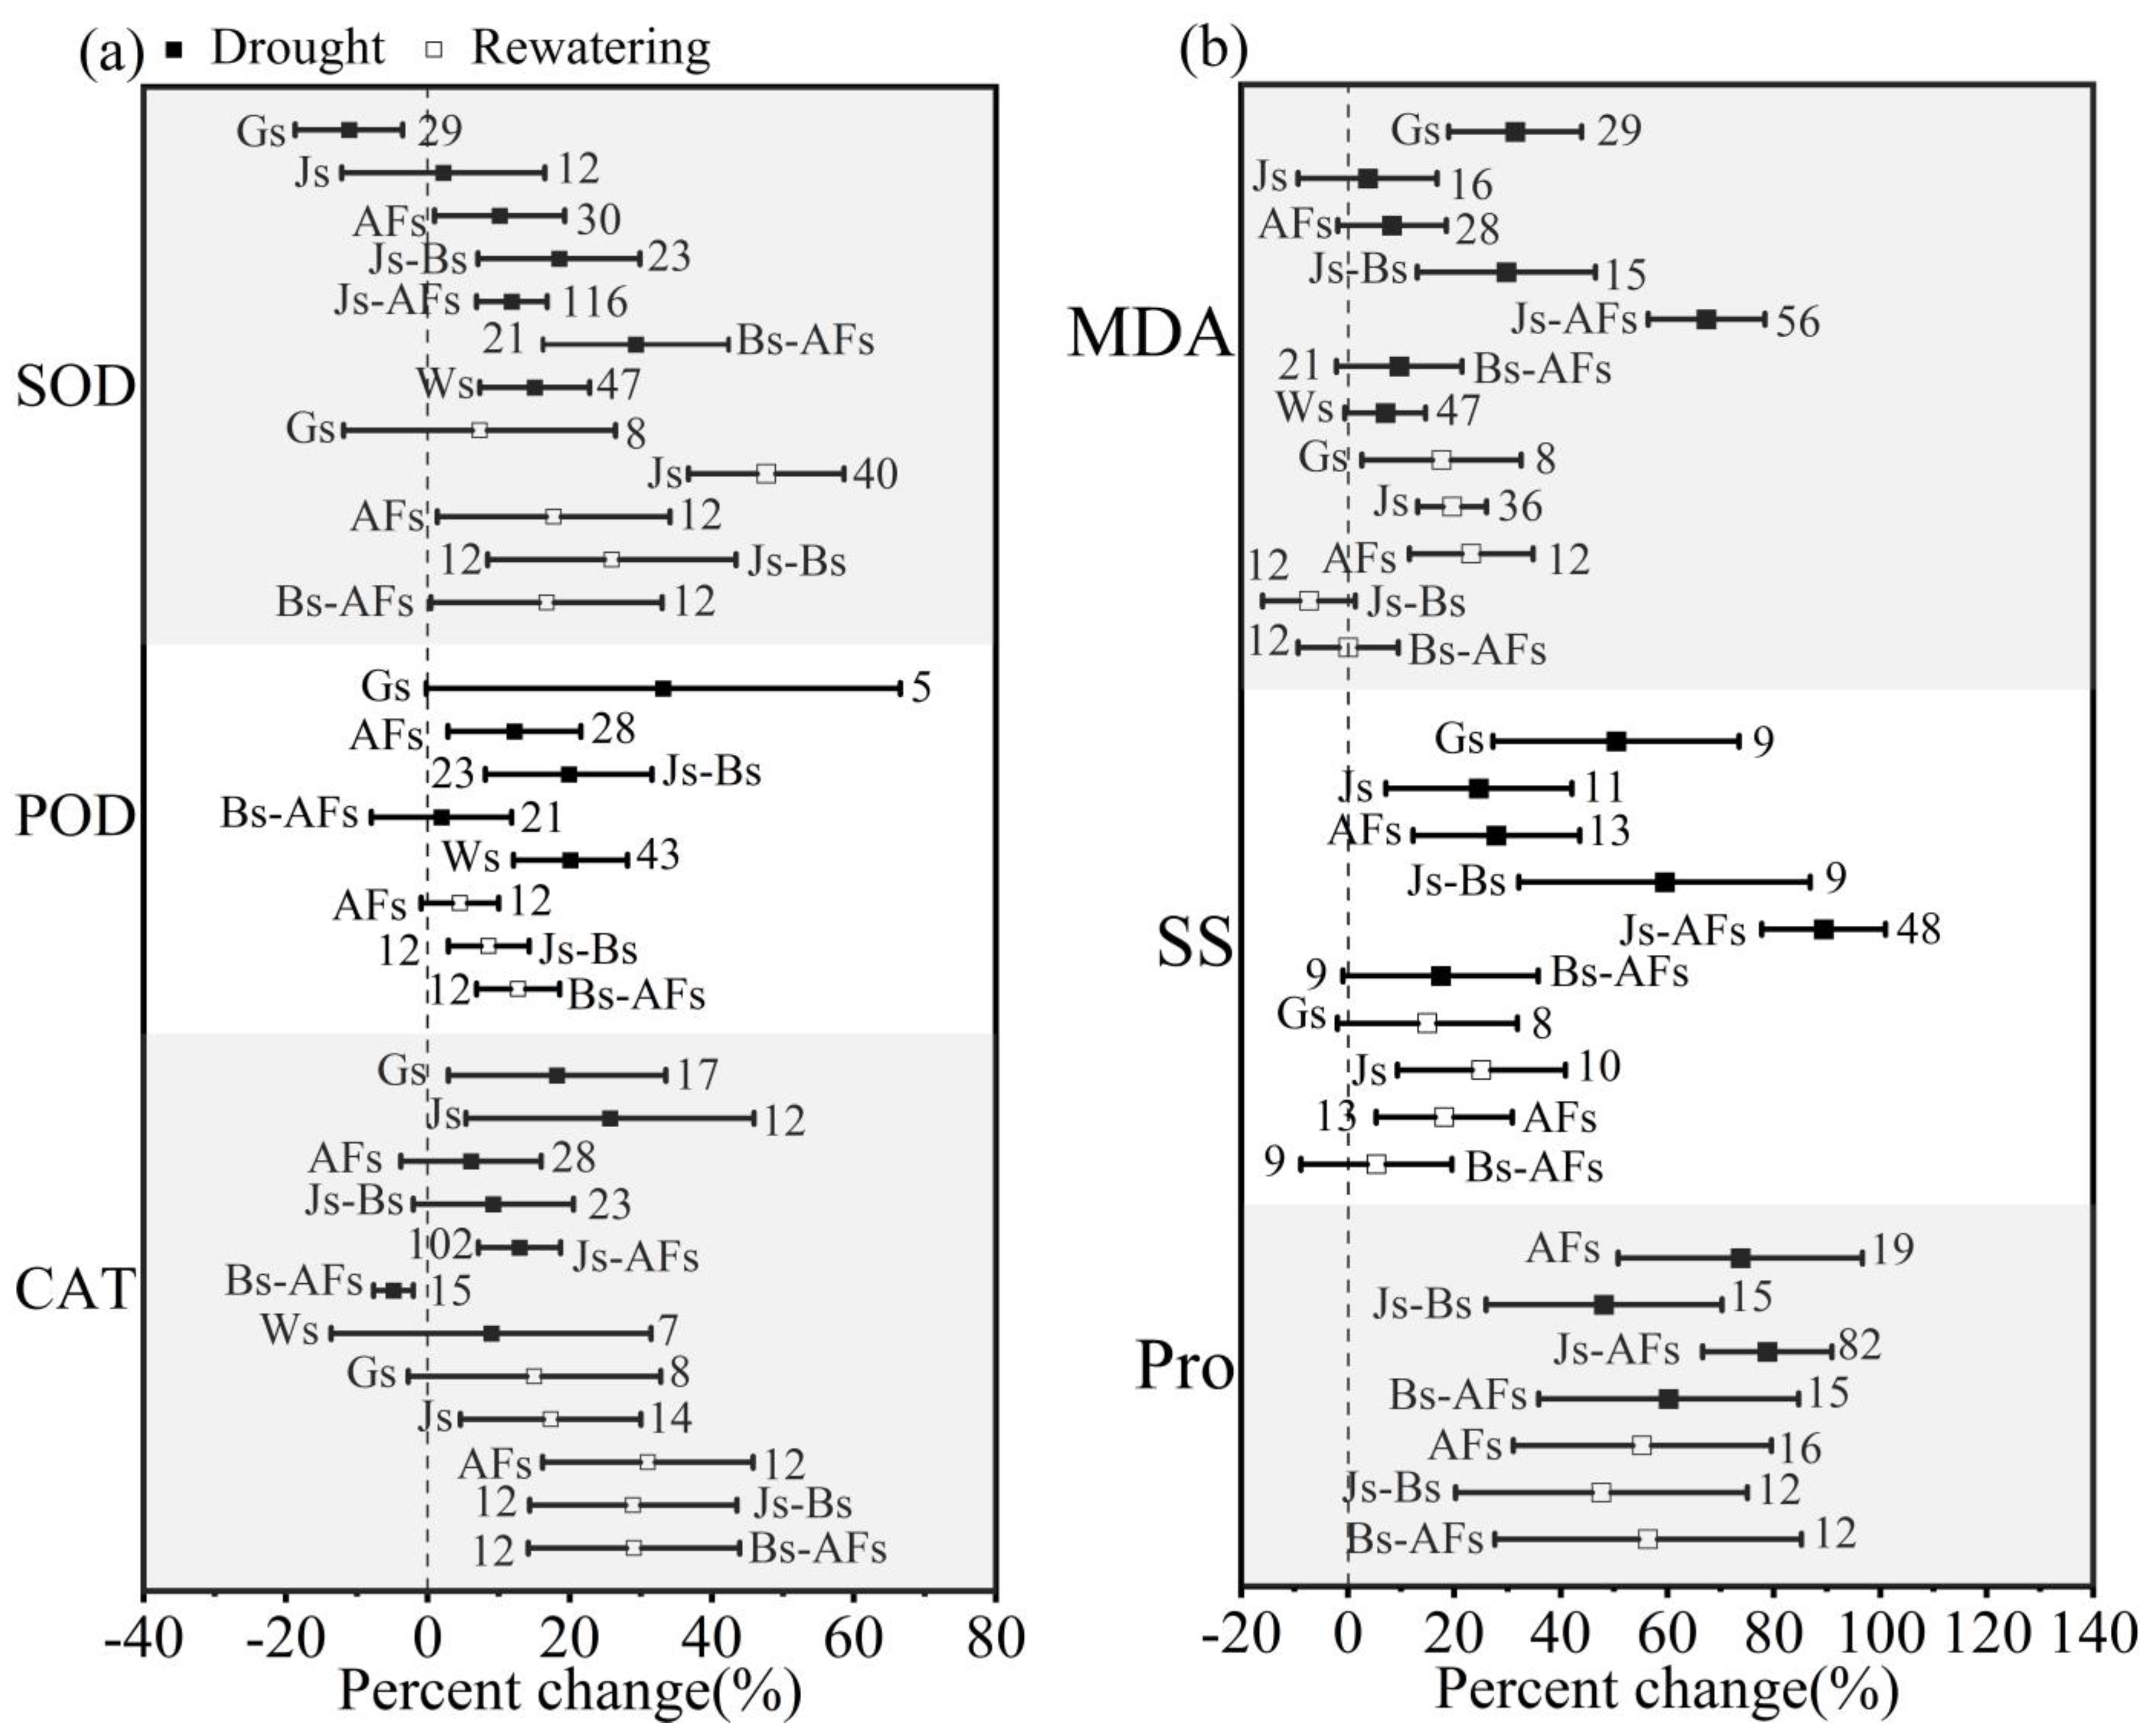
3.4. Effect of Growth Stages on Winter Wheat in Response to Drought and Postdrought Rewatering

Most variables of winter wheat also varied with different growth stages (Figure 7, Figure 8 and Figure 9). From Figure 7a, it is worth mentioning that the changing trends of Pn, Tr, and gs are similar under the influence of different growth stages. Gs drought had the least negative effects on Pn (−21.3%, CI: −28.7% to −13.9%), Tr (−12.3%, CI: −21.0% to −3.8%), and gs (−30.0%, CI: −38.4% to −21.5%), respectively. In addition, they could be equal to the control level after postdrought rewatering of Gs drought. Bs-AFs drought caused the greatest reduction in Pn (−50.8%, CI: −58.0% to −43.7%), Tr (−62.7%, CI: −68.3% to −57.2%), and gs (−69.9%, CI: −76.5% to −63.2%), respectively. The occurrence of drought stress at any stage had a smaller effect on Fv/Fm (Figure 7b). Gs and AFs drought resulted in the largest changes in ΦPSII of −28.6% (CI: −32.5% to −24.6%) and −21.0% (CI: −30.4% to −11.6%), respectively. Meanwhile, the decreases in ΦPSII caused by Gs and Js drought can be offset by postdrought rewatering. Gs drought decreased Chll less than other stage drought and postdrought rewatering of Js drought can promote Chll to recover to the control level. The WUEg decreases in different growth stages were similar, and the WUEg can recover to the control level after any stage of stress relief. In addition, postdrought rewatering of Gs-Js and Js-AFs drought could make WUEg have an overcompensation effect, with increases of 8.4% (CI: 3.6% to 13.2%) and 7.6% (CI: 0.7% to 14.5%), respectively.
As can be seen in Figure 8a, the Gs drought decreased the aboveground dry matter significantly compared to other stages, with a decrease of −50.9% (CI: −56.4% to −45.1%). Normal growth and development of winter wheat were significantly affected when continuous water stress was carried out during the nutritive growth stage. The effects of drought stress occurring before (and including) the jointing stage on plant height and leaf area reached significant levels, with Js-AFs drought having the greatest effect on plant height (−18.3%, CI: −23.3% to −13.3%) and leaf area (−37.4%, CI: −43.1% to −31.7%). Conversely, the decreases in PH were small under Bs, Afs, and BS-Afs drought, with in the case of Bs-Afs drought, leaf area (−12.9%, CI: −21.8% to −4.0%) decreased the least. Js-AFs drought had significant yield decreasing effects in winter wheat (−41.9%, CI: −53.7% to −30.0%) (Figure 8b). TKW (−9.8%, CI: −13.2% to −6.4%), PN (−9.0%, CI: −11.2% to −6.8%) and GN (−13.7%, CI: −17.0% to −10.3%) were most affected by Js-Afs drought. Under single-stage drought stress, PN and GN were more affected by the anthesis-filling stage than the other stages. Postdrought rewatering of Gs drought restored yield and PN to the control level, causing TKW and GN to exceed the control level inversely. The compensation paths for yield differed among growth stages and could be analyzed by three indicators: PN, GN, and TKW, respectively. It is worth mentioning that postdrought rewatering of Gs-Js drought and Js-Bs drought led to increases of 8.5% (CI: 3.9% to 13.1%) and 10.8% (CI: 7.0% to 14.7%) in TKW, with overcompensation. In addition, postdrought rewatering of AFs drought and Bs-AFs made GN no different from the control level.
SOD (−11.1%, CI: −18.7% to −3.5%) was significantly lower than the control level under Gs drought (Figure 9a). Js drought did not impose a significant effect on SOD. However, SOD was improved significantly by other stage stress. The maximum increment of SOD was 29.3% (CI: 16.2% to 42.4%) under Bs-AFs drought. POD and CAT were higher than control levels under drought stress during most of the growth stages. The maximum increase in MDA (67.4%, CI: 56.4% to 78.3%) was observed under Js-AFs drought (Figure 9b). Postdrought rewatering of Js-Bs, Bs-AFs drought can make MDA restore to control level. The drought stress made a large amount of SS accumulate in the leaves, which Gs, Js-Bs, and Js-AFs drought increased the most compared with the control. As the stress was lifted, SS was rapidly transported out of the leaves and the content decreased, which showed that the recovery ability was strong. Pro was significantly increased after drought stress during different growth stages, and Pro had similar responses for different rewatering groups.

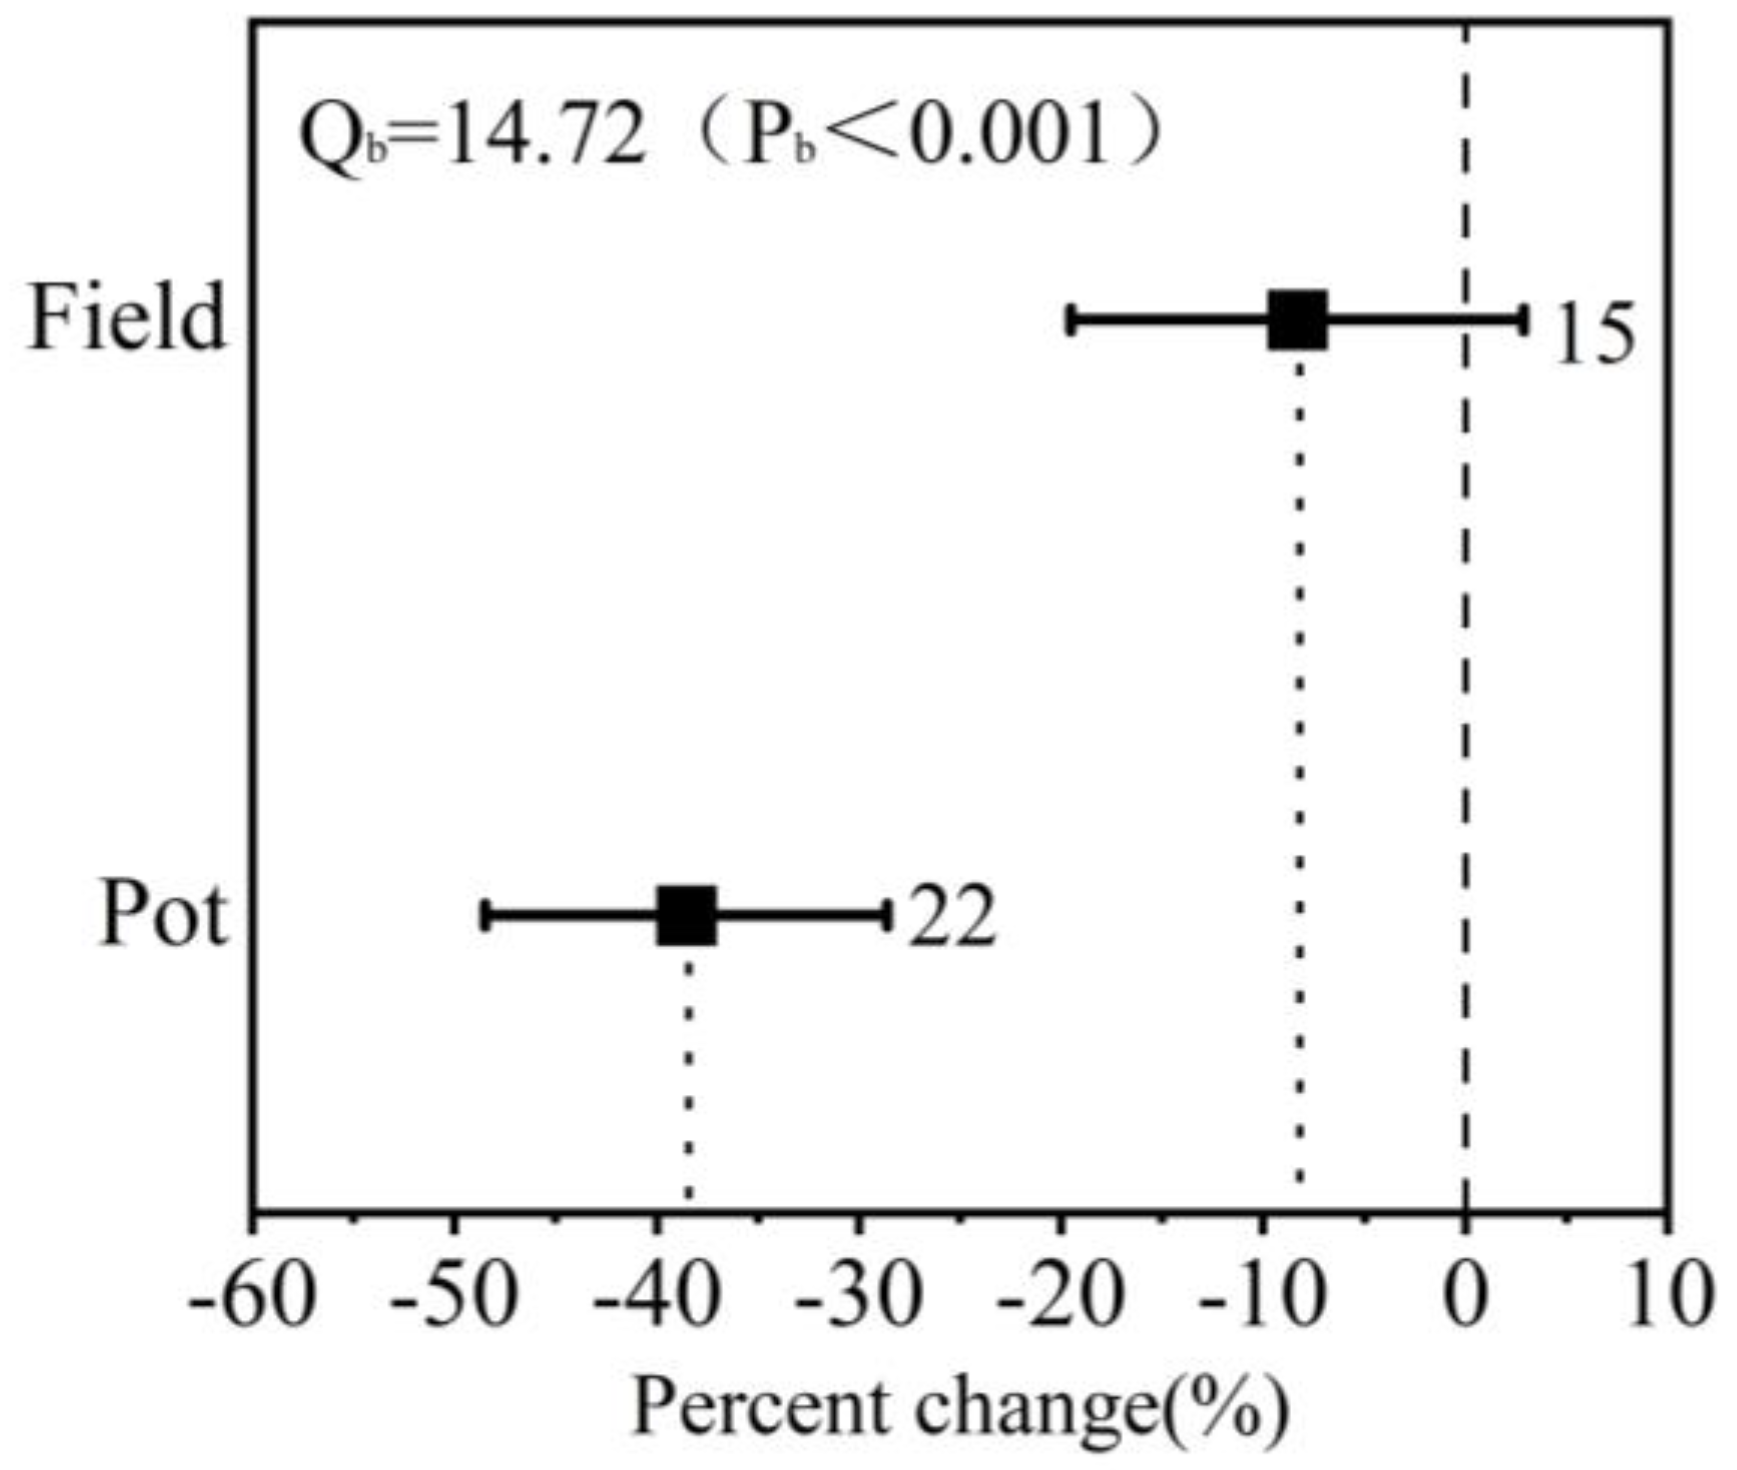
3.5. Effect of Planting Methods on Winter Wheat in Response to Drought and Postdrought Rewatering

From Figure 10, winter wheat grown in the field was less affected by drought stress than in the pot and recovered more from drought. Pn, Tr, gs, Fv/Fm, ΦPSII, WUEg, aboveground dry matter, and leaf area of pot-grown winter wheat decreased more than that of field-grown wheat (Figure 10a,b). After rewatering, Fv/Fm, ΦPSII, and WUEg of field-grown wheat could be restored to the control level. As can be seen from Figure 10b, drought stress under both planting methods (pot and field) had a significant effect on the yield of winter wheat, which was much greater in the pot (−34.5%, CI: −40.5% to −28.6%) than in the field (−25.1%, CI: −30.2% to −20.3%). Similarly, PN and GN were more affected by drought stress under pot planting. The difference in TKW due to drought stress under pot and field planting was not significant, with percentage changes of −4.5% (CI: −10.1% to −1.0%) and −4.4% (CI: −7.3% to −1.6%), respectively. TKW, PN, and GN of winter wheat planted in the field during the postdrought rewatering period could be recovered to near the level of the control group. The increases in SOD, POD, CAT, MDA, and Pro in the field were significantly smaller than those in the pot under drought stress, with CAT of field-grown wheat not significantly different from the control (Figure 10c). It should, however, be noted that the number of observations is small for SOD, POD, CAT, MDA, SS, and Pro in field-planting after rewatering, so it is not studied.

3.6. Effect of Experimental Areas on Winter Wheat in Response to Drought and Postdrought Rewatering

Different experimental areas also led to differences in the response of winter wheat to drought stress and postdrought rewatering (Figure 11). Overall, there are small differences between the Huang-Huai-Hai Plain and the Middle–Lower Yangtze Plain, and larger differences between the Loess Plateau and the other two regions. When wheat planted on the Huang-Huai-Hai Plain and the Middle–Lower Yangtze Plain was subjected to drought stress, the decrease in Pn and gs was similar, whereas the Loess Plateau showed a smaller decrease in Pn and gs than the above two regions (Figure 11a). The recovery of Pn on the Middle–Lower Yangtze Plain was significantly better than others, and there was no significant difference in gs among the three regions. As shown in Figure 11a,b, there was no significant difference in the degree of response of winter wheat Tr, Fv/Fm, Chll, WUEg, PH, and LA to drought stress between the three regions. After rewatering, the recovery of Pn, Tr, and Fv/Fm was weak on the Loess Plateau. The WUEg of winter wheat on the Loess Plateau was higher than that of the control after rewatering but did not reach a significant level. While SOD, POD, MDA, and SS had the greatest increases on the Loess Plateau under stress (Figure 11b,c). In general, there is no significant regularity in response to postrewatering in different regions.

4. Discussion

4.1. How Winter Wheat Respond to Drought Stress and Postdrought Rewatering

Differences existed in the responses of winter wheat to drought stress in various physiological and biochemical, morphological characteristics, yield and yield components, and the ability to recover after rewatering varied (Figure 2). Then, these differences by drought can be a shortcut to determine the selection criteria for drought-tolerant winter wheat genotypes. In addition, the degree of rewatering compensation is dependent on the tolerance of plant to drought stress [51], so the recovery ability can be considered as the criteria for drought-tolerant genotypes. From this study, we found Pn, gs, and Tr responded rapidly and strongly to drought stress (Figure 2a), probably because stomatal closure is the primary response of winter wheat to changes in water stress, and closure of leaf stomata leads to a corresponding decrease in stomatal conductance, net photosynthetic rate and transpiration rate [29]. Aminizadeh et al. suggested that leaf stomatal conductance as the most promising traits may enhance a genetic gain for grain yield in environments that are vulnerable to water deficit in the future [52]. Because of the different response speed of different indexes to drought stress and rehydration, we can divide the traits into early response and late response for selection. The result of this meta-analysis also displays that gs can be significantly restored after rewatering, which may be due to the stomatal function being controlled only by a hyperactive mechanism in response to environmental stimuli [53]. Then the significant recovery of stomatal conductance naturally leads to a synchronized recovery of net photosynthetic rate and transpiration rate. In our opinion, stomatal conductance can be considered as an important trait for screening genotypes with better recovery ability from drought. The fluorescence parameter is one of the vital indexes to study stress response [54]. As the results of this study show, water stress had no significant effect on Fv/Fm. This may indicate that water stress had no effect on the primary photochemistry of photosystem 2 (PSII). While it has been concluded that water stress can reduce ΦPSII [55], just like we found. To sum up, water stress had no significant effect on photochemical quenching; however, the nonphotochemical quenching decreased with water stress [56]. The chlorophyll content of leaves also can be affected by drought stress. Because the lack of water can accelerate the decomposition of chlorophyll, resulting in a significant decrease in chlorophyll content [24]. As shown in Figure 2a, chlorophyll content can be significantly recovered after a period of rewatering, which effectively improves the absorption and utilization of light energy in leaves and promotes the recovery of photosynthesis [57].
As shown in Figure 2b, drought stress leads to a significant decrease in above-ground dry matter and yield, then a rapid recovery after rewatering treatment, even an overcompensation effect. Studies have shown that mild drought stress in the early stage of growth and normal watering in the later stage are conducive to increasing above-ground dry matter accumulation of winter wheat, promoting the transport of photosynthetic products to reproductive organs, and thus improving the formation of yield [58]. There is research that shows that dry matter would improve genetic gain for drought tolerance and can be a trait for screening genotypes [52].
In this study, SOD, POD, CAT, and GR were significantly increased under drought stress compared with the control group (Figure 2c), which reflected the adaptability of winter wheat to adversity [59,60]. As we all known, chloroplasts, mitochondria, and other cells can produce reactive oxygen species (ROS) under drought stress, and ROS mainly consist of free radicals such as superoxide anion ( O 2 ) and nonfree radicals such as hydrogen peroxide (H2O2) [59]. Water deficit-induced stomatal closure results in reduced CO2 assimilation, which leads to NADPH accumulation [60] and subsequent leakage of e towards O2 leading to enhanced ROS generation [61]. ROS also originate in cell by nonenzymatic mechanisms such as Fe-catalyzed oxidation of NAD(P)H. As shown in Figure 12, water deficit increased hydrogen peroxide content (H2O2) and superoxide anion ( O 2 ) by 40.0% and 16.0%. After rehydration, H2O2 recovered quickly and recovery rate of O 2 was low. As we known, the excessive accumulation of ROS can cause great negative effects on cells [59]. To protect the cells, SOD, POD, CAT, and GR activities should be increased to remove ROS in leaves [29]. Liu et al. performed a quantitative analysis of antioxidant enzymes, which revealed that rewatering alleviated the peroxidation and osmotic stress caused by water deficit in winter wheat [62], this is similar to the conclusion of this study. After rewatering, POD and GR decreased slightly but not significantly, while SOD and CAT increased slightly (Figure 2c). This may be because ROS accumulation is still large after a short period of rewatering, then SOD and CAT are still needed to maintain high activity to eliminate ROS. In combination with Figure 4b, Figure 6 and Figure 10c, the change trends of SOD and CAT with stress intensity, stress (rewatering) duration, and planting methods were observed, and it was easy to find that the changes in both had a certain synchronicity. This may be closely related to the ROS clearance mechanism: SOD converted O 2 generated by drought stress into H2O2, and then CAT cleared H2O2 [63]. However, there are also some studies showing that such synchronization is not absolute. He et al. indicated that wheat maintains a dynamic balance between the production and elimination of free radicals of ROS by regulating genes encoding antioxidant enzymes during drought stress and rehydration [64]. It means that the synchronicity of SOD and CAT changes cannot be easily concluded, and it needs to be combined with protein quantity and omics approaches to study deeply.
Drought stress can also cause lipid peroxidation in leaves, and MDA is one of the products of lipid peroxidation. So, the increase in MDA content can reflect the degree of negative environmental impact on plants [59], which is consistent with our conclusion. Research also has shown that in the absence of water, proline (Pro), and soluble sugar (SS) plays a vital role in the cellular osmoregulation of plants, reducing the osmotic potential of the cell protoplasm to maintain turgor pressure [31]. In this study, the contents of Pro and SS also increased significantly under drought conditions, indicating that the physiological mechanism of crop resistance responded positively to reduce the adverse effects of drought. There are studies showing that genes regulating the production in proline (Pro), including pyrroline-5-carboxylate synthetase, harpin-encoding protein, and EF-Hand family protein, participate in plant tolerance to drought stress [65,66], and the Arabidopsis C-repeat-binding factor gene (AtCBF4) is another key component in producing soluble sugars and enhancing the drought tolerance of plants [67]. In addition, the decrease in Pro and SS after stress relief found in this study agrees with the research of Manaa [29]. This indicated that in the breeding programs, the rapid reduction in SS and Pro after rehydration may be used as a criterion for selection wheat genotypes.

4.2. The Impact of Stress Intensities and Durations of Drought (Rewatering) on Winter Wheat in Response to Drought Stress and Postdrought Rewatering

The responses of winter wheat to drought stress and postdrought rewatering are related to stress intensities and stress (rewatering) durations [68,69]. The greater the stress intensity, the greater the negative impact on plants and the worse the rewatering effect after drought [58,70]. Pn, Tr, and gs were significantly different from the control under all stress intensities, and the recovery effect was more significant, which may be because Pn, Tr, and gs were more sensitive to water. In particular, Figure 3 showed that Tr decreased more under mild stress than under moderate and severe stress. This phenomenon is worth investigating, so we try to explain it by referring to the conclusion of Jiang et al. [71]. They found that photosynthesis, transpiration, and chlorophyll fluorescence processes compete with each other under drought stress, and the improvement of efficiency of any process can lead to the downregulation of the other processes. So, this phenomenon can be explained by the fact that winter wheat preferentially ensures photosynthesis efficiency by more inhibition of transpiration under mild stress [72]. Conversely, when the stress degree increased, the decrease in chlorophyll content resulted in the decreases in photosynthesis and the decrease in net photosynthetic rate, and the decrease in transpiration was slightly moderated. Under mild and moderate drought, other photosynthetic structures were not significantly damaged except stomatal conductance, so the chlorophyll content and ΦPSII were reduced slightly. While under severe drought, the photosynthetic structures were seriously damaged and the chlorophyll content and ΦPSII were significantly reduced. After rewatering under mild stress, chlorophyll content and ΦPSII can quickly recover to the levels of the control group, so the decrease in chlorophyll content and ΦPSII are reversible responses under certain drought degrees [72]. Studies have shown that mild water deficit can increase SOD and CAT activities, while severe drought stress can lead to a decrease in SOD and POD enzyme activities [73], which is consistent with our study. The different effects of stress intensities means that we can use different indicators according to different stress intensities when selecting drought resistance genotypes.
In general, each indicator of winter wheat had more negative effects with the increase in stress duration, and the recovery degree gradually increased with the increase in rewatering time. SOD had an increase followed by a decrease with the passage of stress time. The highest activity of SOD was observed at 1–3 days stress, and then gradually decreased until it was lower than that of the control group. This may be because the initial drought stress stimulates the activity of SOD, while the antioxidant protective enzyme system of leaves is damaged under long-term drought stress, resulting in the reduction in SOD [74].

4.3. The Impact of Growth Stages on Winter Wheat in Response to Drought Stress and Postdrought Rewatering

Drought at different growth stages would lead to different changes in winter wheat [75]. In general, the drought occurring during the anthesis-filling stage can impose negative effects on photosynthesis, transpiration, and stomatal conductance, which leads to a loss of productivity. It is not conducive to yield and yield components of winter wheat. Therefore, the anthesis-filling stage was considered as the key water demand period for winter wheat [32]. In addition, most indices of winter wheat can recover to the control level after rewatering. Especially, some indexes (e.g., WUEg, TKW, and GN) can have an overcompensation effect. As the result of this study, suitable drought stress on winter wheat at the regreening stage was beneficial to improve WUE and yield and save farmland water consumption [74]. Therefore, the regreening stage is the key period of water management [34].
Figure 8a demonstrates that drought at the booting to anthesis-filling stage had the least effect on plant height and leaf area. In contrast, winter wheat that experienced drought during the jointing stage was shorter and had smaller leaf area. The reason is that water-sensitive stage for plant height and leaf growth is the jointing stage. Adequate soil water during the jointing stage can promote the vegetative growth of wheat stem, leaf, and other organs [32]. Water stress at this stage can cause water loss in plants and affect cell division, resulting in a significant decrease in plant height and leaf area. After the jointing stage, plant height and leaf area are gradually set and the growth and development of wheat mainly changed to reproductive growth, so plant height and leaf area under anthesis-filling stage drought were close to CK [32]. So, plant height under drought stress, especially during the jointing stage, can be used as an important trait in selecting drought-tolerant genotypes, this is similar to Ellis’s conclusion [52].
When drought occurs during jointing to anthesis-filling stage, the yield has the greatest decrease [Figure 8b]. Some researchers believe that the yield reduction can be mainly attributed to two reasons: the decrease in grain weight and quantity [76]. As the result of this study, the drought stress during the jointing to anthesis-filling stages is the most affected TKW and GN, because anthesis-filling stage is the key period for the formation of wheat grains, and the occurrence of drought stress at this stage can directly affect plant fruity and grain development. Postanthesis drought stress reduces the photosynthetic capacity of flag leaves of wheat, inhibits the synthesis and accumulation of starch in grains, and thus reduces TKW, thereby affecting the yield [2]. However, rewatering after drought stress in some stages can effectively improve the yield, such as drought stress occurring at the regreening to jointing stage, relief of stress in the booting to anthesis-filling stage to restore water supply, which is conducive to the phenomenon of over-compensation of thousand-grain weight, the increase in yield, which is consistent with previous studies [34]. In real life, the physiological stage of the plant that receives stress depends on the planting time and the time when the rain stops (drought happens). We are not able to know at what stage drought will occur, so it would be important to gain insight into the specific effects of drought and rewatering at different stage.

4.4. The Impact of Planting Methods on Winter Wheat in Response to Drought Stress and Postdrought Rewatering

In this study, winter wheat grown in the field was less affected by drought stress than winter wheat grown in the pot, and the recovery of field-grown wheat after rewatering was better (Figure 10). Winter wheat planted in the field is less affected by drought stress than winter wheat planted in the pot, which is consistent with the research conclusions of Feng et al. [77] and Zhang et al. [19]. In the pot experiment, we only need to take rain shielding measures to minimize the impact of natural precipitation factors, but the soil water content in the field experiment is difficult to separate from external factors. Other studies have shown that wheat roots can extend to 110 cm on average, and the root length in 0–20 cm soil is less than 50% of the total length [78]. The pot experiment greatly limited the growth space of winter wheat roots, while winter wheat roots could grow as much as possible in the field, so that the roots could obtain deeper water in the soil, thus alleviating drought stress. As shown in Figure 13, the total root length reduction in pot-grown wheat was much greater than that of field-grown wheat under drought stress, which supports our discussion above. In addition to the root length, the properties of the soil used in many of these control experiments differ greatly from natural soil. Many of the above factors may cause differences of wheat between different planting methods.

4.5. The Impact of Experimental Areas on Winter Wheat in Response to Drought Stress and Postdrought Rewatering

Although the experimental error caused by natural precipitation has been excluded from the literature included in this study, it is difficult to completely isolate the influence of natural factors on the experiment due to the vast territory of China and the greatly different climate characteristics in different regions. For example, different soil properties, air temperature, and humidity in different regions can bring certain errors to the experiment. In order to better study, the main planting regions of winter wheat were divided into three areas in China. This meta-analysis found that antioxidant protective enzymes, malondialdehyde, and osmoregulatory substances of winter wheat planted on the Loess Plateau were more affected by drought stress than those in the Huang-Huai-Hai Plain and the Middle–Lower Yangtze Plain, while the net photosynthetic rate and stomata conductance of winter wheat in the Loess Plateau were significantly less responsive to drought stress than those in the other two regions. It can be seen that the physiological characteristics of winter wheat in the Loess Plateau have strong adaptability to drought stress, and the antioxidant protection enzyme system and osmotic regulation system also have better regulation ability. This may be related to the different varieties of winter wheat planted in different regions. The Loess Plateau has less precipitation and low air humidity, and the suitable winter wheat is generally strong drought resistance. There was no significant rule of rewatering ability of winter wheat in the three regions, which should be further studied.

5. Conclusions

In conclusion, we used a meta-analysis to quantitatively evaluate the responses of winter wheat to drought stress and rewatering. The factors like stress intensities, treatment durations, growth stages, planting methods, and experimental areas make the effect of drought (or rewatering) different. Stomatal conductance is more sensitive to environmental water change. Under mild stress, transpiration efficiency is more inhibited than photosynthetic rate. Water deficit also had greater adverse effects on yield, glutathione, malondialdehyde, proline, and soluble sugar. The effects of stress and rewatering on winter wheat exist differences at different growth stages. Drought before the jointing stage had significant effect on plant height. Recovery ability after drought is inversely proportional to stress intensity and proportional to rewatering duration. We found the recovery effect of dry matter, chlorophyll content, water use efficiency, and malondialdehyde after rehydration is very significant, and superoxide dismutase and catalase activities still increased significantly after rehydration. The recovery from stress is also one of the indicators to evaluate drought resistance. So stomatal conductance, photosynthetic rate, transpiration efficiency, yield, glutathione, malondialdehyde, proline, soluble sugar, plant height, dry matter, chlorophyll content, water use efficiency, superoxide dismutase, and catalase can be recommended as the traits for the criteria of selecting drought resistance genotypes. Moreover, winter wheat grown in the field is less affected by drought stress than winter wheat grown in the pot, and the recovery ability of field-grown winter wheat is stronger than that of pot-grown wheat after drought. Winter wheat on the Loess Plateau has stronger drought resistance.

Author Contributions

Conceptualization, H.W. and Z.Y.; methodology, H.W.; software, H.W.; validation, H.W.; formal analysis, H.W.; investigation, H.W.; resources, H.W. and Z.Y.; data curation, H.W. and Z.Y.; writing—original draft preparation, H.W.; writing—review and editing, H.W. and Z.Y.; visualization, H.W.; supervision, Z.Y.; project administration, Z.Y.; funding acquisition, Z.Y. All authors have read and agreed to the published version of the manuscript.

Funding

This research was supported by the National Key Research and Development Program of China (Grant No. 2022YFD2300202).

Data Availability Statement

Data used for the analysis are available from the corresponding authors on request.

Conflicts of Interest

The authors declare no conflict of interest.

References

  1. Han, J.; Zhang, Z.; Cao, J.; Luo, Y.; Zhang, L.; Li, Z.; Zhang, J. Prediction of winter wheat yield based on multi-source data and machine learning in China. Remote Sens. 2020, 12, 236. [Google Scholar] [CrossRef]
  2. Li, J.Y.; Yao, D.X.; Guo, X.L.; Wang, Z.M.; Zhang, Y.H. Effects of post-anthesis drought on photosynthesis, antioxidant properties, and C4 photosynthetic enzyme activity in winter wheat. Chin. J. Ecol. 2023, 42, 49–57. [Google Scholar]
  3. Lou, R.T.; Li, D.X.; Li, Y.B.; Bian, Z.P.; Zhu, Y.N. Effect of pre-anthesis drought hardening on post-anthesis physiological characteristics, yield and WUE in winter wheat. Phyton-Int. J. Exp. Bot. 2021, 90, 245–257. [Google Scholar] [CrossRef]
  4. Zlatev, Z.; Lidon, F.C. An overview on drought induced changes in plant growth, water relations and photosynthesis. Emir. J. Food Agric. 2012, 24, 57–72. [Google Scholar]
  5. Pei, D.; Sun, Z.S.; Chen, S.L.; Zhang, X.Y.; Zhang, Z.H. Effects of water stress on physiological and agronomic features of winter wheat. Trans. CSAE 2006, 22, 68–72. [Google Scholar]
  6. Shanmugam, S.; Kjaer, K.H.; Ottosen, C.O.; Rosenqvist, E.; Kumari Sharma, D. The alleviating effect of elevated CO2 on heat stress susceptibility of two wheat (Triticum aestivum L.) cultivars. J. Agron. Crop. Sci. 2013, 199, 340–350. [Google Scholar] [CrossRef]
  7. Seleiman, M.F.; Al-Suhaibani, N.; Ali, N.; Akmal, M.; Alotaibi, M.; Refay, Y.; Dindaroglu, T.; Abdul-Wajid, H.H.; Battaglia, M.L. Drought stress impacts on plants and different approaches to alleviate its adverse effects. Plants 2021, 10, 259. [Google Scholar] [CrossRef] [PubMed]
  8. Gechev, T.S.; Van, B.F.; Stone, J.M.; Denev, I.; Laloi, C. Reactive oxygen species as signals that modulate plant stress responses and programmed cell death. Bioessays 2006, 28, 1091–1101. [Google Scholar] [CrossRef] [PubMed]
  9. Luo, H.H.; Merope, T.M.; Zhang, Y.L.; Zhang, W.F. Combining gas exchange and chlorophyll a fluorescence measurements to analyze the photosynthetic activity of drip-irrigated cotton under different soil water deficits. J. Integr. Agric. 2016, 15, 1256–1266. [Google Scholar] [CrossRef]
  10. Tombesi, S.; Frioni, T.; Poni, S.; Palliotti, A. Effect of water stress ‘memory’ on plant behavior during subsequent drought stress. Environ. Exp. Bot. 2018, 150, 106–114. [Google Scholar] [CrossRef]
  11. Wu, J.; Wang, Z.; Li, Y.; Feng, W.; Tian, W. Flag leaf chlorophyll fluorescence characteristics and its response to drought stress in different cultivars of winter wheat. J. Triticeae Crops 2015, 35, 699–706. [Google Scholar]
  12. Meng, L.L.; Song, J.F.; Wen, J.; Zhang, J.; Wei, J.H. Effects of drought stress on fluorescence characteristics of photosystem II in leaves of Plectranthus scutellarioides. Photosynthetica 2016, 54, 414–421. [Google Scholar] [CrossRef]
  13. Huang, M.; Wu, J.Z.; Li, Y.J.; Yao, Y.Q.; Zhang, C.J.; Cai, D.X.; Jin, K. Effects of different tillage management on production and yield of winter wheat in dryland. Trans. CSAE 2009, 25, 50–54. [Google Scholar]
  14. Zhang, Y.P.; Zhang, Y.H.; Wang, Z.M.; Wang, Z.J. Characteristics of canopy structure and contributions of non-leaf organs to yield in winter wheat under different irrigated conditions. Field Crops Res. 2011, 123, 187–195. [Google Scholar] [CrossRef]
  15. Wang, W.S.; Wang, C.; Pan, D.Y.; Zhang, Y.K.; Luo, B.; Ji, J. Effects of drought stress on photosynthesis and chlorophyll fluorescence images of soybean (Glycine max) seedlings. Int. J. Agric. Biol. Eng. 2018, 11, 196–201. [Google Scholar] [CrossRef]
  16. Dabrowski, P.; Baczewska-Dabrowska, A.H.; Kalaji, H.M.; Goltsev, V.; Paunov, M.; Rapacz, M. Exploration of chlorophyll a fluorescence and plant gas exchange parameters as indicators of drought tolerance in perennial ryegrass. Sensors 2019, 19, 2736. [Google Scholar] [CrossRef] [PubMed]
  17. Faseela, P.; Sinisha, A.K.; BrestiČ, M.; Puthur, J.T. Chlorophyll a fluorescence parameters as indicators of a particular abiotic stress in rice. Photosynthetica 2019, 57, 108–115. [Google Scholar]
  18. Alves, A.A.C.; Setter, T.L. Response of cassava leaf area expansion to water deficit: Cell proliferation, cell expansion and delayed development. Ann. Bot. 2004, 94, 605–613. [Google Scholar] [CrossRef] [PubMed]
  19. Zhang, J.M.; Zhang, S.Q.; Cheng, M.; Jiang, H.; Zhang, X.Y.; Peng, C.H.; Lu, X.H.; Zhang, M.X.; Jin, J.X. Effect of drought on agronomic traits of rice and wheat: A Meta-analysis. Int. J. Environ. Res. Public Health 2018, 15, 839. [Google Scholar] [CrossRef]
  20. Leilah, A.A.; Al-khateeb, S.A. Statistical analysis of wheat yield under drought conditions. J. Arid Environ. 2005, 61, 483–496. [Google Scholar] [CrossRef]
  21. Zhang, L.X.; Li, S.X.; Zhang, H.; Liang, Z.S. Nitrogen rates and water stress effects on production, lipid peroxidation and antioxidative enzyme activities in two maize (Zea mays L.) genotypes. J. Agron. Crop Sci. 2007, 193, 387–397. [Google Scholar] [CrossRef]
  22. Nio, S.A.; Cawthray, G.R.; Wade, L.J.; Colmer, T.D. Pattern of solutes accumulated during leaf osmotic adjustment as related to duration of water deficit for wheat at the reproductive stage. Plant Physiol. Biochem. 2011, 49, 1126–1137. [Google Scholar] [CrossRef]
  23. Cruz de Carvalho, M.H. Drought stress and reactive oxygen species: Production, scavenging and signaling. Plant Signal. Behav. 2008, 3, 156–165. [Google Scholar] [CrossRef]
  24. Shan, C.Z.; Tang, J.X.; Hao, W.F. Effects of water stress on leaf physiological characteristics of Lomax 9133 seedlings. J. Jiangsu Agric. Sci. 2006, 22, 229–232. [Google Scholar]
  25. Lou, L.L.; Li, X.R.; Chen, J.X.; Li, Y.; Tang, Y.; Lv, J.Y. Photosynthetic and ascorbate-glutathione metabolism in the flag leaves as compared to spikes under drought stress of winter wheat (Triticum aestivum L.). PLoS ONE 2018, 13, e0194625. [Google Scholar] [CrossRef]
  26. Abid, M.; Ali, S.; Qi, L.K.; Zahoor, R.; Dai, T.B. Physiological and biochemical changes during drought and recovery periods at tillering and jointing stages in wheat (Triticum aestivum L.). Sci. Rep. 2018, 8, 4615. [Google Scholar] [CrossRef]
  27. Sattar, A.; Sher, A.; Ijaz, M.; Ul-Allah, S.; Rizwan, M.S.; Hussain, M.; Jabran, K.; Cheema, M.A. Terminal drought and heat stress alter physiological and biochemical attributes in flag leaf of bread wheat. PLoS ONE 2020, 15, 0232974. [Google Scholar] [CrossRef] [PubMed]
  28. Simova-Stoilova, L.; Demirevska, K.; Petrova, T.; Tsenov, N.; Feller, U. Antioxidative protection in wheat varieties under severe recoverable drought at seedling stage. Plant Soil. Environ. 2008, 54, 529–536. [Google Scholar] [CrossRef]
  29. Manaa, A.; Goussi, R.; Derbali, W.; Cantamessa, S.; Barbato, R. Photosynthetic performance of quinoa (Chenopodium quinoa Willd.) after exposure to a gradual drought stress followed by a recovery period. Biochim. Et Biophys. Acta (BBA)-Bioenerg. 2021, 1862, 148383. [Google Scholar] [CrossRef] [PubMed]
  30. Vanková, R.; Dobrá, J.; Storchová, H. Recovery from drought stress in tobacco: An active process associated with the reversal of senescence in some plant parts and the sacrifice of others. Plant Signal. Behav. 2012, 7, 19–21. [Google Scholar] [CrossRef]
  31. Fang, Y.; Xiong, L. General mechanisms of drought response and their application in drought resistance improvement in plants. Cell. Mol. Life Sci. 2015, 72, 673–689. [Google Scholar] [CrossRef]
  32. Mu, Q.; Cai, H.J.; Sun, S.K.; Wen, S.S.; Xu, J.T.; Dong, M.Q.; Saddique, Q. The physiological response of winter wheat under short-term drought conditions and the sensitivity of different indices to soil water changes. Agric. Water Manag. 2021, 243, 106475. [Google Scholar] [CrossRef]
  33. Siopongco, J.D.L.C.; Yamauchi, A.; Salekdeh, H.; Bennett, L.; Wade, L.J. Growth and water use response of doubled-haploid rice lines to drought and rewatering during the vegetative stage. Plant Prod. Sci. 2006, 9, 141–151. [Google Scholar] [CrossRef]
  34. Yao, N.; Song, L.B.; Liu, J.; Feng, H.; Wu, S.F.; He, J.Q. Effects of water stress at different growth stages on the development and yields of winter wheat in arid region. Sci. Agric. Sin. 2015, 48, 2379–2389. [Google Scholar]
  35. Izanloo, A.; Condon, A.G.; Langridge, P.; Tester, M.; Schnurbusch, T. Different mechanisms of adaptation to cyclic water stress in two South Australian bread wheat cultivars. J. Exp. Bot. 2008, 59, 3327–3346. [Google Scholar] [CrossRef]
  36. Gurevitch, J.; Hedges, L.V. Statistical issues in ecological Meta-analyses. Ecology 1999, 80, 1142–1149. [Google Scholar] [CrossRef]
  37. Philibert, A.; Loyce, C.; Makowski, D. Assessment of the quality of Meta-analysis in agronomy. Agric. Ecosyst. Environ. 2012, 148, 72–82. [Google Scholar] [CrossRef]
  38. Zhang, L.Q.; Wang, Y.L.; Lou, Z.X.; Hsu, L.F.; Chen, D.; Piao, R.Z.; Zhao, H.Y.; Cui, Z.J. Meta-analysis of factors affecting C-N fractions and yield of paddy soils by total straw return and N fertilizer application. Agronomy 2022, 12, 3168. [Google Scholar] [CrossRef]
  39. Li, X.; Cai, J.; Liu, F.; Dai, T.; Cao, W.; Jiang, D. Spring freeze effect on wheat yield is modulated by winter temperature fluctuations: Evidence from Meta-analysis and simulating experiment. J. Agron. Crop Sci. 2015, 201, 288–300. [Google Scholar] [CrossRef]
  40. Li, P.F.; Ma, B.L.; Palta, J.A.; Ding, T.T.; Cheng, Z.G.; Lv, G.C.; Xiong, Y.C. Wheat breeding highlights drought tolerance while ignores the advantages of drought avoidance: A Meta-analysis. Eur. J. Agron. 2021, 122, 126–196. [Google Scholar] [CrossRef]
  41. Villegas, D.; Aparicio, N.; Blanco, R.; Royo, C. Biomass accumulation and main stem elongation of durum wheat grown under Mediterranean conditions. Ann. Bot. 2001, 88, 617–627. [Google Scholar] [CrossRef]
  42. Ruehr, N.K.; Gast, A.; Weber, C.; Daub, B.; Arneth, A. Water availability as dominant control of heat stress responses in two contrasting tree species. Tree Physiol. 2016, 36, 164–178. [Google Scholar] [CrossRef]
  43. Liu, H.N.; Wu, H.; Yao, S. Depth extraction of continuous data in Meta-analysis. Chin. J. Evid.-Based Med. 2017, 17, 117–121. [Google Scholar]
  44. Pan, Y.X.; Yang, R.; Qiu, J.X.; Wang, J.Y.; Wu, J.P. Forty-year spatio-temporal dynamics of agricultural climate suitability in China reveal shifted major crop production areas. Catena 2023, 226, 107073. [Google Scholar] [CrossRef]
  45. Rosenberg, M.S.; Adams, D.C.; Gurevitch, J. Metawin: Statistical software for Meta-analysis version 2. Q. Rev. Biol. 1998, 73, 126–128. [Google Scholar]
  46. Hedges, L.V.; Gurevitch, J.; Curtis, P.S. The Meta-analysis of response ratios in experimental ecology. Ecology 1999, 80, 1150–1156. [Google Scholar] [CrossRef]
  47. Rosenthal, R. The file drawer problem and tolerance for null results. Psychol. Bull. 1979, 86, 638–641. [Google Scholar] [CrossRef]
  48. Luo, Y.Q.; Hui, D.F.; Zhang, D.Q. Elevated CO2 stimulates net accumulations of carbon and nitrogen in land ecosystems: A Meta-analysis. Ecology 2006, 87, 53–63. [Google Scholar] [CrossRef] [PubMed]
  49. Rothstein, H.R.; Sutton, A.J.; Borenstein, M. Publication Bias in Meta-Analysis, 1st ed.; John Wiley & Sons, Ltd.: Hoboken, NJ, USA, 2006; pp. 1–7. [Google Scholar]
  50. Chandrasekaran, M.; Boughattas, S.; Hu, S.J.; Oh, S.H.; Sa, T. A Meta-analysis of arbuscular mycorrhizal effects on plants grown under salt stress. Mycorrhiza 2014, 24, 611–625. [Google Scholar] [CrossRef] [PubMed]
  51. Li, X.R.; Tang, Y.; Zhou, C.J.; Zhang, L.X.; Lv, J.Y. A wheat WRKY transcription factor TaWRKY46 enhances tolerance to osmotic stress in transgenic Arabidopsis plants. Int. J. Mol. Sci. 2020, 21, 1321. [Google Scholar] [CrossRef] [PubMed]
  52. Ellis, M.H.; Bonnett, D.G.; Rebetzke, G.J. A 192bp allele at the Xgwm261 locus is not always associated with the Rht8 dwarfing gene in wheat (Triticum aestivum L.). Euphytica 2007, 157, 209–214. [Google Scholar] [CrossRef]
  53. Torrecillas, A.; Guillaume, C.; Alarcón, J.J.; Ruiz-Sánchez, M.C. Water relations of two tomato species under water-stress and recovery. Plant Sci. 1995, 105, 169–176. [Google Scholar] [CrossRef]
  54. Krause, G.H.; Weis, F. Chlorophyll fluorescence and photosynthesis: The basics. Annu. Rev. Plant Physiol. Plant Mol. Biol. 1991, 42, 313–349. [Google Scholar] [CrossRef]
  55. Lu, C.; Zhang, J. Effects of water stress on photosystem II photochemistry and its thermostability in wheat plants. J. Exp. Bot. 1999, 50, 1199–1206. [Google Scholar] [CrossRef]
  56. Subrahmanyam, D.; Subash, N.; Haris, A.; Sikka, A.K. Influence of water stress on leaf photosynthetic characteristics in wheat cultivars differing in their susceptibility to drought. Photosynthetica 2006, 44, 125–129. [Google Scholar] [CrossRef]
  57. Abid, M.; Tian, Z.W.; Ata-UI-Karim, S.T.; Wang, F.; Liu, Y.; Zahoor, R.; Jiang, D.; Dai, T.B. Adaptation to and recovery from drought stress at vegetative stages in wheat (Triticum aestivum) cultivars. Funct. Plant Biol. 2016, 43, 1159–1169. [Google Scholar] [CrossRef] [PubMed]
  58. Yin, H.J.; Wang, R.R.; Jiang, G.Y.; Che, Z.Q.; Chen, T.P.; Hu, J.J.; Guo, R.G.; Peng, T.T.; Lei, Q.Q. Response of photosynthetic physiology and yield of spring wheat to drought-rewatering. J. Soil. Water Conserv. 2023, 37, 1–11. [Google Scholar]
  59. Ru, C.; Hu, X.T.; Chen, D.Y.; Wang, W.; Zhen, J.B. Photosynthetic, antioxidant activities, and osmoregulatory responses in winter wheat differ during the stress and recovery periods under heat, drought, and combined stress. Plant Sci. 2023, 327, 111557. [Google Scholar] [CrossRef]
  60. Selote, D.S.; Bharti, S.; Khanna-Chopra, R. Drought acclimation reduces O2 accumulation and lipid peroxidation in wheat seedlings. Biochem. Biophys. Res. Commun. 2004, 314, 724–729. [Google Scholar] [CrossRef]
  61. Asada, K. The water–water cycle in chloroplast: Scavenging of active oxygen and dissipation of excess photons. Annu. Rev. Plant Physiol. Plant Mol. Biol. 1999, 50, 601–639. [Google Scholar] [CrossRef]
  62. Liu, X.J.; Wang, X.D.; Liu, P.; Bao, X.Y.; Hou, X.Y.; Yang, M.M.; Zhen, W.C. Rehydration compensation of winter wheat is mediated by hormone metabolism and de-peroxidative activities under field conditions. Front. Plant Sci. 2022, 13, 823846. [Google Scholar] [CrossRef]
  63. Aliyeva, D.R.; Aydinli, L.M.; Pashayeva, A.N.; Zulfugarov, I.S.; Huseynova, I.M. Photosynthetic machinery and antioxidant status of wheat genotypes under drought stress followed by rewatering. Photosynthetica 2020, 5895, 1217–1225. [Google Scholar] [CrossRef]
  64. He, J.N.; Duan, Y.; Hua, D.P.; Fan, G.J.; Wang, L.; Liu, Y. DEXH box RNA helicase-mediated mitochondrial reactive oxygen species production in Arabidopsis mediates crosstalk between abscisic acid and auxin signaling. Plant Cell 2012, 24, 1815–1833. [Google Scholar] [CrossRef]
  65. Qiu, J.R.; Xiang, X.Y.; Wang, J.T.; Xu, W.X.; Chen, J.; Xiao, Y. MfPIF1 of resurrection plant Myrothamnus flabellifolia plays a positive regulatory role in responding to drought and salinity stresses in Arabidopsis. Int. J. Mol. Sci. 2020, 21, 3011. [Google Scholar] [CrossRef] [PubMed]
  66. Anwar, A.; Wang, K.; Wang, J.; Shi, L.; Du, L.; Ye, X. Expression of Arabidopsis Ornithine Aminotransferase (AtOAT) encoded gene enhances multiple abiotic stress tolerances in wheat. Plant Cell Rep. 2021, 40, 1155–1170. [Google Scholar] [CrossRef]
  67. Zhang, Z.H.; Zhu, L.; Song, A.P.; Wang, H.B.; Chen, S.M.; Jiang, J.F.; Chen, F.D. Chrysanthemum (Chrysanthemum morifolium) CmICE2 conferred freezing tolerance in Arabidopsis. Plant Physiol. Biochem. 2020, 146, 31–41. [Google Scholar] [CrossRef]
  68. Varshney, R.K.; Barmukh, R.; Roorkiwal, M.; Qi, Y.; Kholova, Y.; Tuberosa, R.; Reynolds, M.P.; Tardieu, F.; Siddique, K.H.M. Breeding custom-designed crops for improved drought adaptation. Adv. Genet. 2021, 2, e202100017. [Google Scholar] [CrossRef]
  69. Raza, A.; Mubarik, M.S.; Sharif, R.; Habib, M.; Jabeen, W.; Zhang, C.; Chen, H.; Chen, Z.H.; Siddique, K.H.M.; Zhuang, W. Developing drought-smart, ready-to-grow future crops. Plant Genome 2022, 16, e20279. [Google Scholar] [CrossRef] [PubMed]
  70. Jiang, M.Y.; Xue, X.P.; Yang, Z.Q.; Zhao, H.; Dong, Z.Q.; Xu, Y.; Zou, J.L. Compensation effects of rewatering at flowering stage on leaf state and yield structure of winter wheat under drought. Chin. J. Agrometeorol. 2020, 41, 253–262. [Google Scholar]
  71. Maxwell, K.; Johnson, G.N. Chlorophyll fluorescence—A practical guide. J. Exp. Bot. 2000, 51, 659–668. [Google Scholar] [CrossRef] [PubMed]
  72. Schoppach, R.; Sadok, W. Differential sensitivities of transpiration to evaporative demand and soil water deficit among wheat elite cultivars indicate different strategies for drought tolerance. Environ. Exp. Bot. 2012, 84, 1–10. [Google Scholar] [CrossRef]
  73. Zhang, F.; Guo, J.K.; Yang, Y.L.; He, W.L.; Zhang, L.X. Changes in the pattern of antioxidant enzymes in wheat exposed to water deficit and rewatering. Acta. Physiol. Plant. 2004, 26, 345–352. [Google Scholar] [CrossRef]
  74. Guo, Z.; Ou, W.; Lu, S.; Zhong, Q. Differential responses of antioxidative system to chilling and drought in four rice cultivars differing in sensitivity. Plant Physiol. Biochem. 2006, 44, 828–836. [Google Scholar] [CrossRef] [PubMed]
  75. Szablińska-Piernik, J.; Lesław, B.L. Polar metabolites profiling of wheat shoots (Triticum aestivum L.) under repeated short-term soil drought and rewatering. Int. J. Mol. Sci. 2023, 24, 8429. [Google Scholar] [CrossRef]
  76. Gu, Y.F.; Ding, S.Y.; Gao, Z.Y.; Xing, Q. Effects of drought and rehydration on the distribution pattern of photosynthetic products in winter wheat. Strateg. Study CAE 2012, 14, 59–64. [Google Scholar]
  77. Feng, Z.Z.; Kazuhiko, K.; Elizabetha, A. Impact of elevated ozone concentration on growth, physiology, and yield of wheat (Triticum aestivum L.): A Meta-analysis. Glob. Change Biol. 2008, 14, 2696–2708. [Google Scholar] [CrossRef]
  78. Hamblin, A.P. Root characteristics of some temperate legume species and varieties on deep, free-draining entisols. Aust. J. Agric. Res. 1985, 36, 63–72. [Google Scholar] [CrossRef]
Figure 1. Region division and the distribution of experimental sites identified in the papers that met the inclusion criteria. Darker colors indicate more overlap in the number of experimental sites at that location.
Agronomy 14 00298 g001
Figure 2. Effects of drought stress and postdrought rewatering on (a) gas exchange parameters, chlorophyll content, chlorophyll fluorescence parameters, water use efficiency, (b) plant architecture, yield, yield components, biomass components and (c) biochemical components in winter wheat. Numbers near the symbols specify the number of data points and the error bars indicate a 95% confidence interval. Abbreviations for the indicators are described in Table 1.
Agronomy 14 00298 g002
Figure 3. Effect of different stress intensities on net photosynthetic rate, transpiration, stomatal conductance, chlorophyll content, chlorophyll fluorescence parameters, and water use efficiency in winter wheat. Numbers near the symbols specify the number of data points and the error bars indicate a 95% confidence interval. Abbreviations for the indicators are described in Table 1. “D” and “R” represent drought stress groups and rewatering groups respectively.
Agronomy 14 00298 g003
Figure 4. Effect of different stress intensities on (a) morphological characteristics, dry matter, yield , yield components and (b) biochemical components in winter wheat. Numbers near the symbols specify the number of data points and the error bars indicate a 95% confidence interval. Abbreviations for the indicators are described in Table 1. “D” and “R” represent drought stress groups and rewatering groups respectively.
Agronomy 14 00298 g004
Figure 5. Effects of different treatment durations on (a) net photosynthetic rate, transpiration, stomatal conductance, chlorophyll fluorescence parameters and (b) chlorophyll content, dry matter, plant height, leaf area in winter wheat. Numbers near the symbols specify the number of data points and the error bars indicate a 95% confidence interval. Abbreviations for the indicators are described in Table 1. “D” and “R” represent drought stress groups and rewatering groups respectively.
Agronomy 14 00298 g005
Figure 6. Effects of different treatment durations on biochemical components in winter wheat. Numbers near the symbols specify the number of data points and the error bars indicate a 95% confidence interval. Abbreviations for the indicators are described in Table 1. “D” and “R” represent drought stress groups and rewatering groups respectively.
Agronomy 14 00298 g006
Figure 7. Effect of different growth stages on (a) net photosynthetic rate, transpiration, stomatal conductance and (b) chlorophyll content, chlorophyll fluorescence parameters, water use efficiency in winter wheat. Numbers near the symbols specify the number of data points and the error bars indicate a 95% confidence interval. Abbreviations are described in Table 1 and Table 2.
Agronomy 14 00298 g007
Figure 8. Effect of different growth stages on (a) dry matter, plant height, leaf area and (b) yield, yield components in winter wheat. Numbers near the symbols specify the number of data points and the error bars indicate a 95% confidence interval. Abbreviations are described in Table 1 and Table 2.
Agronomy 14 00298 g008
Figure 9. Effect of different growth stages on (a) superoxide dismutase activities, peroxidase activities, catalase activities in leaves and (b) malondialdehyde concentration, soluble sugar concentration, proline concentration in leaves in winter wheat. Numbers near the symbols specify the number of data points and the error bars indicate a 95% confidence interval. Abbreviations are described in Table 1 and Table 2.
Agronomy 14 00298 g009
Figure 10. Effect of different planting methods on (a) gas exchange parameters, chlorophyll content, chlorophyll fluorescence parameters, water use efficiency, (b) plant architecture, yield, yield components, biomass components and (c) biochemical components in winter wheat. Numbers near the symbols specify the number of data points and the error bars indicate a 95% confidence interval. Abbreviations for the indicators are described in Table 1. “D” and “R” represent drought stress groups and rewatering groups respectively.
Agronomy 14 00298 g010
Figure 11. Effect of different experimental areas on (a) gas exchange parameters, chlorophyll content, chlorophyll fluorescence parameters, water use efficiency, (b) plant architecture, yield, yield components, biomass components and (c) biochemical components in winter wheat. Numbers near the symbols specify the number of data points and the error bars indicate a 95% confidence interval. Abbreviations for the indicators are described in Table 1. “D” and “R” represent drought stress groups and rewatering groups respectively.
Agronomy 14 00298 g011
Figure 12. Effects of drought stress and postdrought rewatering on superoxide anion and hydrogen peroxide in winter wheat. Numbers near the symbols specify the number of data points and the error bars indicate a 95% confidence interval. Abbreviations for the indicators are described in Table 1.
Agronomy 14 00298 g012
Figure 13. Effect of different planting methods on root length in winter wheat. Numbers near the symbols specify the number of data points and the error bars indicate a 95% confidence interval.
Agronomy 14 00298 g013
Table 1. List and description of variables reported in the meta-analysis study.
General CategoryParameter
Abbreviation
Description
Gas exchange parameters, chlorophyll content, chlorophyll fluorescence parameters and water use efficiencyPnLeaf net photosynthetic rate
gsStomatal conductance
TrTranspiration
Fv/FmQuantum efficiency of PSII photochemistry in dark-adapted state
ΦPSIIThe quantum yield of electron transport
ChllTotal chlorophyll concentration in leaves
WUEgWater use efficiency for grain
Plant architecturePHPlant height
LALeaf area
Yield, yield components, and biomass componentsYieldYield
TKWThousand kernel weight
GNGrain number per panicle
PNPanicle number per pot or m2
AB DWAboveground dry weight
Biochemical componentsSODSuperoxide dismutase activities in leaves
PODPeroxidase activities in leaves
CATCatalase activities in leaves
GRglutathione reductase activities in leaves
MDAMalondialdehyde concentration in leaves
SSSoluble sugar concentration in leaves
ProProline concentration in leaves
H2O2hydrogen peroxide concentration in leaves
O 2 superoxide anion concentration in leaves
Table 2. Classification and abbreviation of growth stages in the meta-analysis study.
AbbreviationDivision Description
Gs droughtDrought occurring at the regreening stage
Js droughtDrought occurring at the jointing stage
Bs droughtDrought occurring at the booting stage
AFs droughtDrought occurring at the anthesis stage, the filling stage or from the anthesis stage to maturity
Ws droughtDrought during the complete growth cycle
Gs-Js droughtDrought occurring from the regreening stage to the jointing stage
Gs-Bs droughtDrought occurring from the regreening stage to the booting stage
Gs-AFs droughtDrought occurring from the regreening stage to the anthesis stage (or the filling stage, maturity)
Js-Bs droughtDrought occurring from the jointing stage to the booting stage
Js-AFs droughtDrought occurring from the jointing stage to the anthesis stage (or the filling stage, maturity)
Bs-AFs droughtDrought occurring from the booting stage to the anthesis stage (or the filling stage, maturity)
Table 3. The heterogeneity of variables under different conditions (Qb).
Categorical VariableTreatment
Condition
Treatment
(between D and R)
Stress IntensityTreatment
Duration
Growth
Stage
Planting MethodExperimental Area
PnD48.82 ***28.74 ***2.7059.78 ***44.37 ***49.76 ***
R37.28 ***22.97 ***61.88 ***-26.43 ***
TrD36.43 ***6.41 *4.77100.02 ***7.86 **4.75
R9.90 **14.88 **45.07 ***0.0438.51 ***
gsD67.21 ***19.01 ***19.19 ***77.10 ***32.37 ***116.89 ***
R64.01 ***3.9712.070.805.46
Fv/FmD2.7745.38 ***10.35 **12.93 *1.677.62 *
R7.24 **15.28 ***31.47 ***0.2437.54 ***
ΦPSIID22.11 ***61.53 ***2.8359.57 ***3.6520.65 ***
R16.97 ***84.12 ***148.56 ***-154.54 ***
ChllD35.25 ***59.14 ***13.11 **11.88 *10.85 ***0.23
R33.05 ***2.625.253.041.64
WUEgD8.30 **4.79-0.821.46 ***0.82
R72.44 ***-276.16 ***0.5618.92 ***
AB DWD176.72 ***7.33 *5.72111.96 ***28.46 ***0.07
R31.84 ***15.20 ***21.99 **0.6229.00 ***
PHD2.4352.45 ***4.3040.61 ***-0.09
R49.50 ***61.96 ***107.44 ***42.33 ***13.61 **
LAD4.53 *29.44 ***105.78 ***70.97 ***0.972.50
R28.16 ***1.7622.88 ***-1.37
YieldD17.99 ***13.91 ***-24.73 ***5.21 *10.71 **
R625.02 ***-1102.15 ***48.50 ***53.01 ***
TKWD0.653.29-20.63 ***0.014.22 *
R7.31 *-277.84 ***34.77 ***5.51
PND14.97 ***99.71 ***-35.56 ***51.87 ***28.73 ***
R24.32 ***-1143.39 ***154.20 ***0.63
GND55.75 ***37.13 ***-32.93 ***64.40 ***50.56 ***
R35.97 ***-857.74 ***121.99 ***47.73 ***
SODD27.38 ***6.12 *29.72 ***39.39 ***5.17 *82.10 ***
R66.64 ***1.7921.33 ***-130.52 ***
PODD2.8926.64 ***48.41 ***58.77 ***21.15 ***80.60 ***
R2.127.09 *14.84 **--
CATD9.51 **5.031.8410.468.77 **10.23 **
R4.69 *10.63 **4.19-3.60
GRD2.07-----
R-----
MDAD9.40 **1.7264.98 ***117.40 ***5.07 *43.00 ***
R5.500.7334.98 ***-4.17
SSD11.67 ***37.09 ***25.33 ***98.63 ***-22.17 ***
R0.913.7761.32 ***-7.48 **
ProD4.06 *31.85 ***27.04 ***5.972.02-
R0.6514.64 ***0.24--
Statistical significance is reported at p < 0.05 (*), p < 0.01 (**), and p < 0.001 (***). “-” represents fewer relevant data for this group and would not be subgroup analyzed. Variable abbreviations are described in Table 1.
Disclaimer/Publisher’s Note: The statements, opinions and data contained in all publications are solely those of the individual author(s) and contributor(s) and not of MDPI and/or the editor(s). MDPI and/or the editor(s) disclaim responsibility for any injury to people or property resulting from any ideas, methods, instructions or products referred to in the content.

