Article

Variation in Nutritional Value of Diverse Wheat Genotypes

Faculty of Agrobiotechincal Sciences Osijek, Josip Juraj Strossmayer University of Osijek, Vladimira Preloga 1, 31000 Osijek, Croatia
*
Author to whom correspondence should be addressed.
Agronomy 2024, 14(2), 311; https://doi.org/10.3390/agronomy14020311
Submission received: 22 December 2023 / Accepted: 27 January 2024 / Published: 31 January 2024
(This article belongs to the Section Crop Breeding and Genetics)

Abstract

:
Due to the health problems caused by the malnutrition of the world’s population, the focus of wheat breeding is turning to the improvement of the nutritional quality of wheat grain. Recently, the consumption of wheatgrass has become increasingly popular. The aim of this study was to determine the variability of total Mg, Fe, and Zn concentration, protein content, and phytic acid in wheat grains for a total of 93 genotypes. In addition, the variability of total and in vitro bioavailable concentrations of Mg, Fe, and Zn and protein content in the fresh juice of wheatgrass was investigated for the same 93 genotypes. The results obtained indicated significant variation in the phytate and nutrient compounds among examined wheat genotypes. In the grain, all examined traits significantly varied except Fe; the largest variability was found in phytate concentration (45.6%). In wheatgrass juice, the greatest variability was found for the in vitro bioavailable Zn (38.3%). Within wheat genotypes, outstanding values for some traits were detected, which could be used in breeding programs. The development of mineral-rich wheat genotypes depends on the identification of genetic resources with high levels of essential micronutrients and a better understanding of genotypic and environmental interactions.

1. Introduction

Improving the nutritional value of food is one way to improve human nutrition and health. Throughout human history and civilization, wheat has been a fundamental crop and is grown on six continents with over 783 million tones on over 220 million hectares [1]. The world population is expected to exceed 9 billion people by 2050, with more than 800 million people suffering from malnutrition and more than 2 billion affected by severe food insecurity [1]. Over 60% of people suffering from hidden hunger worldwide are Fe deficient, and over 30% are Zn deficient. Cereal-based meals make up the majority of the daily diet. Wheat alone accounts for about 20% of the calories in the global population’s diet, which is based on cereals, groats, and flour, representing about 68% of total wheat production [1]. In addition to its high energy value in the form of starch, wheat grain contains health-promoting and essential components such as proteins, vitamins, minerals, fiber, and phytochemicals [2].
Although wheat is mainly used for its grain, wheatgrass supplements now make up a significant part of the market for natural dietary supplements. Wheatgrass stands for young shoots of wheat, which are usually consumed in the form of fresh juice, but also in the form of powder or tablets. The high content of mineral, vitamins, enzymes, and chlorophyll and the high proportion of amino acids best express the rich chemical composition of wheatgrass [3,4,5]. Due to the listed biocomponents, research has shown that wheatgrass helps in the treatment of a number of diseases in humans, such as anemia [6,7] and ulcerative colitis [8], and also facilitates oncology patients’ therapy [9,10].
For a long time, breeding objectives were mainly focused on high yield and neglected the important aspects of the nutritional quality of the grain. Even today, modern breeding is still strongly focused on high agronomic yield and not on increased grain protein content (GPC) or dense micronutrient content.
Considering that wheat is a staple food, it is important to consider the utilization of the whole wheat plant for nutrition by setting new breeding goals in the search for genetic diversity of the nutritional value of the grain as well as the young wheat shoots or wheat-grass germplasm. If the goal is to increase the nutritional quality of the grain, breeding should aim to increase the protein content in the grain as well as the content of micronutrients [11]. Unfortunately, genetic improvement of wheat varieties is limited for many traits due to lack of variability, which is due to early domestication and earlier selection in favor of traits such as high yield. Increasing protein content in grain therefore requires the determination of genetic variability for the trait under study and the use of distant parents in crosses [12]. Potentially suitable parents for such crosses could be the wild relatives of wheat, as they have been shown to be a rich source of genetic material [11,13]. There is obvious genetic diversity among old and new wheat genotypes that have been forgotten or considered inadequate due to relatively low grain yield and/or poor protein quality. In addition, considerable variability in micronutrient and protein concentration in wheat grains has been reported in numerous studies [14,15,16,17], while the variability in micronutrient and protein content of wheatgrass is poorly documented. From the consumer’s point of view, in addition to the total concentration of micronutrients, the bioavailability of micronutrients is also an important feature of wheat grain or wheatgrass-based food supplements. Bioavailability refers to the amount of food that is available for absorption in the organism [18]. It is known that antinutrients, such as phytic acid, reduce the absorption of micronutrients, especially Zn from cereals, in the human organism. The most common deficiencies in the human body are Fe and Zn. In addition, micronutrients such as Zn and Fe accumulate mainly in the germ and bran of the wheat grain, i.e., in the parts that are removed during the processing of the grain, suggesting that whole grain products are an important source of daily intake of these minerals in the human diet. It is well known that a diverse diet is the best source of microelements. But it is also known that a large number of people depend on a plain, nutrition-poor diet based on cereals. Because of that, improvement in the nutritional quality of wheat grain and wheatgrass could contribute to the everyday diet of individuals who cannot access a diverse diet. Therefore, in order to select genotypes and potential parents for hybridization with the aim of creating nutrient-rich genotypes, researchers need to assess the variability of desired traits such as the total and bioavailable concentration of microelements (in the endosperm), protein content, and antinutrients content in wheat germplasm.
The aim of this study was to determine the variability of total mineral content (Mg, Fe and Zn), protein content, and phytic acid concentration in the germplasm of 93 wheat genotypes, as well as the variability of the total and in vitro bioavailable concentrations of Mg, Fe, and Zn and the protein content in wheatgrass juice of the same germplasm. Mg, Fe, and Zn were chosen because they are the most common elements that are taken as dietary supplements. Our hypothesis is that there is a high variability in all examined traits and that we will be able to select genotypes with nutrient-rich grains, genotypes with nutrient-rich wheatgrass juice, and genotypes that have both nutrient-rich grain and nutrient-rich wheatgrass juice.

2. Materials and Methods
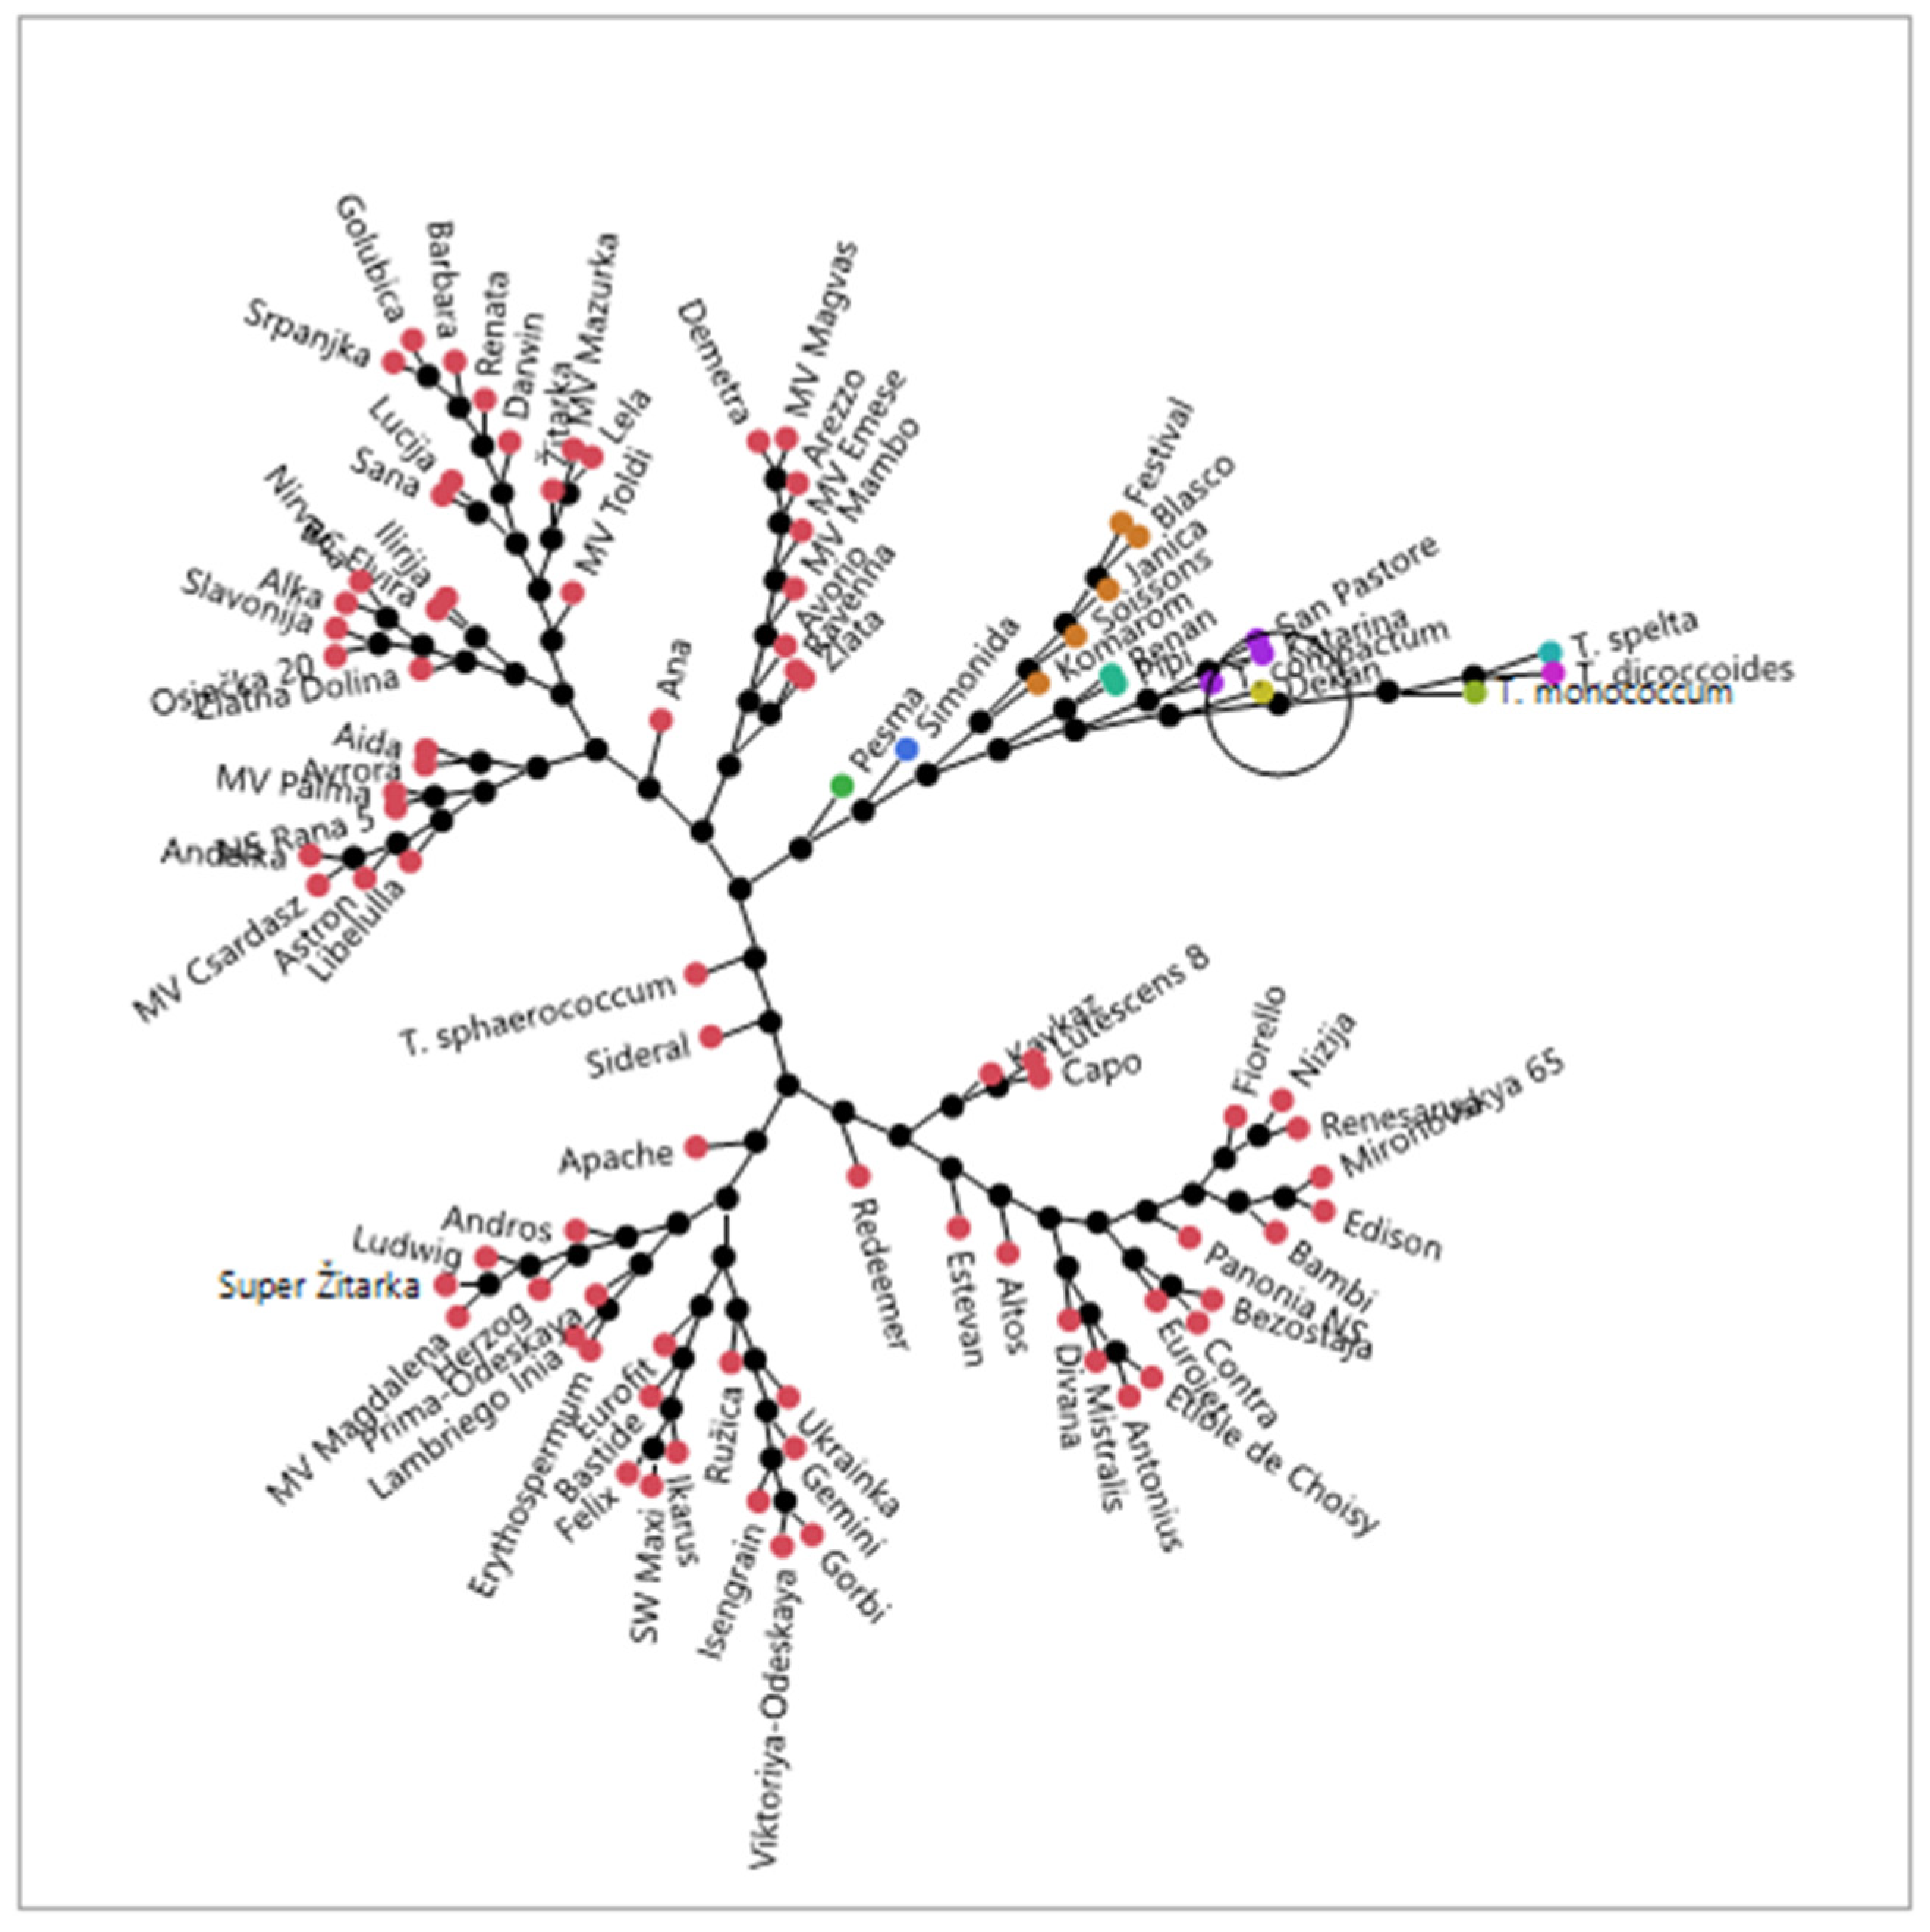
2.1. Germplasm

In total, 93 wheat genotypes were included in this study from eight different countries (Croatia, Italy, Serbia, Hungary, Germany, Austria, France, and Russia), including five wild relative accessions (T. monoccocum, T. dicoccoides, T. compactum, T. sphaerococcum and T. spelta) The wheat accessions were obtained from the wheat core collections of the Agricultural Institute of Osijek (Croatia), Bc Institute for breeding and seed production of field crops Zagreb (Croatia), Department of Agrobiotechnology, IFATulln (Austria), and Institute of Field and Vegetable Crops National Institute of the Republic of Serbia (Table S1). Besides origin, the genotypes were selected according to the registration year. The oldest genotype was registered in 1935, and the newest in 2006 (Table S1). The selected wheat genotypes are a part of the cereal core collection of the Faculty of Agrobiotechnical Sciences Osijek (Croatia), financed by M10.2: Support for conservation and sustainable use and development of genetic resources in agriculture, and a part of the national program for the conservation and sustainable use of plant genetic sources for food and agriculture in the Republic of Croatia. For the determination of protein, phytates, and micronutrient concentration in grain, the genotypes were sown in the field trials.

2.2. Determination of Mg, Fe, and Zn Concentration in Grain and Wheatgrass Juice

The preparation of seeds for the cultivation of wheatgrass was carried out in several steps (surface disinfection of the seeds, germination of the seeds, sowing, and cultivation in a plant growth chamber) according to [19]. In order to obtain a sufficient amount of juice, 15 g of grains of each wheat genotype were sown in three replicates. For cultivation, wheatgrass was used with Brill substrate (chemical composition of substrate: 80% white peat, 20% black peat; pH (CaCl2): 5.5–6.0; Content of salt: 0.8–1.3 g L−1; nitrogen (N): 110–190 mg L−1; phosphorus (P2O5): 140–230 mg L−1; potassium (K2O): 170–280 mg L−1). Cultivation and conditions for growing wheatgrass (duration of cultivation, temperature, and light regime) are described in [20]. The fresh wheatgrass juice was obtained by squeezing young wheatgrass leaves by hand with the Wheatgrass juicer BL-30 (Be Lih Do Enterprise Co., Ltd., Taoyuen, Taiwan). Freshly made juice was used for the simulation of in vitro digestion, while juice samples for protein and micronutrient analysis were stored in Falkon tubes in an ultra-cold storage freezer at −80 °C until the analysis. The simulation of in vitro digestion was carried out according to Minekus et al. (2014) with certain modifications described in detail in [20]. In order to determine the total concentrations of Mg, Fe, and Zn in wheatgrass juice and grain, wet digestion was performed according to a standardized method. The quantity of 1 mL of wheatgrass juice or 0.5 g of wheat grain was poured over with 9 mL 65% (v/v) HNO3 and 2 mL 30% (v/v) H2O2 in microwave vessels CEM Mars 6 (Matthews, NC, USA) according to Kingstone and Lassie (1986) [21]. The total and in vitro bioavailable concentrations of Mg, Fe, and Zn were measured by using the ICP-OES technique (Perkin Elmer, Optima 21000 DV, Überlingen, Germany).

2.3. Determination of Protein Concentration in Grain and Wheatgrass Juice

The field experiment was set up during two vegetation years (2019/2020 and 2020/2021). In each vegetation year, the field experiment was set up as a completely randomized block design with two replicates (grain). The plot size was 5 m2, with a plot plant density of 200 plants m−2. Soil analysis was carried out for each vegetation year, and the crop rotation in both years was soy (2019/2020 location: Brijest; field: T-10/II; Soil type: eutric brown; pH-Cl: 5.8; humus: 1.73%; AL-K2O: 30.1; AL-P2O5: 26.2/2020/2021 location: Brijest; field: T-10/I; soil type: eutric brown; pH-KCl: 5.1; humus: 1.9%; AL-K2O: 44.2; AL-P2O5: 40.0).
After the harvest in the 2019/2020 and 2020/2021 vegetation years, replicates of grain samples (0.5 kg per genotype per replicate) were collected and homogenized. Grain protein content was measured using the Infratec 1241 Grain Analyzer (Infratec 1241, Foss Tecator, Hillerød, Denmark).
The wheatgrass leaves from which the proteins in the wheatgrass juice were analyzed were collected at the tillering stage. The protein content of the wheatgrass juice samples was determined according to the Bradford method (1976) [22]. Bovine serum albumin (BSA; γ = 1 mg mL−1) was used as a standard, which was used to prepare a series of protein standards of known concentrations (20–100 mg mL−1). A 0.05 M Tris was used as the analysis buffer. On the day of the analysis, 1 mL of the sample was pipetted, and 1 mL of buffer was centrifuged at 4 °C for 20 min at 15,000 rpm. After centrifugation, 2.5 µL of the sample and distilled water were pipetted to a volume of 2 mL, and then 1 mL of Bradford reagent was added in every sample. For each sample, three technical replicates were measured, from which the mean value for each sample was calculated. Protein concentration was determined using a spectrophotometer (Shimadzu, UV–1800, Tokyo, Japan) at wavelength 595 nm. The protein concentration in wheatgrass juice was calculated using obtained calibration curves, and the determined values are expressed in mg mL−1.

2.4. Determination of Phytic Acid in Wheat Grain

Phytate in the grain of the tested wheat genotypes was conducted according to Haugh and Lantzsch (1983) [23]. The samples were measured on a spectrophotometer (Shimadzu, UV–1800, Tokyo, Japan) at wavelength 519 nm, and the calibration curve was made with known concentrations of phytate.

2.5. Statistical Analysis

Statistical analyses were performed using the SAS Enterprise Guide software, version 8.3 and JMP pro 14 for Windows (SAS Institute Inc., Cary, NC, USA). The experimental design was a completely randomized block design with two replicates (grain) and three replicates (wheatgrass juice). For all examined traits, descriptive statistics were calculated (arithmetic mean, standard deviation, coefficient of variation (CV%), and minimum and maximum). Measurements for grain protein, phytate, and micronutrient content were made in two replicates, while measurements for protein and micronutrient content in wheatgrass juice traits were made in three replicates, based on which the measures of descriptive statistics were calculated. Hierarchical clustering was carried out for grain and WGJ separately, where all 93 genotypes were clustered on the basis of all examined traits. Data were standardized prior to clustering, and clustering was carried out according to the Centroid Method. Clusters are shown in the constellation plot, and mean values of each cluster are shown in Tables S2 and S3. The mean data were subjected to one-way analysis of variance to test the level of significance among the genotypes for each examined trait, followed by an LSD test (p < 0.01).

3. Results

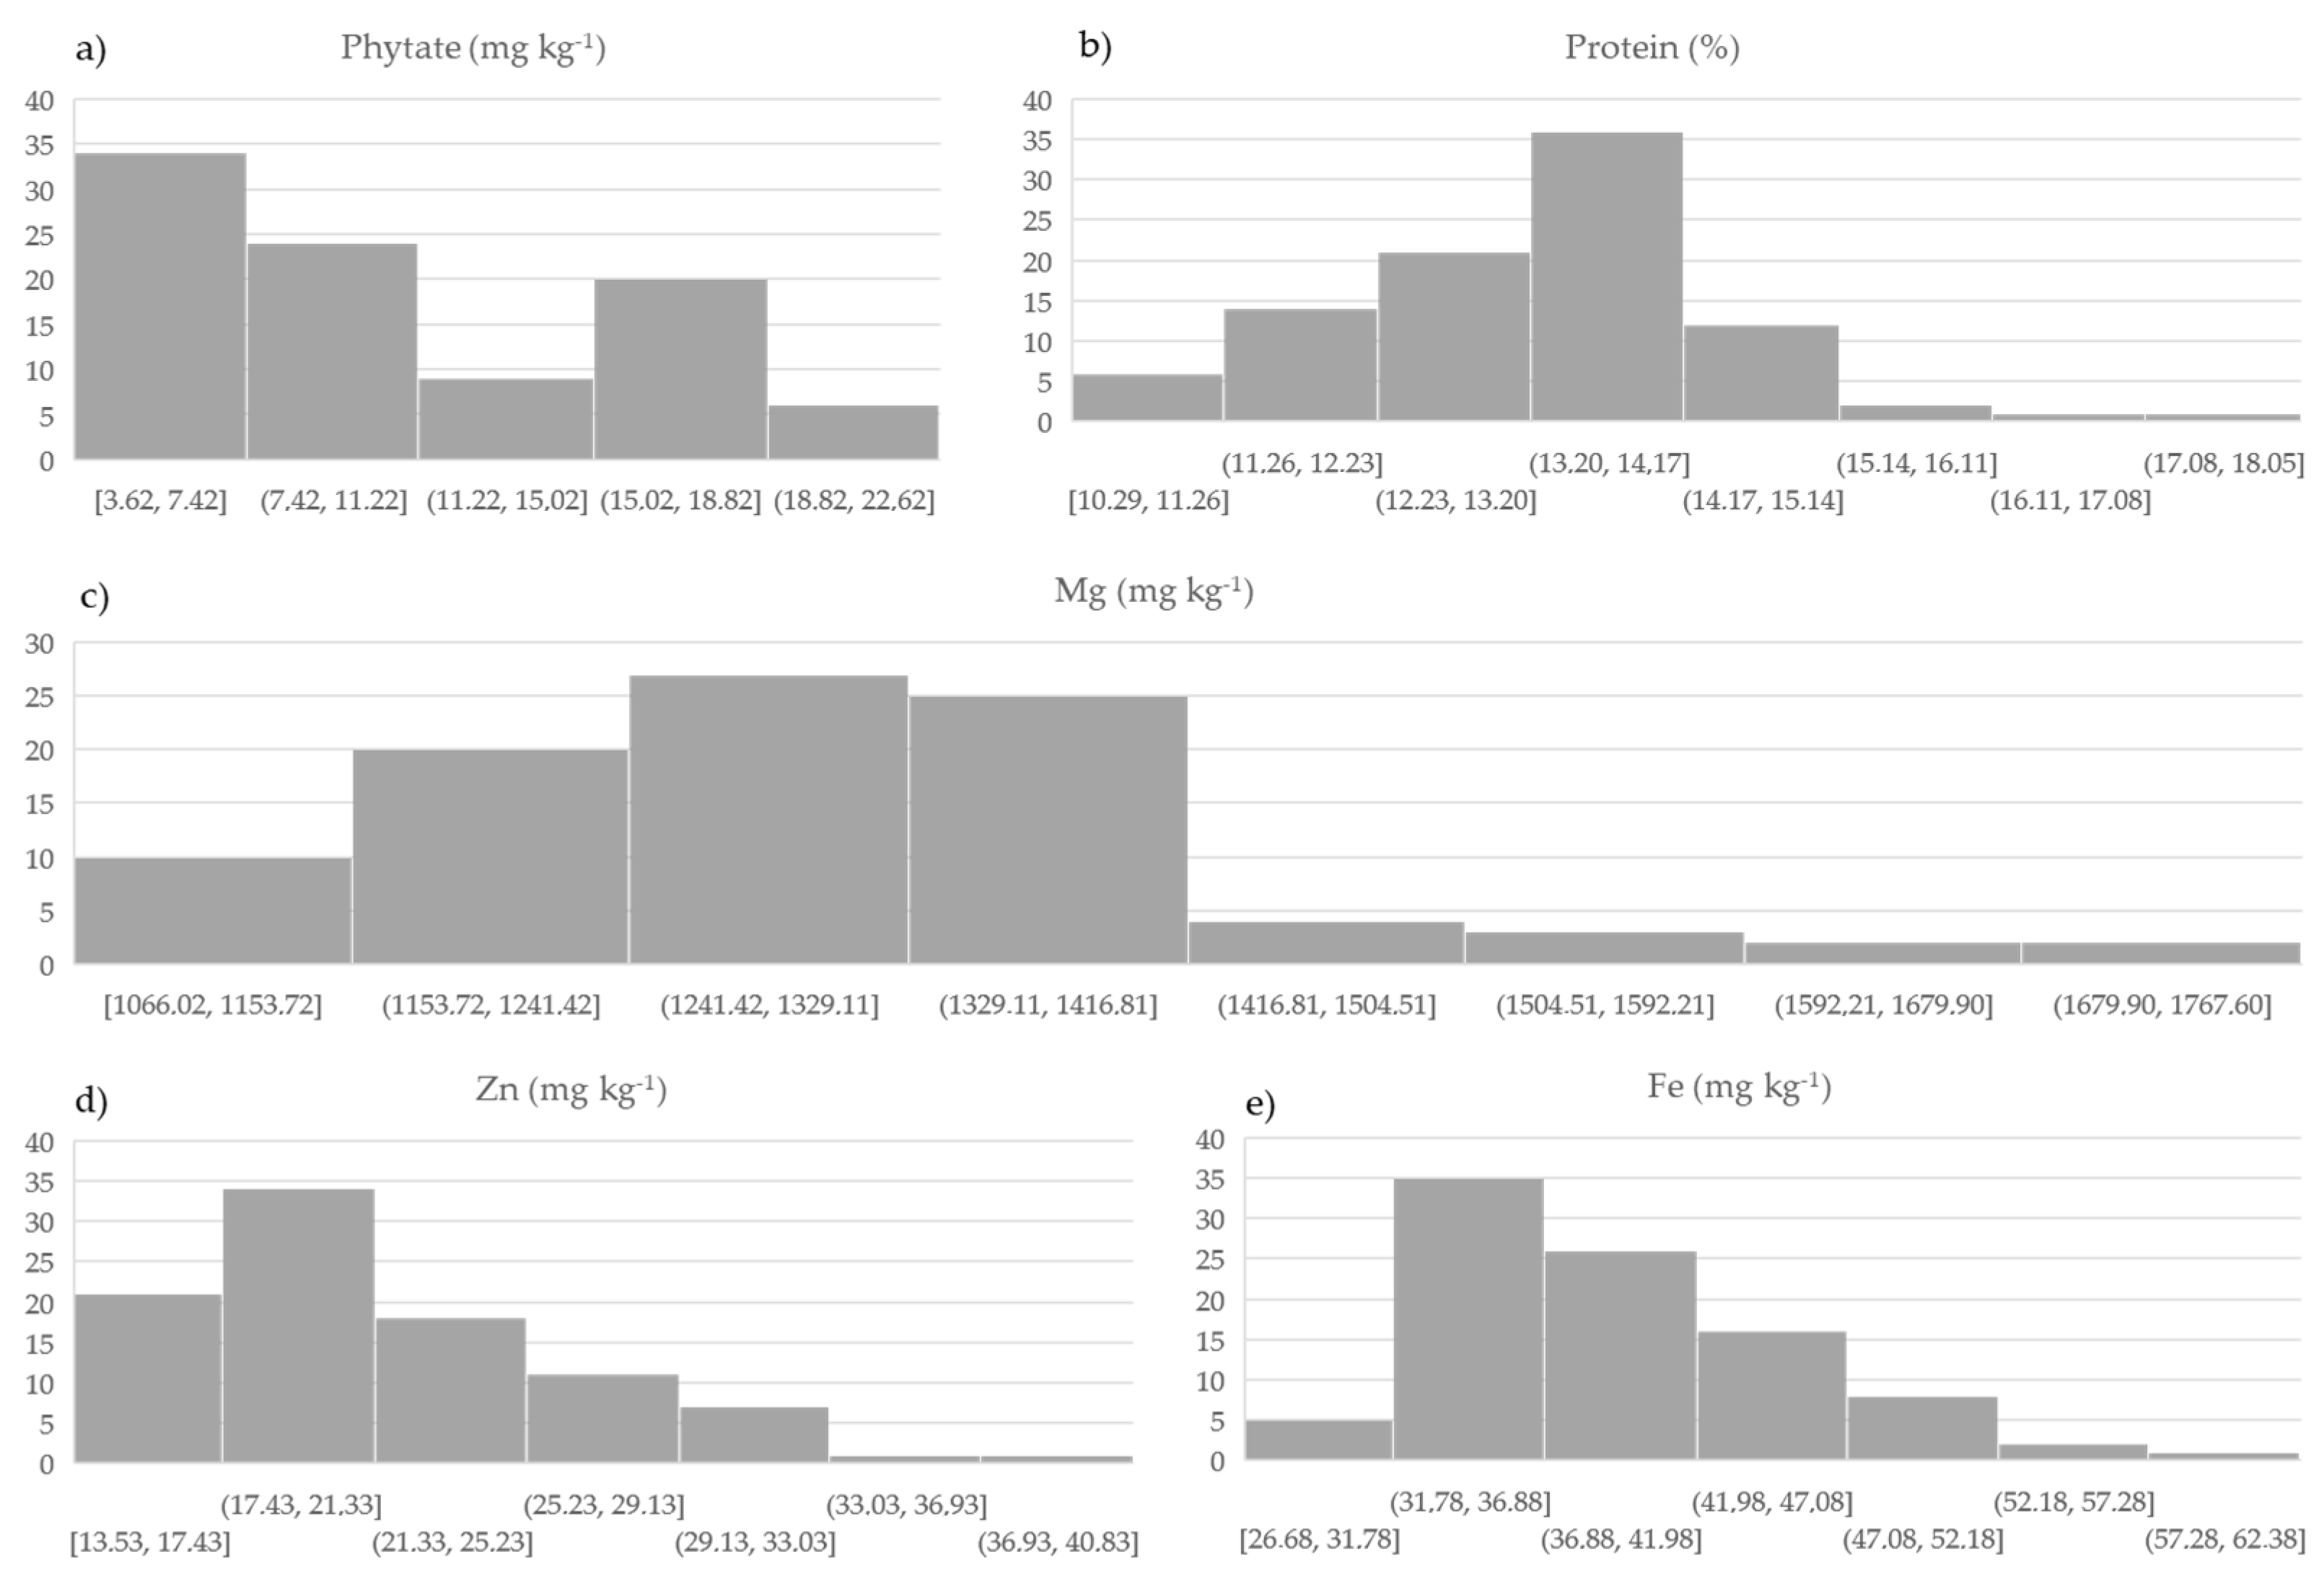
3.1. Variation in Protein, Phytate, Mg, Fe, and Zn in Grain

The lowest variability within the investigated wheat germplasm was found for protein content and Mg concentration (Figure 1). Among all examined traits, the largest genotypic variability was found for grain phytate concentration. The phytate concentration varied by 5.8-fold in the examined data set, ranging from 3.62 to 21.24 mg kg−1 with a mean value of 10.82 mg kg−1 (Figure 1).
Among the investigated mineral concentrations, Zn had the highest variability (2.9 fold between lowest and highest value), followed by Fe concentration, which varied by 2.3 fold (Figure 1) in examined wheat germplasm. Statistically significant differences between examined genotypes were found for protein (df = 92; F = 10.46; p < 0.01), phytate (df = 92; F = 20.16; p < 0.01), Mg concentration (df = 92; F = 4.35; p < 0.01), and Zn concentration (df = 92; F = 8.48; p < 0.01), while for Fe concentration, statistical differences were not detected (df = 92; F = 1.22; p = 0.298) (Table S2).
Hierarchical clustering of wheat genotypes was performed using the centroid method. The traits used for clustering were protein content in grain, phytate concentration, and Mg, Fe, and Zn concentration in grain. The constellation plot (Figure 2) is organized into 10 clusters, which corresponds to 10 different colors. The largest cluster comprised 79 out of 93 genotypes and is characterized by the fact that all measured values are just below the mean values of the examined germplasm (Table S3). The remaining 14 genotypes were distributed across 9 individual clusters and are shown in different colors on the constellation plot. The genotypes Ana (CRO), MV Palma (HUN), Divana (CRO), accession T. sphaerococcum (WR), and Festival (FRA) were separated as distinct clusters based on their characteristic traits (Table S5). The Ana genotype (CRO) was characterized by the highest Mg concentration (1767 mg kg−1) and the second highest Fe concentration (55.58 mg kg−1) in the grain compared to all genotypes. The Hungarian genotype MV Palma had high phytates (16.43 mg kg−1), Fe (49.91 mg kg−1), and Zn (32.60 mg kg−1) concentrations. Low phytates and above mean values of protein (17.04%), Mg (1613 mg kg−1), and Fe (46.39 mg kg−1) were found in Divana (CRO). The highest concentration of phytates (18.11 mg kg−1), protein (17.50%), and Zn (39.65 mg kg−1) was found in the wild relative accession T. sphaerococcum. The French genotype Festival had the highest Fe concentration (62.06 mg kg−1) compared to all genotypes in this experiment, while concentrations of all other analyzed traits were close to or below mean value.

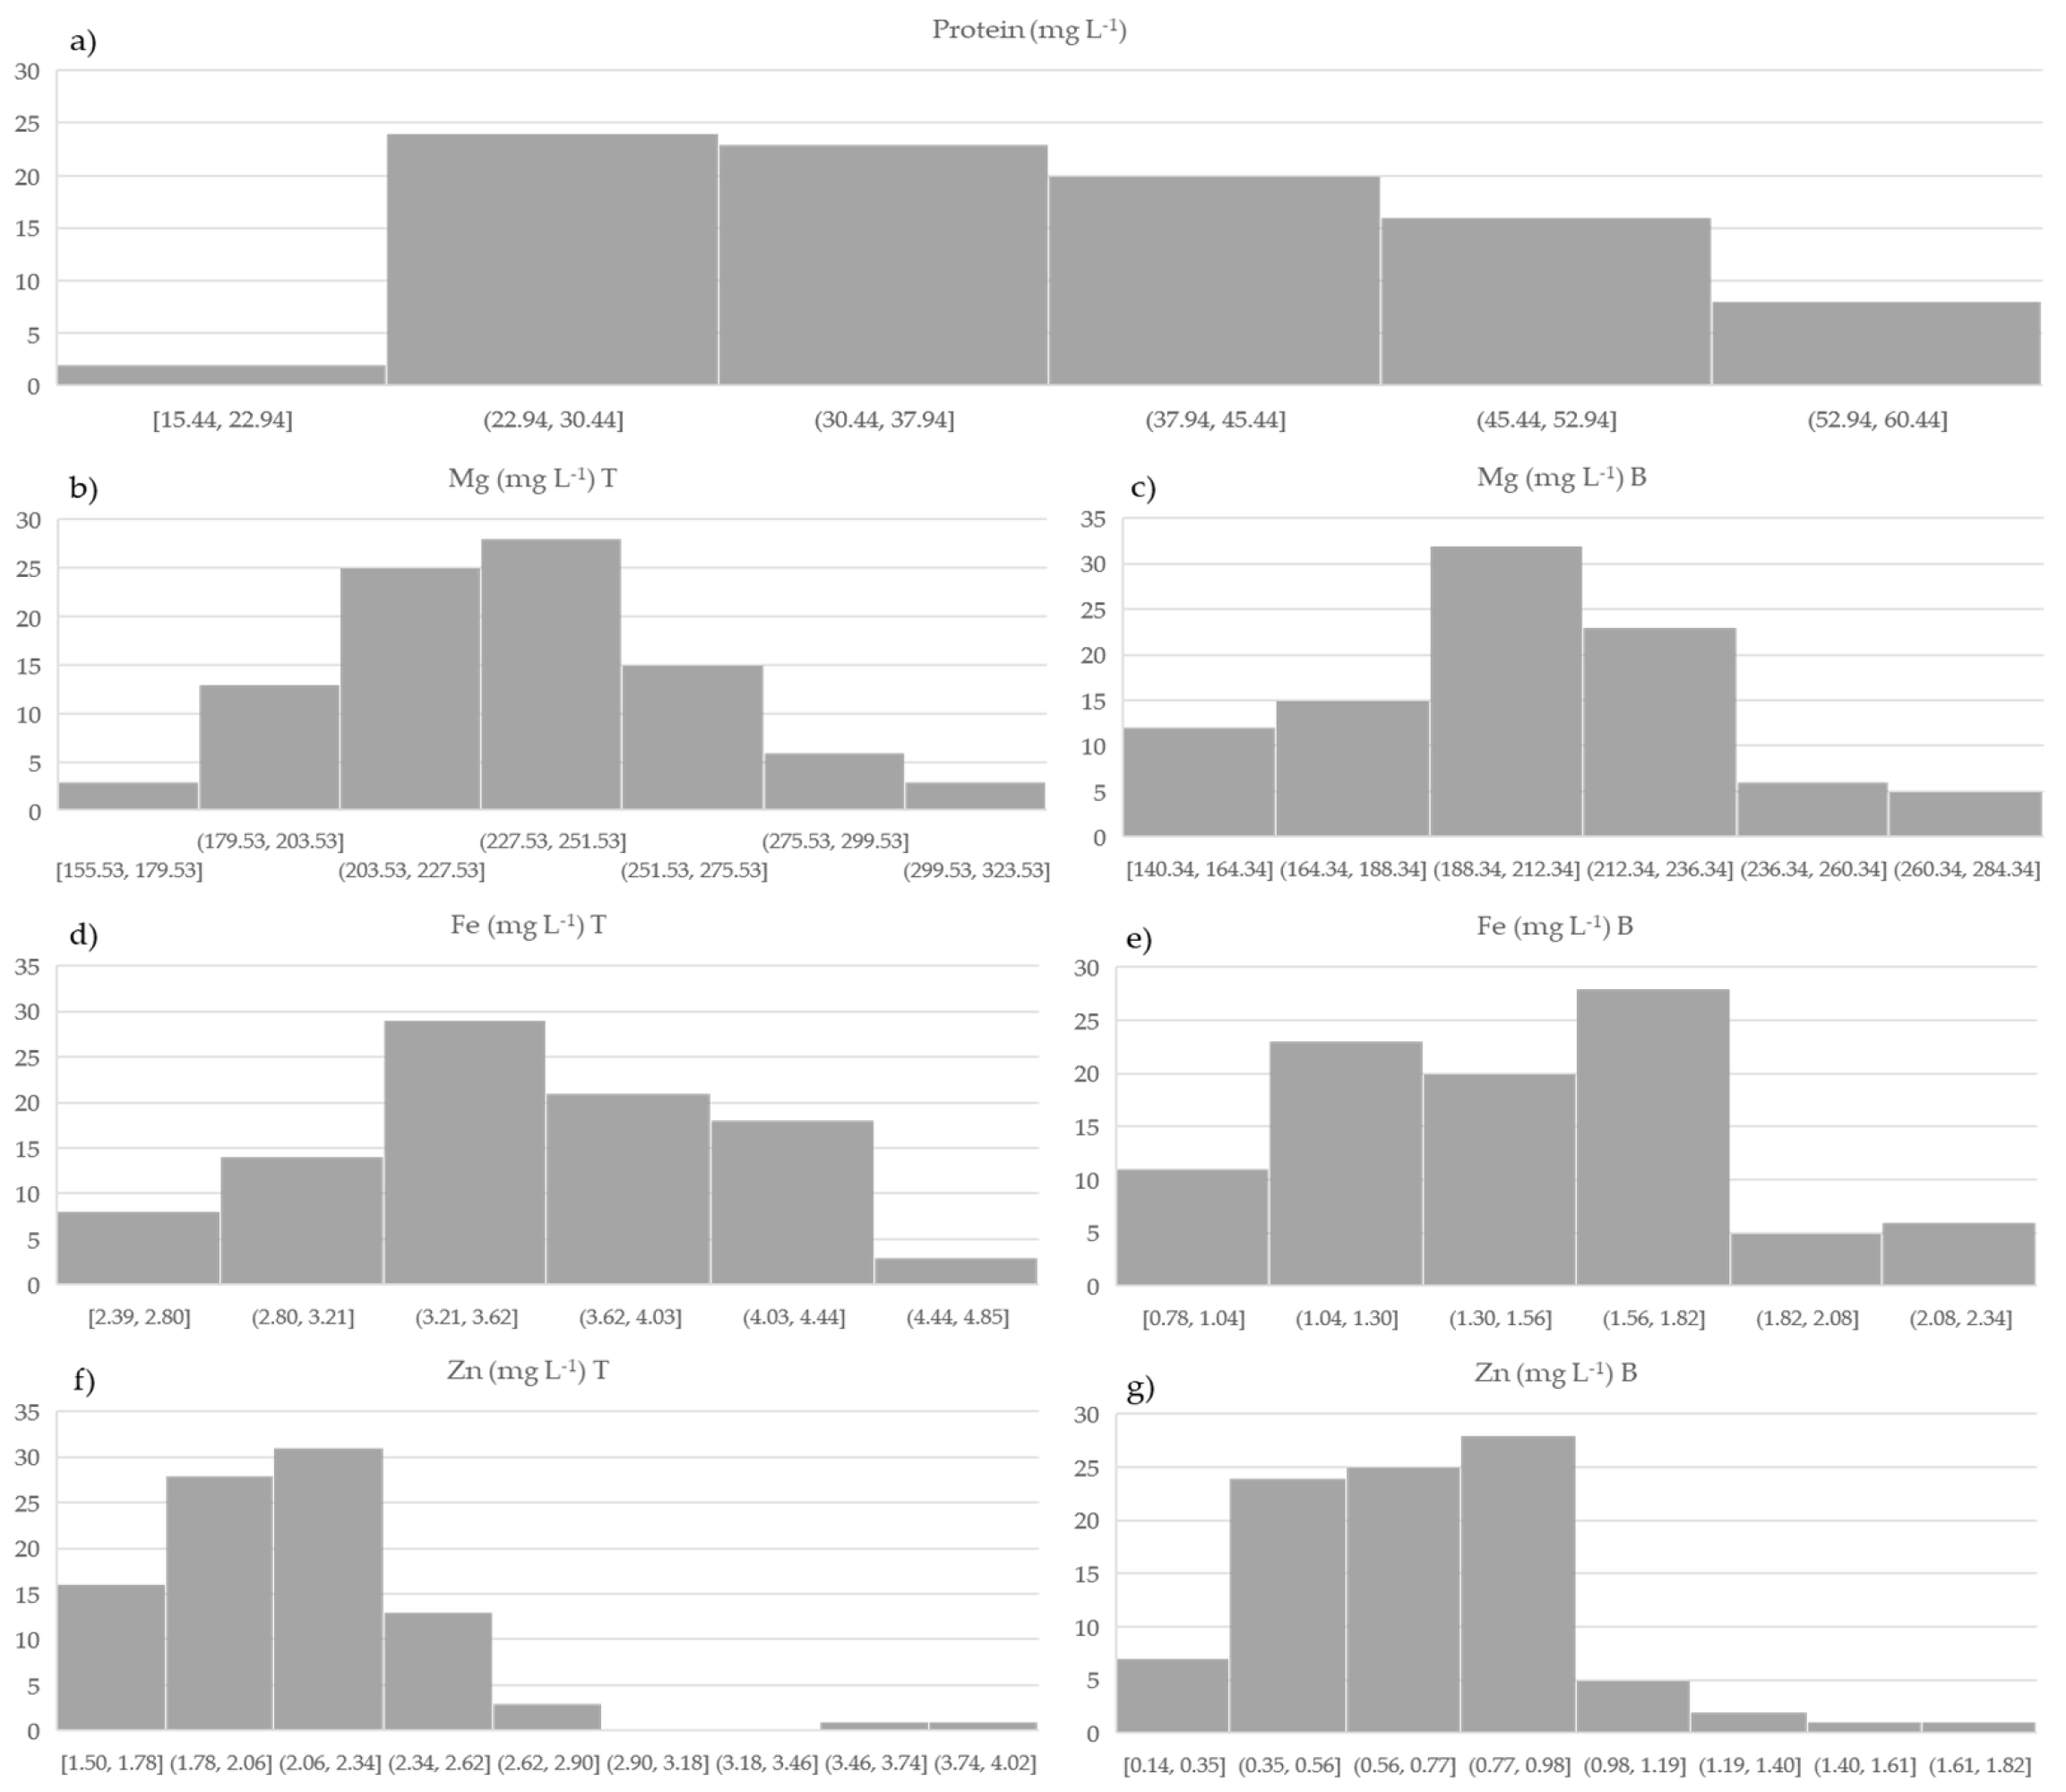
3.2. Variation in Total Protein and Total and In Vitro Bioavailable Concentration of Mg, Fe, and Zn in Wheatgrass Juice

Among 93 wheat genotypes, the total protein concentration in wheatgrass juice (WGJ) varied 3.86-fold between the lowest and highest determined value (Figure 3). The lowest variability in examined germplasm was determined for total (1.97-fold) and in vitro bioavailable (1.97-fold) Mg concentration. The variability in Fe concentration in wheatgrass juice was higher in in vitro bioavailable Fe (2.79-fold) than in total Fe (1.99-fold). The largest variability was determined for in vitro bioavailable Zn concentration that varied 12.21-fold while the variability of Zn total concentration was more similar to the variability of other elements (Figure 3). One-way ANOVA was carried out to identify and confirm variation among wheat genotypes for protein and micronutrient content in wheatgrass juice. All micronutrient concentration, total and bioavailable, showed highly significant differences (p < 0.01) between genotypes, and protein content significantly varied at p < 0.05 (Table S2).
As in the previous constellation plot, the hierarchical clustering of wheat genotypes was performed using the centroid method. The traits used for clustering were protein and total and in vitro bioavailable Mg, Fe, and Zn concentration in wheatgrass juice.
The constellation plot (Figure 4) is divided into 10 clusters which corresponds to 10 different colors. Again, a large cluster with 77 wheat genotypes was separated, and the second largest cluster has 5, followed by a cluster with 3 and a cluster with 2 genotypes (Table S4). Six genotypes are separated as individual clusters. A cluster of 77 genotypes has mean values for all traits analyzed, which correspond to the average of the germplasm (Table S4). The Pesma (SRB) genotype was isolated as a single-genotype cluster mainly due to its 35% lower protein concentration, 17% lower total concentration, and 60% lower bioavailable Zn concentration compared to the mean. The Simonida genotype (SRB) was also isolated as a single−genotype cluster because it had a protein concentration 40% higher than mean, while the other traits were at or slightly below mean value. The four genotypes that differed most from the other genotypes in this study were Dekan (GER) and the accessions T. spelta (WR), T. diccocoides (WR) and T. monococcum (WR). What these genotypes have in common is a below mean protein concentration (23% Dekan to 59% T. spelta) and an above mean total (26% Dekan to 80% T. moncoccum) and in vitro bioavailable (47% Dekan to 2.44-fold T. dicoccoides) Zn concentration compared to the mean value of the germplasm. In addition, the accession T. monococcum has a 33% and 44% higher total and in vitro bioavailable Fe concentration compared to the mean value of the examined germplasm (Table S6).

4. Discussion

Ensuring healthy and safe food for a growing population while preserving biodiversity is a major challenge in times of constant climate change. The diversification of food sources through well-known and well-adapted crops such as wheat could become an important goal. Modern wheat breeding focuses primarily on high-yielding genotypes and not on the nutritional value of the grain and especially the other parts of the wheat plant such as the leaves and consequently juice or powder. Therefore, the diversity of genotypes/cultivars and nutritional quality are of crucial importance. Little has changed in wheat breeding over the last 50 years. High yields and resistance to plant diseases are still the main objectives, but the shift towards a multidisciplinary breeding approach, which also includes nutritional quality, has become evident [24].
Numerous studies have confirmed that the accumulation of minerals in wheat grain is a genotypic trait [25,26] that correlates with yield and thousand grain weight [27]. There is evidence for natural variation in nutrient concentration in grains, which is predominantly genetically controlled with relatively little environmental influence [28], as well as for an additive gene effect for Fe and a dominance and double epistasis for grain Zn [29]. Wild relatives of wheat have been found to exhibit a wide range of genetic variability for many desirable traits under abiotic stress [30] while having high concentrations of Fe and Zn in the grain [31]. Others suggest that grain Fe and Zn concentrations can be improved simultaneously due to their positive correlations [15,32]. A similar variability in grain Fe and Zn concentration was observed between the modern genotypes and the wild relatives in this study (Figure 1) was reported [15] among 150 bread wheat genotypes, where mean Zn concentration was 21.4 mg kg−1, with a range of 13.5 to 24.5 mg kg−1, while the mean Fe concentration was 38.2 mg kg−1, with a range of 28.8 to 50.8 mg kg−1, whereas the mean values in wild relatives were similar, ranging from 21.1 to 22.9 mg kg−1.
Compared to modern wheat varieties, wild emmer wheat showed a higher variation in Zn and Fe concentration [31,32]. High Fe and Zn concentrations were consistently found in the accessions T. monococcum and T. dicoccoides genotypes and landraces of bread wheat [33,34,35]. In addition, some studies showed the potential of Aegilops sp. to improve micronutrient content in wheat grain [36]. The accession T. dicoccoides received attention as the species is a valuable source of genetic variation related to the accumulation of micronutrients, especially Zn and Fe [37,38,39]. In this study, the wild relative accession T. sphareococcum was separated as a single cluster genotype due to the highest grain protein content, highest grain Zn concentration, and highest grain phytate concentration (Table S5). The accessions T. dicoccoides and T. spelta were separated into two genotype clusters due to a 27% higher Mg concentration in the grain than the mean (Table S3). The most conspicuous single−cluster genotypes (Figure 1) in the group of modern wheat genotypes were French Festival with low phytate and the highest grain Fe concentration (37% above the mean), the Croatian genotype Ana with the highest Mg concentration, and the accession T. dicoccoides with the highest grain Fe concentration (37% above the mean).
The hypothesis of a relationship between ploidy level and seed micronutrient content was refuted, indicating that einkorn, emmer, and spelt generally have higher levels of Mg, Fe, and Zn than cultivated species. No correlation between ploidy level and grain micronutrient content has been reported, whilst there is evidence of that the best sources for improving the human nutritional quality of wheat species in terms of Cu, Mg, Ca, and Zn content are found in Aegilops sp., while Triticum sp. could be a source of higher Fe content [40].
Apart from the mineral composition of the grain itself, there is very little information on the concentration of specific minerals in wheatgrass juice, and particularly its in vitro bioavailable concentrations. Recent publications on the nutritional value of wheatgrass juice have been conducted on a small number of wheat genotypes and have focused primarily on the determination of chlorophyll content, minerals, vitamins, and bioactive phytochemicals. In this study, the emphasis was on determining genotype variability in relation to the studied traits. As with grain, we found great variability in the traits studied in wheatgrass juice (Figure 3). Most striking was the difference between wild relatives and modern wheat genotypes. The accessions T. diccocoides, T. monoccocum, and T. spelta had significantly higher total and in vitro bioavailable Zn concentrations in the WGJ compared to the overall means (Table S6) and were separated as individual genotype clusters in the constellation plot (Figure 2).
Although the genotypes in the wild relatives group showed low protein content in wheatgrass juice, our study found high concentration of total Zn in grain, high concentration of total Zn in wheatgrass juice, and high in vitro bioavailability of Zn (Figure 3).
The identification of nutritional genomic regions with pleiotropic effects of GPC and mineral concentration suggests that the pyramided breeding method could be a way to select wheat lines with higher nutritional value [41,42]. In addition, some studies showed a negative correlation between protein and micronutrient concentration in the grain [43], suggesting that predicting the overall effect on Fe and Zn bioavailability may be difficult. Zinc and iron are essential components of metabolic enzymes found in many plant and animal protein compounds. It is known that the high bioavailability of Zn and other micronutrients is limited by various antinutrients, especially phytic acid and phytates. The low bioavailability of Zn can be associated with a higher phytate content [44].
Of the minerals examined, the lowest in vitro bioavailability was determined for Zn. The phytate concentration in wheat grain ranged from 3.62 to 21.24, a variation of almost 46%, while the concentration of in vitro bioavailable Zn in wheatgrass juice varied by 38% (Figure 3). Significant variability of phenolic content in the grain was found especially in accessions T. monococcum, T. dicoccoides, T. durum, and T. aestivum, suggesting that there are no clear differences in phenolic content between species due to the high variability [45]. Current approaches to improve the bioavailability of Zn are aimed at increasing the Zn concentration in cereals and flour and reducing Zn inhibitors. The X-ray fluorescence imaging has shown that Fe and Zn in aleurone are bound to phytic acid, suggesting that this mineral-phytate complex may pose a major challenge to bioavailability in the human diet [46]. Others suggest that enzymatic disruption and micromilling of the aleurone cell walls may increase the bioavailability of iron [47].

5. Conclusions

The main goals of this study were to determine variability of protein and mineral content in grain and wheatgrass juice and phytic acid content in grain. Presented results indicate that it is possible to select protein and mineral dense wheat genotypes. Also, this is the first report of high variability of total and in vitro bioavailable mineral concentrations in wheatgrass juice. Cluster analysis with 93 divergent wheat genotypes revealed ones that differed from the majority based on the examined traits, and the determined differences will facilitate further research on phenotype and gene correlations. That opens up the possibility of developing a breeding strategy with the aim of increasing the nutritional value of not just the grain but also wheatgrass. We suggest some of the wheat genotypes with favorable low phytate, high protein, and micronutrient concentrations for future breeding and biofortification programs.

Supplementary Materials

The following supporting information can be downloaded at: https://www.mdpi.com/article/10.3390/agronomy14020311/s1, Table S1: List of wheat genotypes, origin and registration year included in research (n = 93), Table S2: Mean values and LSD values of grain protein content, phytate, Mg, Fe, and Zn concentrations (mg kg−1) and mean values of wheatgrass juice protein, total and in vitro bioavailable Mg, Fe, and Zn (mg L−1) concentrations; Table S3: Cluster means for grain protein content, phytate, Mg, Fe, and Zn concentration; Table S4: Cluster means for wheatgrass juice protein and total and in vitro bioavailable Mg, Fe, and Zn concentration; Table S5: Genotypes that have been separated as independent clusters due to deviations in the examined traits (in grain) in comparison to the germplasm average; Table S6: Genotypes that have been separated as independent clusters due to deviations in the examined traits (in wheatgrass juice) in comparison to the germplasm average.

Author Contributions

Conceptualization, S.P. and A.R.; methodology, S.P. and S.G.Š.; validation, S.V. and A.R.; formal analysis, S.G.Š.; resources, S.P.; data curation, S.P. and A.R.; writing—original draft preparation, S.P.; writing—review and editing, S.P., S.G.Š. and A.R.; visualization, A.R.; supervision, S.V.; funding acquisition, S.P. and S.V. All authors have read and agreed to the published version of the manuscript.

Funding

This research was part of European Agricultural Fund for Rural Development (EAFRD) M10.2: Support for conservation and sustainable use and development of genetic resources in agriculture and the National program for the conservation and sustainable use of plant genetic sources for food and agriculture in the Republic of Croatia.

Data Availability Statement

The original contributions presented in the study are included in the article/Supplementary Materials, further inquiries can be directed to the corresponding author.

Conflicts of Interest

The authors declare no conflicts of interest. The funders had no role in the design of the study; in the collection, analyses, or interpretation of data; in the writing of the manuscript; or in the decision to publish the results.

References

  1. FAOSTAT. Food and Agriculture Organization of the United Nations FAOSTAT Database; FAOSTAT: Rome, Italy, 2021. [Google Scholar]
  2. Shewry, P.R.; Hey, S.J. The contribution of wheat to human diet and health. Food Energy Sec. 2015, 4, 178–202. [Google Scholar] [CrossRef] [PubMed]
  3. Padalia, S.; Drabu, S.; Raheja, I.; Gupta, A.; Dhamija, M. Multitude potential of wheatgrass juice (Green Blood): An overview. Chron. Young Sci. 2010, 1, 23–28. [Google Scholar]
  4. Sharma, S.; Shrivastav, V.K.; Shrivastav, A.; Shrivastav, B.R. Therapeutic potential of wheat grass (Triticum aestivum L.) for the treatmentof chronic diseases. South Asian J. Exp. Biol. 2013, 3, 308–313. [Google Scholar] [CrossRef]
  5. Mujoriya, R.; Bodla, R.B. A study on wheat grass and its nutritional value. Food Sci. Qual. Manag. 2011, 2, 1–8. [Google Scholar]
  6. Mathur, S.; Mathur, R.; Kohli, G.K. Therapeutic use of wheat grass juice for the treatment of anemia in young women of Ajmer city (Rajasthan, India). Int. J. Nutr. Sci. 2017, 2, 1014–1018. [Google Scholar]
  7. Lakshmeesha, D.R. Study to Assess the Efficacy of Wheatgrass Juice Therapy Intervention on Haemoglobin Level in Adolescent Anaemic Females. Indo Glob. J. Pharm. Sci. 2022, 12, 30–35. [Google Scholar] [CrossRef]
  8. Ben-Arye, E.; Goldin, E.; Wengrower, D.; Stamper, A.; Kohn, R.; Berry, E. Wheat grass juice in the treatment of active distal ulcerative colitis: A randomized double-blind placebo-controlled trial. Scand. J. Gastroenterol. 2002, 37, 444–449. [Google Scholar] [CrossRef]
  9. Bar-Sela, G.; Tsalic, M.; Fried, G.; Goldberg, H. Wheat grass juice may improve hematological toxicity related to chemotherapy in breast cancer patients: A pilot study. Nutr. Cancer 2007, 58, 43–48. [Google Scholar] [CrossRef]
  10. Avisar, A.; Cohen, M.; Brenner, B.; Bronshtein, T.; Machluf, M.; Bar-Sela, G.; Aharon, A. Extracellular Vesicles Reflect the Efficacy of Wheatgrass Juice Supplement in Colon Cancer Patients During Adjuvant Chemotherapy. Front. Oncol. 2020, 10, 1659. [Google Scholar] [CrossRef]
  11. Fatiukha, A.; Filler, N.; Lupo, I.; Lidzbarsky, G.; Klymiuk, V.; Korol, A.B.; Krugman, T. Grain protein content and thousand kernel weight QTLs identified in a durum× wild emmer wheat mapping population tested in five environments. Theor. Appl. Genet. 2019, 133, 119–131. [Google Scholar] [CrossRef] [PubMed]
  12. Peng, J.H.; Sun, D.; Nevo, E. Domestication evolution, genetics and genomics in wheat. Mol. Breed. 2011, 28, 281–301. [Google Scholar] [CrossRef]
  13. Longin, C.F.H.; Würschum, T. Back to the future–tapping into ancient grains for food diversity. Trends Plant Sci. 2016, 21, 731–737. [Google Scholar] [CrossRef] [PubMed]
  14. Garvin, D.F.; Welch, R.M.; Finley, J.W. Historical shifts in the seed mineral micronutrient concentration of US hard red winter wheat germplasm. J. Sci. Food Agric. 2006, 86, 2213–2220. [Google Scholar] [CrossRef]
  15. Zhao, F.J.; Su, Y.H.; Dunham, S.J.; Rakszegi, M.; Bedo, Z.; McGrath, S.P.; Shewry, P.R. Variation in mineral micronutrient concentrations in grain of wheat lines of diverse origin. J. Cereal Sci. 2009, 49, 290–295. [Google Scholar] [CrossRef]
  16. Pandey, A.; Khan, M.K.; Hakki, E.E.; Thomas, G.; Hamurcu, M.; Gezgin, S.; Gizlenci, O.; Akkaya, M.S. Assessment of genetic variability for grain nutrients from diverse regions: Potential for wheat improvement. SpringerPlus 2016, 5, 1912. [Google Scholar] [CrossRef]
  17. Marcos-Barbero, E.L.; Pérez, P.; Martínez-Carrasco, R.; Arellano, J.B.; Morcuende, R. Genotypic variability on grain yield and grain nutritional quality characteristics of wheat grown under elevated CO2 and high temperature. Plants 2021, 10, 1043. [Google Scholar] [CrossRef]
  18. Thakur, N.; Raigond, P.; Singh, Y.; Mishra, T.; Singh, B.; Lal, M.K.; Dutt, S. Recent updates on bioaccessibility of phytonutrients. Trends Food Sci. Technol. 2020, 97, 366–380. [Google Scholar] [CrossRef]
  19. Grubišić, S.; Orkić, V.; Guberac, S.; Lisjak, M.; Petrović, S.; Rebekić, A. Optimalan način sjetve pšenice (Triticum aestivum L.) za uzgoj pšenične trave. Poljoprivreda 2019, 25, 31–37. [Google Scholar] [CrossRef]
  20. Grubišić, S.; Kristić, M.; Lisjak, M.; Mišković Špoljarić, K.; Petrović, S.; Vila, S.; Rebekić, A. Effect of wheatgrass juice on nutritional quality of apple, carrot, beet, orange and lemon juice. Foods 2022, 11, 445. [Google Scholar] [CrossRef] [PubMed]
  21. Kingston, H.M.; Jassie, L.B. Microwave energy for acid decomposition at elevated temperatures and pressures using biological and botanical samples. Anal. Chem. 1986, 58, 2534–2541. [Google Scholar] [CrossRef]
  22. Bradford, M.M. A rapid and sensitive method for the quantitation of microgram quantities of protein utilizing the principle of protein-dye binding. Anal. Biochem. 1976, 72, 248–254. [Google Scholar] [CrossRef]
  23. Haugh, W.; Lantzsch, H.J. Sensitive method for the rapid determination of phytate in cereals and cereal products. J. Sci. Food Agric. 1983, 34, 1423–1426. [Google Scholar] [CrossRef]
  24. Fischer, T.R.A. History of wheat breeding: A personal view. In Wheat Improvement: Food Security in a Changing Climate; Reynolds, M.P., Braun, H.J., Eds.; Springer: Cham, Switzerland, 2022; pp. 17–30. [Google Scholar]
  25. Dubcovsky, J.; Lijavetzky, D.; Appendino, L.; Tranquilli, G. Comparative RFLP mapping of Triticum monococcum genes controlling vernalization requirement. Theor. Appl. Genet. 1998, 97, 968–975. [Google Scholar] [CrossRef]
  26. Sharma, R.; Crossa, J.; Ataei, N.; Lodin, R.; Joshi, A.K.; Vargas, M.; Braun, H.J.; Singh, R.P.; Bentley, A.R. Plant breeding increases spring wheat yield potential in Afghanistan. Crop Sci. 2021, 62, 167–177. [Google Scholar] [CrossRef]
  27. Govindan, V.; Atanda, S.; Singh, R.P.; Huerta-Espino, J.; Crespo-Herrera, L.A.; Juliana, P.; Mondal, S.; Joshi, A.K.; Bentley, A.R. Breeding increases grain yield, zinc, and iron, supporting enhanced wheat biofortification. Crop Sci. 2022, 62, 1912–1925. [Google Scholar] [CrossRef]
  28. Alomari, D.Z.; Eggert, K.; Von Wirén, N.; Polley, A.; Plieske, J.; Ganal, M.W.; Liu, F.; Pillen, K.; Röder, M.S. Whole-genome association mapping and genomic prediction for iron concentration in wheat grains. Int. J. Mol. Sci. 2018, 20, 76. [Google Scholar] [CrossRef] [PubMed]
  29. Amiri, R.; Bahraminejad, S.; Cheghamirza, K.; Arzani, A. Genetic analysis of iron and zinc concentrations in bread wheat grains. J. Cereal Sci. 2020, 95, 103077. [Google Scholar] [CrossRef]
  30. Zhang, H.; Mittal, N.; Leamy, L.J.; Barazani, O.; Song, B.H. Back into the wild—Apply untapped genetic diversity of wild relatives for crop improvement. Evol. Appl. 2017, 10, 5–24. [Google Scholar] [CrossRef]
  31. Çakmak, İ.; Torun, A.Y.F.E.R.; Millet, E.; Feldman, M.; Fahima, T.; Korol, A.; Nevo, H.J.; Özkan, H. Triticum dicoccoides: An important genetic resource for increasing zinc and iron concentration in modern cultivated wheat. Soil Sci. Plant Nutr. 2004, 50, 1047–1054. [Google Scholar] [CrossRef]
  32. Monasterio, I.; Graham, R.D. Breeding for trace minerals in wheat. Food Nutr. Bull. 2000, 21, 392–396. [Google Scholar] [CrossRef]
  33. Uauy, C.; Distelfeld, A.; Fahima, T.; Blechl, A.; Dubcovsky, J. A NAC gene regulating senescence improves grain protein, zinc, and iron content in wheat. Science 2006, 314, 1298–1301. [Google Scholar] [CrossRef] [PubMed]
  34. Erba, D.; Hidalgo, A.; Bresciani, J.; Brandolini, A. Environmental and genotypic influences on trace element and mineral concentrations in whole meal flour of einkorn (Triticum monococcum L. subsp. monococcum). J. Cereal Sci. 2011, 54, 250–254. [Google Scholar] [CrossRef]
  35. Velu, G.; Ortiz-Monasterio, I.; Singh, R.P.; Payne, T. Variation for Grain Micronutrients Concentration in Wheat Core-collection Accessions of Diverse Origin. Asian J. Crop Sci. 2011, 3, 43–48. [Google Scholar] [CrossRef]
  36. Kumar, A.; Kapoor, P.; Chunduri, V.; Sharma, S.; Garg, M. Potential of Aegilops sp. for improvement of grain processing and nutritional quality in wheat (Triticum aestivum). Front. Plant Sci. 2019, 10, 308–326. [Google Scholar] [CrossRef]
  37. Cakmak, I.; Ozkan, H.; Braun, H.J.; Welch, R.M.; Romheld, V. Zinc and iron concentrations in seeds of wild, primitive, and modern wheats. Food Nutr. Bull. 2000, 21, 401–403. [Google Scholar] [CrossRef]
  38. Peleg, Z.; Saranga, Y.; Yazici, A.; Fahima, T.; Ozturk, L.; Cakmak, I. Grain zinc, iron and protein concentrations and zinc-efficiency in wild emmer wheat under contrasting irrigation regimes. Plant Soil 2008, 306, 57–67. [Google Scholar] [CrossRef]
  39. Velu, G.; Ortiz-Monasterio, I.; Cakmak, I.; Hao, Y.; Singh, R.Á. Biofortification strategies to increase grain zinc and iron concentrations in wheat. J. Cereal Sci. 2014, 59, 365–372. [Google Scholar] [CrossRef]
  40. Bálint, A.F.; Kovács, G.; Erdei, L.; Sutka, J. Comparison of the Cu, Zn, Fe, Ca and Mg contents of the grains of wild, ancient and cultivated wheat species. Cereal Res. Commun. 2001, 29, 375–382. [Google Scholar] [CrossRef]
  41. Kartseva, T.; Alqudah, A.M.; Aleksandrov, V.; Alomari, D.Z.; Doneva, D.; Arif, M.A.R.; Borner, A.; Misheva, S. Nutritional Genomic Approach for Improving Grain Protein Content in Wheat. Foods 2023, 12, 1399. [Google Scholar] [CrossRef]
  42. Ma, J.; Ye, M.; Liu, Q.; Yuan, M.; Zhang, D.; Li, C.; Zeng, Q.; Wu, J.; Han, D.; Jiang, L. Genome-wide association study for grain zinc concentration in bread wheat (Triticum aestivum L.). Front. Plant Sci. 2023, 14, 1169858. [Google Scholar] [CrossRef] [PubMed]
  43. Brouns, F. Phytic acid and whole grains for health controversy. Nutrients 2021, 14, 25. [Google Scholar] [CrossRef] [PubMed]
  44. Jin, Y.; Ma, G.S. Bioavailability of phytic acid and minerals. Foreign Med. Sci. 2005, 32, 141–144. [Google Scholar]
  45. Shewry, P.R.; Hey, S. Do “ancient” wheat species differ from modern bread wheat in their contents of bioactive components? J. Cereal Sci. 2015, 65, 236–243. [Google Scholar] [CrossRef]
  46. De Brier, N.; Gomand, S.V.; Donner, E.; Paterson, D.; Smolders, E.; Delcour, J.A.; Lombi, E. Element distribution and iron speciation in mature wheat grains (Triticum aestivum L.) using synchrotron X-ray fluorescence microscopy mapping and X-ray absorption near-edge structure (XANES) Edwards imaging. Plant Cell Environ. 2016, 39, 1835–1847. [Google Scholar] [CrossRef]
  47. Latunde-Dada, G.O.; Li, X.; Parodi, A.; C., H.; Ellis, P.R.; Sharp, P.A. Micromilling enhances iron bioaccessibility from wholegrain wheat. J. Agric. Food Chem. 2014, 62, 11222–11227. [Google Scholar] [CrossRef]
Figure 1. Histograms of protein, phytate, Mg, Fe, and Zn concentration in wheat grain (n = 93); (a) phytate (mg kg−1): mean ± SD = 10.82 ± 4.94; CV = 45.6%; (b) protein content (%): mean ± SD = 13.29 ± 1.26; CV = 9.50%; (c) Mg (mg kg−1): mean ± SD = 1300 ± 133; CV = 10.2%; (e) Fe (mg kg−1): mean ± SD = 39.14 ± 6.55; CV = 16.70%; (d) Zn (mg kg−1): mean ± SD = 21.31 ± 5.03; CV = 23.60%.
Agronomy 14 00311 g001
Figure 2. Constellation plot of examined germplasm based on protein content, phytates, Mg, Fe and Zn concentration in grain.
Agronomy 14 00311 g002
Figure 3. Variability of protein and total and in vitro bioavailable concentrations (mg L−1) of Mg, Fe, and Zn in wheatgrass juice (n = 93); (a) protein (mg L−1): mean ± SD = 38.04 ± 9.70; CV = 25.50%; (b) Mg (mg L−1) T: mean ± SD = 235 ± 31.13; CV = 13.30%; (c) Mg (mg L−1) B: mean ± SD = 202 ± 30.9; CV = 15.20% (d) Fe (mg L−1) T: mean ± SD = 3.57 ± 0.52; CV = 14.70%; (e) Fe (mg L−1) B: mean ± SD = 1.45 ± 0.34; CV = 23.30%; (f) Zn (mg L−1) T: mean ± SD = 2.10 ± 0.37; CV = 17.50%; (g) Zn (mg L−1) B: mean ± SD = 0.70 ± 0.27; CV = 38.30%.
Agronomy 14 00311 g003
Figure 4. Constellation plot of examined germplasm based on protein concentration and total and in vitro bioavailable Mg, Fe, and Zn concentration in wheatgrass juice.
Agronomy 14 00311 g004
Disclaimer/Publisher’s Note: The statements, opinions and data contained in all publications are solely those of the individual author(s) and contributor(s) and not of MDPI and/or the editor(s). MDPI and/or the editor(s) disclaim responsibility for any injury to people or property resulting from any ideas, methods, instructions or products referred to in the content.

