Article

Integrated Bioinformatics and Multi-Omics Analyses Reveal Possible Molecular Mechanisms for Seed Starch Content Differences between Glycine max and Cicer arietinum

College of Plant Science and Technology, Huazhong Agricultural University, Wuhan 430070, China
*
Author to whom correspondence should be addressed.
Agronomy 2024, 14(2), 328; https://doi.org/10.3390/agronomy14020328
Submission received: 5 January 2024 / Revised: 27 January 2024 / Accepted: 3 February 2024 / Published: 4 February 2024
(This article belongs to the Section Crop Breeding and Genetics)

Abstract

:
Although soybean and chickpea belong to the legume family, their seed starch content is very different. Currently, many studies focus on the molecular mechanisms of starch synthesis within a single species. However, the key genes and regulatory relationships responsible for the difference in seed starch content between the two species remain unknown. To elucidate the molecular mechanisms responsible for the above difference, multi-omics and bioinformatics analyses were used here to analyze gene expression patterns, protein–protein interaction networks, gene-transcription factor co-expression networks, and miRNA–gene regulatory relationships based on reported sucrose and starch metabolic genes in Arabidopsis. The results were as follows. First, seven differential expression genes of the two species in starch synthesis metabolism, including GBSS1, APL3, APS1, SS2, PTST, SBE2, and ISA, and the starch degradation gene BMY in soybean and chickpea, may contribute to their seed starch content differences. Then, the protein–protein interaction between DPEs and PHS may facilitate seed starch synthesis in chickpea. Finally, the positive regulation of two starch degradation genes (GmBMY and GmPHS) and four sucrose metabolism genes (GmHXK, GmPFK, GmTPS, and GmFRK) by transcription factors may lead to lower seed starch content in soybean. This study elucidates the possible molecular mechanisms underlying the difference in seed starch content between the two species and addresses the scientific problem of why soybean seeds have lower starch content than chickpea seeds.

1. Introduction

Starch is an important form of stored nutrient in seeds. However, there are significant differences in seed starch content between soybeans and chickpeas in the legume family. For example, soybean seeds contain less than 2% starch, whereas chickpea seeds have a high starch content ranging from 40% to 60% [1,2]. Although there have been numerous studies on the molecular mechanisms of starch synthesis in plants [3,4], these studies have mainly focused on a single species. Therefore, the key genes and regulatory mechanisms underlying the differences in seed starch content between the two species remain largely unknown.
Sucrose plays an important role in providing carbon sources and acting as a temporary energy store during starch synthesis, and the expression and metabolic regulation of genes involved in sucrose metabolism directly affect starch accumulation [5]. Sucrose is the only form of long-distance carbohydrate transport in plants. As the main carrier between source and sink, sucrose transport and partitioning have significant effects on plant growth, development, and crop yield and quality [6]. Photosynthetic assimilates enter the vascular system primarily in the form of sucrose via the symplastic transport pathway and are subsequently offloaded via the apoplastic transport pathway. This process involves the combined action of sucrose transporters (SUT/SUC), sucrose transport proteins (STP), Sucrose Will Eventually be Exported Transporters (SWEET), and cell wall invertases (CWINV) [7]. In particular, high activity CWINV or its overexpression contributes to increased seed starch content [8,9]. Mutants of the bidirectional sucrose transporter SWEET show reduced seed starch content [10,11]. Sucrose enters the cytosol to form G-1-P by sucrose synthase (SUS) and UDP-glucose pyrophosphorylase (UGPase). Meanwhile, glucose and fructose enter the cytosol via hexokinase (HXK), fructokinase (FRK), phosphoglucomutase (PGM), and the phosphoglucose isomerase (PGI) to form G-1-P, which in turn forms the starch precursor ADPG via ADP-glucose pyrophosphorylase (AGP).
Starch synthesis is generally thought to start with the catalytic production of the precursor ADPG for starch synthesis by AGP [12]. G-6-P, G-1-P, and ADPG are transported to the amyloplast for starch synthesis and storage. Amylose is synthesized under the action of granule-bound starch synthase (GBSS) and protein targeting to starch (PTST), while soluble starch synthase (SS), starch-branching enzymes (SBEs), and starch-debranching enzymes (DBEs) work together to synthesize amylopectin [4,13]. Stored starch can be degraded by α-amylase (AMY), β-amylase (BMY), disproportionating enzymes (DPEs), and starch phosphorylase (PHS) [14,15,16]. Starch degradation is a critical process in plant growth and development, regulating the utilization and redistribution of carbon sources.
Plant starch synthesis is a complex biological process that is regulated by several transcription factors (TFs) and miRNAs. First, miR169 targets the disproportionating enzyme gene DPE2 [17], and miR809, miR1861, miR1436, and miR1862 target the starch synthesis enzyme gene SS [18,19]. Second, in sucrose metabolism, the transcription factors DOF11, MYB212, and bZIP72 regulate gene expression by directly binding to the promoter region of SWEET [20,21,22], and MYB21, ARF6, ARF8, AP3, and CRC regulate the expression of CWINV [23]. In starch metabolism, the transcription factors WRKY, ABI4, bZIP58, NAC019, MYB138, and MYB115 regulate the expression of several starch synthesis-related genes [24,25,26]. It should be noted that MYB138 and MYB115 regulate the expression of starch synthesis-related genes Du1/Wx and Ae1/Bt2, while the two TFs are negatively regulated by miR159k-3p [27], suggesting a coordinated regulation of starch synthesis genes by both miRNAs and TFs.
Seed starch content is a significant point of divergence between soybean and chickpea. Despite both belonging to the legume family, there is a notable lack of understanding regarding the key genes and regulatory relationships responsible for the difference in seed starch content between the two. This study aims to fill this knowledge gap by employing multi-omics and bioinformatics analyses to provide an in-depth exploration of the possible molecular mechanisms governing seed starch content in both species. Based on the sucrose and starch metabolism-related genes in Arabidopsis and in Cheng et al. [28], this study first used a comparative genomics approach to identify homologous sucrose and starch metabolism-related genes in cultivated soybean and cultivated chickpea. Then, multi-omics datasets from soybean and chickpea were used to investigate their expression patterns, protein interaction networks, the co-expression networks of the above genes and TFs, and the regulatory relationships between miRNAs and genes. Finally, these results were integrated into a regulatory network of genes, TFs, and miRNAs to reveal the possible molecular mechanisms behind the difference in seed starch content between soybean and chickpea. This study not only provides a research framework for molecular biology studies but also potential strategies for the genetic improvement of chickpea seed starch content.

2. Materials and Methods

2.1. Data Sources

2.1.1. Genomic and Proteomic Data

Four species are involved in this study: model plant Arabidopsis thaliana (L.) Heynh., low-starch legume Glycine max (L.) Merr., high-starch legume Cicer arietinum Linn., and high-starch crop Oryza sativa L. Their gene and protein sequences were obtained from JGI (https://phytozome-next.jgi.doe.gov/; accessed on 2 June 2023), with corresponding sequence version numbers Araport11 [29], Glycine max Wm82.a2.v1 [30], Cicer arietinum v1.0 [31], and Oryza sativa v7.0 [32].

2.1.2. Transcriptomic Data

Transcriptomic data for cultivated soybean Williams82 were downloaded from the Expression Atlas database (https://www.ebi.ac.uk/gxa/experiments/E-MTAB-4270; accession number E-MATB-4270; accessed on 5 June 2023), which contains Transcriptomic datasets from 25 different stages and tissues, including roots, shoots, leaves, flowers, and seeds [33]. Transcriptomic data for cultivated chickpea were obtained from the GEO database (https://www.ncbi.nlm.nih.gov/geo/; accession numbers GSE79719 and GSE79720; accessed on 5 June 2023), which includes Transcriptomic datasets from 16 different stages and tissues, including leaves and seeds [34].
The soybean datasets included six seed development stages of 3 weeks (R2), 4 weeks (R3), 5 weeks (R4), 6 weeks (R5), 8 weeks (R6), and 10 weeks (R7), while the chickpea datasets also included six seed development stages: S1 and S2 were the embryogenesis stages, S3 to S5 were the seed maturation stages, and S6 was the late maturation stage. Based on the definition of vegetative and reproductive growth stages in soybean [35] and chickpea [34], the six soybean seed development stages of R2 to R7 are consistent with the six chickpea seed development stages of S1 to S6. In order to compare the relative expression levels of genes, the six seed development stages were uniformly designated as stages t1 to t6.

2.1.3. TFs and miRNAs in Soybean and Chickpea

TFs for soybean and chickpea were downloaded from the PlantTFDB database (http://planttfdb.gao-lab.org/; accessed on 8 June 2023). Soybean miRNAs were obtained from the miRBase database (https://www.mirbase.org/; version 22.1; accessed on 8 June 2023), and chickpea miRNAs were obtained from Jain et al. [36].

2.1.4. Metabolomics Data of Soybean

As described in Han et al. [37], 249 non-target metabolites measured in seeds 55 days after flowering from 398 recombinant inbred lines (RILs) [38] were used in this study to indicate seed protein, oil, and starch content in soybean.

2.2. Identification of Sucrose and Starch Metabolism-Related Genes in Arabidopsis and Their Homologous Genes in Soybean and Chickpea

First, the genes related to sucrose and starch metabolism in Arabidopsis were extracted from Arabidopsis gene annotation files and the existing literature using the keywords glycolysis, sucrose synthesis, sucrose degradation, starch synthesis, starch degradation, and sucrose transport.
The OrthoFinder software (version 2.5.2) was then used to perform an all-versus-all sequence comparison among a total of 27,566 Arabidopsis, 55,589 soybean, 28,269 chickpea, and 42,004 rice protein sequences. The Markov clustering algorithm (MCL) was used to cluster the comparison results to obtain orthologous genes between Arabidopsis, soybean, chickpea, and rice [39]. Using the Arabidopsis genes associated with sucrose and starch metabolism identified in the first step, the genes associated with sucrose and starch metabolism in soybean, chickpea, and rice were filtered and selected.
Finally, the genes obtained in the first two steps were used as a reference to perform intra-species and inter-species BLASTP in soybean and chickpea. The makeblastdb command line was used to construct the soybean and chickpea databases with the “prot” database type. BLASTP comparisons were performed with an E-value threshold of 1 × 10⁻¹⁰ to filter out orthologous genes. This BLASTP comparison process was repeated to discover new intra- and inter-species genes until no additional genes were identified. In cases where input sequences had multiple transcripts due to alternative splicing, the longest transcript was selected. These genes were considered to be those associated with sucrose and starch metabolism in soybean and chickpea.

2.3. Temporal Expression Analysis of Genes Involved in Sucrose and Starch Metabolism in Soybean and Chickpea

STEM software (http://www.cs.cmu.edu/~jernst/stem/, version 1.3.13; accessed on 8 June 2023) was used to analyze gene expression data from different developmental stages. Parameter settings were as follows: (1) the number of trends was set to 30; (2) gene expression FPKM values were normalized as log2(Uti/Ut1), where Ut1 and Uti are the expression levels of the gene at the first and ith time points, respectively; (3) the probability threshold for significant trends was set to 0.05; (4) the minimum fold change for gene expression trends was greater than 2.

2.4. Differential Expression Analysis of Sucrose and Starch Metabolism-Related Genes in Soybean and Chickpea

As described in Zhang et al. [40], relative gene expression levels (RELs) were defined as the ratio of the gene expression level to the average expression level of all genes at different time points, and they were used to compare the average difference of RELs of the same gene family at the same time point between the two species using the t-test (p value < 0.05).

2.5. Analysis of Sucrose and Starch Metabolism-Related Protein Interactions in Soybean and Chickpea

All soybean/chickpea sucrose and starch metabolism-related protein sequences obtained in the identification of sucrose and starch metabolism-related genes were entered into the STRING database (https://cn.string-db.org/, version 11.5; accessed on 8 June 2023) using the “multiple sequences” option and the minimum required interaction score of 0.90 to construct a protein–protein interaction (PPI) network. The PPI results were imported into Cytoscape (version 3.10.0) [41], and the MCODE and CytoHubba plugins in Cytoscape were used to obtain subnetwork modules and core genes in the PPI network, respectively. The top value was set as the number of nodes in the subnetwork, and maximum clique centrality (MCC) scores were used to filter core genes, while other parameters were left at their default settings. Core PPIs were validated using the BioGRID 4.4 database (https://thebiogrid.org/; accessed on 8 October 2023) [42].

2.6. Co-Expression Network Analysis of Sucrose and Starch Metabolism-Related Genes in Soybean and Chickpea

Using gene expression FPKM values as an expression matrix, all sucrose and starch metabolism-related genes and TFs were used to perform unsupervised co-expression network analysis in soybean and chickpea using the R package WGCNA_1.70-3 [43]. The “signed” parameter was used to compute the unscaled topological overlap matrix (TOM), the “pickSoftThreshold” function was used to compute the optimal soft thresholds for soybean and chickpea, and the “signedKME” function was used to compute the KME values and filter the hub genes with ME > 0.8 and a minimum module size of 30. The resulting module was then imported into Cytoscape for gene network visualization.

2.7. Identification of Sucrose and Starch Metabolism-Related TFs and miRNAs in Soybean and Chickpea and Prediction of Their Target Genes

The PlantRegMap website (http://planttfdb.cbi.pku.edu.cn/; accessed on 8 October 2023) [44] was used to predict TF binding sites in the gene promoter region with a p-value threshold of <1 × 10⁻⁴. To validate these binding sites, these predicted binding sites were compared with the confirmed binding sites in the JASPAR database (https://jaspar.genereg.net/; accessed on 8 October 2023) using the Core parameter in the Collection. These validated TF binding sites were used to predict target genes using the FIMO software (version 5.5.4) [45]. If there was at least one binding site between the TF and the target gene, the gene was considered to interact with the TF.
All mature miRNA sequences in soybean and chickpea were uploaded to the psRNATarget website (https://www.zhaolab.org/psRNATarget/; accessed on 8 October 2023) to predict their target genes [46]; where the species of the cDNA library was soybean and chickpea, Expectation (e) = 3, and other parameters were default settings.
The miRNAs, TFs, and their target genes were combined with the core genes to obtain the TFs and miRNAs related to sucrose and starch metabolism. These TFs and miRNAs were used to construct a gene regulatory network related to sucrose and starch metabolism in soybean and chickpea.

2.8. KEGG Enrichment and GO Annotation Analysis

KOBAS-i (http://kobas.cbi.pku.edu.cn/; accessed on 8 October 2023) [47] was used to perform the KEGG analysis with a threshold of corrected p-value < 0.05 for significant pathways, eggNOG-mapper (http://eggnog-mapper.embl.de/; accessed on 8 October 2023) [48] was used to perform the gene function annotation analysis, and GOSlimViewer (https://agbase.arizona.edu/cgi-bin/tools/goslimviewer_select.pl; accessed on 8 October 2023) [49] was used to summarize the results of the function annotation analysis. All parameters were set by default.

2.9. Statistical Analysis

The relative expression levels of all genes in each gene family at the same seed development stage were used to identify differentially expressed genes between soybean and chickpea using the t-test at a 0.05 probability level. The relative expression levels of all genes in each species at six seed development stages were used to perform cluster analysis using STEM software (version 1.3.13) at a 0.05 probability level. All the genes in a co-expressed network and their TFs were used to perform KEGG analysis using the KOBAS-i website, and their corrected p-values were used to determine the significance of all the pathways at a 0.05 probability level.

3. Results

3.1. Identification of Sucrose and Starch Metabolism-Related Genes in Soybean and Chickpea

A total of 153,428 genes from soybean, chickpea, Arabidopsis, and rice were clustered into 21,453 orthogroups (OGs) using the MCL algorithm. Based on previous knowledge and gene annotations, 167 genes were found to be related to sucrose and starch metabolism in Arabidopsis, and these genes were used as an index. As a result, 95 out of 21,453 OGs were related to sucrose and starch metabolism in Arabidopsis, chickpea, soybean, and rice (Table S1).
Intra- and inter-species sequence comparisons identified 397 soybean and 218 chickpea sucrose and starch metabolism-related genes within 32 gene families (Table S2). These 32 gene families include sucrose synthesis-related genes such as SUS, SPS, and SPP, sucrose metabolism genes such as CWINV, HXK, UGP, PGI, PGM, FRK, TPS, TPP, PFK, PFP, PGD, and G6PD, starch synthesis genes such as APL, APS, GBSS, SS, SBE, ISA, PUL, and PTST, starch degradation genes such as DPE, AMY, BMY, and PHS, and transport-related genes such as SUC, SWEET, STP, GPT, and BT1.

3.2. Expression Trend Analysis of Sucrose and Starch Metabolism-Related Genes in Soybean and Chickpea

The standardized gene expression-level data from six stages of soybean and chickpea were used to perform gene expression trend analysis. A total of 615 genes related to sucrose and starch metabolism in soybean and chickpea were clustered into 29 clusters using STEM (Figure S1; Table S2). Six out of the 29 clusters, including 260 genes, showed significant expression trends (p-value < 0.05). Among the six clusters, profiles 9, 22, 21, and 6 showed upregulated expression during rapid nutrient accumulation and storage stages t3 to t5, while profiles 4 and 18 showed downregulated expression during stages t3 to t5. During these stages, 67 and 97 soybean genes related to sucrose and starch metabolism showed up- and downregulated expression, respectively, while 74 and 23 chickpea genes related to sucrose and starch metabolism showed up- and downregulated expression, respectively.
In soybean, a key gene GmAPL3 (Glyma.06G011700) for starch synthesis showed a highest REL of 8.38 at stage t2, and gradually decreased from stage t2 to t6. The trend was also found in the key genes GmAPS1 (Glyma.14G009300), GmPTST (Glyma.18G039800), GmGBSS1 (Glyma.07G049900), and GmSS2 (Glyma.13G062700), which have their highest RELs of 2.82, 0.66, 5.72, and 2.65 at stage t2, respectively. We found that GmSBE2 (Glyma.03G192300) and GmISA (Glyma.06G100600) had their highest RELs of 2.24 and 1.91 at stage t1. These results indicate that the peak expression level of these key genes in soybean starch synthesis occurs at the early stage of seed development (Table S3; Figure 1a). It should be noted that GmAPL3 showed the highest REL, possibly due to its catalytic role in the initial step of starch synthesis to obtain the direct substrate ADPG necessary for starch synthesis.
In chickpea, the key gene CaGBSS1 (Ca_03834) for starch synthesis had a highest REL of 105.38 at stage t5, which is 37 times higher than the REL of the soybean ortholog, GmGBSS1 (Glyma.07G049900) at the same time. This trend was also found for the key genes CaAPL3 (Ca_04774), CaAPS1 (Ca_07632), CaPTST (Ca_13297), CaSS2 (Ca_10512), CaSBE2 (Ca_00773), and CaISA1 (Ca_05882), which have their highest RELs of 14.13, 8.63, 0.69, 1.91, 5.08, and 3.17 at t5, respectively. These results indicate that the expression peak of these key genes involved in starch synthesis in chickpea occurs during the late stages of seed development (Table S3; Figure 1a).
We found that a key starch degradation gene, GmBMY1 (Glyma.06G301500), was highly expressed twice in soybean. The first was observed at stage t3 with a REL of 105.83, which is 22 times higher than the REL (4.84) of the chickpea ortholog CaBMY1 (Ca_22584) at the same time. The second was observed at stage t5 with a REL of 92.15, which is 50 times higher than the REL (1.85) of CaBMY1 at the same time (Figure 1a).

3.3. Differential Expression Analysis of Sucrose and Starch Metabolism-Related Genes in Soybean and Chickpea

By comparing the average RELs of each of the 32 gene families related to sucrose and starch metabolism between soybean and chickpea, significant differences were observed in SUS, HXK, PGM, FRK, TPP, STP, PTST, SS, PUL, AMY, and BMY between the two species (p-value < 0.05). Among these gene families, BMY, FRK, SUS, and STP showed significantly higher RELs in soybean than in chickpea, while AMY, HXK, PGM, PTST, PUL, SS, and TPP showed significantly higher RELs in chickpea than in soybean (Figure 1b). These eleven differentially expressed gene families showed different RELs at different stages of seed development, as described below.
GmBMY and CaBMY showed similar RELs at stages t1 and t2 in soybean and chickpea, but GmBMY showed a 7.5 times higher REL than CaBMY at stage t3 and a 9.4 times higher REL at stage t5. In addition, GmFRK, GmSUS, and GmSTP showed higher RELs at the early stages of seed development in soybean than CaFRK, CaSUS, and CaSTP in chickpea (Figure 1b).
A starch degradation gene CaAMY had the highest REL at stage t6. The key sucrose metabolism genes CaHXK, CaTPP, and CaPGM showed high RELs at the early stages of seed development, while CaHXK maintained a high REL at stage t6. In addition, the starch synthesis key genes CaPTST, CaSS, and CaPUL reached their highest RELs at stages t4, t5, and t6, respectively, while GmPTST, GmSS, and GmPUL reached their highest RELs at stage t2, with significantly lower RELs compared to chickpea (Figure 1b).

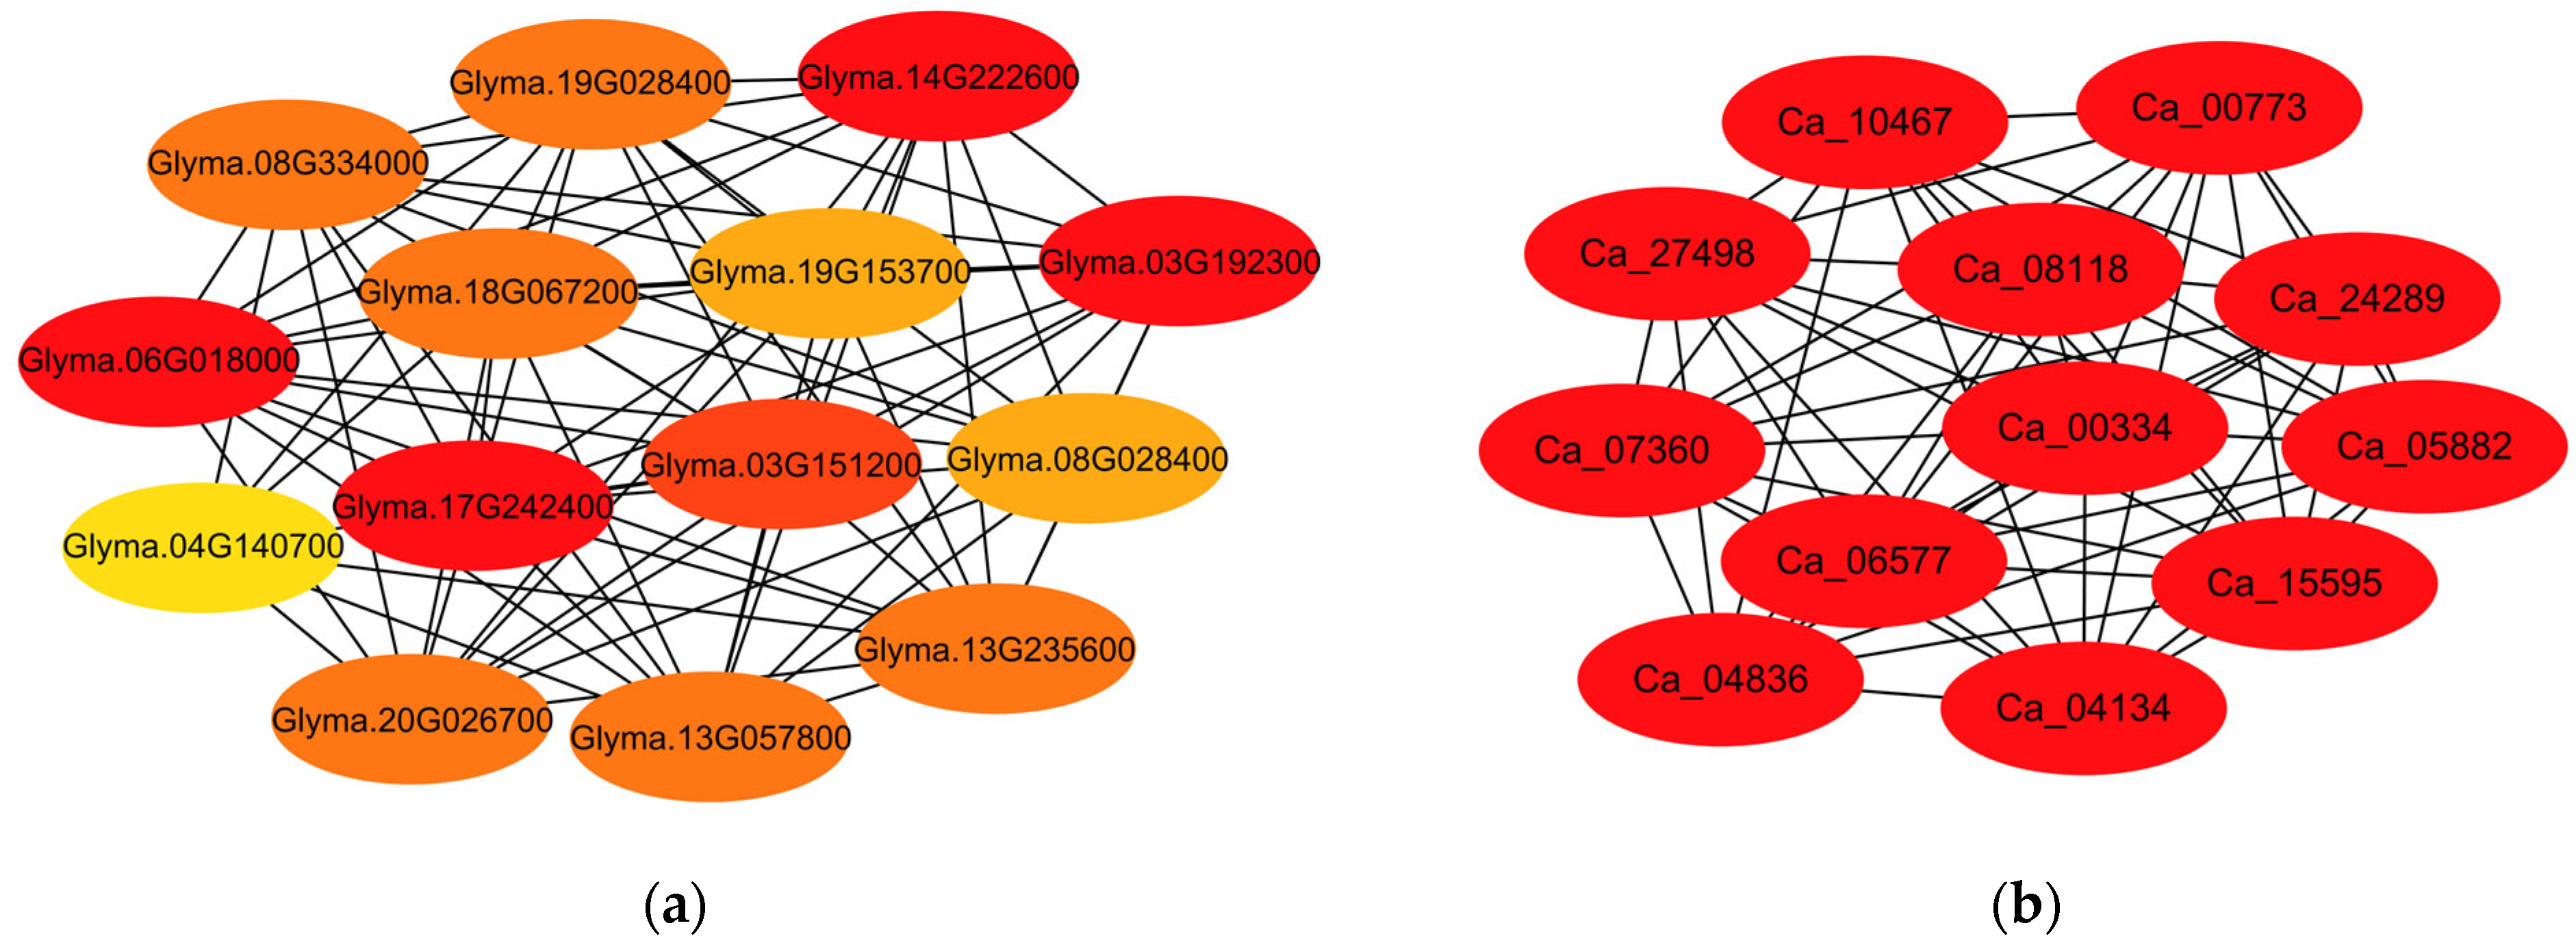
3.4. Interaction Analysis of Sucrose and Starch Metabolism-Related Proteins in Soybean and Chickpea

The above 397 soybean and 218 chickpea proteins related to sucrose and starch metabolism were used to construct PPI networks, and 1249 soybean and 398 chickpea PPI pairs were found (Table S4). In soybean, the 1249 PPI pairs formed four PPI subnetworks (Table S5). In subnetwork 1, the amylopectin synthesis and starch degradation proteins ISA, PHS, AMY, and SBE showed strong interactions. In subnetwork 2, amylopectin synthesis and starch degradation proteins SBE, DPE, ISA, AMY, PGM, and PUL showed strong interactions. In subnetwork 3, G6PD and HXK showed a strong interaction, promoting the flux of G6P into the pentose phosphate pathway and the formation of pyruvate involved in lipid and protein synthesis. In subnetwork 4, SS, PGM, GBSS, PGI, APS, and UGP have their functions in the early stages of starch synthesis, such as the synthesis of G-1-P and α-1,4-glycosidic bonds.
In chickpea, the 398 PPI pairs formed five PPI subnetworks (Table S5). In subnetwork 1, the amylopectin synthesis and starch degradation proteins DPE, PHS, ISA, SBE, and AMY showed strong interactions. In subnetwork 2, the sucrose metabolism and starch synthesis proteins PGI, UGP, and APS showed strong interactions. In subnetwork 3, PGD and G6PD showed a strong interaction, promoting the flux of G6P into the pentose phosphate pathway. In subnetwork 4, the sucrose metabolism and starch synthesis proteins GBSS, UGP, and SS showed strong interactions. In subnetwork 5, SUS and APL were involved in sucrose metabolism and starch synthesis, respectively.
In the soybean and chickpea PPI networks, PGM was found to interact with UGP1, UGP2, and SS4, while APS was found to interact with APL [50,51]. G6PD1 was found to interact with G6PD4 [52], HKL1 was found to interact with HXK1 [53,54], and GBSS was found to interact with PTST [55]. These PPIs have been experimentally validated in Arabidopsis. In the chickpea PPI network, the PPI between CaSS4 (Ca_05169) and CaPTST2 (Ca_05169) was predicted in chickpea and found in rice, where FLO6, the ortholog of CaPTST2, regulates starch synthesis by interacting with SSIVb and GBSS [56], indicating that the PPI between CaSS4 and CaPTST2 may regulate starch synthesis in chickpea.
In the soybean PPI network, Glyma.03G151200, Glyma.03G192300, Glyma.06G018000, Glyma.08G334000, Glyma.13G057800, Glyma.13G235600, Glyma.18G067200, Glyma.19G028400, Glyma.20G026700, and Glyma.19G153700 had the highest MCC scores. These core genes in the soybean PPI network were predicted to interact with Glyma.04G140700, Glyma.08G028400, Glyma.14G222600, and Glyma.17G242400 in PPI subnetwork 1, to be involved in amylopectin synthesis and degradation processes (Figure 2a).
In the chickpea PPI network, Ca_04134, Ca_06577, Ca_00334, Ca_10467, Ca_15595, Ca_07360, Ca_00773, Ca_04836, Ca_08118, and Ca_05882 had the highest MCC scores. These core genes in the chickpea network were predicted to interact with Ca_24289 and Ca_27498 in PPI subnetwork 1, to be involved in amylopectin synthesis and degradation processes (Figure 2b). It should be noted that two core genes encoding DPEs, Ca_04134 and Ca_08118, were found in the chickpea PPI network, rather than in the soybean PPI network, to interact with CaPHS, CaISA, CaSBE, and CaAMY. Meanwhile, PHS was found to interact with both DPE and SBE to form a PHS-DPE complex in rice starch synthesis [57,58].

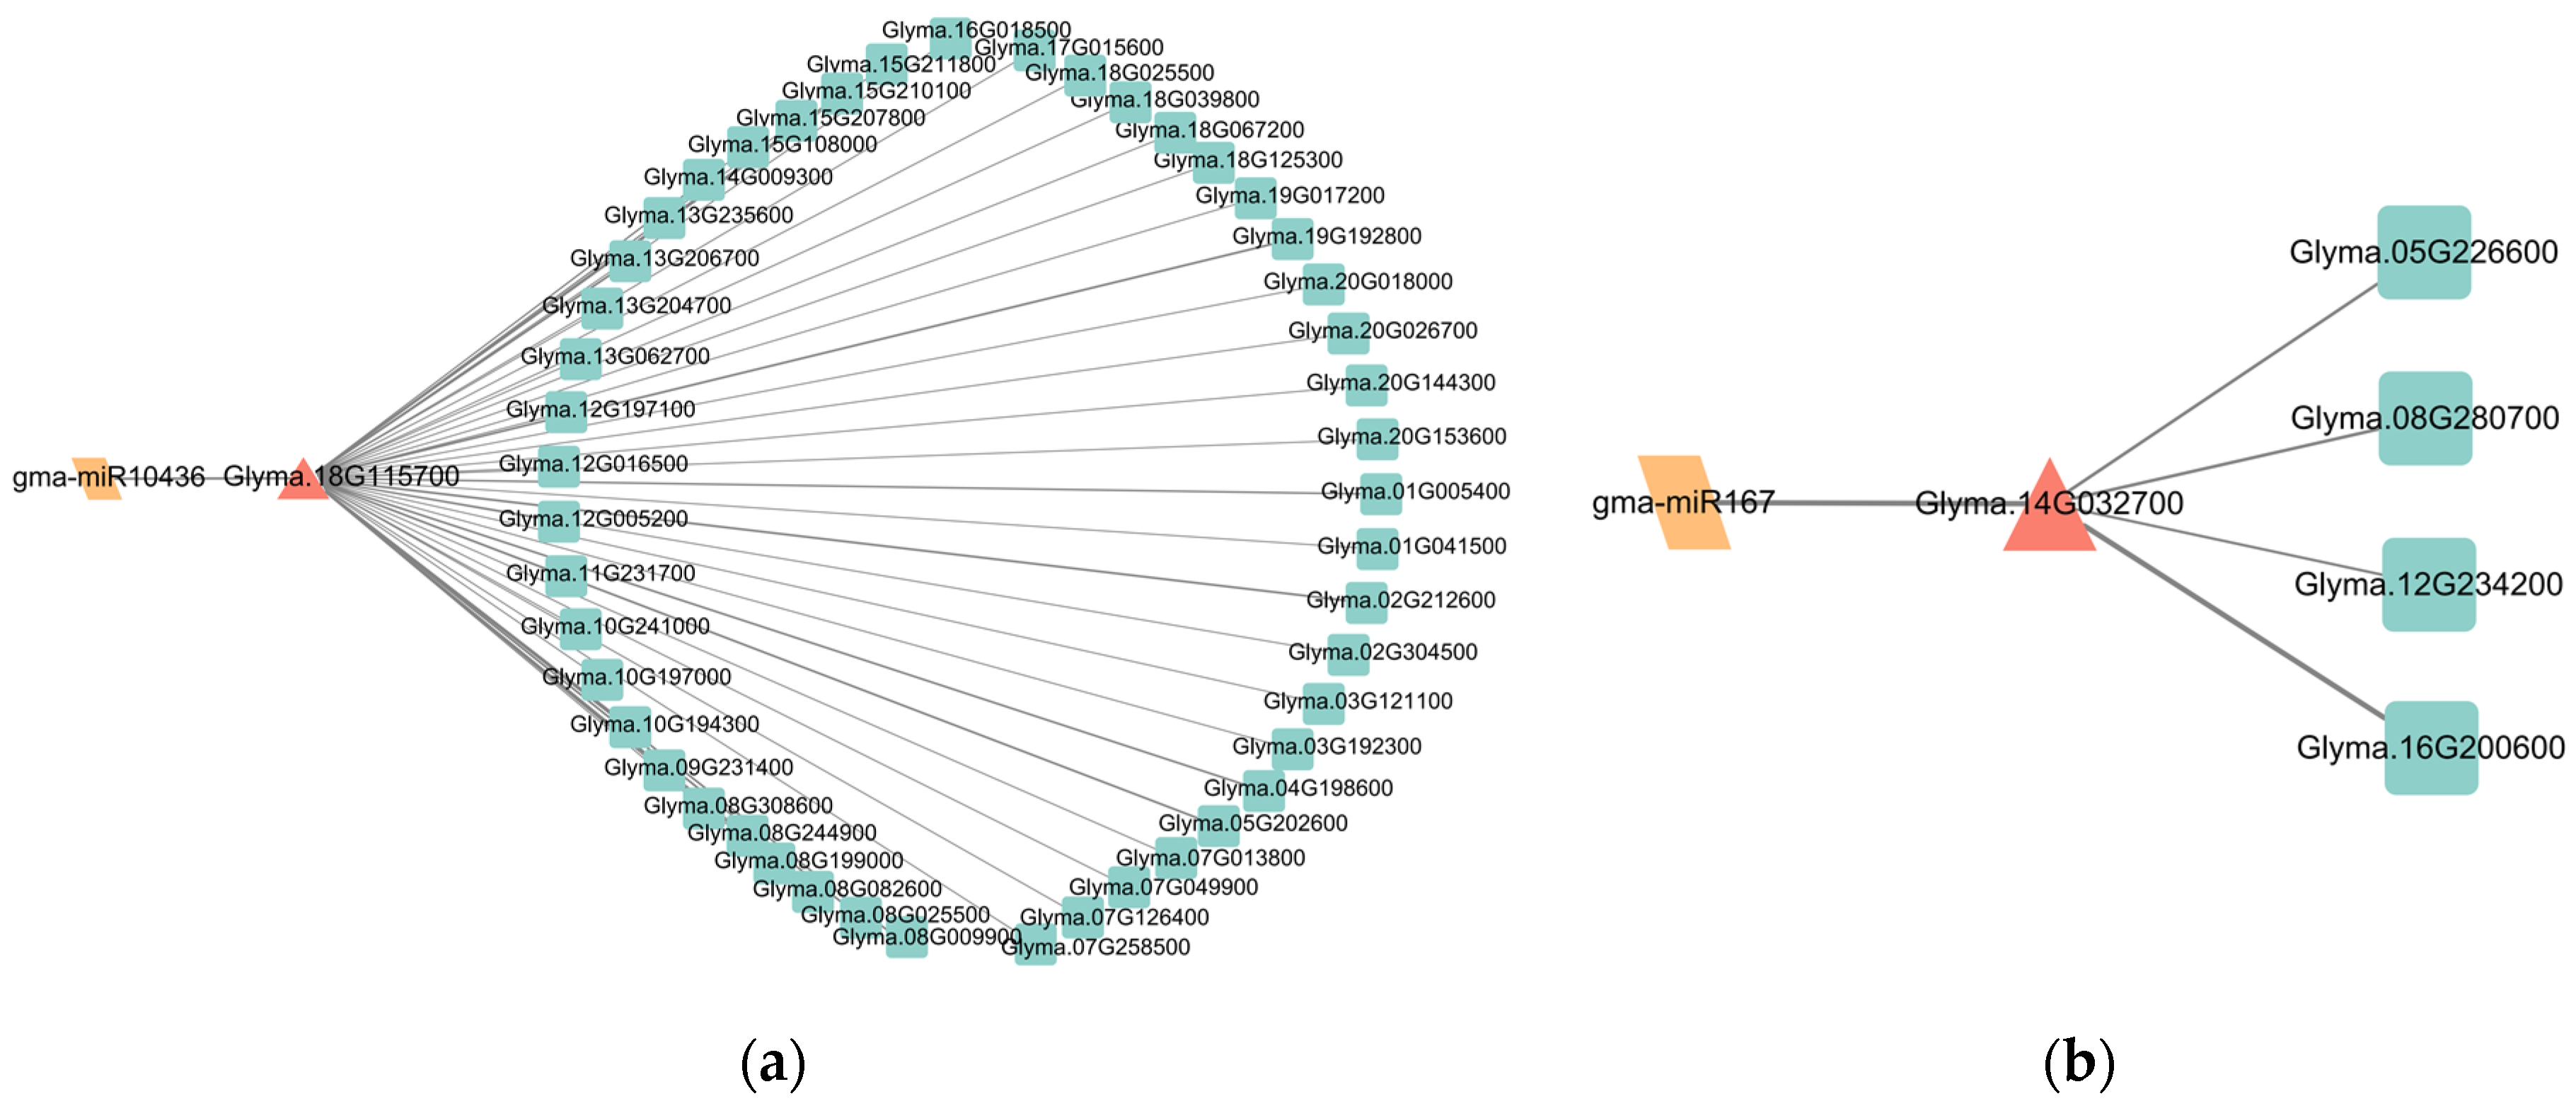
3.5. Identification of Sucrose and Starch Metabolism-Related miRNAs and Their Target Genes in Soybean and Chickpea

A total of 756 mature soybean miRNA sequences downloaded from the miRBase database were uploaded to psRNATarget to predict their target genes. As a result, 49 genes targeted by 38 miRNAs were identified to be related to sucrose and starch metabolism (Table S6). In detail, the sucrose metabolism genes GmCWINV, GmSWEET, GmSTP, GmSUS, GmSPS, GmUGP, GmFRK, GmPGI, and GmPGM were targeted by gma-miR396, gma-miR5672, gma-miR5369, gma-miR9746, gma-miR1510, gma-miR4359, gma-miR4415, gma-miR9724, and gma-miR1519, respectively. Meanwhile, the starch metabolism genes GmAPS, GmGBSS, GmSS, GmSBE, GmISA, GmPTST, GmAMY, and GmBMY were targeted by gma-miR5784, gma-miR5672, gma-miR2111, gma-miR1514, gma-miR172, gma-miR167, gma-miR10409, and gma-miR1513, respectively.
A total of 212 downloaded mature chickpea miRNA sequences were uploaded to psRNATarget to predict their target genes. As a result, 21 genes targeted by 17 miRNAs were identified to be related to sucrose and starch metabolism (Table S6). In detail, the sucrose metabolism genes CaSWEET, CaSTP, CaSPS, CaHXK, and CaFRK were targeted by Cat-miR5234, Cat-miR408, Cat-miR774, Cat-miR2089, and Cat-miR1862. Meanwhile, the starch metabolism genes CaAPL, CaGBSS, CaSBE, CaPTST, and CaBMY were targeted by Cat-miR479, Cat-miR166, Cat-miR1514, Cat-miR171, and Cat-miR172, respectively. In addition, these miRNAs also regulated other mRNAs and TFs. A total of 194 out of 1961 mRNAs targeted by 38 miRNAs were TFs in soybean, while 81 out of 1096 mRNAs targeted by 17 miRNAs were TFs in chickpea (Table S6). GO annotation analysis of these mRNAs showed that soybean and chickpea mRNAs were found to be involved in 44 common biological processes, including protein metabolism, lipid metabolism, carbohydrate metabolism, and others (Table S7). In addition, more starch synthesis-related genes targeted by miRNAs were identified in soybean than in chickpea, including key starch synthesis genes such as SS and ISA, which affect seed starch accumulation in soybean.

3.6. Co-Expression Analysis of Sucrose and Starch Metabolism-Related Genes and TFs in Soybean and Chickpea

Using weighted gene co-expression network analysis (WGCNA), 397 sucrose and starch metabolism-related genes and 2183 TFs in soybean were clustered into 19 co-expression modules (Figure S2a). KEGG analysis revealed that the genes in each of 18 co-expression modules, except for module 19, were significantly enriched in starch and sucrose metabolism pathways (Table S8). Nine out of ten core genes in the soybean PPI network were distributed in four co-expression modules. Among these modules, Glyma.06G018000 in module 2 (blue) was co-expressed with the TFs MYB, HD-ZIP, ERF, bHLH, GRF, SBP, TCP, ARF, AP2, NAC, and WRKY; Glyma.03G192300, Glyma.13G235600, Glyma.18G067200, and Glyma.20G026700 in module 7 (black) were co-expressed with the TFs MYB, Dof, bHLH, bZIP, AP2, ERF, HD-ZIP, SBP, MIKC_MADS, ARF, M-type_MADS, NF-YB, and TCP; Glyma.03G151200, Glyma.19G028400, and Glyma.19G153700 in module 9 (magenta) were co-expressed with the TFs bHLH, MYB, WRKY, Dof, bZIP, NAC, HD-ZIP, M-type_MADS, ERF, and AP2; and Glyma.08G334000 in module 17 (grey60) was co-expressed with the TFs ERF, MYB, and bZIP.
A total of 217 sucrose and starch metabolism-related genes and 744 TFs in chickpea were clustered into 7 co-expression modules (Figure S2b). KEGG analysis revealed that the genes in all the co-expression modules were significantly enriched in starch and sucrose metabolism pathways (Table S8). All ten core genes in the chickpea PPI network were distributed in four co-expression modules. Among these modules, Ca_06577 and Ca_08118 in module 1 (turquoise) were co-expressed with the TFs NAC, bHLH, MYB, ERF, Dof, WRKY, bZIP, MIKC_MADS, HD-ZIP, TCP, AP2, NF-YB, SBP, B3, and ARF; Ca_00334 in module 2 (blue) was co-expressed with the TFs Dof, MYB, AP2, ERF, HD-ZIP, NAC, bHLH, WRKY, B3, ARF, bZIP, MIKC_MADS, and NF-YB; Ca_04134, Ca_10467, Ca_07360, Ca_00773, Ca_04836, and Ca_05882 in module 3 (brown) were co-expressed with the TFs ARF, WRKY, ERF, AP2, HD-ZIP, NAC, MYB, bZIP, B3, M-type_MADS, bHLH, TCP, SBP, and MIKC_MADS; and Ca_15595 in module 4 (yellow) was co-expressed with the TFs ARF, MYB, ERF, bZIP, NAC, bHLH, TCP, Dof, GRF, NF-YB, and SBP.

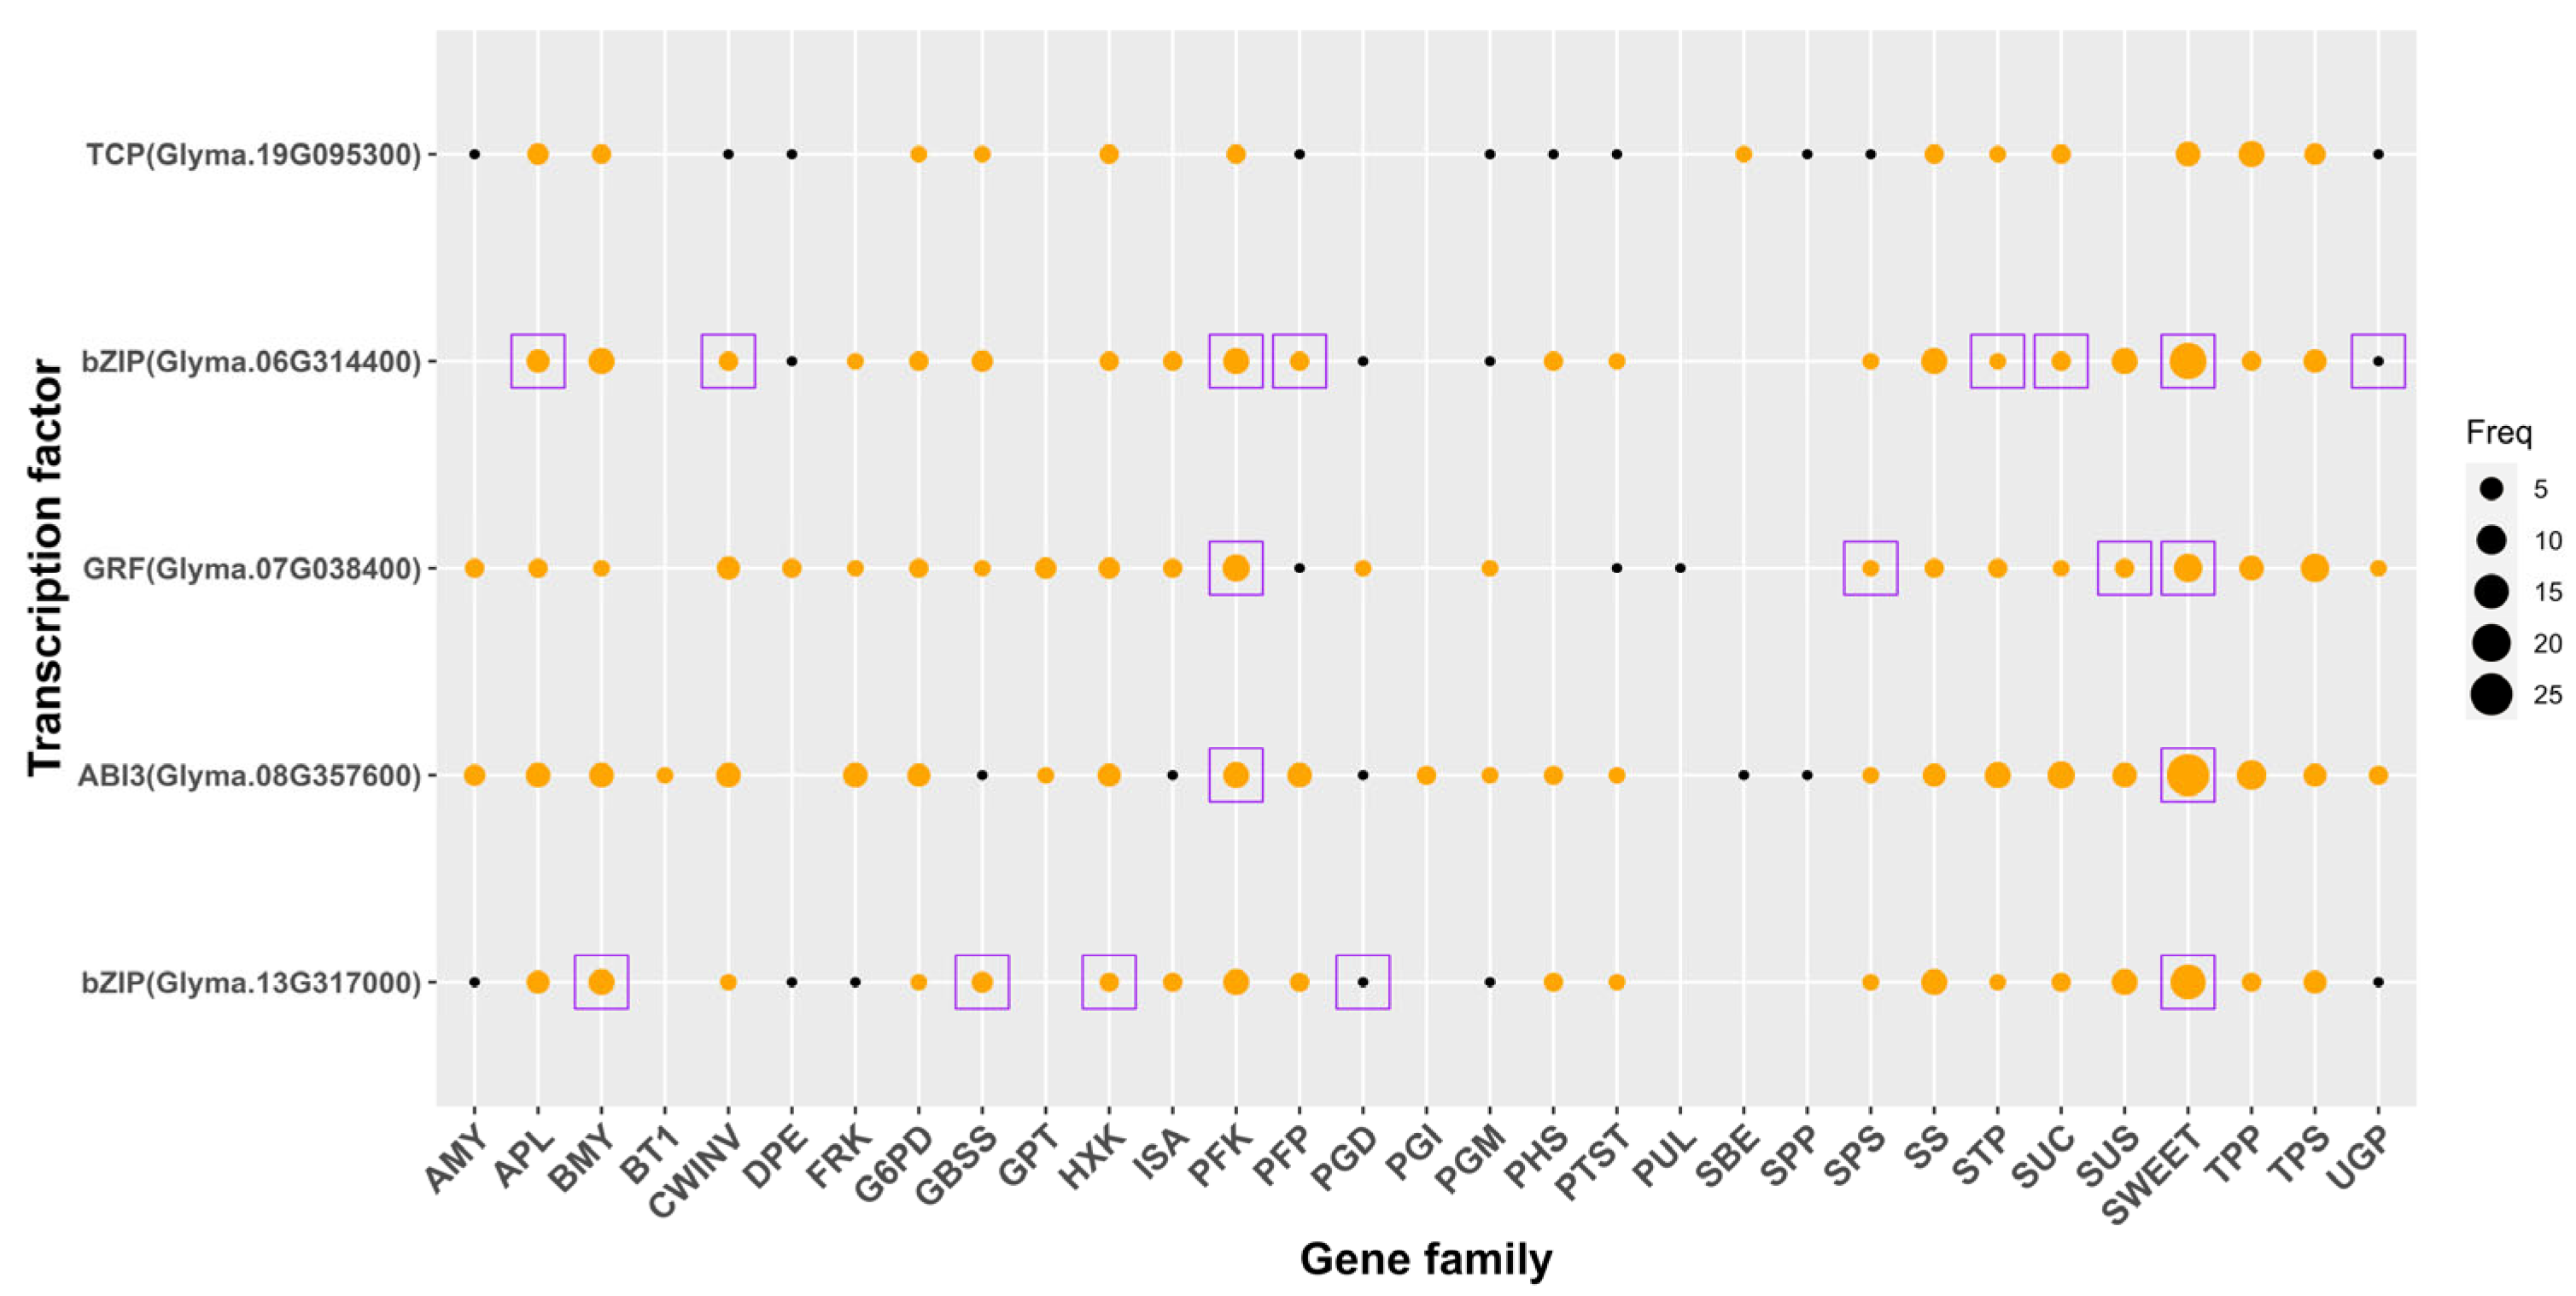
3.7. Identification of Sucrose and Starch Metabolism-Related TFs and Their Target Genes in Soybean and Chickpea

The promoter regions of seven core genes in the soybean PPI network have binding sites for TFs. For example, the promoter regions of GmISA (Glyma.03G151200), GmSBE (Glyma.03G192300 and Glyma.06G018000), and GmPHS (Glyma.08G334000, Glyma.18G067200, Glyma.19G028400, and Glyma.20G026700) had binding sites for bZIP, (HD-ZIP and MYB), and (ERF, bHLH, bZIP, and TCP), respectively (Table S9). These core genes may be positively regulated by the corresponding TFs.
The promoter regions of seven core genes in the chickpea PPI network have binding sites for TFs. For example, the promoter regions of CaDPE (Ca_04134 and Ca_08118), CaPHS (Ca_06577 and Ca_00334), CaISA (Ca_07360 and Ca_05882), and CaSBE (Ca_00773) had binding sites for (ERF and bZIP), (WRKY and MYB), (TCP and ERF), and MYB, respectively (Table S9). The above-mentioned core genes may be positively regulated by the corresponding TFs.
The motifs of five soybean TFs in the JASPAR database were found to be supported by experimental evidence, including Glyma.19G095300 (TCP) [59], Glyma.06G314400 (bZIP) [60], Glyma.07G038400 (GRF) [61], Glyma.08G357600 (ABI3) [62], and Glyma.13G317000 (bZIP) [63]. Using the FIMO website, the binding sites of the five TFs were used to match the promoter regions of soybean sucrose and starch metabolism-related genes in order to find potential TF target genes. All the results are shown in Figure 3, while no results were found for chickpea.

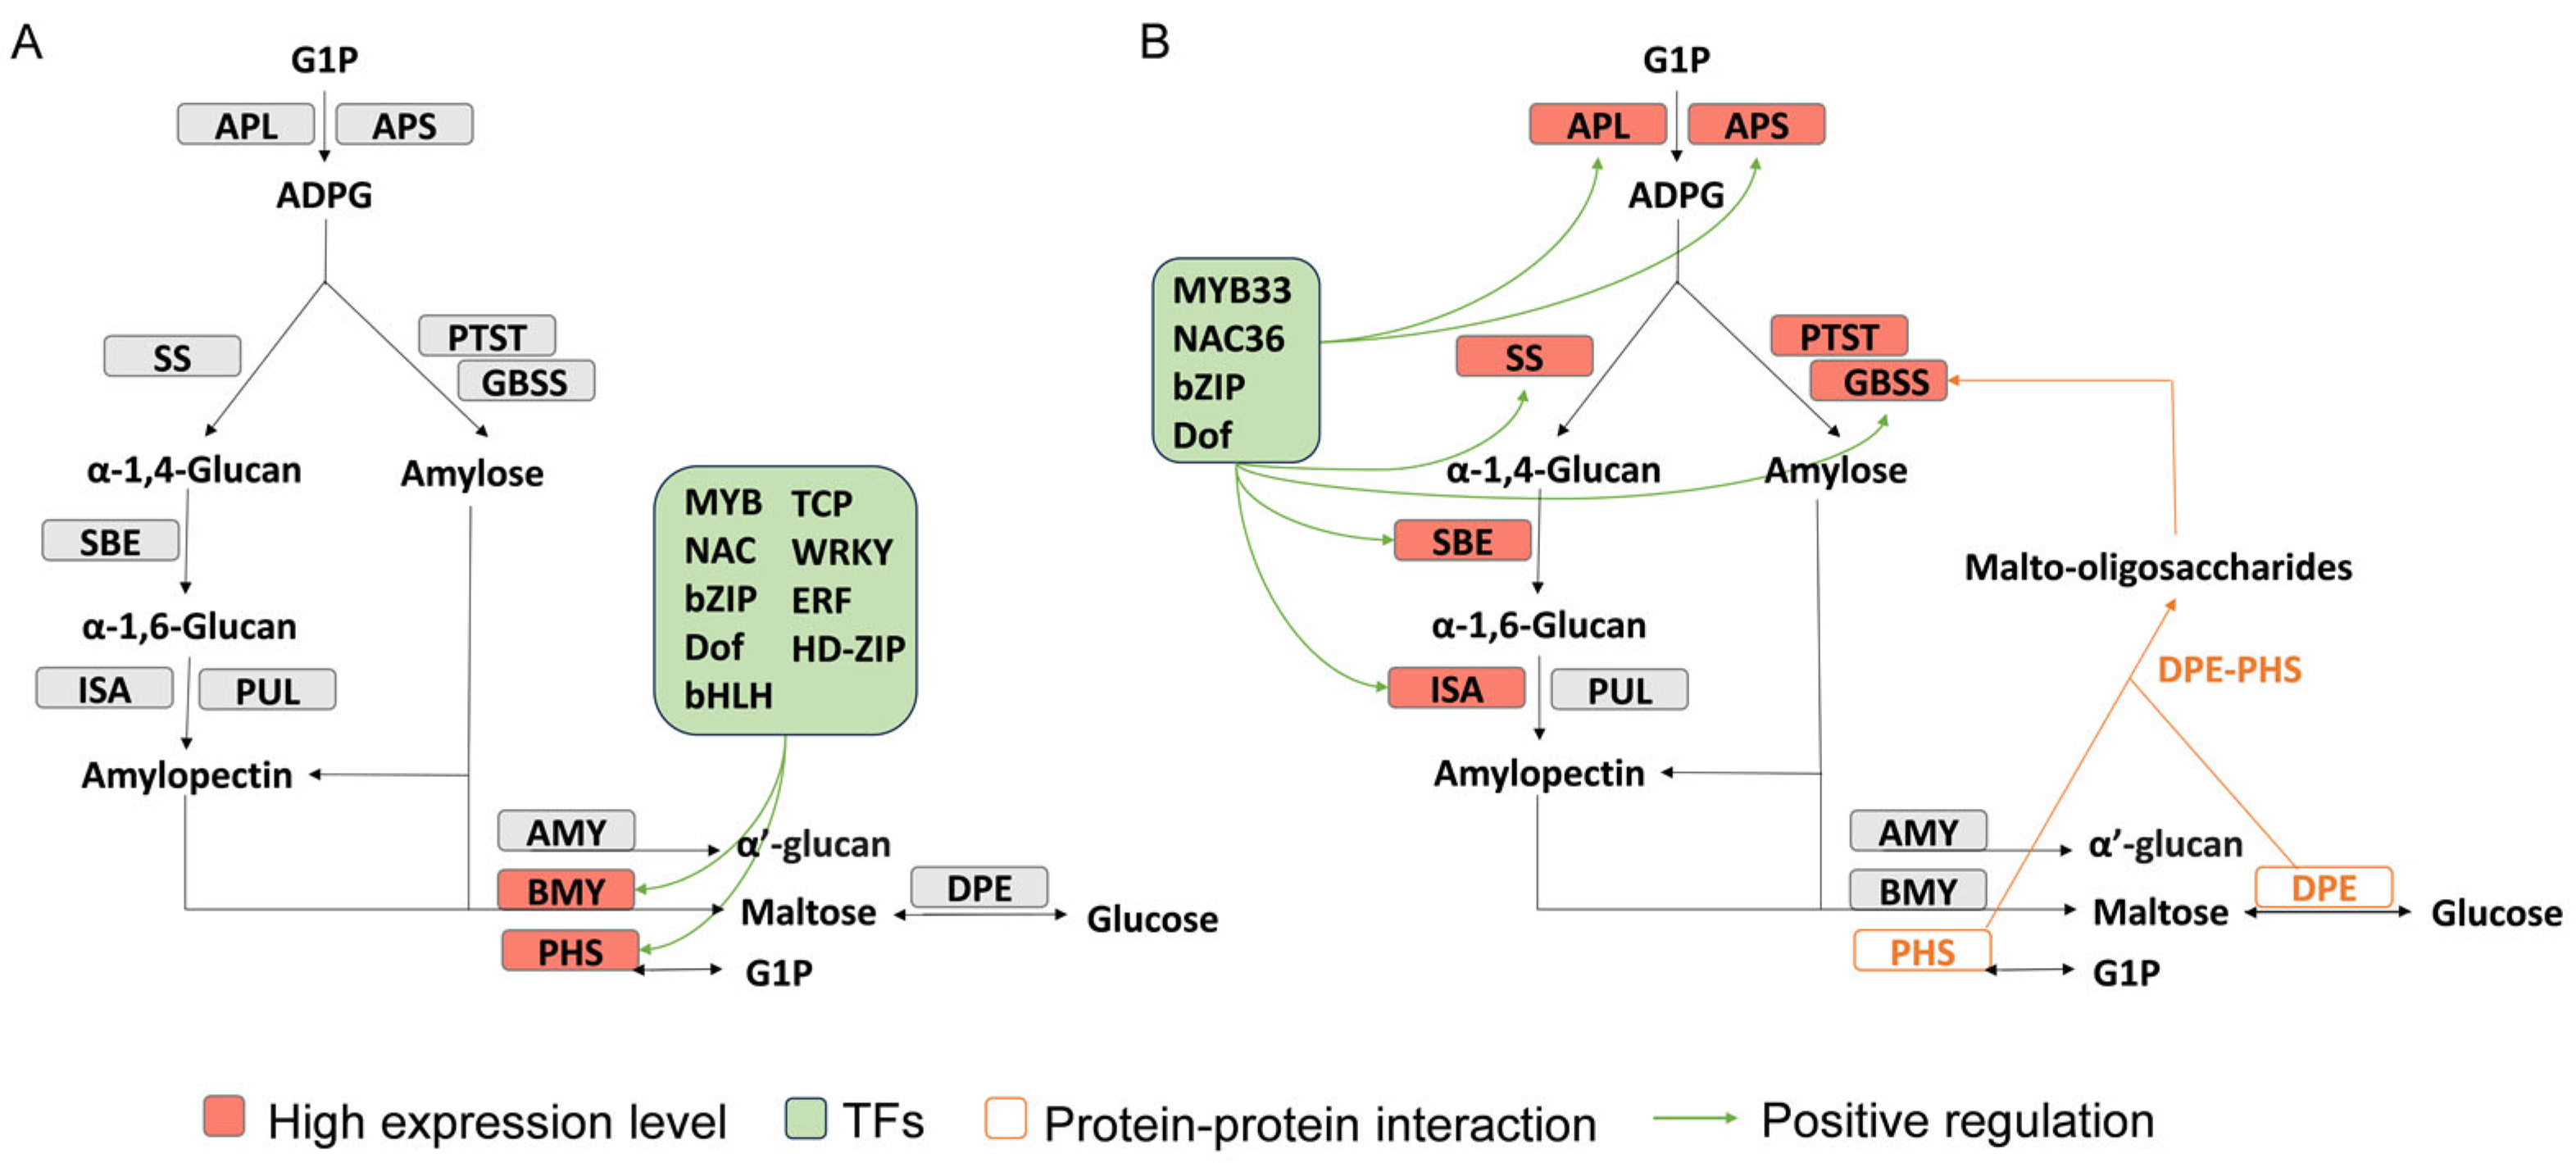
3.8. The Regulatory Network of Sucrose and Starch Metabolism-Related Genes in Soybean

We integrated miRNAs and TFs with their target genes related to sucrose and starch metabolism to construct a gene regulatory network. In soybean, gma-miR4351 regulated MIKC_MADS (Glyma.11G252300), which is co-expressed with GmSUC, GmSTP, GmSWEET, GmAPL, GmTPS, GmPFK, GmUGP, GmPFP, GmSUS, and GmCWINV. gma-miR10436 regulated bHLH (Glyma.18G115700), which is co-expressed with GmPFK, GmPTST, GmPGI, GmAPS, GmDPE, GmSBE, GmSWEET, GmG6PD, GmGBSS, GmAPL, GmBMY, GmSS, GmAMY, GmSPS, GmTPP, GmPUL, GmPGM, GmUGP, GmGPT, GmPHS, GmTPS, and GmSTP (Figure 4a). gma-miR167 regulated ARF (Glyma.14G032700), which is co-expressed with GmHXK (Glyma.05G226600), GmPFK (Glyma.08G280700), GmTPS (Glyma.12G234200), and GmFRK (Glyma.16G200600) (Figure 4b). gma-miR5674 regulated bZIP (Glyma.19G194500), which is co-expressed with GmPFK, GmPHS, GmSWEET, GmSUS, and GmSPS. gma-miR10440 regulated MYB (Glyma.14G074500), which is co-expressed with GmPFK (Glyma.09G161200). TFs regulated by miRNAs, together with their target genes, collectively form an miRNA–TF–sucrose and starch metabolism gene regulatory network.

4. Discussion

4.1. Different RELs of Starch Synthesis and Degradation-Related Genes in Soybean and Chickpea at the Nutrient Accumulation Stage May Lead to the Difference in Seed Starch Content between the Two Species

Gene expression pattern analysis revealed the difference in the expression levels of starch synthesis and degradation-related genes between soybean and chickpea (Figure 1 and Figure 5). On the one hand, the starch synthesis key genes such as APL3, APS1, SS2, SBE2, ISA, PTST, and GBSS1 had high RELs at the early stages of seed development (t1 and t2) in soybean, while these key genes had high RELs at the late stages of seed development (t5) in chickpea, which is the main stage of nutrient accumulation. In particular, CaGBSS1 had a 37-fold higher REL than GmGBSS1 at stage t5. On the other hand, a key starch degradation gene BMY1 in soybean had a 22-fold higher REL at stage t3 and a 50-fold higher REL at stage t5 than CaBMY1. In soybean, the high REL of BMY may lead to starch degradation at early stages, while the key starch synthesis-related genes were expressed at low RELs at the nutrient accumulation stage, possibly leading to lower seed starch content. In chickpea, the high REL of key starch synthesis-related genes may lead to starch synthesis at the nutrient accumulation stages, while a starch degradation gene, CaBMY1, was expressed at low levels, resulting in higher seed starch content in chickpea. The above results revealed the difference in seed starch content between the two species, and the evidence is described below.
First, Ohdan et al. [64] and Qu et al. [65] showed that the key starch synthesis genes, including APL, APS, SS, GBSS, SBE, and ISA, in crops with high seed starch content, such as rice and maize, exhibit high expressional levels at seed developmental stages. Subsequently, Yang et al. [66] showed that starch synthesis-related genes APL, SBE, DPE, ISA, SS, APS, PUL and GBSS had high expression levels in high-starch adzuki bean and gradually decreased expression levels in low-starch soybean during the maturation stages. Similar results were also found in low-starch and high-starch pea in Liu et al. [67]. Third, we observed that starch synthesis-related genes in chickpea are highly expressed in the later stages of seed development, which is consistent with the main stages (mid-to-late stages) of nutrient accumulation in Steven et al. [35], Garg et al. [34], and Cheng et al. [28]. This is more favorable for seed starch synthesis in chickpea. Fourth, Scheidig et al. [68] and Zeeman et al. [69] showed that BMY activity is positively correlated with the extent of starch degradation, while Andriotis et al. [70] found that reduced starch degradation rates in bmy mutants led to increased seed starch content in Arabidopsis. Finally, Cheng et al. [28] found that high expression levels of starch synthesis-related genes APS (Ca_07632), APL (Ca_04774), GBSS (Ca_22418), and SSII (Ca_10512) in chickpea during the rapid synthesis stages of storage materials, and high expression levels of starch degradation-related gene BAM during the soybean seed development stages, resulted in higher seed starch content in chickpea compared to soybean. This is consistent with our findings in this study.

4.2. DPE and PHS Interaction in Chickpea May Increase Higher Seed Starch Content

The interactions between the core genes DPE (Ca_04134 and Ca_08118) and PHS (Ca_10467, Ca_15595, Ca_06577, and Ca_00334) in the chickpea PPI network provide more substrates necessary for starch synthesis, thereby facilitating starch synthesis in chickpea seeds (Figure 2 and Figure 5), and the evidence is described below.
Hwang et al. [57] identified the interaction between PHS1 and DPE1 in pulldown experiments, which allows them to form a protein complex, PHS1-DPE1, to bind more substrates and facilitate the synthesis of maltotriose. The substrate maltotriose can synthesize amylose under the action of the enzyme GBSS in potato and Arabidopsis [71]. In our study, the interaction between PHS1 and DPE1 was also found in chickpea; meanwhile, the expression patterns of CaDPE1 (Ca_04134) and CaPHS1 (Ca_10467), being high expression levels at stages t5 and t6, are consistent with those of other starch synthesis-related genes in chickpea. This interaction was not found in soybean. Therefore, the interaction between DPE and PHS in chickpea may provide an additional pathway for starch synthesis, helping to explain high seed starch content in chickpea and low seed starch content in soybean.

4.3. miR167–ARF–Sucrose Metabolism Gene Pathway and TFs Positively Regulate Starch Degradation Genes BMY and PHS, Leading to Lower Seed Starch Content in Soybean

Liu et al. [72] showed that increased miR167 expression significantly decreased ARF transcript levels in rice, resulting in stunted plant growth and significantly reduced tillering, indicating that miR167 regulates ARF to decrease metabolic activity in rice. In our study, gma-miR167 was found, in the soybean gene regulatory network, to regulate ARF (Glyma.14G032700), which is co-expressed with the key sucrose metabolism-related genes GmHXK, GmPFK, GmTPS, and GmFRK (Figure 4b). Therefore, the miR167–ARF–genes-related sucrose metabolism pathway in soybean may promote carbon allocation after sucrose and starch degradation, and these degradation products may be used to synthesize fatty acids and amino acids.
Using the metabolomics data in Han et al. [37], we found that the content of sucrose metabolites (glucose, fructose, and sucrose) was lower than the content of protein metabolites (acetylserine) and fat metabolites (palmitic acid, stearic acid, linolenic acid, linoleic acid, oleic acid, serine, and pyruvic acid), which is consistent with the nutritional content in soybean seeds. Based on the expression patterns and regulatory relationships of soybean starch metabolism-related genes, it is speculated that stored starch in soybean is degraded to provide a carbon source for the synthesis of fatty acids and proteins, and the evidence is described below.
First, Ruuska et al. [73] showed that starch accumulated at early seed development stages in Arabidopsis disappeared later, and the degradation products were possibly used to synthesize oil and protein. Radchuk et al. [74] showed that the degradation products of stored starch in barley were used to synthesize stored proteins and lipids. Weigelt et al. [75] showed that inhibiting the expression of starch synthesis gene AGPase in peas resulted in reduced seed starch content and increased protein content. Kaushik et al. [76] showed that the energy required for metabolic activities during late seed development is primarily obtained from stored carbohydrates. This is reflected in the early expression of genes related to carbohydrate synthesis and the late expression of genes involved in catabolism. Therefore, starch degradation and inhibiting the expression of starch synthesis genes may decrease seed starch content and increase other nutrition contents.
Then, previous studies showed that Dof3 [77], MADS36 [78], bHLH6 [79], and bHLH137 [80] have been experimentally demonstrated to regulate BMY expression to promote starch degradation. In our study, starch degradation-related genes BMY and PHS were found to have high expression levels in soybean (Table S1), and GmBMY was positively regulated by MYB, NAC, bZIP, Dof, bHLH, TCP, WRKY, ERF, and HD-ZIP. Meanwhile, GmPHS was positively regulated by ERF, bHLH, bZIP, MYB, WRKY, HD-ZIP, and TCP (Figure 5), although there have been no references to the regulation of TFs for PHS [81]. In addition, Cheng et al. [28] discovered that the starch synthesis-related gene AGP was highly expressed in chickpea, and more starch biosynthesis genes were co-expressed with TFs in chickpea than in soybean, which may result in higher seed starch content in chickpea. Similarly, in this study, BMY and PHS showed high expression levels in soybean, and GmBMY and GmPHS had more co-expressed TFs, which may result in lower seed starch content in soybean.

4.4. Improvement Strategies to Enhance Starch Content in Chickpea Seeds

The starch content of chickpea seeds is around 40% to 60%. In some countries and regions, chickpea is often used as a staple food to provide starch [82], and its seed starch content has significant room for improvement. Based on the results of this study, we recommend the following genetic improvements to increase chickpea seed starch content.
The first suggestion is to overexpress starch synthesis-related genes such as CaAPL, CaAPS, CaGBSS, CaPTST, CaSS, CaSBE, and CaISA, whose homologues in rice have high expression levels at seed development stages (http://expression.ic4r.org/; accessed on 2 August 2023). Note that rice seeds have a remarkably high starch content, up to 90% [83]. Therefore, the overexpression of these genes in chickpea may promote starch synthesis, leading to increased seed starch content. The second suggestion is to edit or knock out CaAMY in order to prevent unnecessary starch degradation. This is because AMY is involved in starch degradation, and CaAMY (Ca_19257) has high expression levels in the later stage of seed development.
This study differs from Cheng et al. [28] in three ways. First, the objectives are different. Cheng et al. [28] investigated the molecular mechanisms underlying the differences in seed oil and starch content between soybean and chickpea, while this study only investigated the molecular mechanisms underlying the differences in seed starch content between soybean and chickpea. Then, their technical roadmaps are different. Cheng et al. [28] investigated this difference from the perspective of common and unique genes between soybean and chickpea species, while this study is based on genes related to sucrose and starch metabolism. Finally, this study provides some new results. Cheng et al. [28] found that ACCase, BAM5, AGPase, and WRI1 may be related to the difference between the two species, with high oil and low starch content in soybean seeds and high starch and low oil content in chickpea seeds. Although BAM5 (BMY) and AGPase were also found to be associated with low starch content in soybean seeds and high starch content in chickpea seeds, two new results were obtained in this study. One is that the key genes for starch synthesis have low RELs at the nutrient accumulation stage in soybean and high RELs in chickpea. The other is that the interaction between DPE and PHS may lead to high seed starch content in chickpea.

5. Conclusions

In soybean, the high-expression starch degradation gene GmBMY was positively regulated by Dof3, MADS36, bHLH6, and bHLH137, and the high-expression starch degradation gene GmPHS was positively regulated by ERF, bHLH, bZIP, MYB, WRKY, HD-ZIP, and TCP; starch synthesis key genes such as GmAPL3, GmAPS1, GmSS2, GmSBE2, GmISA, GmPTST, and GmGBSS1 had low RELs at the nutrient accumulation stages (t3~t5) of seed development in soybean; the miR167–ARF–sugar metabolism genes (GmHXK, GmPFK, GmTPS, and GmFRK) pathway facilitated carbon allocation after starch degradation, potentially contributing to low seed starch content in soybean. In chickpea, starch synthesis-related genes CaAPL, CaAPS, CaGBSS, CaPTST, CaSS, CaSBE, and CaISA showed a higher expression during the nutrient accumulation stages, and the interaction between DPE and PHS may provide an additional pathway for starch synthesis, potentially leading to high seed starch content in chickpea. The above results may provide genetic improvement strategies to increase seed starch content in chickpea: overexpressing starch synthesis-related genes and knocking out starch degradation related genes in chickpea. Through a comprehensive analysis in this study, we have successfully revealed the possible molecular mechanisms contributing to the difference in seed starch content between soybean and chickpea. This not only answers the scientific question of why soybean seeds have lower starch content compared to chickpea seeds, but also provides a solid reference and theoretical basis for future efforts to improve plant seed starch content.

Supplementary Materials

The following supporting information can be downloaded at: https://www.mdpi.com/article/10.3390/agronomy14020328/s1, Figure S1. Expressional trends of 615 genes related to sucrose and starch metabolism in soybean and chickpea. Figure S2. Co-expression modules of sucrose and starch metabolism related genes and transcription factors in soybean (a) and chickpea (b). Table S1. Ninty-five orthogroups related to sucrose and starch metabolism in Arabidopsis, chickpea, soybean, and rice. Table S2. Twenty-nine expressional trend clusters of 615 genes related to sucrose and starch metabolism in soybean and chickpea. Table S3. Thirty-two sucrose and starch metabolism related gene families and their relative expression levels in soybean and chickpea. Table S4. Protein-protein interaction (PPI) pairs related to sucrose and starch metabolism in soybean and chickpea. Table S5. The PPI subnetworks related to sucrose and starch metabolism in soybean and chickpea. Table S6. The miRNAs related to sucrose and starch metobolism and their targeted genes and transcription factors in soybean and chickpea. Table S7. GO annotation analysis of miRNAs targeted mRNAs and TFs in soybean and chickpea. Table S8. KEGG analysis of each co-expression modules in soybean and chickpea. Table S9. Transcription factor binding sites of core genes in the PPI networks of soybean and chickpea.

Author Contributions

Conceptualization, Y.Z. and Y.P.; methodology, Y.Z. and Y.P.; validation, Y.P.; formal analysis, Y.P., A.Z. and G.L.; data curation, Y.P.; writing—original draft preparation, Y.P.; writing—review and editing, Y.Z. and Y.P.; visualization, Y.P. and A.Z.; funding acquisition, Y.Z. All authors have read and agreed to the published version of the manuscript.

Funding

This research was funded by the National Natural Science Foundation of China (32070557; 32270673).

Data Availability Statement

Data are contained within the article and Supplementary Material.

Conflicts of Interest

The authors declare no conflicts of interest.

References

  1. Rachwa-Rosiak, D.; Nebesny, E.; Budryn, G. Chickpeas-composition, nutritional value, health benefits, application to bread and snacks: A review. Crit. Rev. Food Sci. Nutr. 2015, 55, 1137–1145. [Google Scholar] [CrossRef]
  2. Zhang, M.; Liu, S.; Wang, Z.; Yuan, Y.; Zhang, Z.; Liang, Q.; Yang, X.; Duan, Z.; Liu, Y.; Kong, F.; et al. Progress in soybean functional genomics over the past decade. Plant Biotechnol. J. 2022, 20, 256–282. [Google Scholar] [CrossRef]
  3. Zeeman, S.C.; Kossmann, J.; Smith, A.M. Starch: Its metabolism, evolution, and biotechnological modification in plants. Annu. Rev. Plant Biol. 2010, 61, 209–234. [Google Scholar] [CrossRef]
  4. Huang, L.; Tan, H.; Zhang, C.; Li, Q.; Liu, Q. Starch biosynthesis in cereal endosperms: An updated review over the last decade. Plant Commun. 2021, 2, 100237. [Google Scholar] [CrossRef]
  5. Ruan, Y.L. Sucrose metabolism: Gateway to diverse carbon use and sugar signaling. Annu. Rev. Plant Biol. 2014, 65, 33–67. [Google Scholar] [CrossRef] [PubMed]
  6. Wingler, A. Transitioning to the next phase: The role of sugar signaling throughout the plant life cycle. Plant Physiol. 2018, 176, 1075–1084. [Google Scholar] [CrossRef] [PubMed]
  7. Shen, S.; Ma, S.; Wu, L.M.; Zhou, S.L.; Ruan, Y.L. Winners take all: Competition for carbon resource determines grain fate. Trends Plant Sci. 2023, 28, 893–901. [Google Scholar] [CrossRef] [PubMed]
  8. Wang, E.; Wang, J.; Zhu, X.D.; Hao, W.; Wang, L.Y.; Li, Q.; Zhang, L.X.; He, W.; Lu, B.R.; Lin, H.X.; et al. Control of rice grain-filling and yield by a gene with a potential signature of domestication. Nat. Genet. 2008, 40, 1370–1374. [Google Scholar] [CrossRef] [PubMed]
  9. Li, B.; Liu, H.; Zhang, Y.; Kang, T.; Zhang, L.; Tong, J.H.; Xiao, L.T.; Zhang, H.X. Constitutive expression of cell wall invertase genes increases grain yield and starch content in maize. Plant Biotechnol. J. 2013, 11, 1080–1091. [Google Scholar] [CrossRef] [PubMed]
  10. Chen, L.Q.; Lin, I.W.N.; Qu, X.Q.; Sosso, D.; McFarlane, H.E.; Londoño, A.; Samuels, A.L.; Frommer, W.B. A cascade of sequentially expressed sucrose transporters in the seed coat and endosperm provides nutrition for the Arabidopsis embryo. Plant Cell 2015, 27, 607–619. [Google Scholar] [CrossRef] [PubMed]
  11. Li, P.; Wang, L.; Liu, H.; Yuan, M. Impaired SWEET-mediated sugar transportation impacts starch metabolism in developing rice seeds. Crop J. 2022, 10, 98–108. [Google Scholar] [CrossRef]
  12. Kotting, O.; Kossmann, J.; Zeeman, S.C.; Lloyd, J.R. Regulation of starch metabolism: The age of enlightenment? Curr. Opin. Plant Biol. 2010, 13, 321–329. [Google Scholar] [CrossRef] [PubMed]
  13. Zhu, J.H.; Yu, W.W.; Zhang, C.Q.; Zhu, Y.J.; Xu, J.L.; Li, E.P.; Gilbert, R.G.; Liu, Q.Q. New insights into amylose and amylopectin biosynthesis in rice endosperm. Carbohydr. Polym. 2020, 230, 115656. [Google Scholar] [CrossRef] [PubMed]
  14. Hwang, S.K.; Nishi, A.; Satoh, H.; Okita, T.W. Rice endosperm-specific plastidial alpha-glucan phosphorylase is important for synthesis of short-chain malto-oligosaccharides. Arch. Biochem. Biophys. 2010, 495, 82–92. [Google Scholar] [CrossRef] [PubMed]
  15. van der Maarel, M.J.E.C.; Leemhuis, H. Starch modification with microbial alpha-glucanotransferase enzymes. Carbohydr. Polym. 2013, 93, 116–121. [Google Scholar] [CrossRef] [PubMed]
  16. Damaris, R.N.; Lin, Z.Y.; Yang, P.F.; He, D.L. The rice alpha-amylase, conserved regulator of seed maturation and germination. Int. J. Mol. Sci. 2019, 20, 450. [Google Scholar] [CrossRef] [PubMed]
  17. Zhan, S.H.; Lukens, L. Identification of novel miRNAs and miRNA dependent developmental shifts of gene expression in Arabidoopsis thaliana. PLoS ONE 2010, 5, 1015710. [Google Scholar] [CrossRef]
  18. Peng, T.; Lv, Q.; Zhang, J.; Li, J.Z.; Du, Y.X.; Zhao, Q.Z. Differential expression of the microRNAs in superior and inferior spikelets in rice (Oryza sativa). J. Exp. Bot. 2011, 62, 4943–4954. [Google Scholar] [CrossRef]
  19. Zheng, Y.; Li, Y.F.; Sunkar, R.; Zhang, W.X. SeqTar: An effective method for identifying microRNA guided cleavage sites from degradome of polyadenylated transcripts in plants. Nucleic Acids Res. 2012, 40, 2810. [Google Scholar] [CrossRef]
  20. Wu, Y.F.; Lee, S.K.; Yoo, Y.; Wei, J.; Kwon, S.Y.; Lee, S.W.; Jeon, J.S.; An, G. Rice transcription factor OsDOF11 modulates sugar transport by promoting expression of Sucrose Transporter and SWEET genes. Mol. Plant 2018, 11, 833–845. [Google Scholar] [CrossRef]
  21. Sun, W.J.; Gao, Z.Y.; Wang, J.; Huang, Y.Q.; Chen, Y.; Li, J.F.; Lv, M.L.; Wang, J.; Luo, M.; Zuo, K.J. Cotton fiber elongation requires the transcription factor GhMYB212 to regulate sucrose transportation into expanding fibers. New Phytol. 2019, 222, 864–881. [Google Scholar] [CrossRef]
  22. Mathan, J.; Singh, A.; Ranjan, A. Sucrose transport in response to drought and salt stress involves ABA-mediated induction of OsSWEET13 and OsSWEET15 in rice. Physiol. Plant. 2021, 171, 620–637. [Google Scholar] [CrossRef]
  23. Li, J.; Foster, R.; Ma, S.; Liao, S.J.; Bliss, S.; Kartika, D.; Wang, L.; Wu, L.; Eamens, A.L.; Ruan, Y.L. Identification of transcription factors controlling cell wall invertase gene expression for reproductive development via bioinformatic and transgenic analyses. Plant J. 2021, 106, 1058–1074. [Google Scholar] [CrossRef]
  24. Hu, Y.F.; Li, Y.P.; Zhang, J.; Liu, H.; Tian, M.; Huang, Y. Binding of ABI4 to a CACCG motif mediates the ABA-induced expression of the ZmSSI gene in maize (Zea mays L.) endosperm. J. Exp. Bot. 2012, 63, 5979–5989. [Google Scholar] [CrossRef]
  25. Wang, J.C.; Xu, H.; Zhu, Y.; Liu, Q.Q.; Cai, X.L. OsbZIP58, a basic leucine zipper transcription factor, regulates starch biosynthesis in rice endosperm. J. Exp. Bot. 2013, 64, 3453–3466. [Google Scholar] [CrossRef]
  26. Gao, Y.J.; An, K.X.; Guo, W.W.; Chen, Y.M.; Zhang, R.J.; Zhang, X.; Chang, S.Y.; Rossi, V.; Jin, F.M.; Cao, X.Y.; et al. The endosperm-specific transcription factor TaNAC019 regulates glutenin and starch accumulation and its elite allele improves wheat grain quality. Plant Cell 2021, 33, 603–622. [Google Scholar] [CrossRef]
  27. Hu, Y.F.; Li, Y.P.; Weng, J.F.; Liu, H.M.; Yu, G.W.; Liu, Y.H.; Xiao, Q.L.; Huang, H.N.; Wang, Y.B.; Wei, B.; et al. Coordinated regulation of starch synthesis in maize endosperm by microRNAs and DNA methylation. Plant J. 2021, 105, 108–123. [Google Scholar] [CrossRef] [PubMed]
  28. Cheng, K.; Pan, Y.F.; Liu, L.M.; Zhang, H.Q.; Zhang, Y.M. Integrated transcriptomic and bioinformatics analyses reveal the molecular mechanisms for the differences in seed oil and starch content between Glycine and Cicer arietinum. Front. Plant Sci. 2021, 12, 743680. [Google Scholar] [CrossRef] [PubMed]
  29. Cheng, C.Y.; Krishnakumar, V.; Chan, A.P.; Thibaud-Nissen, F.; Schobel, S.; Town, C.D. Araport11: A complete reannotation of the Arabidoopsis thaliana reference genome. Plant J. 2017, 89, 789–804. [Google Scholar] [CrossRef] [PubMed]
  30. Schmutz, J.; Cannon, S.B.; Schlueter, J.; Ma, J.X.; Mitros, T.; Nelson, W.; Hyten, D.L.; Song, Q.J.; Thelen, J.J.; Cheng, J.L.; et al. Genome sequence of the palaeopolyploid soybean. Nature 2010, 465, 178–183. [Google Scholar] [CrossRef] [PubMed]
  31. Varshney, R.K.; Song, C.; Saxena, R.K.; Azam, S.; Yu, S.; Sharpe, A.G.; Cannon, S.; Baek, J.; Rosen, B.D.; Tar’an, B.; et al. Draft genome sequence of chickpea (Cicer arietinum) provides a resource for trait improvement. Nat. Biotechnol. 2013, 31, 240–246. [Google Scholar] [CrossRef]
  32. Ouyang, S.; Zhu, W.; Hamilton, J.; Lin, H.; Campbell, M.; Childs, K.; Thibaud-Nissen, F.; Malek, R.L.; Lee, Y.; Zheng, L.; et al. The TIGR rice genome annotation resource: Improvements and new features. Nucleic Acids Res. 2007, 35, D883–D887. [Google Scholar] [CrossRef] [PubMed]
  33. Shen, Y.T.; Zhou, Z.K.; Wang, Z.; Li, W.Y.; Fang, C.; Wu, M.; Ma, Y.M.; Liu, T.F.; Kong, L.A.; Peng, D.L.; et al. Global dissection of alternative splicing in paleopolyploid soybean. Plant Cell 2014, 26, 996–1008. [Google Scholar] [CrossRef] [PubMed]
  34. Garg, R.; Singh, V.K.; Rajkumar, M.S.; Kumar, V.; Jain, M. Global transcriptome and coexpression network analyses reveal cultivar-specific molecular signatures associated with seed development and seed size/weight determination in chickpea. Plant J. 2017, 91, 1088–1107. [Google Scholar] [CrossRef]
  35. Steven, W.R.; John, J.H.; Harvey, T. How a Soybean Plant Develops; Iowa State University, Cooperative Extension Service: Ames, IA, USA, 1967; pp. 1–20. [Google Scholar]
  36. Jain, M.; Chevala, V.V.; Garg, R. Genome-wide discovery and differential regulation of conserved and novel microRNAs in chickpea via deep sequencing. J. Exp. Bot. 2014, 65, 5945–5958. [Google Scholar] [CrossRef] [PubMed]
  37. Han, X.; Zhang, Y.W.; Liu, J.Y.; Zuo, J.F.; Zhang, Z.C.; Guo, L.; Zhang, Y.M. 4D genetic networks reveal the genetic basis of metabolites and seed oil-related traits in 398 soybean RILs. Biotechnol. Biofuels Bioprod. 2022, 15, 92. [Google Scholar] [CrossRef]
  38. Zuo, J.F.; Niu, Y.; Cheng, P.; Feng, J.Y.; Han, S.F.; Zhang, Y.H.; Shu, G.; Wang, Y.; Zhang, Y.M. Effect of marker segregation distortion on high density linkage map construction and QTL mapping in Soybean (Glycine max L.). Heredity 2019, 123, 579–592. [Google Scholar] [CrossRef]
  39. Emms, D.M.; Kelly, S. OrthoFinder: Phylogenetic orthology inference for comparative genomics. Genome Biol. 2019, 20, 238. [Google Scholar] [CrossRef]
  40. Zhang, Z.B.; Dunwell, J.M.; Zhang, Y.M. An integrated omics analysis reveals molecular mechanisms that are associated with differences in seed oil content between Glycine max and Brassica. BMC Plant Biol. 2018, 18, 328. [Google Scholar] [CrossRef]
  41. Shannon, P.; Markiel, A.; Ozier, O.; Baliga, N.S.; Wang, J.T.; Ramage, D.; Amin, N.; Schwikowski, B.; Ideker, T. Cytoscape: A software environment for integrated models of biomolecular interaction networks. Genome Res. 2003, 13, 2498–2504. [Google Scholar] [CrossRef]
  42. Oughtred, R.; Rust, J.; Chang, C.; Breitkreutz, B.J.; Stark, C.; Willems, A.; Boucher, L.; Leung, G.; Kolas, N.; Zhang, F.; et al. The BioGRID database: A comprehensive biomedical resource of curated protein, genetic, and chemical interactions. Protein Sci. 2021, 30, 187–200. [Google Scholar] [CrossRef] [PubMed]
  43. Langfelder, P.; Horvath, S. WGCNA: An R package for weighted correlation network analysis. BMC Bioinform. 2008, 9, 559. [Google Scholar] [CrossRef] [PubMed]
  44. Tian, F.; Yang, D.C.; Meng, Y.Q.; Jin, J.P.; Gao, G. PlantRegMap: Charting functional regulatory maps in plants. Nucleic Acids Res. 2020, 48, D1104–D1113. [Google Scholar] [CrossRef]
  45. Grant, C.E.; Bailey, T.L.; Noble, W.S. FIMO: Scanning for occurrences of a given motif. Bioinformatics 2011, 27, 1017–1018. [Google Scholar] [CrossRef]
  46. Dai, X.B.; Zhao, P.X. psRNATarget: A plant small RNA target analysis server. Nucleic Acids Res. 2011, 39, W155–W159. [Google Scholar] [CrossRef]
  47. Bu, D.C.; Luo, H.T.; Huo, P.P.; Wang, Z.H.; Zhang, S.; He, Z.H.; Wu, Y.; Zhao, L.H.; Liu, J.J.; Guo, J.C.; et al. KOBAS-i: Intelligent prioritization and exploratory visualization of biological functions for gene enrichment analysis. Nucleic Acids Res. 2021, 49, W317–W325. [Google Scholar] [CrossRef]
  48. Cantalapiedra, C.P.; Hernández-Plaza, A.; Letunic, I.; Bork, P.; Huerta-Cepas, J. eggNOG-mapper v2: Functional annotation, orthology assignments, and domain prediction at the metagenomic scale. Mol. Biol. Evol. 2021, 38, 5825–5829. [Google Scholar] [CrossRef] [PubMed]
  49. McCarthy, F.M.; Wang, N.; Magee, G.B.; Nanduri, B.; Lawrence, M.L.; Camon, E.B.; Barrell, D.G.; Hill, D.P.; Dolan, M.E.; Williams, W.P.; et al. AgBase: A functional genomics resource for agriculture. BMC Genom. 2006, 7, 229. [Google Scholar] [CrossRef]
  50. Gámez-Arjona, F.M.; Raynaud, S.; Ragel, P.; Mérida, A. Starch synthase 4 is located in the thylakoid membrane and interacts with plastoglobule-associated proteins in Arabidopsis. Plant J. 2014, 80, 305–316. [Google Scholar] [CrossRef]
  51. McWhite, C.D.; Papoulas, O.; Drew, K.; Cox, R.M.; June, V.; Dong, O.X.; Kwon, T.; Wan, C.H.; Salmi, M.L.; Roux, S.J.; et al. A pan-plant protein complex map reveals deep conservation and novel assemblies. Cell 2020, 181, 460–474. [Google Scholar] [CrossRef]
  52. Meyer, T.; Hölscher, C.; Schwöppe, C.; von Schaewen, A. Alternative targeting of Arabidopsis plastidic glucose-6-phosphate dehydrogenase G6PD1 involves cysteine-dependent interaction with G6PD4 in the cytosol. Plant J. 2011, 66, 745–758. [Google Scholar] [CrossRef]
  53. Cho, Y.H.; Yoo, S.D.; Sheen, J. Regulatory functions of nuclear hexokinase1 complex in glucose signaling. Cell 2006, 127, 579–589. [Google Scholar] [CrossRef]
  54. Karve, A.; Xia, X.X.; Moore, B.D. Arabidopsis hexokinase-like1 and hexokinase1 form a critical node in mediating plant glucose and ethylene responses. Plant Physiol. 2012, 158, 1965–1975. [Google Scholar] [CrossRef]
  55. Seung, D.; Soyk, S.; Coiro, M.; Maier, B.A.; Eicke, S.; Zeeman, S.C. PROTEIN TARGETING TO STARCH is required for localising GRANULE-BOUND STARCH SYNTHASE to starch granules and for normal amylose synthesis in Arabidopsis. PLoS Biol. 2015, 13, 100208010. [Google Scholar] [CrossRef]
  56. Zhang, L.; Li, N.; Zhang, J.; Zhao, L.L.; Qiu, J.J.; Wei, C.X. The CBM48 domain-containing protein FLO6 regulates starch synthesis by interacting with SSIVb and GBSS in rice. Plant Mol. Biol. 2022, 108, 343–361. [Google Scholar] [CrossRef]
  57. Hwang, S.K.; Koper, K.; Satoh, H.; Okita, T.W. Rice Endosperm Starch Phosphorylase (Pho1) assembles with disproportionating enzyme (Dpe1) to form a protein complex that enhances synthesis of malto-oligosaccharides. J. Biol. Chem. 2016, 291, 19994–20007. [Google Scholar] [CrossRef]
  58. Nakamura, Y.; Ono, M.; Sawada, T.; Crofts, N.; Fujita, N.; Steup, M. Characterization of the functional interactions of plastidial starch phosphorylase and starch branching enzymes from rice endosperm during reserve starch biosynthesis. Plant Sci. 2017, 264, 83–95. [Google Scholar] [CrossRef] [PubMed]
  59. Viola, I.L.; Uberti Manassero, N.G.; Ripoll, R.; Gonzalez, D.H. The Arabidopsis class I TCP transcription factor AtTCP11 is a developmental regulator with distinct DNA-binding properties due to the presence of a threonine residue at position 15 of the TCP domain. Biochem. J. 2011, 435, 143–155. [Google Scholar] [CrossRef] [PubMed]
  60. Jo, L.; Pelletier, J.M.; Hsu, S.W.; Baden, R.; Goldberg, R.B.; Harada, J.J. Combinatorial interactions of the LEC1 transcription factor specify diverse developmental programs during soybean seed development. Proc. Natl. Acad. Sci. USA 2020, 117, 1223–1232. [Google Scholar] [CrossRef] [PubMed]
  61. Omidbakhshfard, M.A.; Fujikura, U.; Olas, J.J.; Xue, G.P.; Balazadeh, S.; Mueller-Roeber, B. GROWTH-REGULATING FACTOR 9 negatively regulates Arabidopsis leaf growth by controlling ORG3 and restricting cell proliferation in leaf primordia. PLoS Genet. 2018, 14, 1007484. [Google Scholar] [CrossRef] [PubMed]
  62. Sasnauskas, G.; Kauneckaite, K.; Siksnys, V. Structural basis of DNA target recognition by the B3 domain of Arabidopsis epigenome reader VAL1. Nucleic Acids Res. 2018, 46, 4316–4324. [Google Scholar] [CrossRef]
  63. Liao, Y.; Zou, H.F.; Wei, W.; Hao, Y.J.; Tian, A.G.; Huang, J.; Liu, Y.F.; Zhang, J.S.; Chen, S.Y. Soybean GmbZIP44, GmbZIP62 and GmbZIP78 genes function as negative regulator of ABA signaling and confer salt and freezing tolerance in transgenic Arabidopsis. Planta 2008, 228, 225–240. [Google Scholar] [CrossRef] [PubMed]
  64. Ohdan, T.; Francisco, P.B.; Sawada, T.; Hirose, T.; Terao, T.; Satoh, H.; Nakamura, Y. Expression profiling of genes involved in starch synthesis in sink and source organs of rice. J. Exp. Bot. 2005, 56, 3229–3244. [Google Scholar] [CrossRef] [PubMed]
  65. Qu, J.Z.; Xu, S.T.; Zhang, Z.Q.; Chen, G.Z.; Zhong, Y.Y.; Liu, L.S.; Zhang, R.H.; Xue, J.Q.; Guo, D.W. Evolutionary, structural and expression analysis of core genes involved in starch synthesis. Sci. Rep. 2018, 8, 12736. [Google Scholar] [CrossRef] [PubMed]
  66. Yang, K.; Tian, Z.X.; Chen, C.H.; Luo, L.H.; Zhao, B.; Wang, Z.; Yu, L.L.; Li, Y.S.; Sun, Y.D.; Li, W.Y.; et al. Genome sequencing of adzuki bean (Vignaangularis) provides insight into high starch and low fat accumulation and domestication. Proc. Natl. Acad. Sci. USA 2015, 112, 13213–13218. [Google Scholar] [CrossRef] [PubMed]
  67. Liu, N.; Zhang, G.W.; Xu, S.C.; Mao, W.H.; Hu, Q.Z.; Gong, Y.M. Comparative transcriptomic analyses of vegetable and grain pea (Pisum sativum L.) seed development. Front. Plant Sci. 2015, 6, 1039. [Google Scholar] [CrossRef] [PubMed]
  68. Scheidig, A.; Fröhlich, A.; Schulze, S.; Lloyd, J.R.; Kossmann, J. Downregulation of a chloroplast-targeted beta-amylase leads to a starch-excess phenotype in leaves. Plant J. 2002, 30, 581–591. [Google Scholar] [CrossRef] [PubMed]
  69. Zeeman, S.C.; Delatte, T.; Messerli, G.; Umhang, M.; Stettler, M.; Mettler, T.; Streb, S.; Reinhold, H.; Kötting, O. Starch breakdown: Recent discoveries suggest distinct pathways and novel mechanisms. Funct. Plant Biol. 2007, 34, 465–473. [Google Scholar] [CrossRef] [PubMed]
  70. Andriotis, V.M.E.; Pike, M.J.; Kular, B.; Rawsthorne, S.; Smith, A.M. Starch turnover in developing oilseed embryos. New Phytol. 2010, 187, 791–804. [Google Scholar] [CrossRef]
  71. Dong, X.B.; Zhang, D.; Liu, J.; Liu, Q.Q.; Liu, H.L.; Tian, L.H.; Jiang, L.; Qu, L.Q. Plastidial disproportionating enzyme participates in starch synthesis in rice endosperm by transferring maltooligosyl groups from amylose and amylopectin to amylopectin. Plant Physiol. 2015, 169, 2496–2512. [Google Scholar] [CrossRef]
  72. Liu, H.; Jia, S.; Shen, D.; Liu, J.; Li, J.; Zhao, H.; Han, S.; Wang, Y. Four AUXIN RESPONSE FACTOR genes downregulated by microRNA167 are associated with growth and development in Oryza sativa. Funct. Plant Biol. 2012, 39, 736–744. [Google Scholar] [CrossRef]
  73. Ruuska, S.A.; Girke, T.; Benning, C.; Ohlrogge, J.B. Contrapuntal networks of gene expression during Arabidopsis seed filling. Plant Cell 2002, 14, 1191–1206. [Google Scholar] [CrossRef] [PubMed]
  74. Radchuk, V.V.; Borisjuk, L.; Sreenivasulu, N.; Merx, K.; Mock, H.P.; Rolletschek, H.; Wobus, U.; Weschke, W. Spatiotemporal profiling of starch biosynthesis and degradation in the developing barley grain. Plant Physiol. 2009, 150, 190–204. [Google Scholar] [CrossRef] [PubMed]
  75. Weigelt, K.; Küster, H.; Rutten, T.; Fait, A.; Fernie, A.R.; Miersch, O.; Wasternack, C.; Emery, R.J.N.; Desel, C.; Hosein, F.; et al. ADP-Glucose pyrophosphorylase-deficient pea embryos reveal specific transcriptional and metabolic changes of carbon-nitrogen metabolism and stress responses. Plant Physiol. 2009, 149, 395–411. [Google Scholar] [CrossRef] [PubMed]
  76. Kaushik, M.; Rai, S.; Venkadesan, S.; Sinha, S.K.; Mohan, S.; Mandal, P.K. Transcriptome analysis reveals important candidate genes related to nutrient reservoir, carbohydrate metabolism, and defence proteins during grain development of hexaploid bread wheat and its diploid progenitors. Genes 2020, 11, 509. [Google Scholar] [CrossRef] [PubMed]
  77. Zhang, A.D.; Wang, W.Q.; Tong, Y.; Li, M.J.; Grierson, D.; Ferguson, I.; Chen, K.S.; Yin, X.R. Transcriptome analysis identifies a zinc finger protein regulating starch degradation in kiwifruit. Plant Physiol. 2018, 178, 850–863. [Google Scholar] [CrossRef] [PubMed]
  78. Liu, J.; Liu, M.; Wang, J.; Zhang, J.; Miao, H.; Wang, Z.; Jia, C.; Zhang, J.; Xu, B.; Jin, Z. Transcription factor MaMADS36 plays a central role in regulating banana fruit ripening. J. Exp. Bot. 2021, 72, 7078–7091. [Google Scholar] [CrossRef] [PubMed]
  79. Xiao, Y.Y. The Function and Mechanism of Transcription Factor MaAP2a-1 and MabHLH6 in Regulation of Postharvest Banana Starch Degradation. Ph.D. Dissertation, South China Agricultral University, Guangzhou, China, 2017. (In Chinese). [Google Scholar]
  80. Liu, L.; Wang, K.; Han, Y.L.; Chen, W.; Cao, S.F.; Shi, L.Y. Functional identification of AcbHLH137 and its transcriptional activation of starch degradation gene AcBAM3 in kiwifruit. Henong Xuebao 2022, 36, 544–553. (In Chinese) [Google Scholar] [CrossRef]
  81. Shoaib, N.; Liu, L.; Ali, A.; Mughal, N.; Yu, G.; Huang, Y. Molecular functions and pathways of plastidial starch phosphorylase (PHO1) in starch metabolism: Current and future perspectives. Int. J. Mol. Sci. 2021, 22, 10450. [Google Scholar] [CrossRef]
  82. Wang, J.Y.; Li, Y.H.; Li, A.; Liu, R.H.; Gao, X.; Li, D.; Kou, X.H.; Xue, Z.H. Nutritional constituent and health benefits of chickpea (Cicer arietinum L.): A review. Food Res. Int. 2021, 150 Pt A, 110790. [Google Scholar] [CrossRef]
  83. Chen, C.; He, B.S.; Liu, X.X.; Ma, X.D.; Liu, Y.J.; Yao, H.Y.; Zhang, P.; Yin, J.L.; Wei, X.; Koh, H.J.; et al. Pyrophosphate-fructose 6-phosphate 1-phosphotransferase (PFP1) regulates starch biosynthesis and seed development via heterotetramer formation in rice (Oryza sativa L.). Plant Biotechnol. J. 2020, 18, 83–95. [Google Scholar] [CrossRef] [PubMed]
Figure 1. The differences in the expression levels of genes related to sucrose and starch metabolism between soybean and chickpea: (a) expression trends of key genes related to starch synthesis and degradation, including starch synthesis genes APL, APS, ISA, PTST, SBE, and SS in subfigure A, GBSS in subfigure B, and starch degradation gene BMY in subfigure C; (b) eleven differentially expressed gene families. t1−t6: soybean seed development stages; t1′–t6′: chickpea seed development stages.
Agronomy 14 00328 g001
Figure 2. The core genes in the first PPI subnetwork related to sucrose and starch metabolism in soybean (a) and chickpea (b). The gene ID is inside the circle. The color represents the number of interactions, and a darker color from yellow to red indicates more interactions.
Agronomy 14 00328 g002
Figure 3. Soybean gene families with transcription factor binding sites. Purple boxes: co-expression of genes with transcription factors. The sizes of yellow and black points indicate the number of binding sites in each gene family.
Agronomy 14 00328 g003
Figure 4. Regulatory networks of miRNA–TF–sucrose and starch metabolism genes in soybean. Orange nodes: miRNA; red nodes: TF; green nodes: sucrose and starch metabolism genes; line thickness: co-expression correlation strength. (a) miR10436–bHLH–sucrose and starch metabolism genes (b) miR167–ARF–sucrose metabolism genes.
Agronomy 14 00328 g004
Figure 5. Comparison of seed starch synthesis and degradation-related genes and their transcription factors in soybean (A) and chickpea (B).
Agronomy 14 00328 g005
Disclaimer/Publisher’s Note: The statements, opinions and data contained in all publications are solely those of the individual author(s) and contributor(s) and not of MDPI and/or the editor(s). MDPI and/or the editor(s) disclaim responsibility for any injury to people or property resulting from any ideas, methods, instructions or products referred to in the content.

