Article

The Substitution of Sphagnum for Peat as a Culture Substrate Reduces N2O Emissions from Vegetable Production Systems

1
State Key Laboratory of Efficient Utilization of Arid and Semi-Arid Arable Land in Northern China, Chinese Academy of Agricultural Sciences, Beijing 100081, China
2
Institute of Urban Agriculture, Chinese Academy of Agricultural Sciences, Chengdu 610213, China
3
College of Mechanical Engineering, Chengdu University, Chengdu 610106, China
4
College of Agronomy and Biotechnology, Southwest University, Chongqing 400715, China
*
Author to whom correspondence should be addressed.
These authors contributed equally to this work.
Agronomy 2024, 14(2), 369; https://doi.org/10.3390/agronomy14020369
Submission received: 23 January 2024 / Revised: 8 February 2024 / Accepted: 11 February 2024 / Published: 14 February 2024
(This article belongs to the Section Agroecology Innovation: Achieving System Resilience)

Abstract

:
Peat-based substrates have been widely used in greenhouse vegetable production (GVP). However, peat is a non-renewable resource, and there is a problem with N2O emissions when it is used in greenhouse vegetable production due to the application of large quantities of nutrient solutions. Sphagnum (SP) is a precursor substance and a renewable resource for peat formation, and it has good physical and chemical properties. However, there has been no study on the effect of using sphagnum to replace peat in greenhouse vegetable production on N2O emissions. Therefore, this study used a peat substrate as the control treatment (CK), with sphagnum replacing peat at 25% (25SP), 50% (50SP), 75% (75SP), and 100% (100SP) in six treatment groups. Moreover, lettuce was used as the experimental subject in potting experiments, and the physicochemical properties, N2O emissions, N2O isotope δ value, and N2O-related microbial activity and community structures were determined using different treatments. Compared with the CK treatment, the 25SP treatment significantly reduced N2O emissions by 55.35%, while the 75SP treatment significantly increased N2O emissions by 67.76%. The 25SP treatment reduced N2O to N2 to the highest extent and demonstrated the lowest contribution of fungal denitrification (FD) and bacterial nitrification (BN) processes, thereby resulting in lower N2O emissions. In contrast, NH4+ and NO3 were the main substrates for N2O emissions; the 75SP treatment had higher NH4+ and NO3 contents and a lower relative abundance of the nosZ gene, thereby resulting in higher N2O emissions. In addition, N2O production and reduction were dominated by bacterial denitrification for all treatments. Thus, this study analyzed the community composition of denitrifying bacterial genera and their association with physicochemical properties. The results indicated that the dominant denitrifying genus in the peat substrate was Rhodanobacter and that sphagnum replacement reduced the relative abundance of Rhodanobacter. The dominant genus was Massilia at 100% sphagnum replacement. More importantly, Rhodanobacter was correlated with C/N and electrical conductivity (EC), whereas Massilia was affected by NH4+ and the water-filled pore space (WFPS). Therefore, different denitrification-dominant genera were affected by different environmental factors, which indirectly affected N2O emission. In summary, the 25SP treatment was able to improve nitrogen use efficiency and had no significant effect on lettuce yield. Therefore, 25% sphagnum replacement is the most suitable percentage for peat replacement.

1. Introduction

Recently, soilless culture systems (SCSs) have gained considerable prominence for their employment in the substitution of soil in greenhouse vegetable production (GVP). Among the various substrate materials employed in SCSs, peat stands out as the most used one [1]. Nevertheless, the cultivation of a peat substrate not only relies on non-renewable resources, but its over-exploitation also results in ecological harm. Hence, it becomes imperative to explore alternative substrate materials that can effectively replace peat in SCSs. Sphagnum, being an essential and renewable resource for peat formation, exhibits numerous advantages such as a high organic matter content, abundant fiber content, a loose and porous structure, as well as excellent aeration and water absorption capabilities [2]. Furthermore, sphagnum can be cultivated artificially, thereby simplifying the cultivation process and proving to be cost-effective [3,4]. Thus, sphagnum emerges as a remarkable substitute for peat [5]. Notably, GVP necessitates the application of nutrient solutions at high levels, which leads to significant emissions of nitrous oxide (N2O) from peat, soilless substrates [6]. N2O, being a potent greenhouse gas, exhibits a global warming potential that is 298 times higher than that of carbon dioxide (CO2), and it ranks as a primary contributor to ozone depletion in the 21st century [7,8]. However, the impact of replacing peat with sphagnum on N2O emissions remains unknown. Therefore, a comprehensive investigation into the nitrogen transformation mechanism following the substitution of peat with sphagnum becomes invaluable for enhancing nitrogen use efficiency, reducing N2O emissions, and augmenting crop yield in GVP.
Sphagnum and peat are distinct materials with disparate microbial profiles [9,10], whereas N2O emissions are closely linked to the microbial processes within the nitrogen cycle. The primary source of N2O in soilless substrates arises from nitrification and denitrification driven by microorganisms. There are five microbial pathways for N2O emissions, namely those of bacterial nitrification (BN), archaeal nitrification (AN), fungal denitrification (FD), denitrifier denitrification (DD), and nitrifier denitrification (ND) [6,11]. Nitrification is the process through which NH4+-N is oxidized to NO2-N through the activity of ammonia-oxidizing bacteria (AOB) and archaea (AOA), with N2O being produced as an intermediate product [12]. Denitrification involves the reduction of NO3-N or NO2-N to N2, with N2O serving as an intermediate product. This process is controlled by the nirS and nirK genes, which encode nitrite reductase, as well as the nosZ gene, which encodes nitrous oxide reductase [13]. Additionally, fungal denitrification lacks N2O reductase, thereby resulting in N2O as the ultimate end product. The p450nor gene plays a pivotal role in N2O production within this process [14]. Recently, the application of N2O stable isotope technology serves as a valuable tool for quantitatively analyzing the microbial pathways of N2O production and consumption [15,16]. In this context, the 15N site preference (SP) serves as an indicative measure to elucidate N2O microbial processes [17]. Furthermore, δ18O-N2O assumes a critical role as a key parameter for deciphering N2O production and consumption. However, N2O production also relies upon precursors such as NO3-N, NO2-N, H2O, and O2. Fortunately, Lewicka-Szczebak et al. [18] postulated that the oxygen (O) in N2O exclusively originates from H2O due to the high rate of oxygen exchange between H2O and oxynitride. Subsequently, Lewicka-Szczebak et al. [19] constructed the δ18O(N2O/H2O) vs. δ15NSP map to distinguish various microbial processes. Currently, the dual-isotope map of δ18O(N2O/H2O) vs. δ15NSP has gained widespread application in soil or even soilless substrate environments [20,21]. In the dual-isotope map, the isotope signature values of BN, AN, and FD are classified within the high-value group, while DD and ND are categorized within the low-value group. Currently, certain investigations have examined the microbial processes associated with N2O emissions by employing multiple methods such as stable isotope analysis, a functional gene abundance assessment, and the characterization of microbial communities [22,23]. These methods provide more information about N2O production and consumption and present possibilities for investigating the microbial processes occurring in a soilless substrate.
Regardless, the substitution of sphagnum for peat in a soilless substrate inevitably leads to alterations in the physicochemical properties and biological indicators, thereby impacting the process of N2O emissions and also influencing nitrogen use efficiency and vegetable yield. Hence, this study set five alternative sphagnum substitution schemes to (1) investigate the effects of N2O emissions and the microbial mechanisms underlying its production and consumption and (2) determine the optimal substitution ratio considering the combined influence of factors such as N2O emissions, vegetable yield, and nitrogen use efficiency.

2. Materials and Methods

2.1. Experimental Materials and Design

A pot experiment was carried out in a greenhouse light incubator in July 2022 at the Institute of Urban Agriculture, Chinese Academy of Agricultural Sciences, Chengdu, China (104°13′ E, 30°42′ N). The experimental raw materials included sphagnum, peat, vermiculite, and perlite. The standard soilless substrate consisted of a mixture of peat, vermiculite, and perlite (3:1:1, v/v). Table S1 shows the initial physicochemical properties of the raw materials. The vegetable used in this study was Flandria RZ (Lactuca sativa var. ramosa Hort).
The greenhouse pot experiment comprised five treatments involving substitution of sphagnum for peat, with four replicates per treatment, which were as follows: 0% sphagnum (CK), 25% sphagnum (25SP), 50% sphagnum (50SP), 75% sphagnum (75SP), and 100% sphagnum (100SP). The incubation conditions of the light incubator were as follows: temperature: 22 °C, humidity: 70%, and light intensity: 30,000 Lux. Lettuce seeds were sown on 1 July 2022 into seedling cavity trays raised using pure peat. A total of 30 lettuce seedlings were transplanted into 500mL cultivation pots on 14 July 2022. In addition, to meet lettuce growth needs, the general Hoagland nutrient solution was added into cultivation pots (Table S2). The total nitrogen content for all treatments was 200 mg of N dm−3.

2.2. Collection of Substrate and Gas Samples

Substrate and gas samples were collected on 1, 11, 21, and 31 days after the transplantation of the lettuce. The cultivation pots were placed in a rectangular PVC chamber (dimensions = 0.1 × 0.1 × 0.5 m3), and its bottom was sealed with water. The substrates with the lettuce were incubated for one hour, and then the gas samples were pumped into a 250 mL gas bag (LB-201, Dalian Delin Gas Packaging Co., Dalian, China) using a suction pump. Substrate samples were sampled into plastic-sealed bags and 5 mL centrifuge tubes. They were subsequently preserved at −20 °C and −80 °C for the determination of physicochemical properties and microbiological indices, respectively [6,11].

2.3. Analysis of Substrate Samples

The water-filled pore space (WFPS) of the samples was calculated by measuring the water content; the formula for the WFPS is given in Text S1 of the Supplementary Materials. The extract solution of a 1:10 air-dried soilless substrate and distilled water (w/v) was used to measure the pH value and EC with a multi-parameter tester (Mettler Toledo Instruments Shanghai Co., Shanghai, China). The extract solution of a 1:5 fresh, soilless substrate and 2 mol L−1 of KCl solution (w/v) was used to determine the NH4+-N, NO3-N, and NO2-N contents by an enzyme-linked immunosorbent assay instrument (ELISA, ReadMax 1900, Shanghai Flash Spectrum Biotechnology Co., Shanghai, China). The total nitrogen (TN) and total carbon (TC) contents of the lettuce and soilless substrate were determined using an elemental analyzer (EA, iso-prime100, Elementar, Berlin, Germany). The formulae for calculating nitrogen use efficiency are given in Text S1 of the Supplementary Materials.

2.4. Gas Sample Analysis and Microbial Pathways of N2O Emissions

N2O content was determined by a gas chromato-graph (GC; Agilent 7890A, Santa Clara, CA, USA) equipped with an electron-capture detector (ECD). The N2O flux (μg m−2 h−1) was calculated as follows:
F l u x = ρ h 273 T + 273 Δ c Δ t
where ρ denotes the gas density at the standard state (N2O, 1.978 kg m−3), h is the chamber height (0.5 m), T represents the temperature inside the chamber, Δc/Δt represents the change in gas concentration per unit of time (μL L−1 h−1), an N2O fluxes (μg m−2 h−1) are related to the area of each cultivation pot, with 273 units being K. The cumulated N2O emissions were calculated using the following equation:
C N 2 O = M N 2 O f l u x 31 24
where MN2Oflux represents the mean N2O flux, with 31 and 24 units being days and hours, respectively.
The δ15Nbulk, δ15Nα, and δ18O of N2O were determined using an isotope ratio mass spectrometer installed in the pre-concentrator system, chemical traps, and gas chromato-graph (GC-IRMS; Delta V Plus, Thermo Fisher Scientific, Bremen, Germany). The isotopic differences of 15N and 18O in N2O are expressed as delta values using the “δ” symbol and calibrated using international standards (atmospheric N2 and Vienna Standard Average Ocean Water):
δ X = R s a m p l e R s t a n d a r d 1 X =   15 N α ,   15 N β ,   15 N b u l k ,   18 O
δ 15 N S P = 2 δ 15 N α 2 δ 15 N b u l k
In the formula, R represents the 15N/14N or 18O/16O ratio. The measurement accuracy of δ15Nbulk, δ15Nα, δ18O, and δ15NSP are 0.1‰, 0.4‰, 0.1‰, and 0.5‰, respectively.
In addition, recent studies have used δ18O(N2O/H2O) vs. δ15NSP dual-isotope profiles to distinguish the microbial pathway from N2O reduction [6]. Moreover, the similar range values of δ18O and δ15NSP were divided into high-value groups (BN, AN, and FD) and low-value groups (DD and ND), which were denoted as ABF and DND, respectively (Table S4). Furthermore, there then exist two scenarios of the N2O reduction in SCSs. In scenario i, N2O is first reduced to N2 in DND and then mixes with the N2O produced by NF. In scenario ii, N2O from the DND and ABF processes is first mixed and then partially reduced to N2.
Scenario   i : δ s u b = x δ A B F + 1 x δ D N D + η R l n ( 1 F r )
Scenario   ii : δ s u b = x δ A B F + 1 x [ δ D N D + η R ln 1 F r ]
Therein, δ is either δ18O or δ15NSP, and η is either η18O or η15NSP. Subscripts sub and R represent a soilless substrate and N2O reduction, respectively. x is the contribution of the ABF process, (1 − x) is the contribution of the DND process, Fr represents the extent of N2O reduction, ηR denotes the net isotope effect values of N2O reduction, which are η15NSPR or η18OR. ABF represents the following: archaeal nitrification, bacterial nitrification, and fungal denitrification. DND represents the following: bacterial denitrification and nitrifier denitrification.

2.5. qPCR Assay and High-Throughput Sequencing

The DNA samples were extracted using the MoBio PowerSoil DNA Isolation Kit (MoBio, Solana Beach, CA, USA) [24]. The amplification conditions for qPCR and primers for the genes are listed in the Supplementary Materials. The copy numbers of the bacterial 16S rRNA gene, fungal ITS gene, AOB amoA, AOA amoA, p450nor, nirS, nirK, and nosZ genes were determined by a real–time PCR system (ABI 7500, LightCycler480II, 384, Roche, Beijing, China). qPCR reactions were performed using the AceQ® qPCR SYBR® green master mix (Q112-02, Vazyme, Nanjiing, China) at 95 °C for 2 min, with 40 cycles at 95 °C for 15 s and at 60 °C for 30 s. qPCR amplification conditions are described in Text S2 of the Supplementary Materials. The bacterial 16S rRNA and the fungal ITS were sequenced using the Illumina NovaSeq platform (Illumina, San Diego, CA, USA) of Novogene Co., Ltd. (Beijing, China).

2.6. Contribution Analysis of Microbial Pathways for N2O Emissions

The approximate contribution of AN, BN, and FD in this study was differentiated from the total contribution of the ABF process based on the relative abundance proportion of AOA amoA, AOB amoA, and p450nor genes. The KEGG (Kyoto Encyclopedia of Genes and Genomes) database is a database that systematically analyzes gene functions and links genomic and functional information. All the genera obtained by high-throughput sequencing were compared with the KEGG database to select the denitrification performed by nitrifier bacteria and denitrifier bacteria, which then roughly differentiated the nitrifier denitrification (ND) and denitrifier denitrification (DD) using their relative proportions.

2.7. Statistical Analysis

The experimental data of this study were analyzed and plotted using Excel 2016, origin 2021, and Canoco 5. One-way analysis of variance (ANOVA) was performed to test for differences in physicochemical properties, mineral nitrogen content, N2O emissions, nitrogen use efficiency, yield, and functional gene abundance among treatments. The least significant difference (LSD) method was also used to test for significant differences. Redundancy analysis (RDA) was used to analyze the effect of the physicochemical properties of soilless substrates on the dominant bacteria genera. Pearson correlation analysis was used to analyze the correlation among different parameters.

3. Results

3.1. Physicochemical Properties, Lettuce Yields, and Nitrogen Use Efficiency of All the Treatments

The physicochemical properties of the soilless substrate in all the treatments are shown in Table 1. The results showed that the WFPS of all the treatments exceeded 60%. Meanwhile, the WFPS of the 50SP (70.6%), 75SP (71.9%), and 100SP (70.3%) treatments were significantly higher than those of the CK and 25SP treatments. Moreover, it is noteworthy to mention that the pH values of all the treatments examined were approximately 6.5 in this study, exhibiting no discernible, significant variations. The EC values in the 75SP (1328.5 μS cm−1) and 100SP (1352.4 μS cm−1) treatments were significantly higher than those in the CK and 25SP treatments. The C/N ratio in the CK treatment was recorded as 43.2, while a significant reduction in the C/N ratio was observed as the percentage of sphagnum substitution increased, ultimately reaching a value of 25.9 in the 100SP treatment. The CK treatment had the highest bulk density of 0.17 g cm−3, followed by the 25SP, 50SP, 75SP, and 100SP treatments. In this study, there was no significant difference in the lettuce yields among treatments (Figure S1A). Compared with the CK treatment, nitrogen use efficiency was significantly higher in the 25SP, 50SP, and 75SP treatments and highest at 19.0% in the 25SP treatment (Figure S1B).

3.2. Mineral Nitrogen and N2O Emissions of All the Treatments

In this study, mineral nitrogen of all the treatments was dominated by NO3-N, followed by NH4+-N and NO2-N (Figure 1A–C). The contents of NO3-N, NH4+-N, and NO2-N varied among the treatments, while the total mineral nitrogen content increased with an increasing substitution rate of sphagnum. Throughout the growth cycle of the lettuce, the contents of NO3-N and NH4+-N exhibited an initially high level followed by a subsequent decline in the later stages, and the NO2-N content remained steadfast. Moreover, the contents of NO3-N and NH4+-N were significantly higher in the 50SP, 75SP, and 100SP treatments compared with the CK and 25SP treatments (Table 1).
The N2O fluxes of all the treatments showed an increasing and then a decreasing trend, except for 100SP, which showed a decreasing and then an increasing trend (Figure 1D). Compared with the CK treatment (8.2 mg m−2), the accumulated N2O emissions significantly reduced by 55.4% for the 25SP treatment (3.7 mg m−2) and significantly increased by 67.8% for the 75SP treatment (13.8 mg m−2). N2O was significantly positively correlated with NH4+-N and EC, while NH4+-N was significantly negatively correlated with C/N and significantly positively correlated with NO3-N, NO2N, and EC (Table 2, p < 0.05).

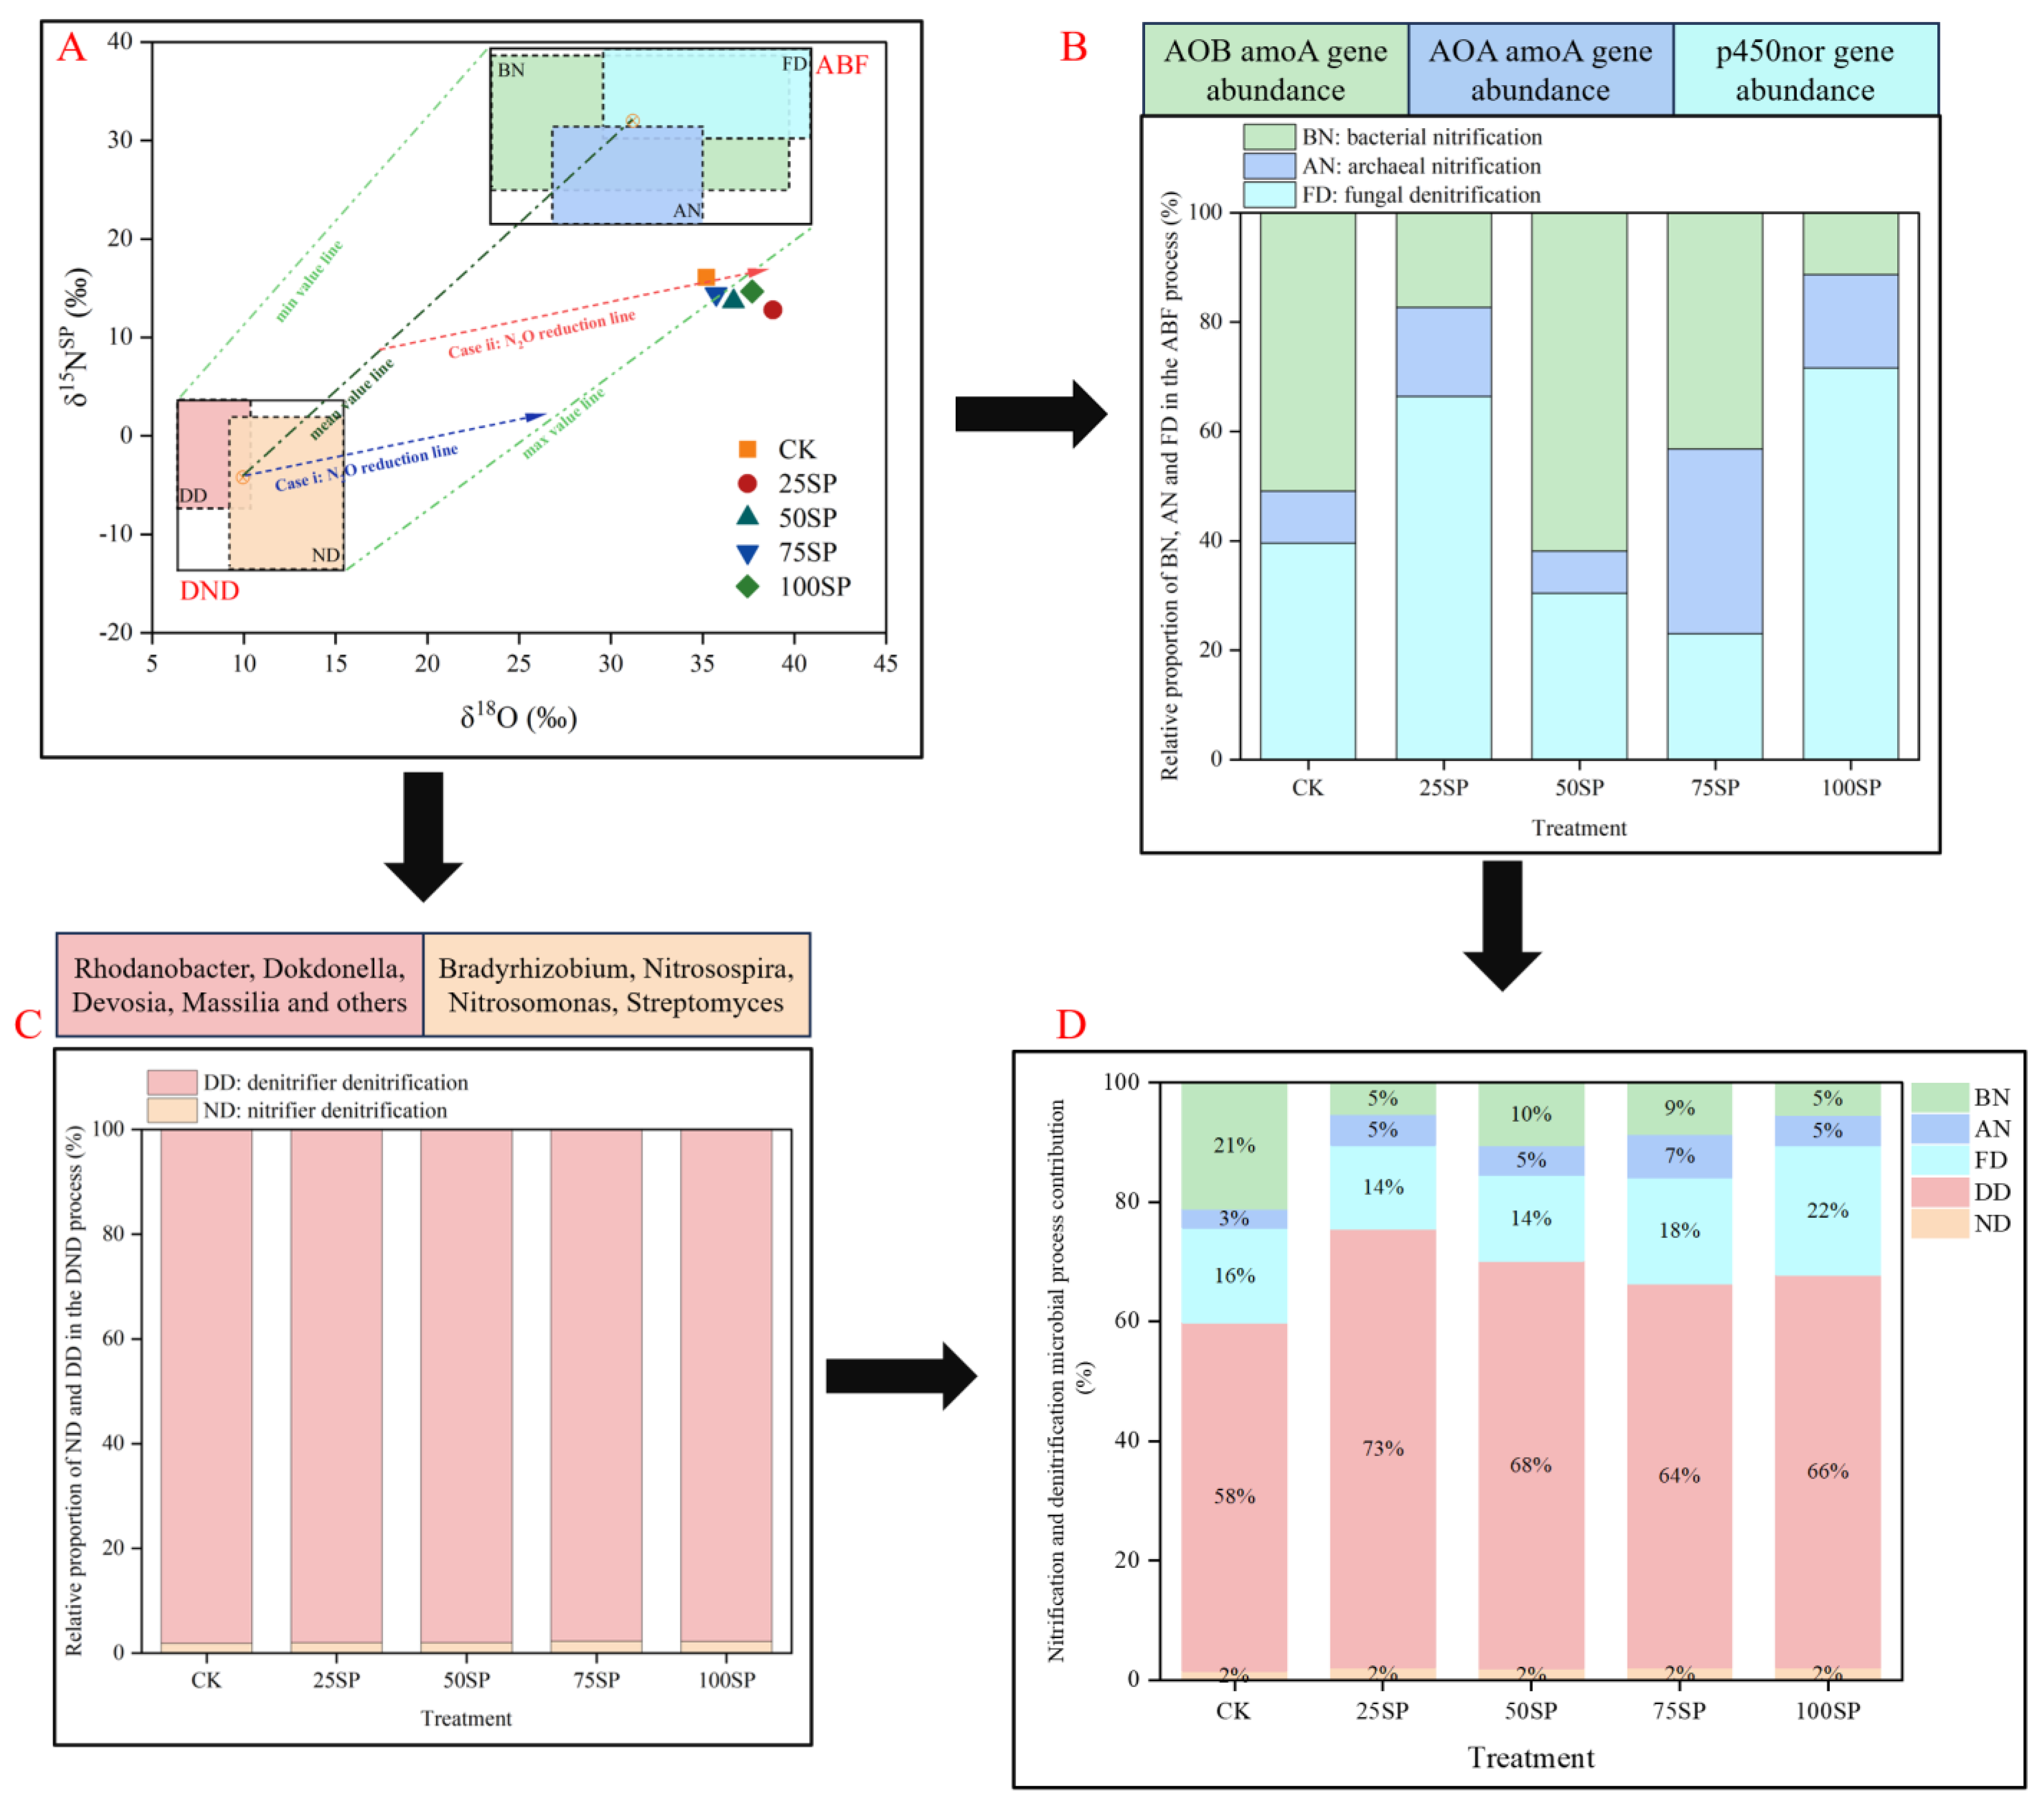
3.3. Isotope Analysis of All the Treatments

The emitted N2O isotope values, including those of δ15Nbulk, δ15Nα, and δ18O, were extracted from the measured N2O isotope values according to the Keepling plot method, and δ15NSP was calculated by δ15Nbulk and δ15Nα according to Equation (4) (Figure S2 and Table 3). For the CK, 25SP, 50SP, 75SP, and 100SP treatments, the δ18O values were 35.2, 38.9, 36.7, 35.8, and 37.7 ‰, and the δ15NSP values were 16.1, 12.8, 13.7, 14.4, and 14.7 ‰, respectively. The dual-isotope map of δ18O vs. δ15NSP in conjunction with Equations (5) and (6) was used to obtain the contribution of the ABF and DND processes and the extent of N2O reduction in the two scenarios (Table 2). In this study, it was observed that the DND process was the main process of the N2O emissions in all the treatments. Notably, the contribution of the DND process was lowest in the CK treatment (60%) and highest in the 25SP treatment (75.5%). Furthermore, when considering scenarios i and ii, the extent of N2O reduction was lowest in the CK treatment, with extents of 67.2 and 84.6%, whereas the highest extent of N2O reduction was observed for the 25SP treatment, with extents of 79.3 and 87.7%, respectively.

3.4. qPCR Assay of All the Treatments

There were significant differences in the abundance of the 16S rRNA, ITS, and N-related functional genes among the treatments (Figure 2A). The gene copy number of the 16S rRNA gene was significantly higher than those of the ITS genes in all the treatments. Meanwhile, the 16S rRNA gene copy number in the 25SP treatment was significantly higher than those in the CK treatment, while the ITS gene copy number in the 100SP treatment was significantly higher than those in the CK treatment. In addition, the gene copy number of the denitrification genes (nirK, nirS, nosZ, and p450nor) were significantly higher than those of the nitrification genes (AOA amoA and AOB amoA) in all the treatments (Figure 2A). For the different treatments, the relative abundance of functional genes was analyzed (Figure 2B), and the results showed that the 75SP treatment had a significantly higher relative abundance of nirK genes than the CK treatment, while its relative abundance of nosZ genes was significantly lower than in the CK treatment.

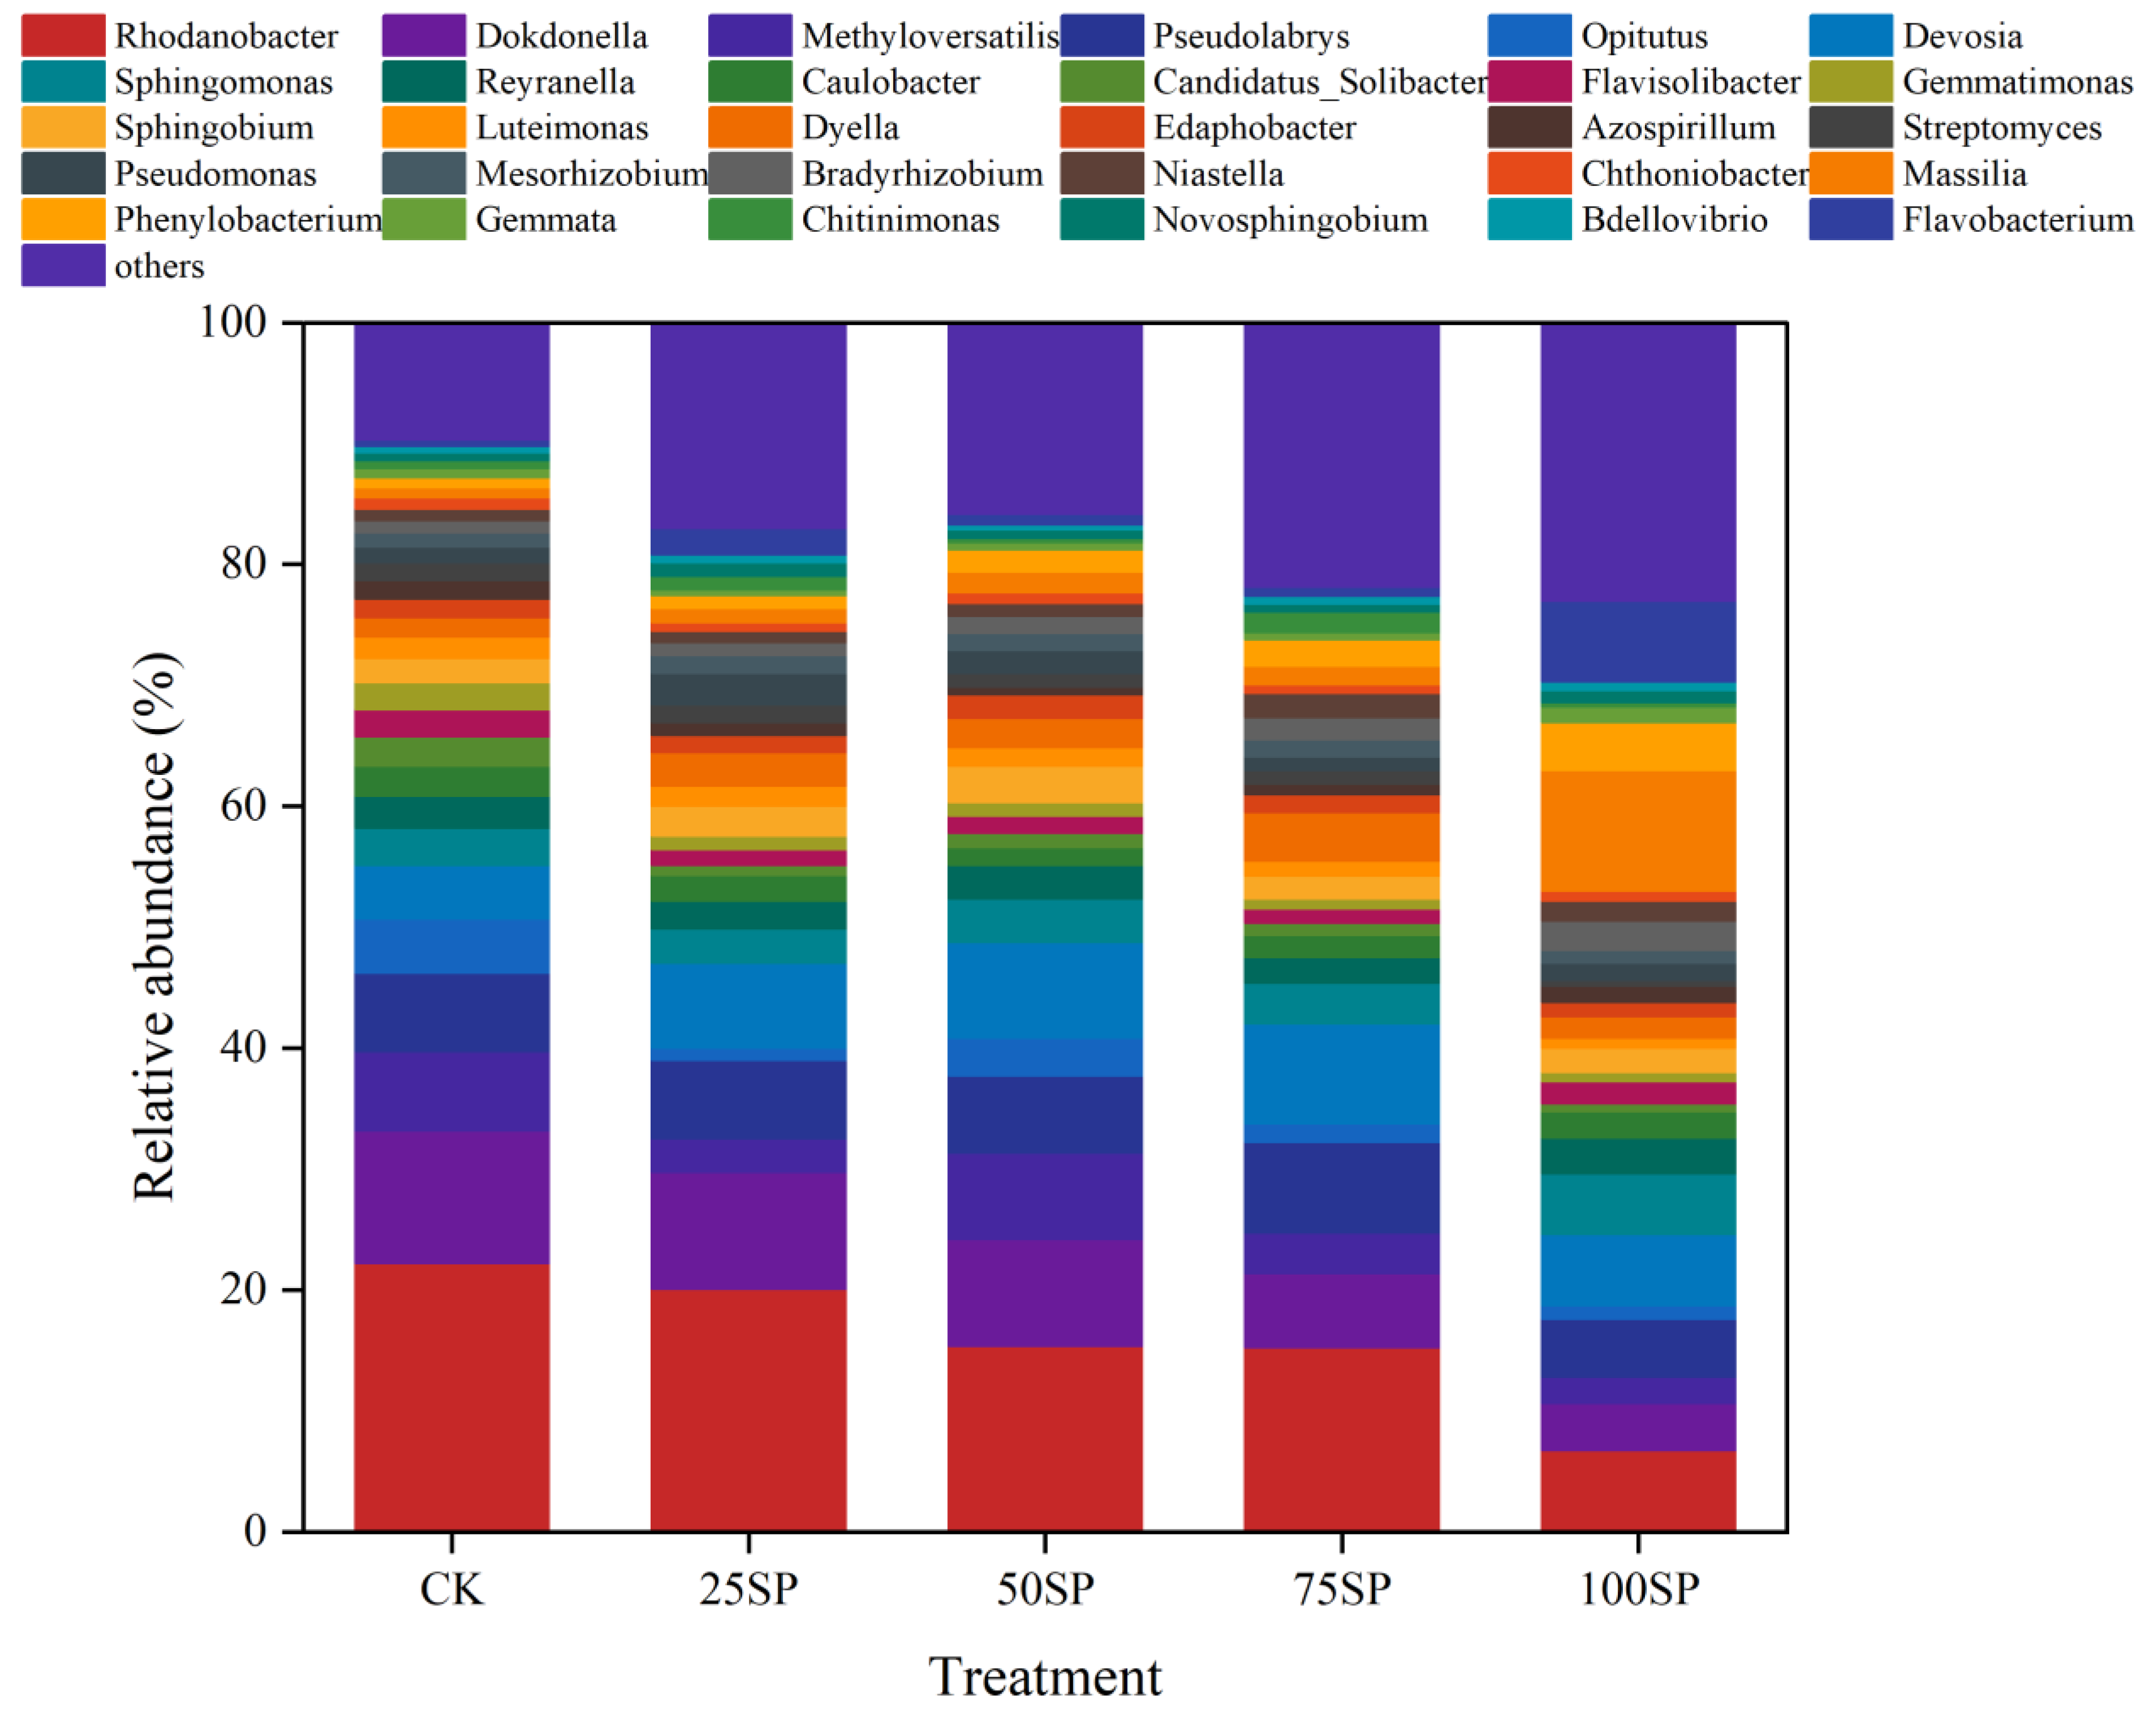
3.5. Microbial Community Composition of Genera

This study analyzed the microbial community composition at the genus level using high-throughput sequencing (Figure 3 and Figure 4C). The results showed that the proportion of denitrifying bacterial genera was 98.1%, 98.0%, 98.0%, 97.7%, and 97.8% for the CK, 25SP, 50SP, 75SP, and 100SP treatments, respectively. The dominant genera in the CK, 25SP, and 50SP treatments were Rhodanobacter and Dokdonella, and their relative abundance was 22.2% and 10.9%, 20.1% and 9.6%, 15.4% and 8.83%, respectively. Meanwhile, in the 75SP and 100SP treatments, the denitrifying dominant genera were Rhodanobacter (15.3%), Devosia (8.3%) and Massilia (10.0%), and Rhodanobacter (6.8%), respectively.
The genera that perform nitrifier denitrification were Bradyrhizobium, Nitrosospira, Nitrosomonas, and Streptomyces; the relative proportions of these genera in the denitrifying genera of th eCK, 25SP, 50SP, 75SP, and 100SP treatments were 2.6%, 2.7%, 2.2%, 3.1%, and 3.0%, respectively (Figure 4C). The contributions of the microbial pathways to N2O emissions from the different treatments were obtained from stable isotope analysis, functional gene abundance, and microbial community composition (Figure 4D). The main microbial pathway toward N2O emissions for all the treatments was that of the DD process, which contributed more than 50% of the total amount, while the contribution of the ND process was negligible (making up less than 2.5% of the total amount). Simultaneously, compared with the CK treatment, the 25SP treatment decreased the contribution of the BN, AN, and FD processes, while the 75SP treatment increased the contribution of the AN and FD processes.

3.6. Correlation Analysis between Microbial Communities and Physicochemical Properties

Redundancy analysis (RDA) explained 82.38% of the correlation between the microbial communities and physicochemical properties; C/N, EC, NO3, and the WFPS were the main explanatory factors of the microbial communities. The Rhodanobacter was significantly positively correlated with C/N and EC and significantly negatively correlated with the pH, and the Dokdonella was significantly negatively correlated with NH4+, the WFPS, and NO2. Correlation heat map analysis further confirmed these results. Meanwhile, the Massilia was significant positively correlated with NH4+ and the WFPS (Figure 5B, p < 0.05). Remarkably, microbial genera were not correlated with isotope δ-values.

4. Discussion

4.1. Effects of Different Sphagnum Substitution Rates on N2O Emissions

There were N2O emissions from the use of a peat substrate for greenhouse vegetable production. N2O is primarily produced and consumed through nitrification and denitrification by converting mineral nitrogen and also is influenced by the soil’s physicochemical properties [25]. In this study, N2O emissions were positively correlated with NH4+-N content and EC (Table 2). Therefore, the 75SP treatment exhibited significantly higher N2O emissions compared with those observed for the CK treatment, which were likely attributable to its higher NH4+-N content and EC (Table 1). However, there was no significant difference in N2O emissions between the CK treatment, 50SP treatment, and 100SP treatment, although the NH4+-N content and EC were significantly higher in the 50SP and 100SP treatments compared with the CK treatment. This result suggested that N2O emissions may be influenced by other factors [26]. Furthermore, the N2O emissions from the 25SP treatment were significantly lower than those from the CK treatment. Meanwhile, we have also observed a significant difference solely in the C/N ratio between the 25SP and CK treatments. Most studies considered that the C/N ratio can alter the microbial processes and thus affect N2O emissions [27,28], so the reason for lower N2O emissions in the 25SP treatment may be attributed to its comparatively lower C/N ratio. Notably, the WFPS is also one of the factors influencing microbial activity [29]. In the present study, the WFPS observed for all the treatments exceeded 60%, indicating that denitrification should be the dominant pathway for N2O production [30]. In order to further corroborate the hypothesis, this study investigated the microbial mechanisms of N2O emissions and the response of the mineral nitrogen and physicochemical properties of the soilless substrate to microorganisms.

4.2. Microbial Mechanisms of N2O Production and Consumption

The dual-isotope map of δ18O vs. δ15NSP has been widely used to distinguish the microbial pathways of N2O production and consumption [31]. In this study, consequently, the δ18O vs. δ15NSP map combined with Equations (5) and (6) was used to obtain the contribution of the ABF and DND processes and the extent of N2O reduction to N2 [32]. The results showed that the DND process dominated all the treatments, and the substitution of sphagnum for peat had a facilitating effect on the DND process. This was consistent with the previous findings based on WFPS analysis [6], and the promotion effect of sphagnum substitution for peat on the DND process was closely correlated with its enhancement of the WFPS (Table 1). Furthermore, in this study, different treatments had different extents of N2O reduction depending on whether scenario i or ii of N2O reduction occurred. The substitution of sphagnum for peat enhanced the extent of N2O reduction, with the 25SP treatment exhibiting the strongest extent of N2O reduction. This could be attributed to the 25SP treatment providing a more favorable C/N environment for the growth of N2O-reducing microorganisms [33]. It is worth noting that the DND process is primarily driven by bacteria. Moreover, scenario i of N2O reduction is more likely to occur under the process dominated by bacteria [6,34]. Therefore, we believe that scenario i may be more closely aligned with the actual situation in this study.
The results based on a qPCR assay showed that the abundance of the 16S rRNA gene was significantly higher than that of the ITS gene, and the gene copy number of denitrification-related genes (nirS, nirK, nosZ, and p450nor) was significantly higher than that of nitrification-related genes (AOA amoA and AOB amoA). This signifies that N2O production and consumption were predominantly governed by bacterial activity, with bacterial denitrification being the primary mechanism. This further confirms the analysis results of the δ18O vs. δ15NSP map. In addition, the 75SP treatment had a significantly higher nirK gene, which is associated with N2O production, than the that of the CK treatment, while nosZ, which is a gene associated with N2O reduction, was significantly lower in the 75SP treatment than in the CK treatment, with this perhaps being a reason for the higher N2O emissions in the 75SP treatment. The reason for this result may be that the 75SP treatment has a stronger inorganic nitrogen content, which in turn provides more substrates for the denitrification process. Meanwhile, we further analyzed the microbial community composition. The results showed that denitrifying bacteria genera accounted for more than 96% of the genera in different treatments. The dominant denitrifying bacterial genus in the CK treatment was Rhodanobacter and Dokdonella. As the proportion of sphagnum replacing peat increases, Massilia gradually supplanted Dokdonella as the predominant denitrifying bacterial genus. Previous studies have identified Rhodanobacter as a genus with a fully denitrifying capacity that is present in a variety of habitats [35,36], while Massilia is the common dominant genus among all the mosses tested based on the previous library of research [37]. Therefore, the substitution of peat with sphagnum can alter the structure and composition of microbial communities in the substrate and enhance the denitrification potential through increasing the dominance of Massilia.
In this study, based on the contribution analysis of the microbial pathways, the relative contributions of the BN, AN, FD ND, and DD processes were roughly differentiated (Figure 4D). The five microbial processes have different effects on N2O emissions, the BN and AN processes mainly produce N2O as a byproduct of bacterial and fungal nitrification, while the FD process lacks N2O reductase resulting in N2O as a final product. Compared with FD, BN produced a higher amount of N2O. This is due to the fact that BN not only generated N2O through nitrification but also increased the substrate for denitrification by converting NH4+-N to NO3-N, thereby resulting in secondary N2O emissions [11]. In addition, the extent of N2O reduction is the main factor determining the N2O emissions, and N2O reduction only occurs in the DD and ND processes, so the DD and ND processes also affect the N2O emissions. In this study, different rates of substitution with sphagnum had a different effect on the relative contributions of microbial processes. The 25SP treatment had the lowest contributions of BN and FD, the strongest contribution of DD, and the highest extent of N2O reduction. This may be the reason why the 25SP treatment has the lowest N2O emissions. In contrast, 75SP had the highest N2O emissions probably because of its stronger contributions of FD and AN compared with those of the CK treatment.

4.3. The Correlation between Microbial Action and Environmental Factors due to Sphagnum Substitution

Redundancy analysis (Figure 5A) showed that environmental factors explained 82.4% of the variation of the denitrifying bacteria genera in this study, with C/N explaining most of the variation, followed by EC and NO3N. This was similar to previous correlation analyses of soil properties with bacterial communities [38]. It can be concluded that sphagnum substitution significantly alters C/N, EC, and NO3-N, which indirectly affect the variation in denitrifying bacteria genera communities, ultimately resulting in different N2O emissions [39]. Correlation heat map analysis (Figure 5B) showed that Rhodanobacter was positively correlated with C/N and EC and negatively correlated with the pH. This was consistent with previous studies on Rhodanobacter [40,41]. This result indicated that the growth of Rhodanobacter requires the environment to provide sufficient sources of carbon and a suitable pH. Sphagnum substitution reduces the C/N ratio of the peat substrate, which in turn reduces the supply of the carbon source and decreases the activity of Rhodanobacter. In addition, the activity of Massilia was mainly influenced by NH4+-N and the WFPS [42,43]. Sphagnum substitution significantly increased NH4+-N and the WFPS, which enhanced the activity of Massilia. Remarkably, N2O emissions in this study were directly affected by NH4+-N and EC, while the dominant microbial genera had no direct correlation with N2O emissions. Therefore, sphagnum substitution may affect the microbial community structure indirectly by regulating environmental factors to influence N2O emission.
In this study, the pH values among various treatments were essentially identical, thereby suggesting that sphagnum is a prerequisite substance for peat formation and has a similar pH to that of peat [44]. However, sphagnum significantly changed other physicochemical properties. Firstly, the higher substitution rate of sphagnum significantly elevated the WFPS of the soilless substrate, indicating that sphagnum possesses superior water retention [45]. Secondly, sphagnum increased the EC of the soilless substrate, implying a higher concentration of inorganic nutrients within the moss. Notably, there has been a notable augmentation in the levels of NH4+-N and NO3-N contents, thereby providing plants with an enriched nitrogen supply for their growth. However, these nutrients did not exert a significant impact on the yield of lettuce, thus indicating that sphagnum can serve as a viable substitute for peat. In addition, the nitrogen use efficiency of the 25SP, 50SP, and 75SP treatments was significantly higher than that of the CK treatment, thereby indicating that a proper substitution rate of sphagnum could enhance the nitrogen uptake by lettuce. Considering the N2O emissions from each treatment, it can be observed that the 25% substitution of peat with sphagnum is the optimal substitution ratio, which is followed by a substitution ratio of 50%.

5. Conclusions

In this study, the substitution of peat with sphagnum was able to improve nitrogen use efficiency without a discernible impact on lettuce yield. However, varying substitution rates had different effects on N2O emissions, with a 25% substitution rate resulting in the highest reduction, which amounted to a decrease of 55.4%. Compared with the CK treatment, a rate of 25% for sphagnum substitution enhanced the extent of N2O reduction and reduced the contribution of bacterial nitrification and fungal denitrification processes, resulting in reduced N2O emissions. Moreover, the substitution of sphagnum has altered the community structure of bacteria, thus leading to a decrease in the dominant genus Rhodanobacter within the peat and an increase in the dominant genus Massilia within the sphagnum. Rhodanobacter was correlated with the EC and C/N of the soilless substrate, while Massilia was correlated with NH4+-N and the WFPS of the soilless substrate. In summary, a substitution rate of at least 25% for sphagnum can be used to replace the peat substrate, and 50% is an equally good substitution, with 25–50% being the optimal ratio for sphagnum to substitute for peat. Rhodanobacter and Massilia have different responses to environmental factors. More importantly, the combined analysis of the δ18O vs. δ15NSP map, functional genes, and microbial community provide a novel perspective and an effective tool to assess the multiple microbial processes of N2O production and consumption.

Supplementary Materials

The following supporting information can be downloaded at: https://www.mdpi.com/article/10.3390/agronomy14020369/s1. Table S1: Initial characteristics of raw materials; Table S2: Composition of nutrient solution; Table S3: Primer sequences of different genes; Table S4: δ15Nsp15NSPred and δ18O/η18Ored values for different N2O production and consumption pathways with the minimum, maximum and mean of end-member values used in the double isotopocule plot approach; Figure S1: The yield (A) and nitrogen use efficiency (B) of different treatments; Figure S2: The values of substrate-driven N2O isotopocule deltas, δ15N, δ15Nα, and δ18O obtained according to Keeling plot method for all treatments; Text S1: WFPS and Nitrogen use efficiency; Text S2: qPCR reactions efficiency and standards.

Author Contributions

X.L.: conceptualization, methodology, data curation, formal analysis, and writing—review and editing. H.W.: methodology, and writing—review and editing. Y.Z.: writing —review and editing. R.Y.: writing—review and editing. D.Z.: writing–review and editing. W.Z.: conceptualization and methodology. Z.Q.: conceptualization and project administration. W.L.: conceptualization, methodology, writing–review and editing, and project administration. All authors have read and agreed to the published version of the manuscript.

Funding

This work was supported by the open project of the State Key Laboratory of Efficient Utilization of Arid and Semi-Arid Arable Land in Northern China (EUAL-2023-04), the National Natural Science Foundation of China (42107040), and the Sichuan Science and Technology Program (2023YFQ0065).

Data Availability Statement

The original contributions presented in the study are included in the article/supplementary material, further inquiries can be directed to the corresponding author/s.

Conflicts of Interest

The authors declare that the research was conducted in the absence of any commercial or financial relationships that could be construed as a potential conflict of interest.

References

  1. Gruda, N.S. Advances in Horticultural Soilless Culture; Burleigh Dodds Science Publishing: London, UK, 2021. [Google Scholar] [CrossRef]
  2. Taskila, S.; Sarkela, R.; Tanskanen, J. Valuable applications for peat moss. Biomass Convers. Biorefinery 2016, 6, 115–126. [Google Scholar] [CrossRef]
  3. Baranyai, B.; Krebs, M.; Oehmke, C.; Joosten, H. Total biomass and annual yield of Drosera on cultivated Sphagnum in north-west Germany. Mires Peat 2022, 28, 19. [Google Scholar] [CrossRef]
  4. Wichmann, S.; Krebs, M.; Kumar, S.; Gaudig, G. Paludiculture on former bog grassland: Profitability of Sphagnum farming in North West Germany. Mires Peat 2020, 26, 18. [Google Scholar] [CrossRef]
  5. Muller, R.; Glatzel, S. Sphagnum farming substrate is a competitive alternative to traditional horticultural substrates for achieving desired hydro-physical properties. Mires Peat 2021, 27, 1–12. [Google Scholar] [CrossRef]
  6. Lin, W.; Li, Q.; Zhou, W.; Yang, R.; Zhang, D.; Wang, H.; Li, Y.; Qi, Z.; Li, Y. Insights into production and consumption processes of nitrous oxide emitted from soilless culture systems by dual isotopocule plot and functional genes. Sci. Total Environ. 2023, 856, 159046. [Google Scholar] [CrossRef] [PubMed]
  7. Lawrence, N.C.; Tenesaca, C.G.; VanLoocke, A.; Hall, S.J. Nitrous oxide emissions from agricultural soils challenge climate sustainability in the US Corn Belt. Proc. Natl. Acad. Sci. USA 2021, 118, e2112108118. [Google Scholar] [CrossRef] [PubMed]
  8. Ravishankara, A.R.; Daniel, J.S.; Portmann, R.W. Nitrous Oxide (N2O): The Dominant Ozone-Depleting Substance Emitted in the 21st Century. Science 2009, 326, 123–125. [Google Scholar] [CrossRef] [PubMed]
  9. Aksenov, A.S.; Shirokova, L.S.; Kisil, O.Y.; Kolesova, S.N.; Lim, A.G.; Kuzmina, D.; Pouillé, S.; Alexis, M.A.; Castrec-Rouelle, M.; Loiko, S.V.; et al. Bacterial Number and Genetic Diversity in a Permafrost Peatland (Western Siberia): Testing a Link with Organic Matter Quality and Elementary Composition of a Peat Soil Profile. Diversity 2021, 13, 328. [Google Scholar] [CrossRef]
  10. Zhu, D.; Wang, Z.; Zhang, Z. Effects of heavy metal pollution and soil physicochemical properties on the Sphagnum farmland soil microbial community structure in Southern Guizhou, China. Int. J. Phytoremediation 2023, 25, 1762–1773. [Google Scholar] [CrossRef]
  11. Liang, X.; Zhou, W.; Yang, R.; Zhang, D.; Wang, H.; Li, Q.; Qi, Z.; Li, Y.; Lin, W. Microbial mechanism of biochar addition to reduce N2O emissions from soilless substrate systems. J. Environ. Manag. 2023, 348, 119326. [Google Scholar] [CrossRef]
  12. Johannes, H.; Hans-Martin, K.; Stefanie, S.; Reiner, R.; Markus, F.; Thomas, S.; Andreas, K.; Sebastian, B. Linking N2O emissions from biochar-amended soil to the structure and function of the N-cycling microbial community. ISME J. 2014, 8, 660–674. [Google Scholar]
  13. Wang, J.; Zou, J. No-till increases soil denitrification via its positive effects on the activity and abundance of the denitrifying community. Soil Biol. Biochem. 2020, 142, 107706. [Google Scholar] [CrossRef]
  14. Aldossari, N.; Ishii, S. Fungal denitrification revisited—Recent advancements and future opportunities. Soil Biol. Biochem. 2021, 157, 108250. [Google Scholar] [CrossRef]
  15. Lin, W.; Ding, J.; Xu, C.; Zheng, Q.; Zhuang, S.; Mao, L.; Li, Q.; Liu, X.; Li, Y. Evaluation of N2O sources after fertilizers application in vegetable soil by dual isotopocule plots approach. Environ. Res. 2020, 188, 109818. [Google Scholar] [CrossRef] [PubMed]
  16. Lin, W.; Ding, J.; Li, Y.; Zhang, W.; Ahmad, R.; Xu, C.; Mao, L.; Qiang, X.; Zheng, Q.; Li, Q. Partitioning of sources of N2O from soil treated with different types of fertilizers by the acetylene inhibition method and stable isotope analysis. Eur. J. Soil Sci. 2019, 70, 1037–1048. [Google Scholar] [CrossRef]
  17. Masta, M.; Espenberg, M.; Gadegaonkar, S.S.; Pärn, J.; Sepp, H.; Kirsimäe, K.; Sgouridis, F.; Müller, C.; Mander, Ü. Integrated isotope and microbiome analysis indicates dominance of denitrification in N2O production after rewetting of drained fen peat. Biogeochemistry 2022, 161, 119–136. [Google Scholar] [CrossRef]
  18. Lewicka-Szczebak, D.; Dyckmans, J.; Kaiser, J.; Marca, A.; Augustin, J.; Well, R. Oxygen isotope fractionation during N2O production by soil denitrification. Biogeosciences 2016, 13, 1129–1144. [Google Scholar] [CrossRef]
  19. Lewicka-Szczebak, D.; Augustin, J.; Giesemann, A.; Well, R. Quantifying N2O reduction to N2 based on N2O isotopocules–validation with independent methods (helium incubation and 15N gas flux method). Biogeosciences 2017, 14, 711–732. [Google Scholar] [CrossRef]
  20. Guo, S.; Wu, J.; Han, Z.; Li, Z.; Xu, P.; Liu, S.; Wang, J.; Zou, J. The legacy effect of biochar application on soil nitrous oxide emissions. GCB Bioenergy 2022, 15, 478–493. [Google Scholar] [CrossRef]
  21. Malghani, S.; Yoo, G.-y.; Giesemann, A.; Well, R.; Kang, H. Combined application of organic manure with urea does not alter the dominant biochemical pathway producing N2O from urea treated soil. Biol. Fertil. Soils 2019, 56, 331–343. [Google Scholar] [CrossRef]
  22. Masta, M.; Espenberg, M.; Kuusemets, L.; PÄRn, J.; Thayamkottu, S.; Sepp, H.; KirsimÄE, K.; Sgouridis, F.; Kasak, K.; Soosaar, K.; et al. 15N tracers and microbial analyses reveal in situ N2O sources in contrasting water regimes on drained peatland forest. Pedosphere 2023, in press. [CrossRef]
  23. Xuan, Y.; Mai, Y.; Xu, Y.; Zheng, J.; He, Z.; Shu, L.; Cao, Y. Enhanced microbial nitrification-denitrification processes in a subtropical metropolitan river network. Water Res. 2022, 222, 118857. [Google Scholar] [CrossRef]
  24. Mateus-Barros, E.; Meneghine, A.K.; Bagatini, I.L.; Fernandes, C.C.; Kishi, L.T.; Vieira, A.A.H.; Sarmento, H. Comparison of two DNA extraction methods widely used in aquatic microbial ecology. J. Microbiol. Methods 2019, 159, 12–17. [Google Scholar] [CrossRef] [PubMed]
  25. Lin, S.; Hernandez-Ramirez, G. Nitrous oxide emissions from manured soils as a function of various nitrification inhibitor rates and soil moisture contents. Sci. Total Environ. 2020, 738, 139669. [Google Scholar] [CrossRef]
  26. Guo, Y.; Geng, J.; Cheng, S.; Fang, H.; Li, X.; Yang, Y.; Li, Y.; Zhou, Y. Soil acidification and ammonia-oxidizing archaeal abundance dominate the contrasting responses of soil N2O emissions to NH4+ and NO3 enrichment in a subtropical plantation. Eur. J. Soil Biol. 2023, 116, 103491. [Google Scholar] [CrossRef]
  27. Xu, Z.; Zhang, T.; Wang, S.; Wang, Z. Soil pH and C/N ratio determines spatial variations in soil microbial communities and enzymatic activities of the agricultural ecosystems in Northeast China: Jilin Province case. Appl. Soil Ecol. 2020, 155, 103629. [Google Scholar] [CrossRef]
  28. Bagheri Novair, S.; Mirseyed Hosseini, H.; Etesami, H.; Razavipour, T. Rice straw and composted azolla alter carbon and nitrogen mineralization and microbial activity of a paddy soil under drying–rewetting cycles. Appl. Soil Ecol. 2020, 154, 103638. [Google Scholar] [CrossRef]
  29. Liu, X.; Rezaei Rashti, M.; Van Zwieten, L.; Esfandbod, M.; Rose, M.T.; Chen, C. Microbial carbon functional responses to compaction and moisture stresses in two contrasting Australian soils. Soil Tillage Res. 2023, 234, 105825. [Google Scholar] [CrossRef]
  30. Volpi, I.; Laville, P.; Bonari, E.; di Nasso, N.N.o.; Bosco, S. Improving the management of mineral fertilizers for nitrous oxide mitigation: The effect of nitrogen fertilizer type, urease and nitrification inhibitors in two different textured soils. Geoderma 2017, 307, 181–188. [Google Scholar] [CrossRef]
  31. Yamamoto, A.; Akiyama, H.; Nakajima, Y.; Hoshino, Y.T. Estimate of bacterial and fungal N2O production processes after crop residue input and fertilizer application to an agricultural field by 15N isotopomer analysis. Soil Biol. Biochem. 2017, 108, 9–16. [Google Scholar] [CrossRef]
  32. Li, Y.; Zheng, Q.; Yang, R.; Zhuang, S.; Lin, W.; Li, Y. Evaluating microbial role in reducing N2O emission by dual isotopocule mapping following substitution of inorganic fertilizer for organic fertilizer. J. Clean. Prod. 2021, 326, 129442. [Google Scholar] [CrossRef]
  33. Liao, J.; Hu, A.; Zhao, Z.; Liu, X.; Jiang, C.; Zhang, Z. Biochar with large specific surface area recruits N2O-reducing microbes and mitigate N2O emission. Soil Biol. Biochem. 2021, 156, 108212. [Google Scholar] [CrossRef]
  34. Wu, D.; Well, R.; Cardenas, L.M.; Fuss, R.; Lewicka-Szczebak, D.; Koster, J.R.; Bruggemann, N.; Bol, R. Quantifying N2O reduction to N2 during denitrification in soils via isotopic mapping approach: Model evaluation and uncertainty analysis. Environ. Res 2019, 179, 108806. [Google Scholar] [CrossRef] [PubMed]
  35. Peng, M.; Wang, D.; Lui Lauren, M.; Nielsen, T.; Tian, R.; Kempher Megan, L.; Tao, X.; Pan, C.; Chakraborty, R.; Deutschbauer Adam, M.; et al. Genomic Features and Pervasive Negative Selection in Rhodanobacter Strains Isolated from Nitrate and Heavy Metal Contaminated Aquifer. Microbiol. Spectr. 2022, 10, e02591-21. [Google Scholar] [CrossRef] [PubMed]
  36. Dahal, R.H.; Kim, J. Rhodanobacter humi sp. nov., an acid-tolerant and alkalitolerant gammaproteobacterium isolated from forest soil. Int. J. Syst. Evol. Microbiol. 2017, 67, 1185–1190. [Google Scholar] [CrossRef] [PubMed]
  37. Tian, Y.; Li, Y.H. Comparative analysis of bacteria associated with different mosses by 16S rRNA and 16S rDNA sequencing. J. Basic Microbiol. 2017, 57, 57–67. [Google Scholar] [CrossRef]
  38. Liu, M.; Zhang, W.; Wang, X.; Wang, F.; Dong, W.; Hu, C.; Liu, B.; Sun, R. Nitrogen leaching greatly impacts bacterial community and denitrifiers abundance in subsoil under long-term fertilization. Agric. Ecosyst. Environ. 2020, 294, 106885. [Google Scholar] [CrossRef]
  39. Yang, Z.; She, R.; Hu, L.; Yu, Y.; Yao, H. Effects of biochar addition on nitrous oxide emission during soil freeze–thaw cycles. Front. Microbiol. 2022, 13, 1033210. [Google Scholar] [CrossRef]
  40. Zhang, Y.; Fang, Y.; Wang, B.; Zhang, H.; Ding, J. Effects of Stepwise Adjustment of C/N during the Start-Up of Submerged Membrane Bioreactors (SMBRs) on the Aerobic Denitrification of Wastewater. Water 2021, 13, 3251. [Google Scholar] [CrossRef]
  41. van den Heuvel, R.N.; van der Biezen, E.; Jetten, M.S.; Hefting, M.M.; Kartal, B. Denitrification at pH 4 by a soil-derived Rhodanobacter-dominated community. Environ. Microbiol. 2010, 12, 3264–3271. [Google Scholar] [CrossRef]
  42. Xiao, X.; Liu, Z.T.; Shen, R.F.; Zhao, X.Q. Nitrate has a stronger rhizobacterial-based effect on rice growth and nitrogen use than ammonium in acidic paddy soil. Plant Soil 2023, 487, 605–621. [Google Scholar] [CrossRef]
  43. Qin, H.; Xing, X.; Tang, Y.; Zhu, B.; Wei, X.; Chen, X.; Liu, Y. Soil moisture and activity of nitrite- and nitrous oxide-reducing microbes enhanced nitrous oxide emissions in fallow paddy soils. Biol. Fertil. Soils 2019, 56, 53–67. [Google Scholar] [CrossRef]
  44. Harpenslager, S.F.; van den Elzen, E.; Kox, M.A.R.; Smolders, A.J.P.; Ettwig, K.F.; Lamers, L.P.M. Rewetting former agricultural peatlands: Topsoil removal as a prerequisite to avoid strong nutrient and greenhouse gas emissions. Ecol. Eng. 2015, 84, 159–168. [Google Scholar] [CrossRef]
  45. Kamarainen, A.; Jokinen, K.; Linden, L. Adding Sphagnum to peat growing medium improves plant performance under water restricting conditions. Mires Peat 2020, 26, 13. [Google Scholar] [CrossRef]
Figure 1. Time series of the NO3−N content (A), NH4+−N content (B), NO2−N content (C), and N2O flux and cumulated N2O flux (D) during the whole experimental stage. Different alphabets represent significant differences in one-way ANOVA among treatment groups. Results were shown as means ± standard deviation (n = 6). CK, 25SP, 50SP, 75SP, and 100BC treatments represent 0%, 25%, 50%, 75%, and 100% values of the amount of sphagnum used instead of peat in the soilless substrate, respectively.
Agronomy 14 00369 g001
Figure 2. Gene copy number of 16S rRNA and ITS, AOB amoA, AOA amoA, nirK, nirS, nosZ, and p450nor (A) and the relative abundance of AOB amoA, AOA amoA, nirK, nirS, nosZ, and p450nor (B) in different treatments. * represents a significant difference between genes. Different alphabets represent significant differences in one-way ANOVA among treatment groups.
Agronomy 14 00369 g002
Figure 3. Microbial genera community composition and relative abundance in different treatments.
Agronomy 14 00369 g003
Figure 4. Dual−isotope map of δ18O vs. δ15NSP (A); relative proportion of BN, AN, and FD in the ABF process (B); relative proportion of ND and DD in the DND process (C); and relative contribution of BN, AN, FD, ND, and DD (D).
Agronomy 14 00369 g004
Figure 5. Redundancy analysis (RDA) (A) and correlation heat map analysis (B) of the physicochemical properties of soilless substrates with dominant bacteria genera. * indicates p < 0.05, ** indicates p < 0.01, *** indicates p < 0.001.
Agronomy 14 00369 g005
Table 1. Average of the time series mean of the WFPS, pH, EC and C/N, NO3-N, NH4+-N, and NO2-N contents.
TreatmentWFPS
%
pHEC
μS cm−1
C/NNO3
mg kg−1
NH4+
mg kg−1
NO2
mg kg−1
Bulk Density
g cm−3
CK62.5 ± 1.6 b6.4 ± 0.1841.0 ± 353.6 b42.3 ± 2.3 a34.3 ± 10.5 c2.7 ± 0.5 c0.8 ± 0.30.17 ± 0.04
25SP62.1 ± 1.3 b6.5 ± 0.1738.0 ± 137.4 b37.0 ± 2.6 b41.4 ± 4.8 c4.9 ± 0.7 c0.9 ± 0.20.15 ± 0.03
50SP70.6 ± 5.2 a6.5 ± 0.11016.7 ± 192.2 ab34.6 ± 1.5 bc55.4 ± 3.2 b12.6 ± 2.5 b1.3 ± 0.40.13 ± 0.03
75SP71.9 ± 6.0 a6.5 ± 0.11328.5 ± 377.8 a30.6 ± 4.3 cd61.2 ± 9.0 b23.2 ± 2.0 a1.3 ± 0.30.11 ± 0.02
100SP70.3 ± 3.5 a6.4 ± 0.21352.4 ± 104.6 a25.9 ± 2.8 d74.1 ± 3.6 a22.3 ± 2.6 a1.1 ± 0.20.08 ± 0.02
Note: WFPS: water-filled pore space; EC: electrical conductivity; C/N: rate of total carbon to total nitrogen; NO3: nitrate nitrogen; NH4+: ammonium nitrogen; NO2: nitrite nitrogen. Different alphabets represent significant differences in one-way ANOVA among treatment groups, as follows.
Table 2. Analysis of the Pearson correlation among different parameters.
NO3NH4+NO2pHECC/NWFPSδ15Nαδ15Nδ18O
NO310.78 **0.57 **−0.7 **0.91 ***−0.49 **0.58 **−0.44 **−0.15−0.24
NH4+0.78 **10.56 **−0.280.76 **−0.61 **0.180.01−0.160.13
NO20.57 **0.56 **1−0.34 *0.57 **−0.4 **0.25−0.28−0.24−0.23
N2O0.160.41 *0.21−0.080.35 **−0.280.06−0.11−0.140.05
Note: * correlation is significant at the 0.05 level; ** correlation is significant at the 0.01 level; *** correlation is significant at the 0.001 level.
Table 3. δ15Nbulk, δ15Nα, δ18O, δ15NSP, contributions of ABF and DND, and the extents of N2O reduction in scenario i and scenario ii in different treatments.
Treatmentδ15Nbulk
δ15Nα
δ18O
δ15NSP
ABF
%
DND
%
Scenario i
%
Scenario ii
%
CK−5.5−13.635.216.140.060.067.284.6
25SP−4.7−11.038.812.824.575.579.387.7
50SP−3.2−10.736.713.730.070.074.285.7
75SP−2.6−9.835.714.433.5966.471.184.7
100SP−0.1−7.437.714.732.2567.875.187.3
Disclaimer/Publisher’s Note: The statements, opinions and data contained in all publications are solely those of the individual author(s) and contributor(s) and not of MDPI and/or the editor(s). MDPI and/or the editor(s) disclaim responsibility for any injury to people or property resulting from any ideas, methods, instructions or products referred to in the content.

