Abstract
Eastern gamagrass (Tripsacum dactyloides) is highly palatable, ideal for grazing and hay production in the United States. It is deep rooted and resilient, tolerant of flooding and drought. Objectives of this study were to develop plant parameters for different ecotypes of this grass. Data collected in field plots of diverse ecotypes included biomass, leaf area index (LAI), light extinction coefficient (k), and radiation use efficiency (RUE). Average LAI was 1.06 and average k was −1.05. The power response of k to LAI offers a new approach to simulating light interception at very low LAI values and throughout the range of LAI values of these ecotypes and similar grass species. The RUE values, which ranged from 1.16 to 4.31 g/MJ, highlight the immense diversity of eastern gamagrass. The high RUE values for the most productive ecotypes emphasizes the importance of this grass species for hay and grazing. While not as large as switchgrass (Panicum virgatum) values, it is still a prominent forage species that even is comparable to maize (Zea mays L.) in productivity when expressed as radiation use efficiency. These results are an important step in developing relationships and parameters to simulate the different ecotypes of this grass with process-based models.
1. Introduction
As discussed in a previous paper [1], native grasses have multiple advantages which make their widespread use desirable. Often, native grasses have lower fertilizer requirements, high palatability, high drought tolerance, and high yield stability. Eastern gamagrass (Tripsacum dactyloides) (EG) is a promising warm season, perennial bunchgrass that has multiple applications in ecosystem services and agriculture. EG is highly palatable, ideal for grazing and hay production in the eastern half of the United States; but its high palatability [2,3] has led to its disappearance over much of its range due to overgrazing [4].
EG can be grown on acidic soils, compacted or sloping soils, and ones with limited O2 availability [5,6]. The extensive rooting system stabilizes soils and improves water infiltration into the soil [6]. It can be grown on compacted soils with its deep roots allowing water, heat, and airflow to circulate through the soil. EG has even rooted deeper than 180 cm when growing on a claypan soil with limited infiltration by water [6]. These roots provide tolerance to drought and frequent flooding [5,6,7,8,9].
Process-based models, such as ALMANAC, are useful tools for evaluating and comparing various agricultural systems [10]. ALMANAC [11,12,13,14] is a daily timestep, process-based model and is described at https://www.ars.usda.gov/plains-area/temple-tx/grassland-soil-and-water-research-laboratory/docs/193226 (accessed on 22 January 2024). Once realistic plant parameters are developed for a grass or crop of interest, such a model can simulate and predict plant productivity on different soils and in years with various climatic conditions. As producers consider widespread planting of native grasses such as EG, ALMANAC will be useful to weigh long-term productivity against costs of grass establishment. This model can be used to better manage the grass to avoid overgrazing and stand depletion [12,14,15,16,17,18]. Management techniques, like plant spacing, can impact its growth, so applying ALMANAC to EG will allow a greater understanding of its potential [3].
When this process was undertaken with switchgrass (Panicum virgatum L.) as the test species [14,17] the model was able to realistically simulate switchgrass yields using multi-year field data. It needed improvement in predicting year-to-year variability, but it was able to identify the total variability of all the pooled data, as well as the parameters and yield-limiting factors that may have caused the irregularity.
ALMANAC has been used to simulate exotic, warm season perennial grasses, such as buffelgrass (Pennisetum ciliare (L.) Link) and Old World Bluestems (Bothriochloa kuntze, Capillipedium stapf, and Dichanthium willemet) [12]. It has also been used to simulate coastal bermudagrass (Cynodon dactylon (L.) Pers.), bahiagrass (Paspalum notatum Flügge var saurae Parodi) [16], and switchgrass [14,17,19,20]. To develop their datasets, researchers utilized publicly available information about the environment (such as weather and soil) and biomass data collected from study sites throughout the growing season over several years. The field data collected included biomass data and photosynthetically active radiation (PAR) intercepted by the canopy. Leaf area index (LAI) was calculated in order to derive the light extinction coefficient (k) for Beer’s law [21], and the radiation use efficiency (RUE). Ultimately, the authors found that LAI and RUE successfully simulated the biomass of these crops. The k value has generally been shown to be fairly stable across LAI values for most grasses. When looking at four warm season grasses [22] including EG, big bluestem (Andropogon gerardii) was the only grass showing any trends of increasing k with very low LAI values.
Other studies have looked at variability in native warm season grasses as related to local adaptation and ecotype selection. Johnson et al. [23] worked with three ecotypes of big bluestem and reported local adaptation in establishment and vegetative cover along a climatic gradient. Casler [24] measured biomass from upland switchgrass ecotypes and found octoploids to be more responsive to favorable environments. Adaptation relating morphology to genetics in EG has been studied for nearly 50 years with attempts to determine correlation mostly negative or inconclusive [1,25,26]. However, Schliesing and Dahl [27] found wide differences in forage productivity for 30 ecotypes of EG from Texas and Oklahoma growing in a common garden near Uvalde, Texas. EG ecotypes are highly variable as shown in a study of 294 ecotypes with height of the largest ecotype five times that of the smallest, and canopy diameters ranging from 42 cm to 266 cm [1].
Even so, with the immense diversity of EG, it is critical for producers to determine the optimum ecotype for their situation. Therefore, the objectives were to measure and develop plant parameters important for modeling different ecotypes of EG, thereby allowing producers to determine which ecotype will be best suited for their specific landscape.
2. Materials and Methods
A collection of EG was grown in a common garden at the USDA-ARS Grassland, Soil and Water Research Laboratory in Temple, Texas, USA. Detailed description of the entire collection, sites of origin, and collection methods can be found in Kiniry et al. [1]. The data for this study was measured in different plots of diverse ecotypes from the large collection which are detailed in Appendix A. All plots were established in the spring of 2019. Ecotypes were chosen to represent the range of variability of the entire collection. Ecotypes were randomized within each of the 3 replications. A single replication of one ecotype consisted of 1 row of 5 plants transplanted 1 m apart. Each plot has 1.5 m between the center of the end plant and the center of the next ecotype’s plant. The number of ecotypes with viable data varied among the three years of this study. In 2020, the study began by calculating LAI for 4 EG ecotypes and RUE for 3. In 2022, the study grew to include LAI and RUE for 18 EG ecotypes. Lastly, in 2023, LAI was calculated for 20 ecotypes and RUE for 3. The small number of ecotypes in 2020 and lack of data for 2021 was due to the global pandemic. RUE was not collected evenly for every ecotype due to the frequency of sampling and the available number of plants remaining to harvest in a season, as RUE must be calculated with an increase in dry weight. Samples of 2 ecotypes of switchgrass, also planted in 2019, were taken in 2023 to allow for comparison to reported RUE values. This also serves to show how the field’s ecotypes of EG and switchgrass compare as a standard, and between the species.
Ecotypes were measured and destructively sampled during the active growing season. We measured photosynthetically active radiation (PAR) interception with a 0.8-m-long AccuPAR LP-80 ceptometer (Decagon, Pullman, Washington, DC, USA). We took at least 5 measurements in rapid succession while moving the ceptometer laterally at the base of the plant beneath the canopy. Each measurement with the ceptometer had a corresponding measurement from an external PAR sensor. The fraction of PAR intercepted was calculated with the mean of the measurements above and below the canopy. Measurements were taken between 10:00 a.m. and 12:00 p.m. local time during times with relative stable incident solar radiation (without intermittent clouds). Daily values for fraction of PAR intercepted were calculated by linearly interpolating between values for the measurement dates. Care was taken to ensure only the target plant was measured and no neighboring shadows occurred within the sampling space. The plant was cut at the level just above where the ceptometer measurements were taken, brought to the laboratory, weighed fresh in its entirety. Then, a subsample was weighed fresh, and the leaf area measured on the subsample with a LiCor LI-3100 leaf area meter (LiCor Inc., Lincoln, NE, USA). Samples were then dried to a constant weight in a forced air drying oven at 60 °C.
Values for the light extinction coefficient (k) for Beers law [21] were calculated from the fraction of PAR intercepted (FIPAR) and the LAI. Values for k were calculated for each sample date as shown in Equation (1).
k = ln(1 − FIPAR)/LAI
Care was taken to only sample archetypical, representative plants during these samplings to get realistic growth patterns. With these data, we calculated leaf area index, extinction coefficient for Beer’s Law, and radiation use efficiency (RUE). The RUE of each ecotype was calculated from the change in dry matter between sampling dates and the summed intercepted photosynthetically active radiation (SIPAR) calculated from the daily estimates of fraction of intercepted photosynthetically active radiation (FIPAR) and assuming 45% of total incident solar radiation is PAR. Daily incident PAR values were taken as 45% of the total solar radiation measured at each location [28,29]. The total incident solar radiation each day was from a nearby weather station.
3. Results
3.1. LAI and k
2022 is the season with the most complete data across all categories, thus its data is displayed for clarity. The plots showed an increase in LAI over the 2022 season as shown in Table 1. Across the season, the average EG LAI was 1.06 and the average maximum LAI was 1.69. The average k across the season was −1.05 and the average maximum k was −0.71. The final dry weights are shown in Table 1, while the dry weights for the earlier 3 dates were used to calculate RUE. Bellville had the highest biomass and Caprock Canyon had the lowest. The four ecotypes with the greatest final biomass had maximum LAI values varying from 1.92 to 4.41 with an average maximum of 2.64. The average k values for these four ranged from −0.56 to −0.72 with an average of −0.605. The four ecotypes with the smallest final biomass had maximum LAI values ranging from 0.32 to 1.47 with an average maximum of 0.94. The average k values for these four ranged from −1.35 to −2.39 with an average of −1.76.

Table 1.
EG representative subsample average FIPAR, LAI, k, and dry weight. FIPAR, LAI, and k were from 19 April, 4 May, and 17 May of 2022. Dry Wt is the dry weight in Mg/ha for the end of season harvest 13 October 2022.
The finding described below, of an exponential relationship between k and LAI is innovative and unique. While Beers law describes an exponential relationship between fraction intercepted and LAI, as discussed above the k value for a plant species has generally been shown to be fairly stable across LAI values for most grasses.
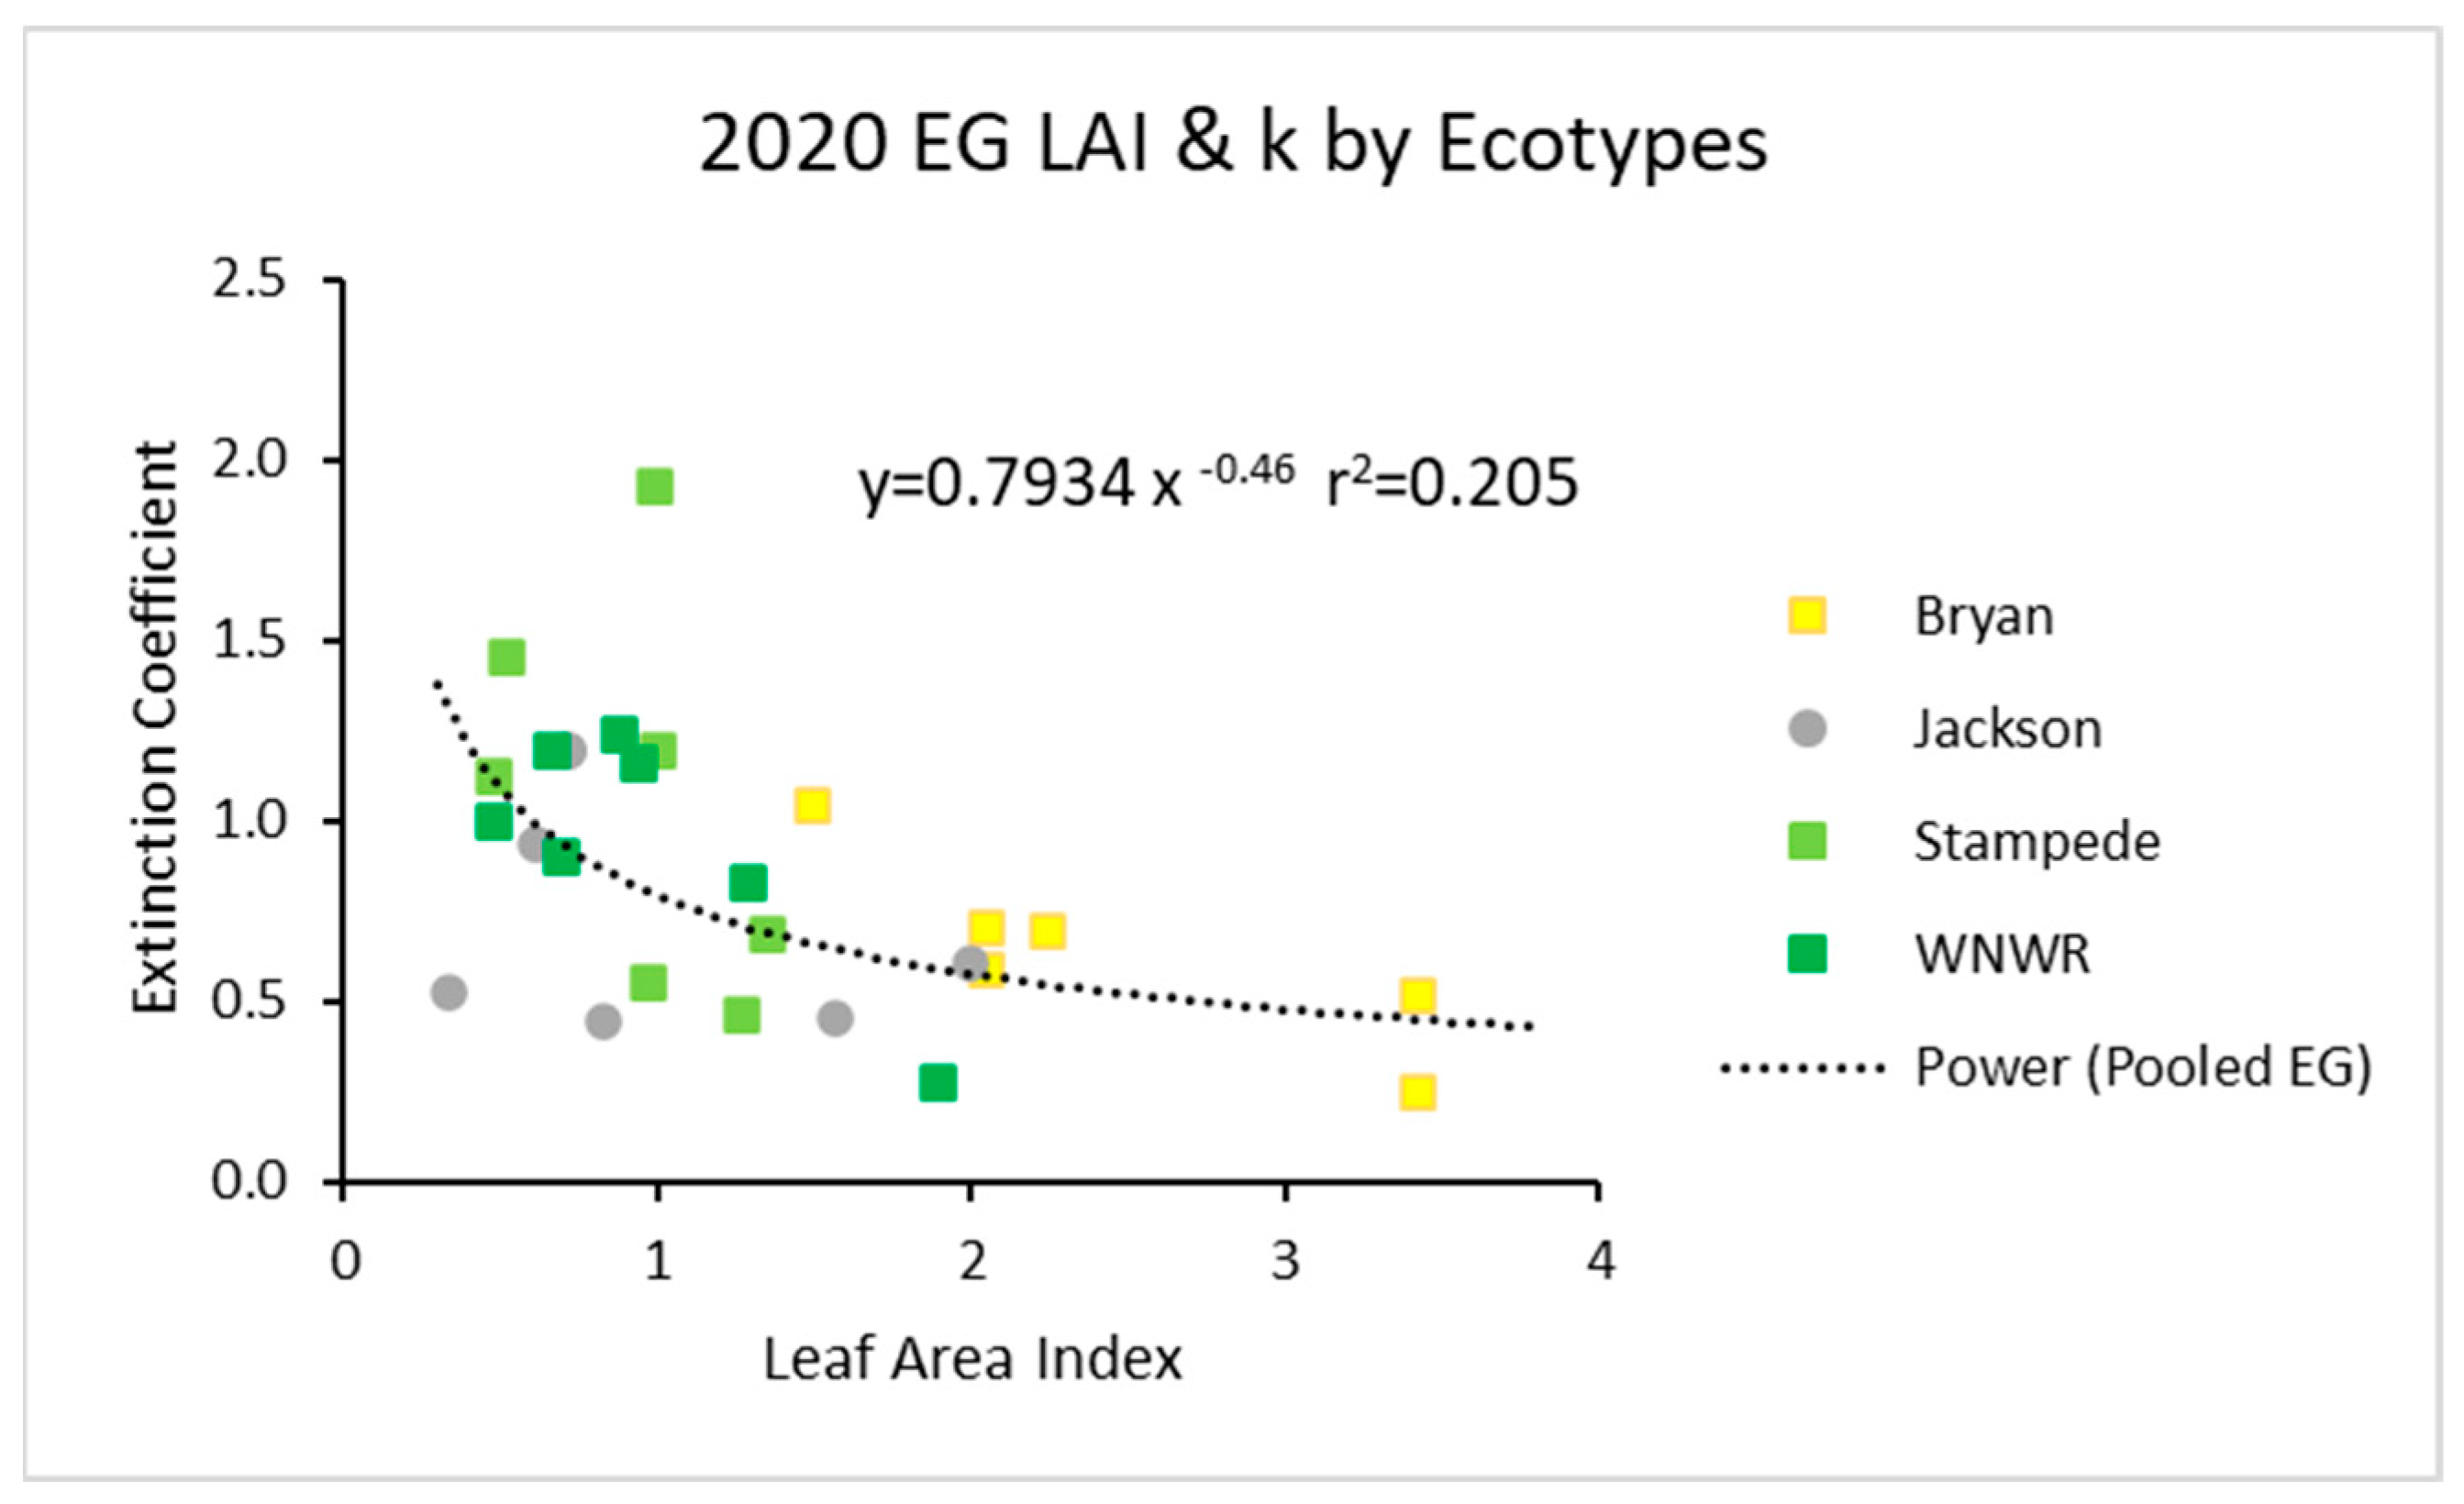
For all three years, power function graphs are shown composed of all replications, all ecotypes, and all sampling dates for that specific year. In 2020, the data pooled across ecotypes had a power function with an r2 value of about 0.21 (Figure 1). The individual ecotypes seemed to follow the same trends.
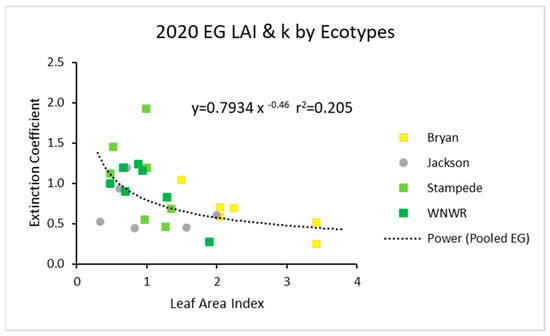
Figure 1.
For 2020, the light extinction coefficient (k) values as a function of LAI for five ecotypes. Values of k are actually negative, but were converted for this figure. Power (Pooled EG) is the power function derived using all ecotypes from 2020.
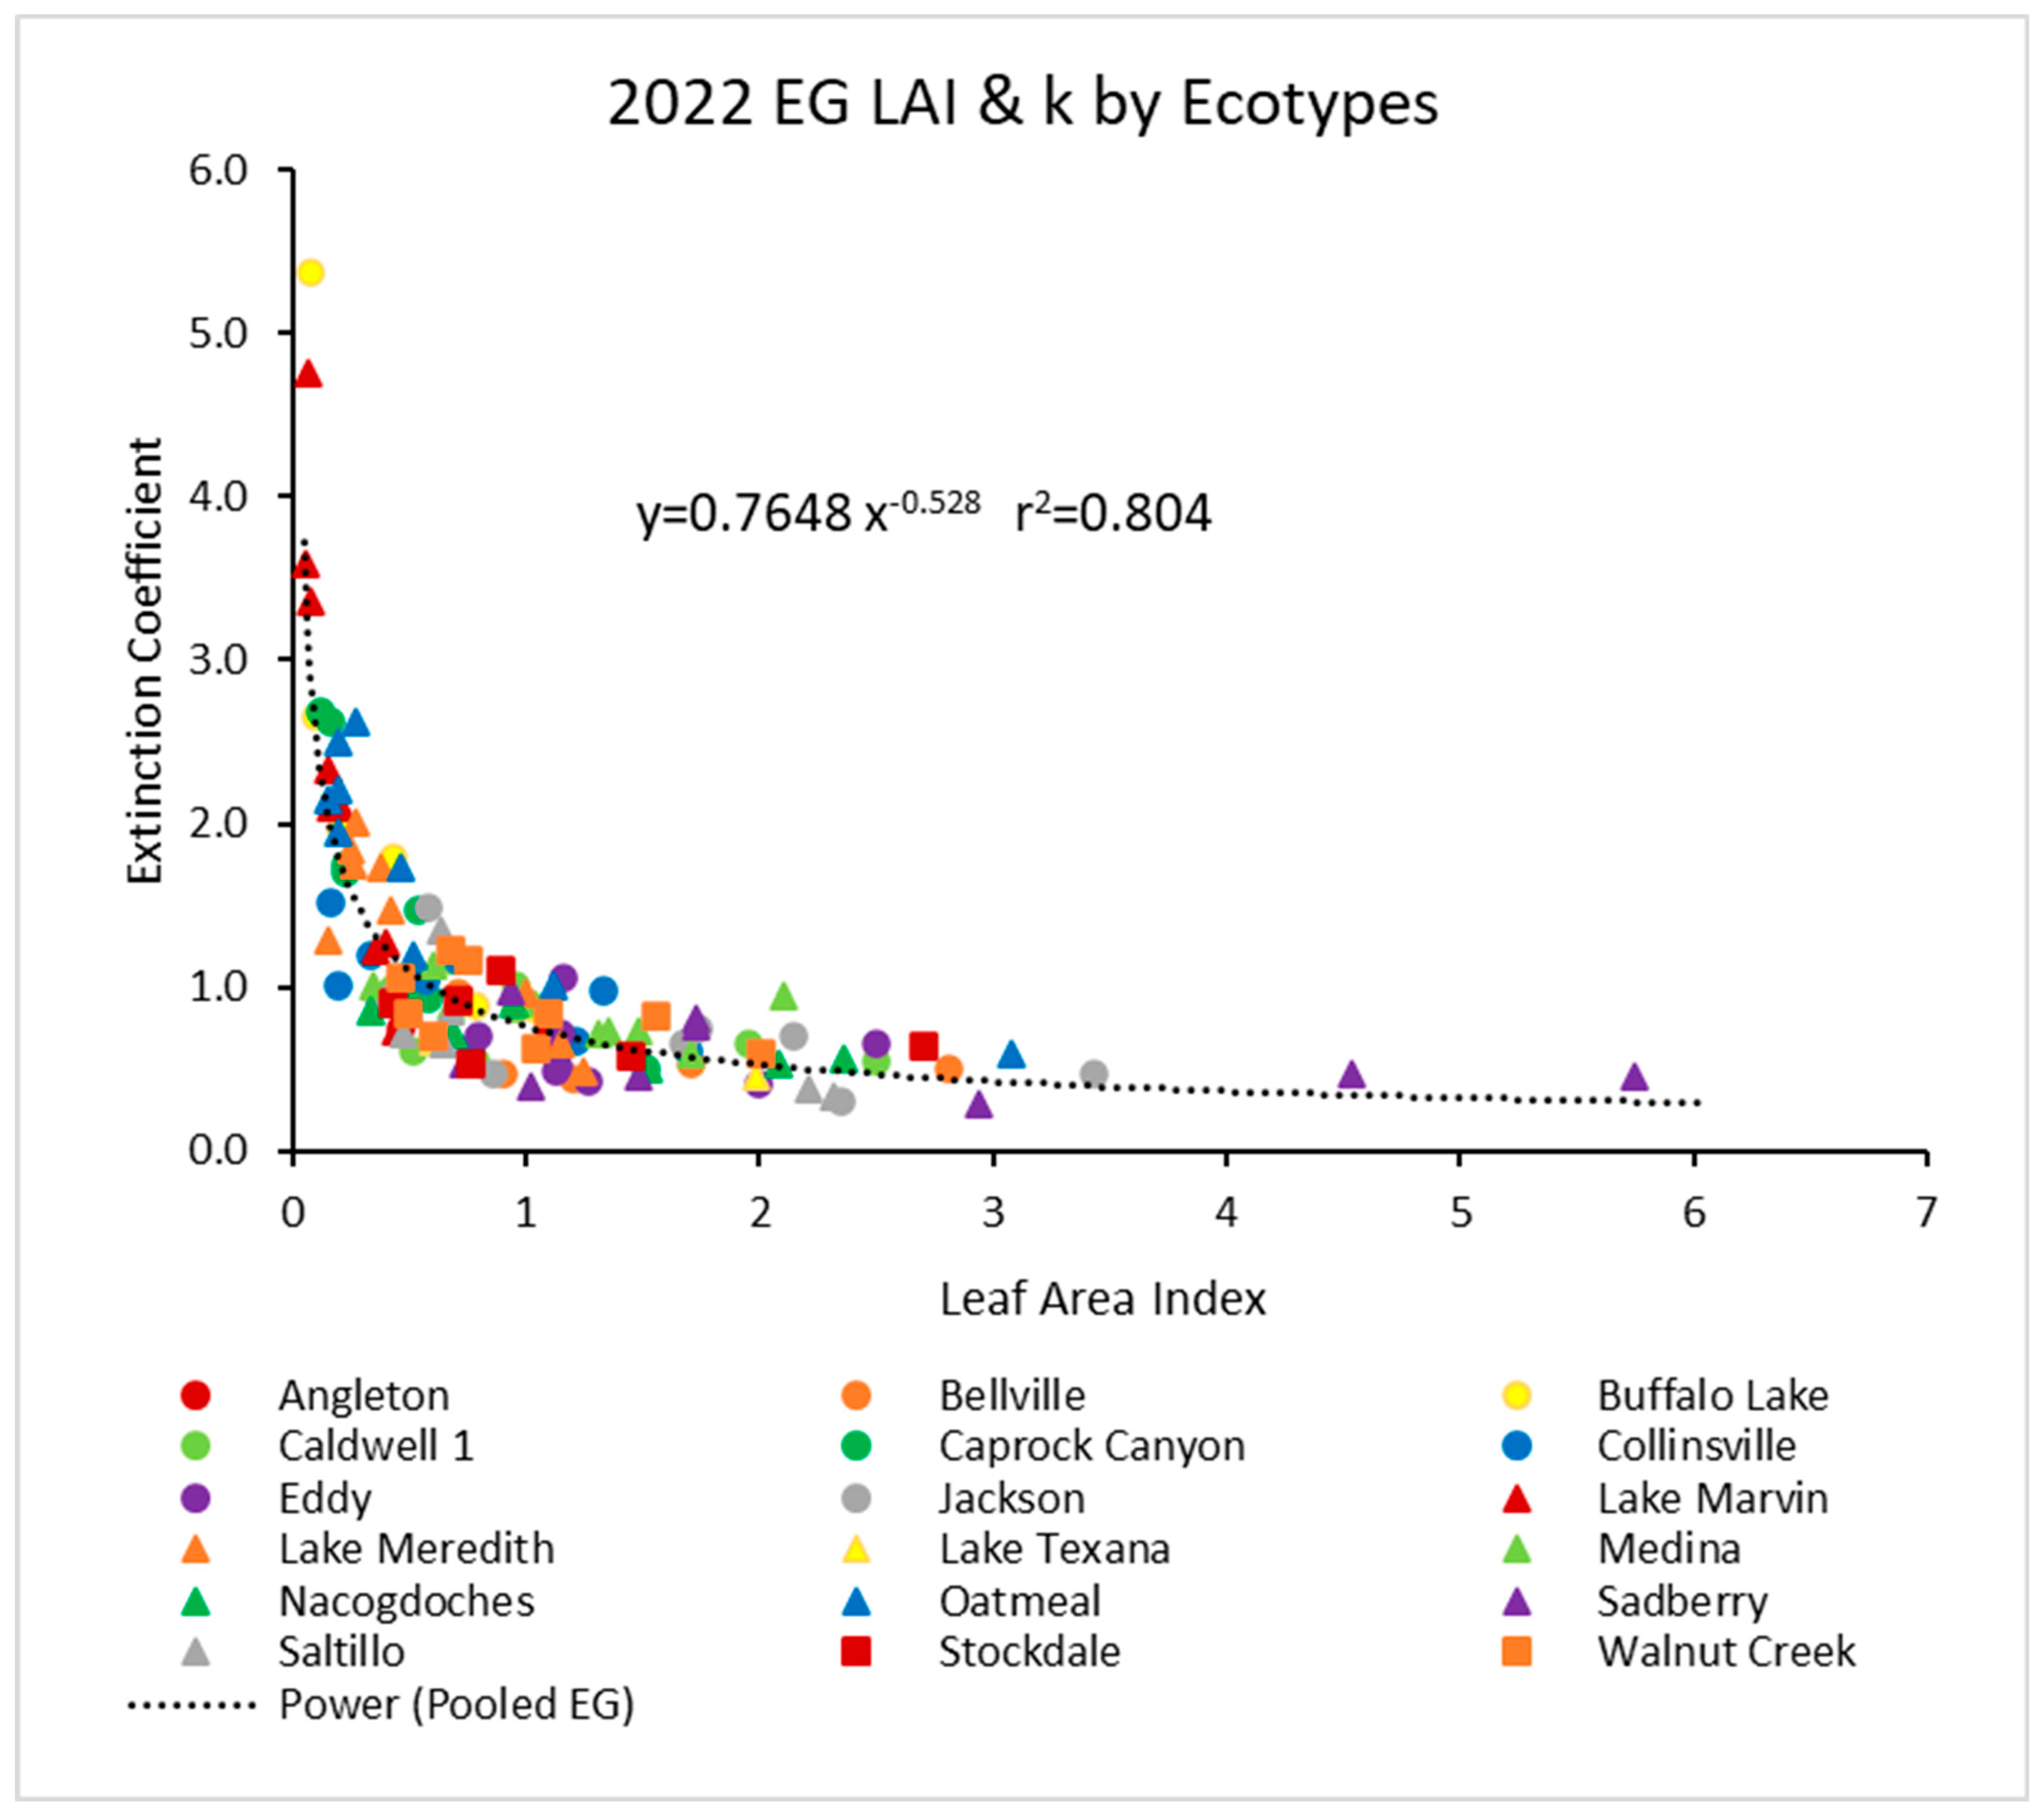
In 2022, the pooled data (Figure 2) showed a similar power function, but with a higher r2 value of about 0.80. Again, the individual ecotypes followed similar trends.
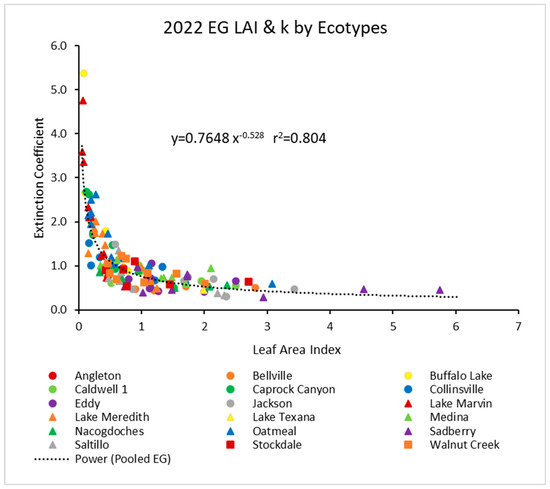
Figure 2.
For 2022, the light extinction coefficient (k) values as a function of LAI for several ecotypes. Values of k are actually negative, but were converted for this figure. Power (Pooled EG) is the power function derived using all ecotypes from 2022.
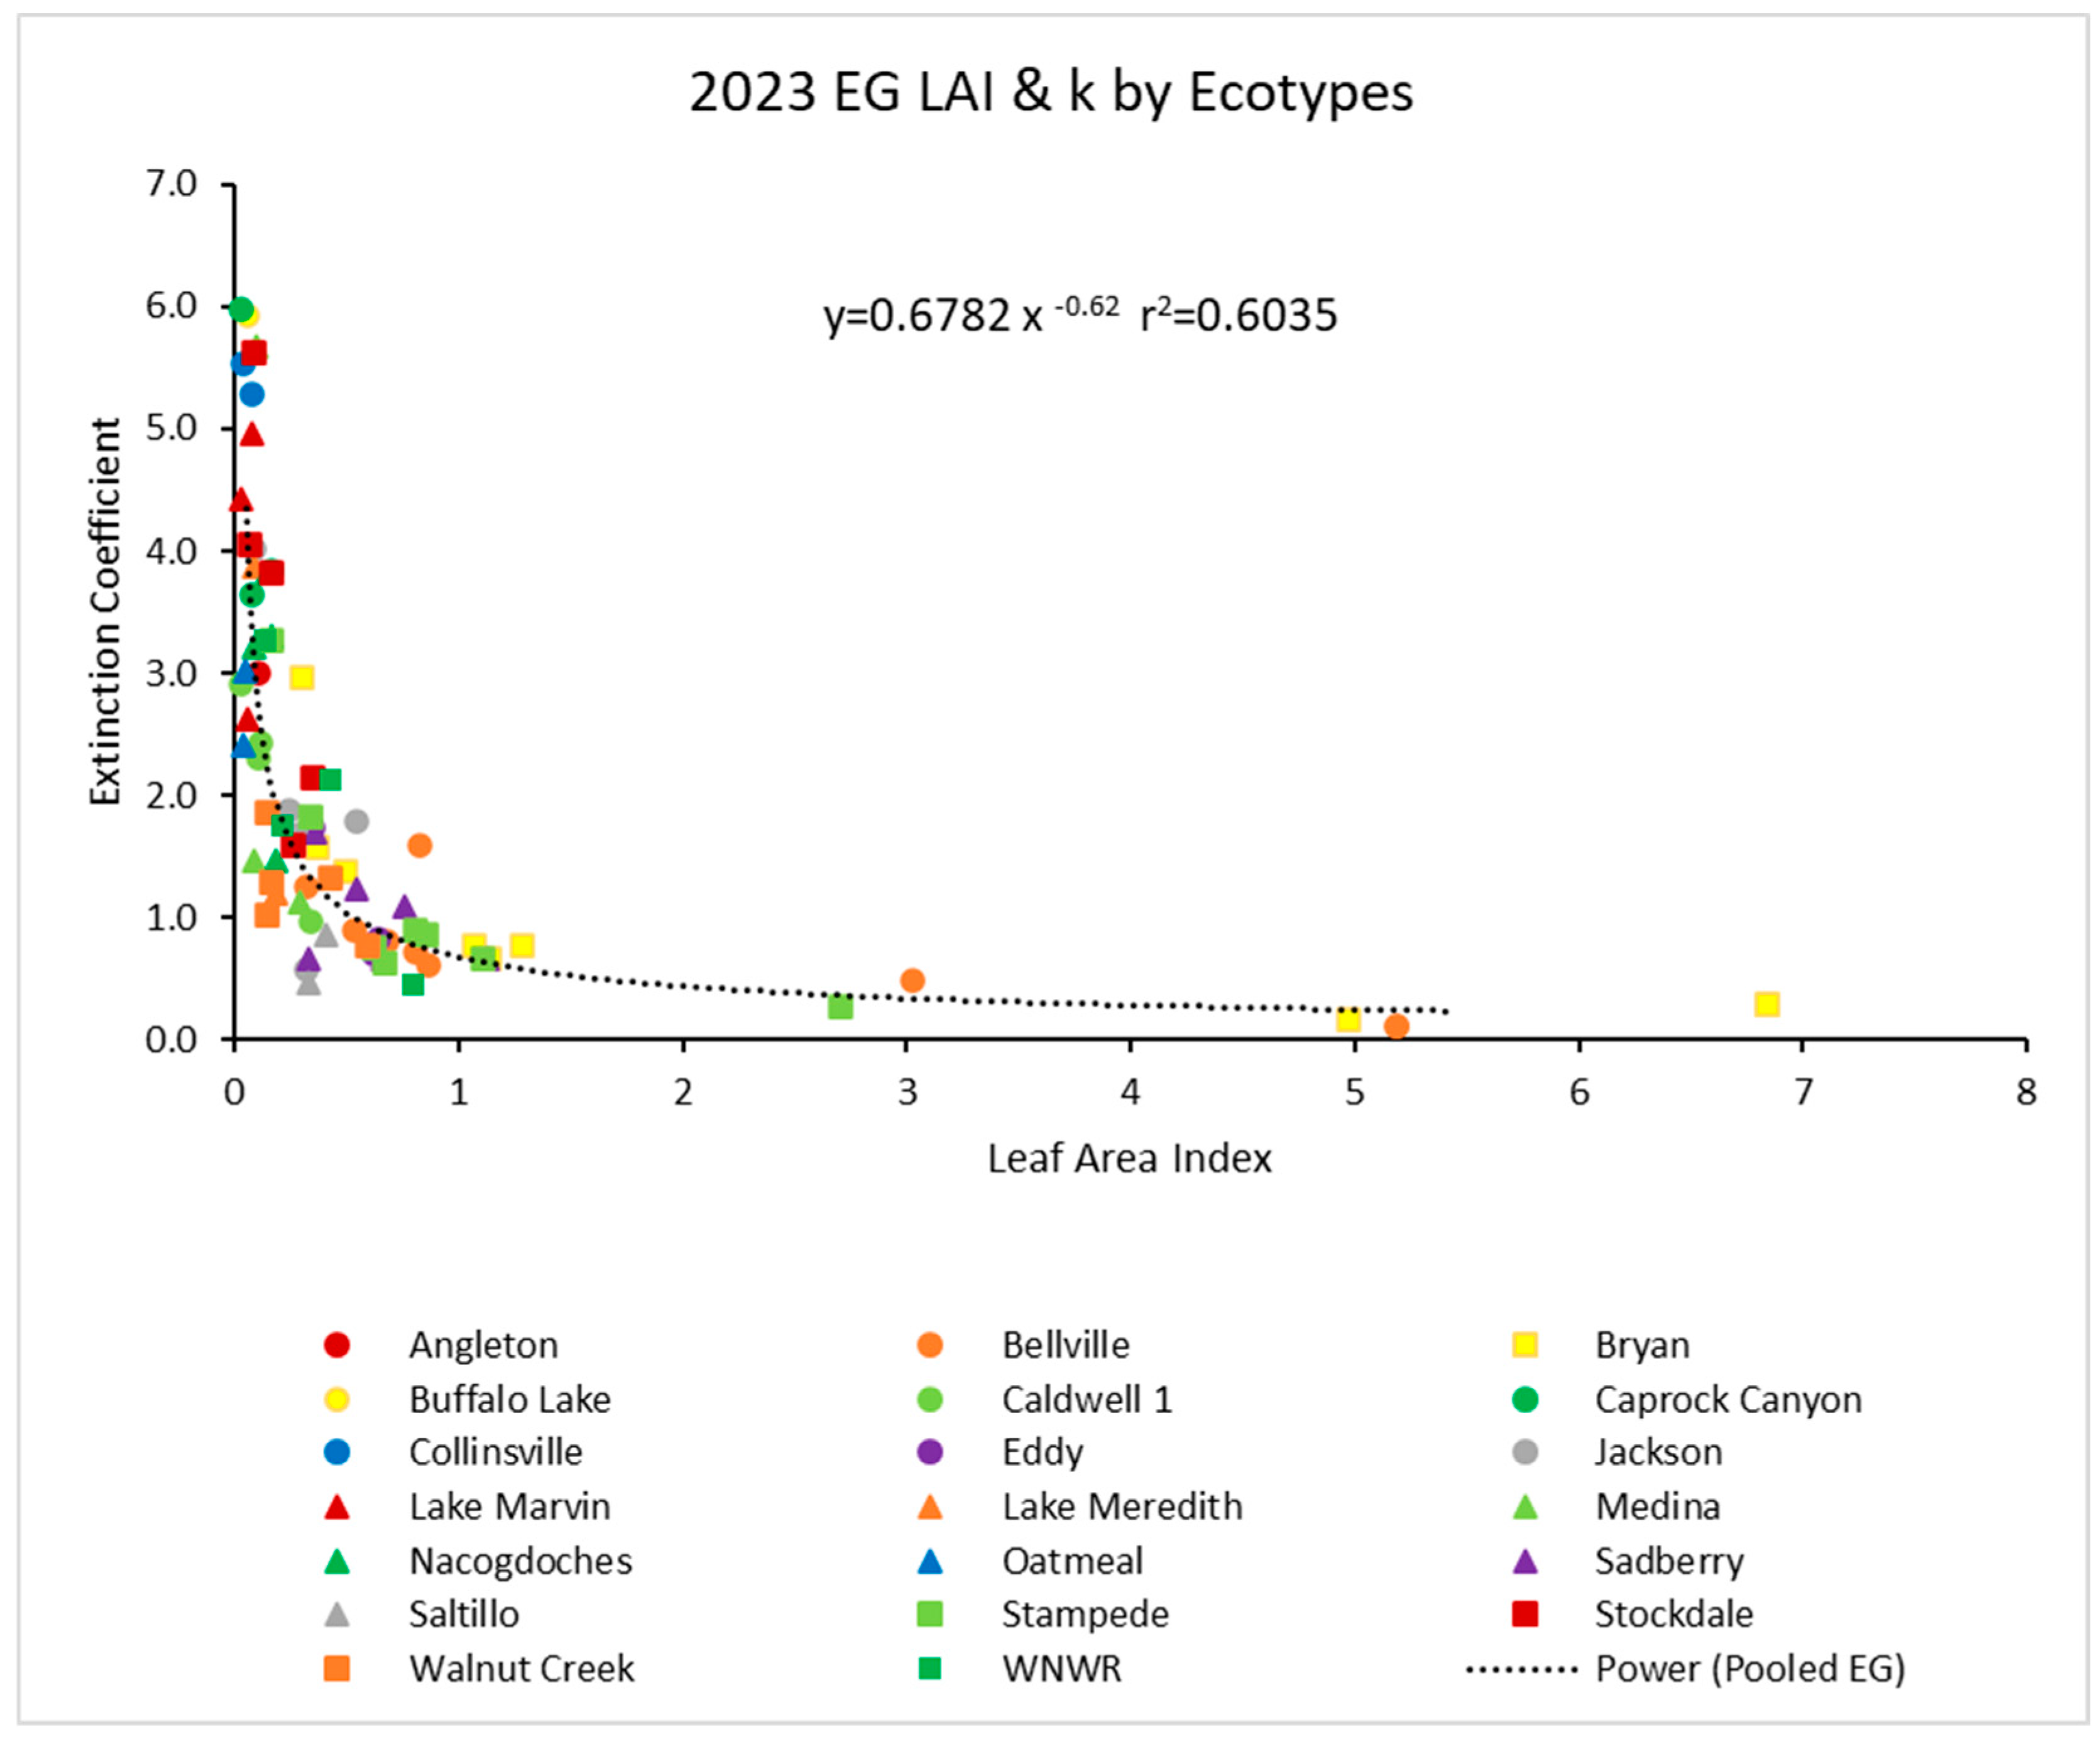
In 2023, there was another similar power function with the pooled data (Figure 3). Again, the r2 value was about 0.61. Ecotypes again showed no obvious outliers from the power function.
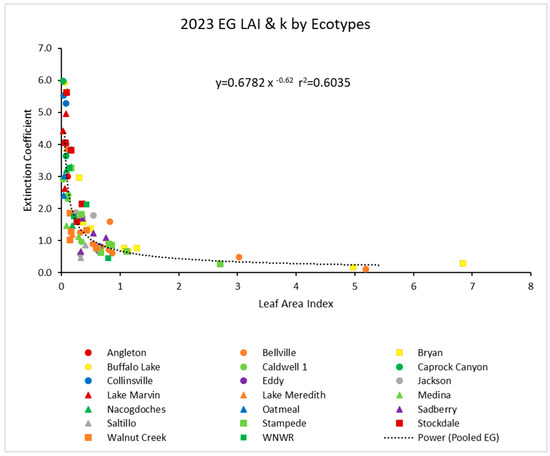
Figure 3.
For 2023, the light extinction coefficient (k) values as a function of LAI for several ecotypes. Values of k are actually negative, but were converted for this figure. Power (Pooled EG) is the power function derived using all ecotypes from 2023.
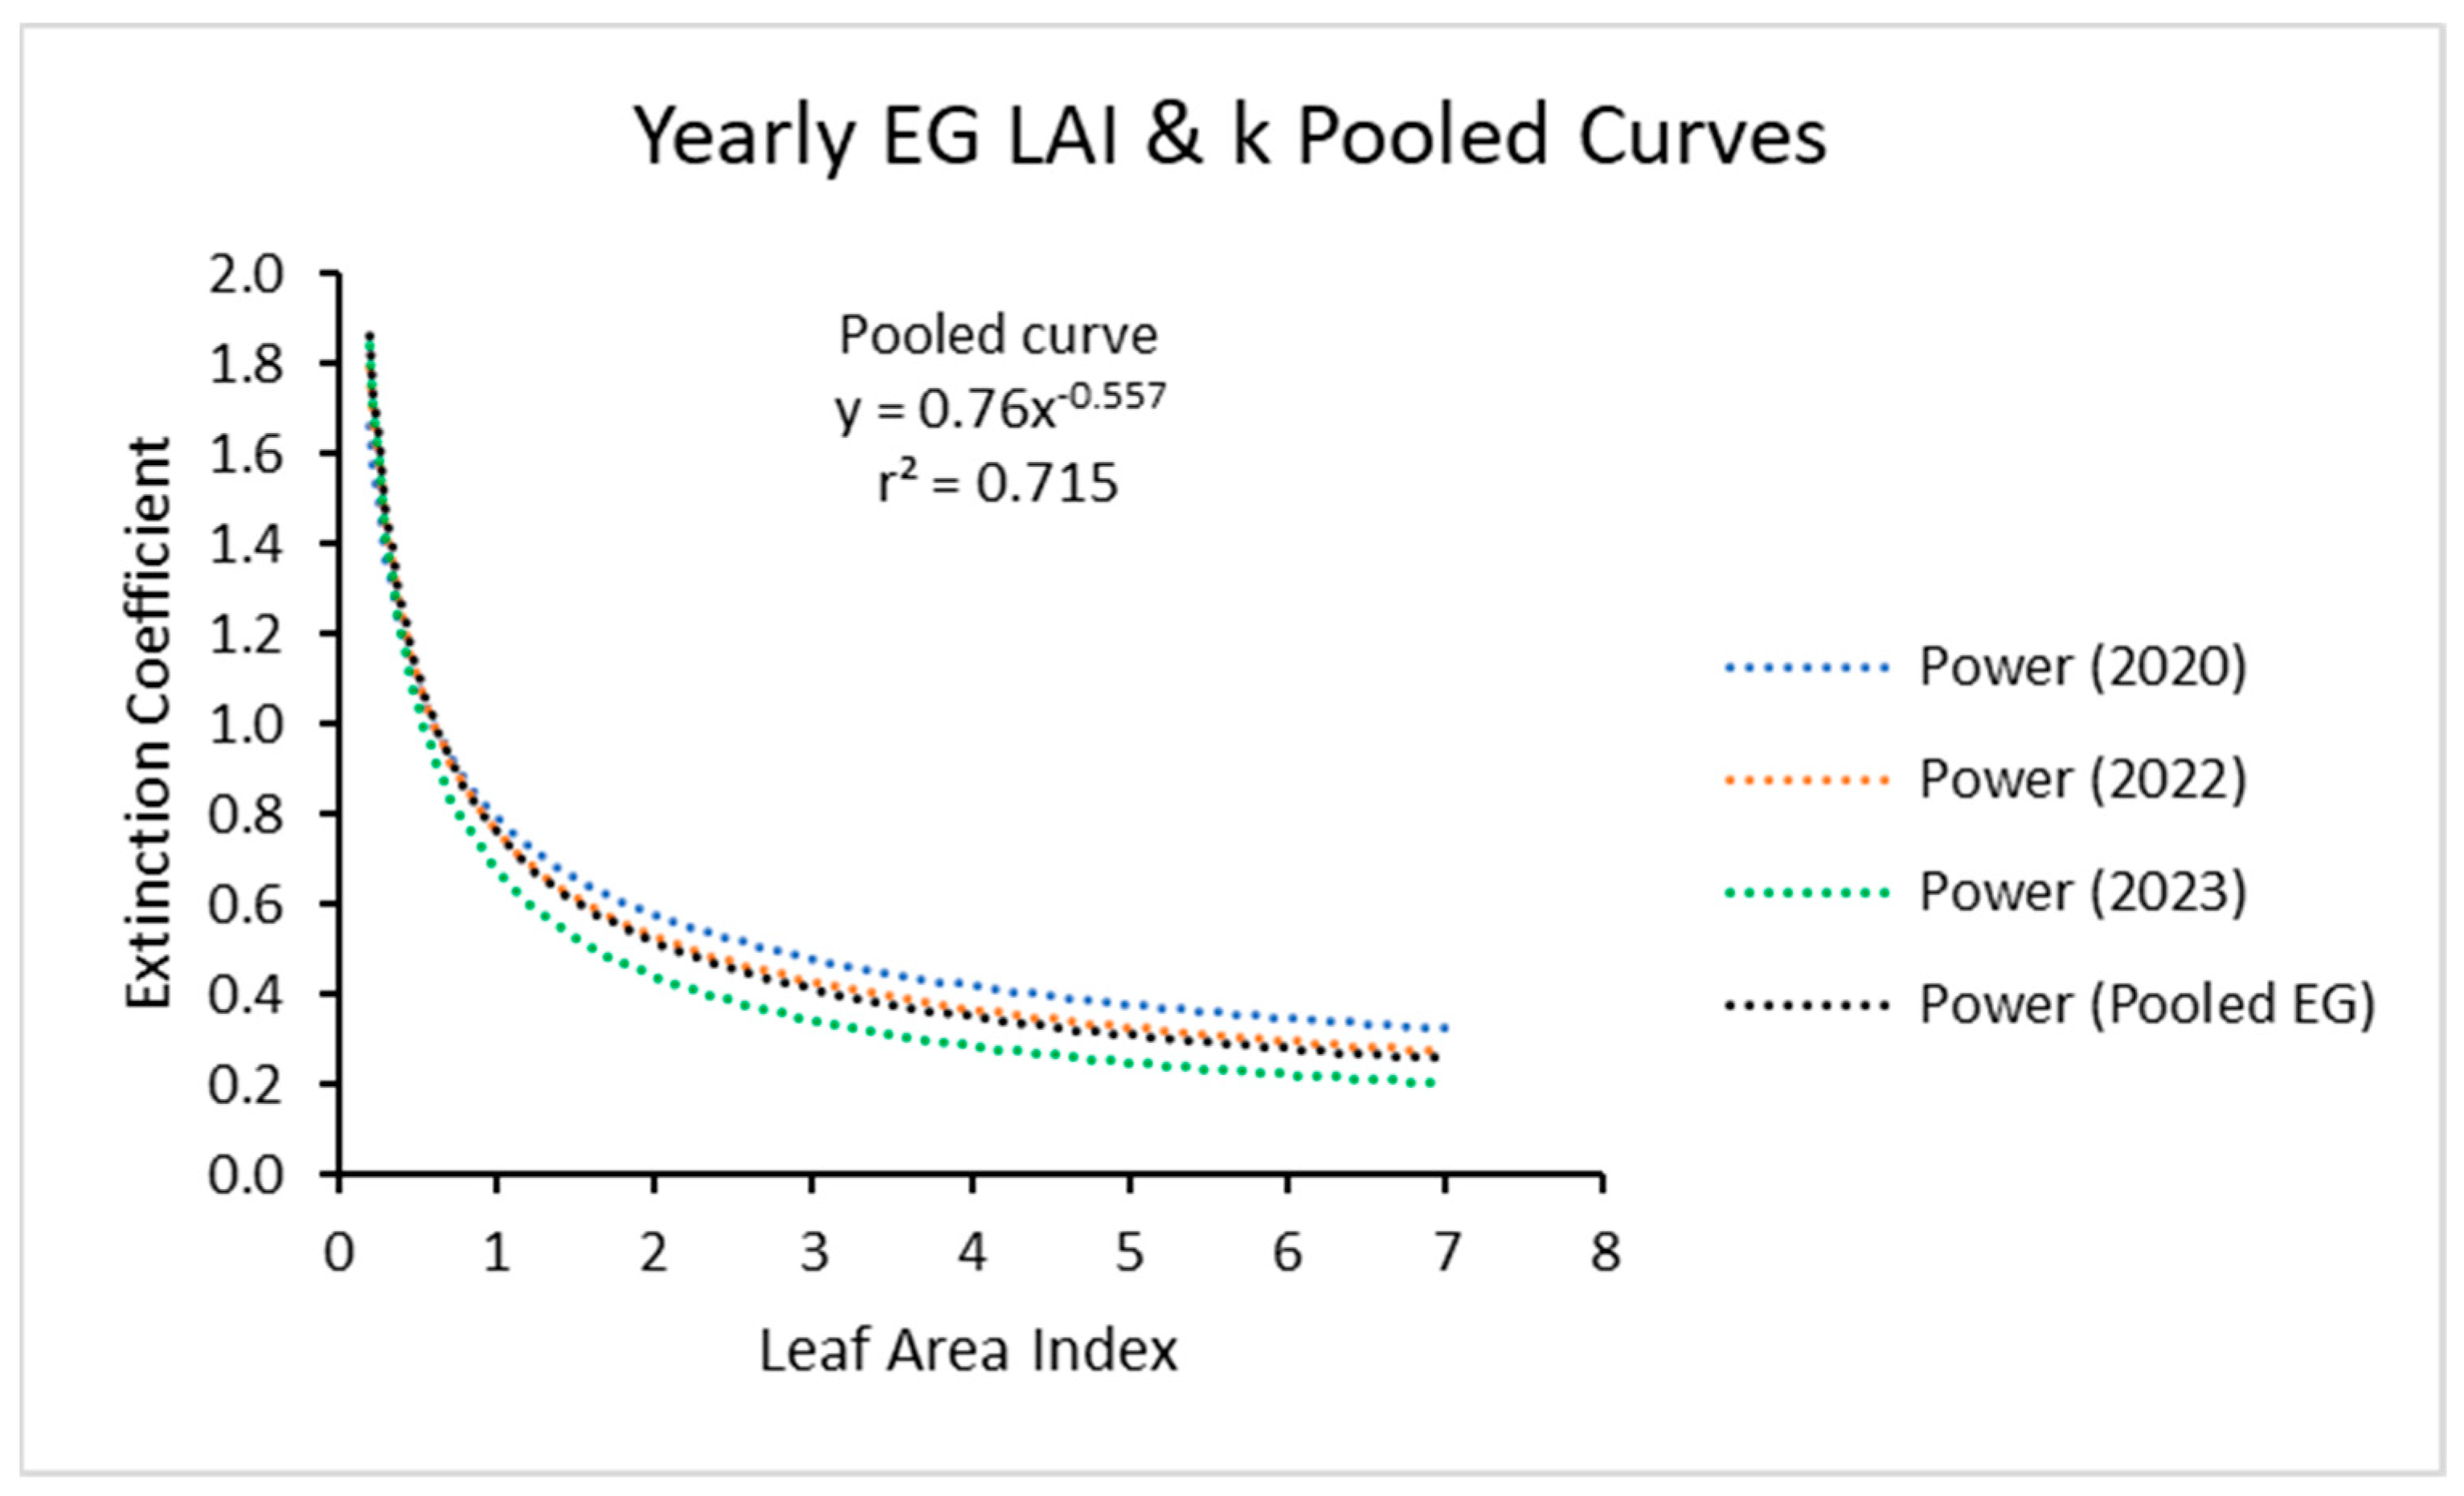
The three power curves for the three years, when plotted together (Figure 4) showed close similarity. It appears that one power function could be used for all the data for the three years.
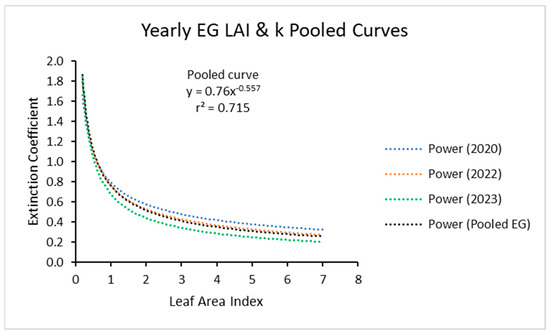
Figure 4.
Light extinction coefficient (k) values as a function of LAI with 2020, 2022, and 2023 data and with the three curves compared. Values of k are actually negative but were converted for this figure. Power (Pooled EG) is the power function derived using all ecotypes from all years.
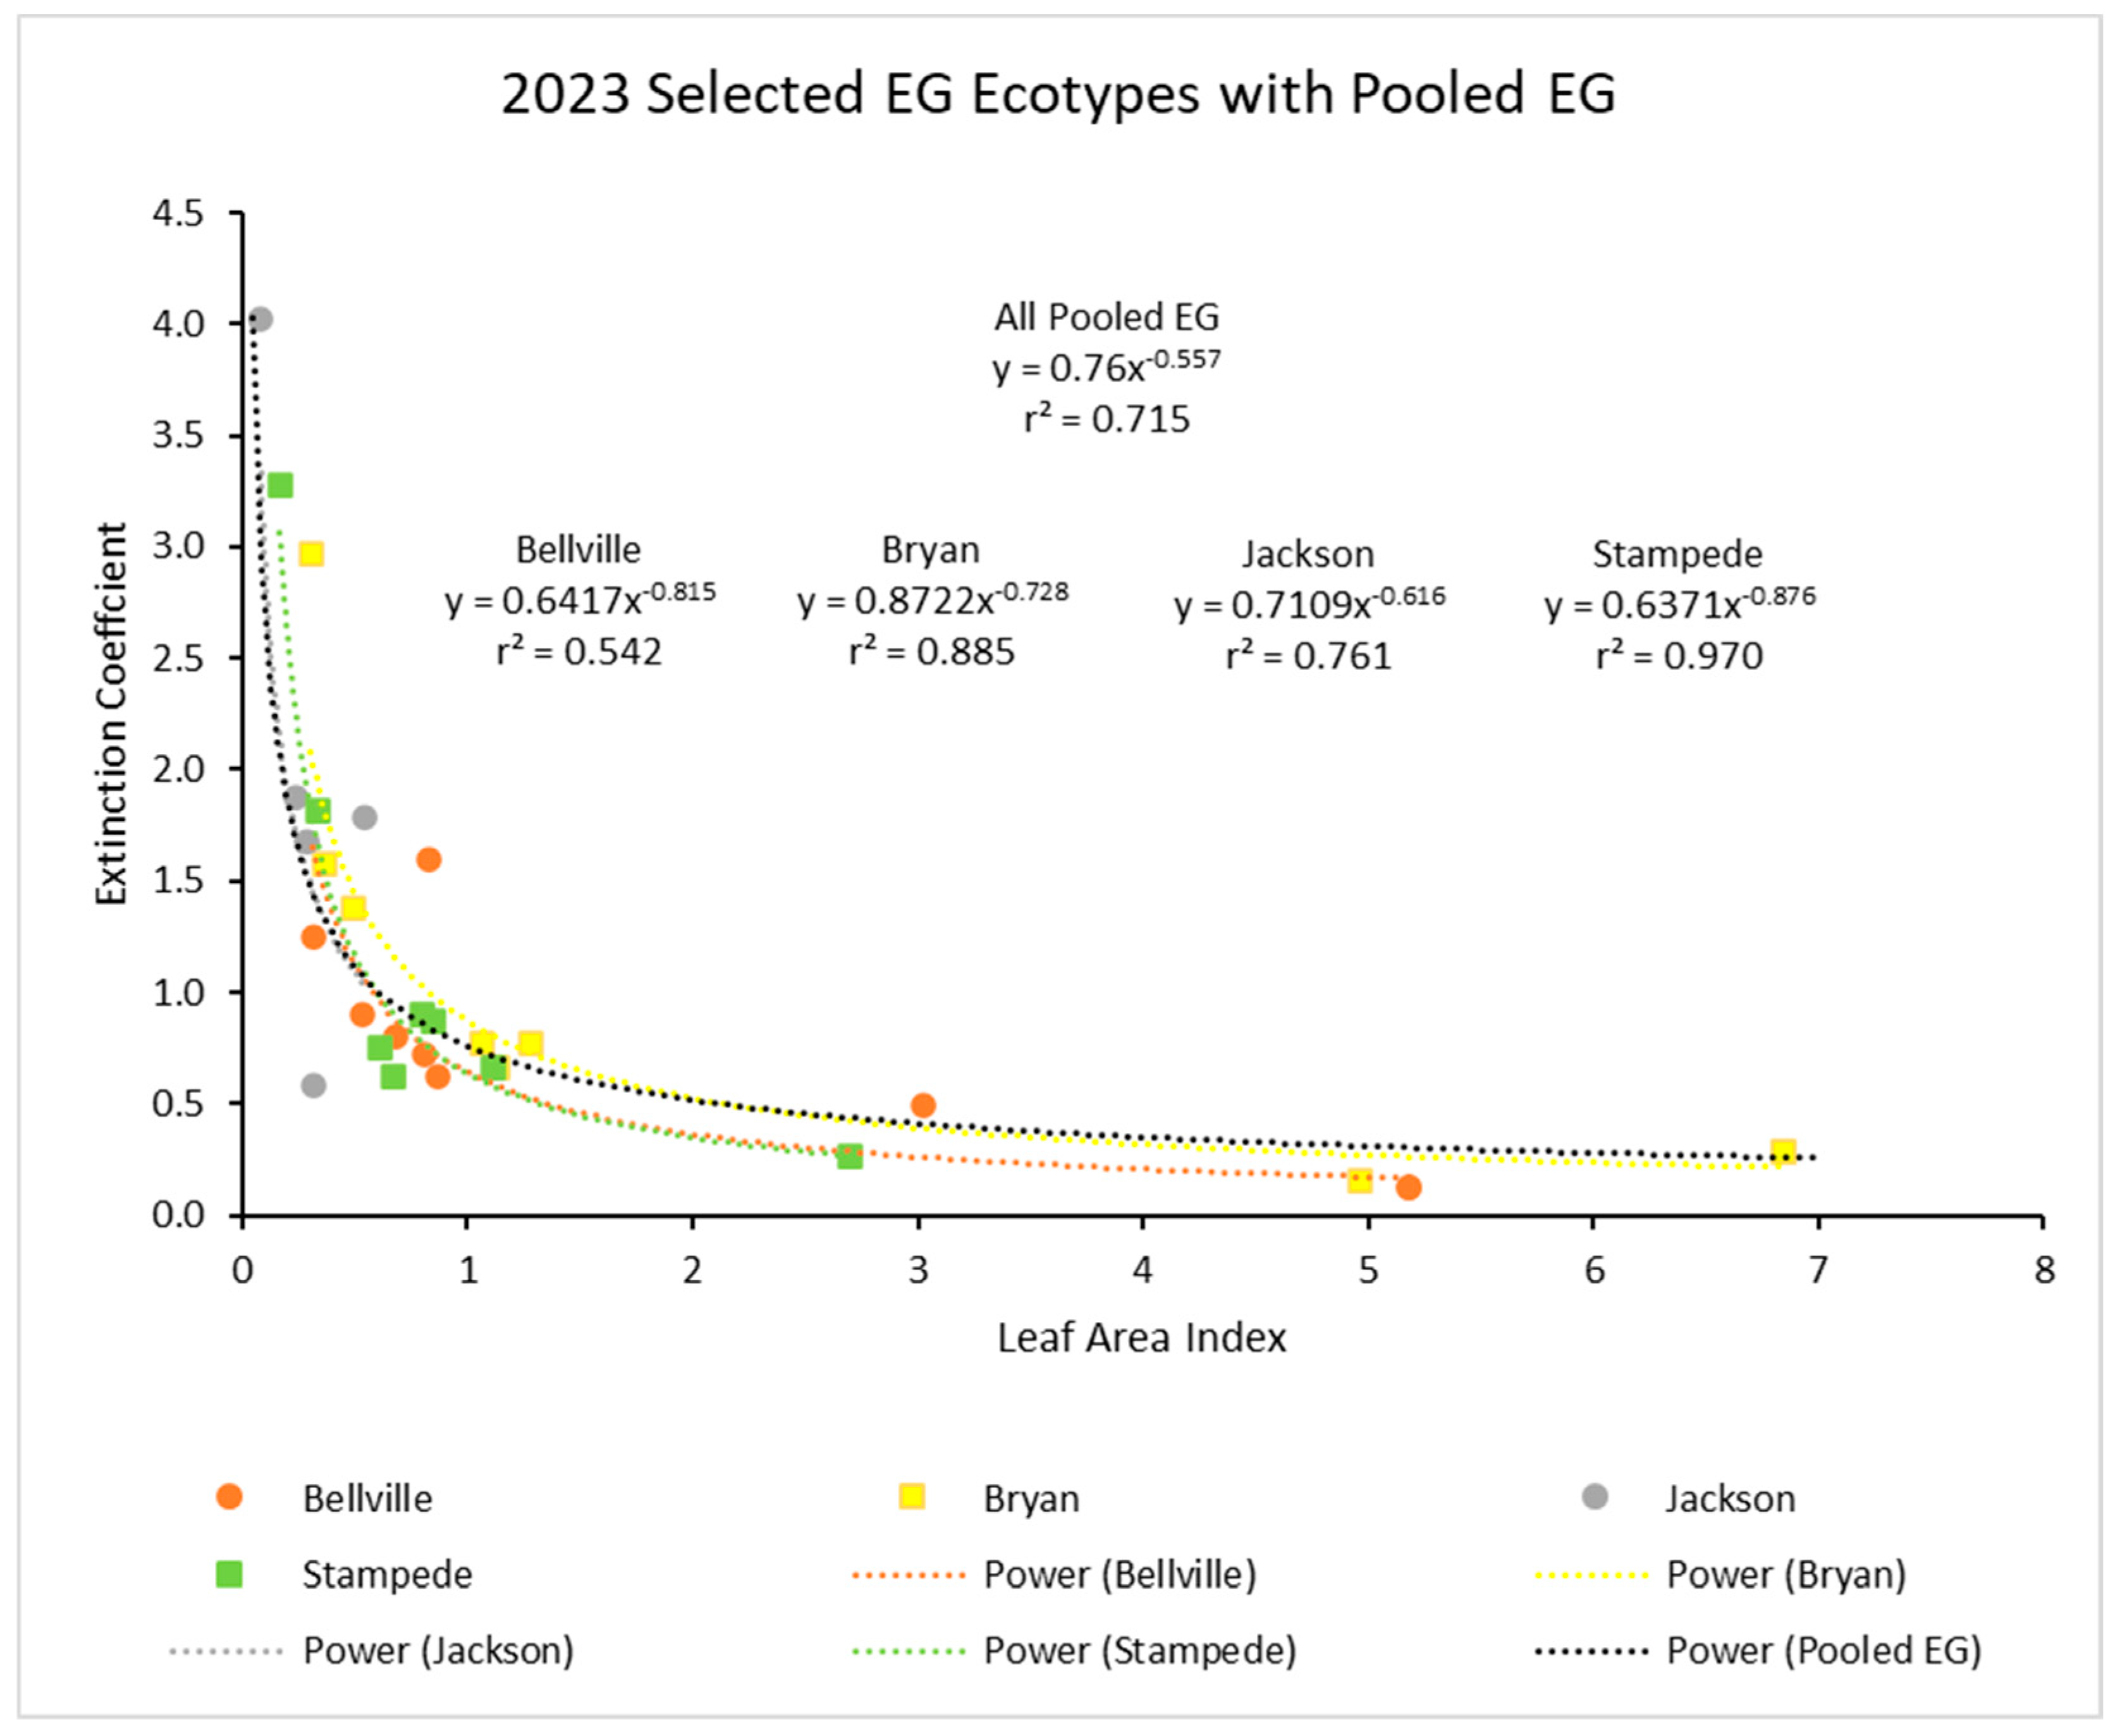
Finally, separate curves for four of the ecotypes with extensive data in 2023 (Figure 5) were plotted together to show how individual curves for ecotypes were comparable.
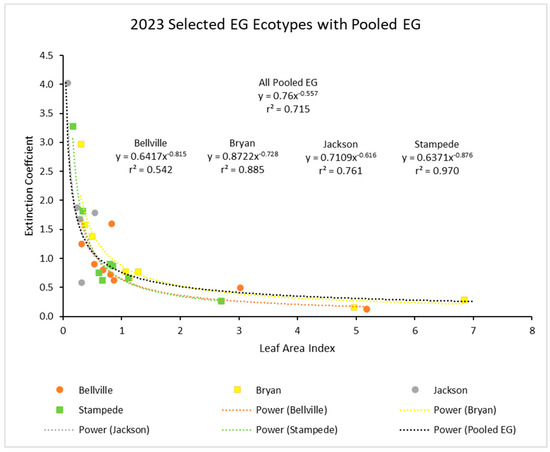
Figure 5.
Light extinction coefficient (k) values as a function of LAI for four ecotypes measured in 2023 and with the four curves for each compared. Curve for pooled ecotypes for all three years from Figure 4 is included for comparison. Values of k are actually negative, but were converted for this figure.
3.2. RUE
The EG showed RUE values ranging from 1.16 to 4.31 g/MJ (Table 2). Splitting the 2022 RUE values into groups of small, medium, and large, the averages were 1.92, 2.94, and 3.79 g/MJ, respectively. In 2023, the three ecotypes in the large group ranged from 4.07 to 4.69 g/MJ and the average was 4.28 g/MJ. The Bellville and Sadberry RUE values were much higher in 2023 than in 2022. The few RUE values for 2020 were supportive of those ecotypes RUE values in the other years. Jackson’s values were 3.99 g/MJ in 2022 and 3.42 g/MJ in 2020. Bellville’s values were 3.69 g/MJ in 2020 as compared with 3.03 g/MJ in 2022 and 4.07 g/MJ in 2023. Saltillo value was 3.00 g/MJ in 2020 as compared with 3.31 g/MJ in 2022.

Table 2.
RUE values (g/MJ intercepted PAR) for eastern gamagrass split into three groups.
4. Discussion
These results are an important step in developing relationships and parameters to simulate the different ecotypes of this grass with process-based models. Management of this highly palatable grass will benefit greatly from a process-based simulation model that realistically simulates different ecotypes on different soils and with different climatic conditions. This will allow producers to determine which ecotype will be best suited for their specific landscape. The ecotypes in this study were from a large collection in the field at Temple, TX. Data on biomass, LAI, k, and RUE will be useful for simulating a large range of scenarios.
The wide range of k values, with some exceeding 1.0, is not without precedent. The power response of k to LAI offers an interesting new approach to simulating light interception at very low LAI values and throughout the range of LAI values of these ecotypes and similar grass species. While it is generally accepted by most crop modelers with diverse crop species, that k is stable across LAI values, these results are the first to show that with some grass species, k values change in a predictable fashion, described with a power function. This type of response, however, does not appear to be general across all grass species, as discussed herein. The wide range of RUE values highlights the immense diversity of eastern gamagrass. The high RUE values for the most productive ecotypes emphasizes the importance of this grass species for hay and grazing. Because of its ability to survive and grow in flooded conditions, it is promising for such marginal sites that might not be useful otherwise. Its deep rooting also helps it in the other extreme conditions, when drought becomes a factor.
The higher the EG LAI, the closer k is to zero. The highest biomass ecotypes had higher LAI than the lowest biomass ecotypes. Most of the low biomass, low LAI ecotypes were also the ecotypes with prostrate leaf structure, and leaf canopy height less than 100 cm, while most of the high biomass, high LAI ecotypes had upright leaf structure, and leaf canopy height above 150 cm [1]. The prostrate EG ecotypes measured here originated from the Texas Panhandle, while the upright ecotypes were from higher rainfall zones in the eastern half of the state. Although Kiniry et al. [1] found that when using pairwise analysis, neither precipitation nor origin were significantly correlated to morphology, however, multivariate analysis showed leaf height correlated with precipitation. This is significant as the ecotypes grow differently, thus knowing which you have, or choose to plant is important.
4.1. Other Species for Comparision
4.1.1. Coastal Bermudagrass
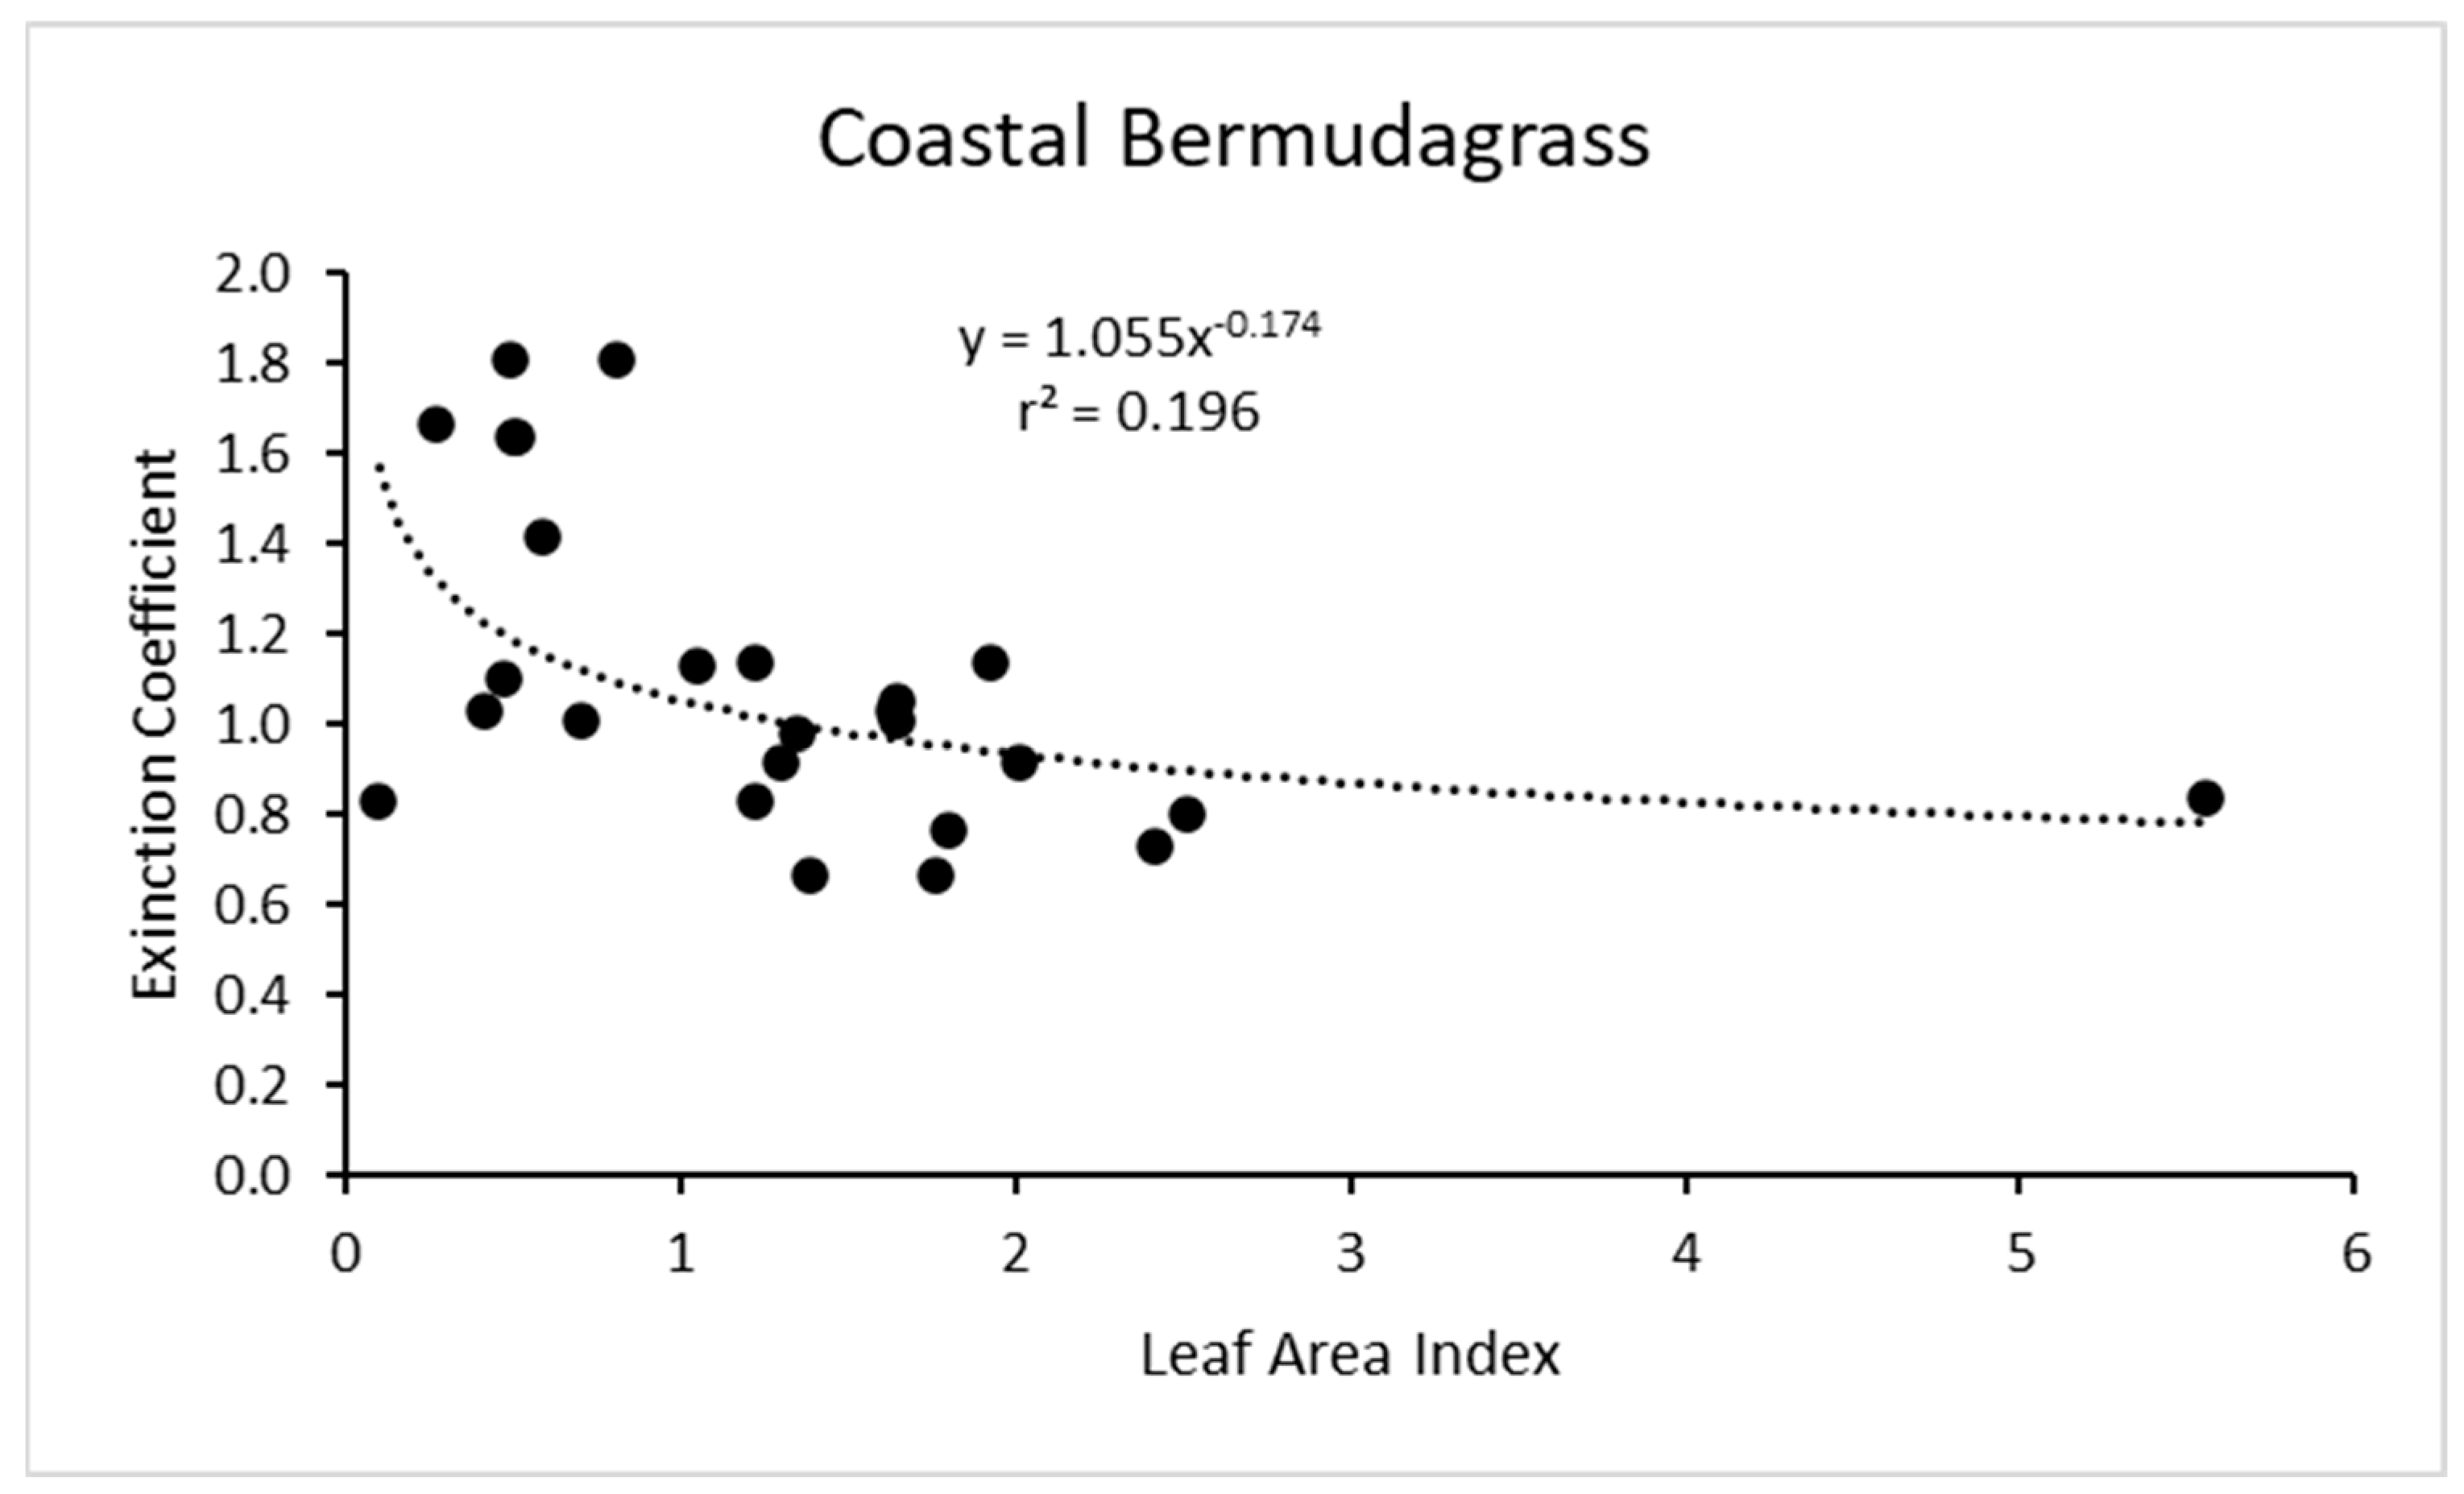
Re-examining the results for coastal bermudagrass [16] (the most common hay grass in the southern U.S.) showed a power function increase in k with reduced LAI, but the r2 value was only about 0.2 (Figure 6). This is interesting because this is one of two of the only other grass species that we have found that has a similar shaped response function for k as a function of LAI. In addition, the importance of coastal bermudagrass for grazing and hay production in the southern U.S. makes its accurate modeling especially relevant.
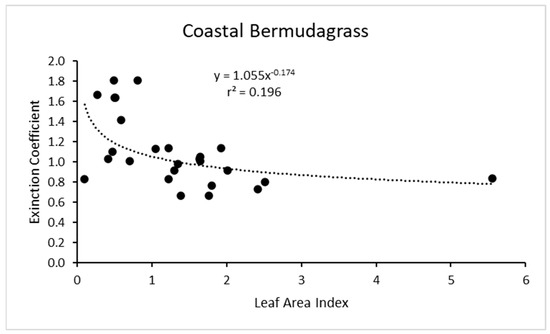
Figure 6.
For coastal bermudagrass, the light extinction coefficient as a function of leaf area index. Data are from Kiniry et al. [16]. Values of k are actually negative, but were converted for this figure.
4.1.2. Switchgrass
Switchgrass, like EG, is a native grass with high biomass and environmental resilience. As in the methods used here for EG, LAI and RUE were studied in a comparable switchgrass plot in 2023. The plots were in the same location and established during the same year. It was interesting to see how high the RUE values for the two switchgrass ecotypes were (Table 2). These are higher than the values of 4.0 to 5.3 g/MJ reported previously for Alamo switchgrass in Texas [22]. Likewise, two thirds of the EG ecotypes’ RUE measured here were higher than previously reported RUE (Table 3). Using these published results as a baseline, the common garden ecotype plot performed better than the standard. Thus, these plants were not under water or nutrient stress, even without irrigation or fertilizer applications, and still some ecotypes will not have the same productivity as others.

Table 3.
Eastern gamagrass RUE values (g/MJ) from Kiniry et al. [22] for comparison.
4.1.3. Maize
A close relative of maize, EG productivity relative to maize is of considerable interest, especially its RUE values and span. The high values for the largest EG ecotypes are similar to maize values. This might have been expected since the two species are related and can actually cross [30,31]. Overall, these EG RUE values encompassed the previously published EG RUE average values of 2.1 g/MJ (Table 3) and the average maize RUE values of 3.7 g/MJ (Table 4). Some measured EG RUE high values were above those of the high maize RUE reported. EG may potentially have a higher RUE than maize, even though the greatest maize RUE reported was originally higher than the highest EG RUE previously reported. Thus, EG had a much more variable RUE range than was reported previously.

Table 4.
Maize RUE values (g/MJ) from previous experiments for comparison.
5. Conclusions
The results of this study present new ideas to our current understanding of the power response of k to LAI, the range of RUE values, and data for crop simulation models. The power response of the light extinction coefficient to LAI has not been reported before. This offers an interesting new approach to simulating light interception at very low LAI values, and throughout the range of LAI values for these ecotypes and similar grass species (big bluestem and coastal bermudagrass). The similarity across years for the pooled power functions shows promise for there to be one general response function for all of these diverse ecotypes.
The low RUE values match values reported earlier, but only for the one ecotype measured previously for three years in Temple and for some other warm season native grasses [22]. It appears that the ecotypes for this single species covers the range found for several native warm season grasses.
These results are an important first step in developing relationships and parameters to simulate the different ecotypes of this grass with the modeling tool ALMANAC. Once the descriptive parameters have been derived, the model can be used to determine potential productivity on various soils and in various climatic conditions, and which ecotype or group of ecotypes is best for a particular soil at a particular location. The model can be used to compare yield stability of EG over multiple years to other commonly grown forage and hay grasses. ALMANAC can also be used test EG’s resiliency to drought, flood, and variable climate. This will help to provide better management of the grass to avoid overgrazing or overly intensive hay cutting.
The high RUE values for the most productive EG ecotypes emphasizes the importance of this grass species for hay and grazing. While not as large as switchgrass values, it is still a prominent forage species that is even comparable to maize in productivity when expressed as RUE. Because its deep rooting ability allows it to survive and grow in both extreme conditions of drought and flood, it is promising for such marginal sites that might not be useful otherwise. The EG ecotypes with low RUE should not be totally discounted, however. They often come from low rainfall regions, where the more productive ecotypes probably will not survive. Thus, they are useful for forage and wildlife in such limiting environments.
Author Contributions
Conceptualization, J.R.K.; methodology, J.R.K., A.S.W. and J.J.; formal analysis, A.S.W. and J.J.; data curation, A.S.W. and J.J.; writing—original draft, J.R.K.; writing—review & editing, J.R.K., A.S.W. and J.J.; visualization, J.R.K.; supervision, J.R.K. All authors have read and agreed to the published version of the manuscript.
Funding
This work was supported in part by an appointment to Agricultural Research Service administrated by Oak Ridge Institute for Science and Education through an interagency agreement between the U.S. Department of Energy and the U.S. Department of Agriculture, Agricultural Research Service Agreement #60-3098-5-002.
Data Availability Statement
The data that support the findings of this study are available from the corresponding author, JRK, upon reasonable request.
Acknowledgments
This work was supported in part by the USDA, Agricultural Research Service. Mention of trade names or commercial products in this publication is solely for the purpose of providing specific information and does not imply recommendation or endorsement by the USDA. USDA is an equal opportunity provider and employer.
Conflicts of Interest
The authors declare no conflicts of interest.
Appendix A

Table A1.
Location data from EG ecotype origin sites and the common garden site. Ecotype ploidy is included.
Table A1.
Location data from EG ecotype origin sites and the common garden site. Ecotype ploidy is included.
| Name | City | County | State | Latitude | Longitude | Avg Annual Precipitation (mm) | Avg Annual Temperature (°C) | Soil | Ploidy |
|---|---|---|---|---|---|---|---|---|---|
| Angleton | Angleton | Brazoria | TX | 29.176208 | −95.404211 | 1092–1245 | 19–22 | Lake Charles clay | 2× |
| Bellville | Bellville | Austin | TX | 29.910744 | −96.250814 | 864–1320 | 17–21 | Trinity clay, frequently flooded | 2× |
| Bryan | Bryan | Robertson | TX | 30.743083 | −96.497133 | 864–1016 | 19–21 | Highbank silty clay loam, rarely flooded | 3× |
| Buffalo Lake | Buffalo Lake | Randall | TX | 34.908367 | −102.149536 | 406–559 | 13–17 | Portales clay loam | 3× |
| Caldwell 1 | Caldwell | Washington | TX | 30.12613592 | −96.60179283 | 711–1016 | 18–21 | Bosque clay loam, frequently flooded | 4× |
| Caprock Canyon | Caprock Canyon | Briscoe | TX | 34.417217 | −101.071383 | 508–584 | 14–18 | Berda loam | 4× |
| Collinsville | Collinsville | Cooke | TX | 33.55500 | −96.94590 | 711–1016 | 18–21 | Gowen clay loam | 4× |
| Eddy | Eddy | McLennan | TX | 31.29945 | −97.248933 | 762–1067 | 18–20 | Fairlie clay | 2× |
| Jackson | Edna | Jackson | TX | 28.90000 | −96.53000 | 940–1244 | 21–22 | Laewest clay | 4× |
| Lake Marvin | Lake Marvin | Hemphill | TX | 35.887864 | −100.179944 | 457–635 | 14–17 | Sweetwater soils, frequently flooded | 3× |
| Lake Meredith | Lake Meredith | Potter | TX | 35.591725 | −101.726786 | 508–711 | 16–18 | Clairemont silty clay loam, occasionally flooded | 4× |
| Lake Texana | Lake Texana | Jackson | TX | 29.058933 | −96.579483 | 965–1118 | 21–22 | Navidad fine sandy loam, frequently flooded | 4× |
| Medina | Hondo | Medina | TX | 29.37844 | −99.12653 | 584–762 | 21–22 | Divot clay loam, occasionally flooded | 4× |
| Nacogdoches | Nacogdoches | Nacogdoches | TX | 31.65000 | −94.53333 | 1016–1168 | 18–20 | Alto fine sandy loam | 4× |
| Oatmeal | Oatmeal | Burnet | TX | 30.6882 | −98.0909 | 762–914 | 18–20 | Bolar clay loam | 4× |
| Sadberry | Sadberry | Robertson | TX | 30.765683 | −96.507133 | 838–1016 | 19–21 | Hearne fine sandy loam | 3× |
| Saltillo | Saltillo | Hopkins | TX | 33.22733 | −95.33601 | 1016–1321 | 18–21 | Nahatche soils, frequently flooded | 4× |
| Stampede | Stampede | Bell | TX | 31.28295 | −97.44733 | 762–965 | 18–19 | San Saba clay | 2× |
| Stockdale | Stockdale | Wilson | TX | 29.238056 | −97.983056 | 660–864 | 21–23 | Leming loamy fine sand | 4× |
| Walnut Creek | Walnut Creek | Robertson | TX | 31.01645 | −96.705033 | 864–1016 | 18–20 | Zilaboy clay, frequently flooded | 4× |
| WNWR1 | Meers | Commanche | OK | 34.74290 | −98.62850 | 787–1016 | 14–17 | Brico soil and Rock outcrop | 2× |
| Common garden | Temple | Bell | TX | 31.045492 | −97.348125 | 838–1092 | 17–17 | Houston Black clay | NA |
References
- Kiniry, J.R.; Williams, A.S.; Jacot, J.; Shadow, A.; Brakie, M.; Burson, B.; Jessup, R.; Cordsiemon, R.; Kim, S.; Avila, A.; et al. Diverse eastern gamagrass ecotypes: General characteristics, ploidy levels, and biogeography. Crop Sci. 2023, 63, 3545–3556. [Google Scholar] [CrossRef]
- Ahring, R.M.; Frank, H. Establishment of eastern gamagrass from seed and vegetative propagation. J. Range Manag. 1968, 21, 27. [Google Scholar] [CrossRef]
- Springer, T.L.; Dewald, C.L. Eastern gamagrass and other Tripsacum species. In Warm-Season (C4) Grasses; Moser, L.E., Burson, B.L., Sollenberger, L.E., Eds.; Agronomy Monographs: Madison, WI, USA, 2004; Volume 45. [Google Scholar]
- Gillen, R.L.; Berg, W.A.; Dewald, C.L.; Sims, P.L. Sequence grazing systems on the Southern Plains. J. Range Manag. 1999, 52, 583–589. [Google Scholar] [CrossRef]
- Blanco-Canqui, H. Growing dedicated energy crops on marginal lands and ecosystem services. Soil Sci. Soc. Am. J. 2016, 80, 845–858. [Google Scholar] [CrossRef]
- Clark, R.B.; Alberts, E.E.; Zobel, R.W.; Sinclair, T.R.; Miller, M.S.; Kemper, W.D.; Foy, C.D. Eastern gamagrass (Tripsacum dactyloides) root penetration into and chemical properties of claypan soils. Plant Soil 1998, 200, 33–45. [Google Scholar] [CrossRef]
- Gilker, R.E.; Weil, R.R.; Krizek, D.T.; Momen, B. Eastern gamagrass root penetration in adverse subsoil conditions. Soil Sci. Soc. Am. J. 2002, 66, 931–938. [Google Scholar] [CrossRef]
- Keyser, P.D.; Lituma, C.M.; Bates, G.E.; Holcomb, E.D.; Waller, J.C.; Griffith, A.P. Evaluation of eastern gamagrass and a sorghum × sudangrass for summer pasture. Agron. J. 2020, 112, 1702–1712. [Google Scholar] [CrossRef]
- Rhoades, E.D. Inundation tolerance of grasses in flooded areas. Trans. ASAE 1964, 7, 164–0166. [Google Scholar] [CrossRef]
- Kiniry, J.R.; Williams, J.R.; Gassman, P.W.; Debaeke, P. General Process-Oriented Model for Two Competing Plant Species. Trans. Am. Soc. Agicultural Eng. 1992, 35, 801–810. [Google Scholar] [CrossRef]
- Behrman, K.D.; Keitt, T.H.; Kiniry, J.R. Modeling Differential Growth in Switchgrass Cultivars Across the Central and Southern Great Plains. BioEnergy Res. 2014, 7, 1165–1173. [Google Scholar] [CrossRef]
- Kiniry, J.R.; Johnson, M.V.V.; Venuto, B.C.; Burson, B.L. Novel Application of ALMANAC: Modelling a Functional Group, Exotic Warm-season Perennial Grasses. Am. J. Exp. Agric. 2013, 3, 631–650. [Google Scholar] [CrossRef][Green Version]
- Kiniry, J.R.; MacDonald, J.D.; Kemanian, A.R.; Watson, B.; Putz, G.; Prepas, E.E. Plant growth simulation for landscape-scale hydrological modelling. Hydrol. Sci. J. 2008, 53, 1030–1042. [Google Scholar] [CrossRef]
- Kiniry, J.R.; Sanderson, M.A.; Williams, J.R.; Tischler, C.R.; Hussey, M.A.; Ocumpaugh, W.R.; Read, J.C.; Van Esbroeck, G.; Reed, R.L. Simulating Alamo switchgrass with the ALMANAC model. Agron. J. 1996, 88, 602–606. [Google Scholar] [CrossRef]
- Kiniry, J.R.; Muscha, J.M.; Petersen, M.K.; Kilian, R.W.; Metz, L.J. Short Duration, Perennial Grasses in Low Rainfall Site in Montana Deriving Growth Parameters and Simulating with a Process-Based Model. J. Exp. Agric. Int. 2017, 15, 1–13. [Google Scholar] [CrossRef]
- Kiniry, J.R.; Burson, B.L.; Evers, G.W.; Williams, J.R.; Sanchez, H.; Wade, C.; Featherston, J.W.; Greenwade, J. Coastal Bermudagrass, Bahiagrass, and Native Range Simulation at Diverse Sites in Texas. Agron. J. 2007, 99, 450–461. [Google Scholar] [CrossRef]
- Kiniry, J.; Cassida, K.; Hussey, M.; Muir, J.; Ocumpaugh, W.; Read, J.; Reed, R.; Sanderson, M.; Venuto, B.; Williams, J. Switchgrass simulation by the ALMANAC model at diverse sites in the southern US. Biomass Bioenergy 2005, 29, 419–425. [Google Scholar] [CrossRef]
- Kiniry, J.R.; Sanchez, H.; Greenwade, J.; Seidensticker, E.; Bell, J.R.; Pringle, F.; Peacock, G., Jr.; Rives, J. Simulating grass productivity on diverse range sites in Texas. J. Soil Water Conserv. 2002, 57, 144–150. [Google Scholar]
- Kim, S.; Kim, S.; Cho, J.; Park, S.; Jarrín Perez, F.X.; Kiniry, J.R. Simulated Biomass, Climate Change Impacts, and Nitrogen Management to Achieve Switchgrass Biofuel Production at Diverse Sites in U.S. Agronomy 2020, 10, 503. [Google Scholar] [CrossRef]
- Kim, S.; Kiniry, J.; Williams, A.; Meki, N.; Gaston, L.; Brakie, M.; Shadow, A.; Fritschi, F.; Wu, Y. Adaptation of C4 Bioenergy Crop Species to Various Environments within the Southern Great Plains of USA. Sustainability 2017, 9, 89. [Google Scholar] [CrossRef]
- Monsi, M.; Saeki, T. über den Lichtfaktor in den Pflanzengesellschaften und seine Bedeutung für die Stoffproduktion. Jpn. J. Bot. 1953, 14, 22–52. [Google Scholar]
- Kiniry, J.R.; Tischler, C.R.; Van Esbroeck, G.A. Radiation use efficiency and leaf CO2 exchange for diverse C4 grasses. Biomass Bioenergy 1999, 17, 95–112. [Google Scholar] [CrossRef]
- Johnson, L.C.; Olsen, J.T.; Tetreault, H.; Delacruz, A.; Bryant, J.; Morgan, T.J.; Knapp, M.; Bello, N.M.; Baer, S.G.; Maricle, B.R. Intraspecific variation of a dominant grass and local adaptation in reciprocal garden communities along a US Great Plains’ precipitation gradient: Implications for grassland restoration with climate change. Evol. Appl. 2015, 8, 705–723. [Google Scholar] [CrossRef]
- Casler, M.D. Impact of ploidy on biomass yield of upland switchgrass (Panicum virgatum L.): A meta-analysis. Genet. Resour. Crop Evol. 2022, 70, 1115–1122. [Google Scholar] [CrossRef]
- Dunfield, P.C. A Preliminary Evaluation of Eastern Gamagrass from Northeast Texas. Ph.D. Thesis, East Texas State University, Commerce, TX, USA, 1984. [Google Scholar]
- Newell, C.A.; de Wet, J.M.J. Morphological and Cytological Variability in Tripsacum dactyloides (Gramineae). Am. J. Bot. 1974, 61, 652–664. [Google Scholar] [CrossRef]
- Schliesing, T.G.; Dahl, B.E. Ecotypic variation in Tripsacum dactyloides. J. Range Manag. 1983, 36, 665–668. [Google Scholar] [CrossRef]
- Meek, D.W.; Hatfield, J.L.; Howell, T.A.; Idso, S.B.; Reginato, R.J. A generalized relationship between photosynthetically active radiation and solar radiation. Agron. J. 1984, 76, 939–945. [Google Scholar] [CrossRef]
- Monteith, J.L. Light distribution and photosynthesis in field crops. Ann. Bot. 1965, 29, 17–37. [Google Scholar] [CrossRef]
- Mangelsdorf, P.C.; Reeves, R.G. Maize, Tripsacum, and Euchlaena. J. Hered. 1931, 22, 329–343. [Google Scholar] [CrossRef]
- Randolph, L. Cytogenetic aspects of the origin and evolutionary history of corn. In Corn and Corn Improvement; Academic Press: New York, NY, USA, 1955; pp. 16–61. [Google Scholar]
- Kiniry, J.R.; Jones, C.A.; O’toole, J.C.; Blanchet, R.; Cabelguenne, M.; Spanel, D.A. Radiation-use efficiency in biomass accumulation prior to grain-filling for five grain-crop species. Field Crops. Res. 1989, 20, 51–64. [Google Scholar] [CrossRef]
- Williams, W.A.; Loomis, R.S.; Lepley, C.R. Vegetative Growth of Corn as Affected by Population Density. I. Productivity in Relation to Interception of Solar Radiation. Crop Sci. 1965, 5, 211–215. [Google Scholar] [CrossRef]
- Bonhomme, R.; Ruget, F.; Derieux, M.; Vincourt, P. Relations Entre Production de Matière Sèche Aérienne et Énergie Interceptée Chez Différents Génotypes de Maïs. C.R. Acad. Sci. 1982, 294, 393–398. [Google Scholar]
- Yao, N.R. Vegetative and Reproductive Development of Corn at Four Spring Planting Dates. Master’s Thesis, Pennsylvania State University, University Park, PA, USA, 1980. [Google Scholar]
- Wilson, J.W. Ecological Data on Dry-Matter Production by Plants and Plant Communities; Bradley, E.F., Denmead, O.T., Eds.; Interscience Publishers: New York, NY, USA, 1967. [Google Scholar]
- Sivakumar, M.V.K.; Virmani, S.M. Crop productivity in relation to interception of photosynthetically active radiation. Agric. For. Meteorol. 1984, 31, 131–141. [Google Scholar] [CrossRef]
- Griffin, J.L. Quantification of the Effects of Water Stress on Corn Growth and Yield. Master’s Thesis, University of Missouri, Columbia, MO, USA, 1980. [Google Scholar]
Disclaimer/Publisher’s Note: The statements, opinions and data contained in all publications are solely those of the individual author(s) and contributor(s) and not of MDPI and/or the editor(s). MDPI and/or the editor(s) disclaim responsibility for any injury to people or property resulting from any ideas, methods, instructions or products referred to in the content. |
© 2024 by the authors. Licensee MDPI, Basel, Switzerland. This article is an open access article distributed under the terms and conditions of the Creative Commons Attribution (CC BY) license (https://creativecommons.org/licenses/by/4.0/).

