Abstract
Increasing soil organic carbon (SOC) contents and reducing carbon dioxide (CO2) emissions in paddy soil fields can result in positive impacts on climate change mitigation and soil quality. However, SOC accumulation and its microbial driving factors under enhanced fertilization strategies (e.g., organic matter application) are still unclear. Therefore, we investigated the effects of organic matter addition on SOC variations, CO2 fluxes, and their relationships with soil bacterial compositions and functions through a 6-year fertilizer experiment in rice fields involving two fertilization types, namely chemical fertilizer (NPK) and chemical fertilizer combined with organic matter (NPK+OM). The results showed significantly higher and lower SOC contents (p < 0.05) in the 10–20 cm soil layer under the NPK+OM treatment before rice transplanting and after rice harvest, respectively, than those under the NPK treatment. The lower SOC contents after rice harvest might be due to the great nutrient consumption, resulting in higher rice yields in the NPK+OM than those in the NPK treatment by 6.68 to 32.35%. Compared with NPK, NPK+OM reduced the in-situ CO2 fluxes by 38.70–118.59%. However, the ex-situ SOC mineralization rates were not affected by NPK+OM in the 0–10 and 10–20 cm soil layers. The 16S rRNA sequence indicated a significant increase in the abundance of non-singleton amplicon sequence variants (ASVs) in the NPK+OM treatment scenario compared to those in the NPK treatment scenario. The top three most important soil bacterial phylum influenced by NPK+OM were LCP-89, BRC1, and Rokubacteria in April, as well as Firmicutes, Nitrospinae, and BRC1 in July. Soil Actinobacteria was negatively correlated with the SOC contents in April and July. The results of the present study demonstrate the economic and ecological benefits of the organic matter addition in rice production, as well as the contribution of soil bacteria to SOC accumulation and CO2 emission reduction.
1. Introduction
Enhancing the storage of soil organic carbon (SOC) is a crucial tactic in maintaining soil health, in addition to decreasing carbon emissions. This, in turn, plays a significant role in climate change mitigation [1]. In reality, elevating global SOC contents by 0.4% could counterbalance a year’s worth of human-induced greenhouse gas emissions [2]. As suggested by Walker et al., agricultural lands harbor enormous potential for SOC sequestration. Close to 27% (which translates to about 133.8 Pg C) of the unrestricted C pool resides in agricultural soils, underlining the substantial yet unutilized potential for carbon sequestration in these areas [3]. In China, the SOC stocks in agricultural soils are lower than the global average [4]. Furthermore, the actual sequestration rates are significantly lower than the potential rate. Thus, boosting SOC levels and soil fertility in underperforming agricultural lands is a prime target for the Chinese government. In tilled areas, paddy soils carry significant importance as C storage, displaying SOC percentages that are roughly 20% higher than those found in elevated fields. This positions them as vital constituents of the worldwide C cycle [5,6].
Although intensive agricultural activities have significantly increased agricultural productivity and crop yields over the last decades [7], long-term applications of chemical fertilizers can lead to the degradation of soil physicochemical properties and, consequently, affect soil fertility. Chemical fertilizers can provide sufficient essential nutrients to plants, thereby enhancing their growth and productivity. However, their applications may cause soil compaction and acidification [8]. On the other hand, organic matter has long-lasting effects and plays an important role in enhancing soil fertility. Indeed, previous related studies have revealed the positive impacts of organic matter on SOC sequestration and soil fertility [9,10,11,12,13]. However, relying solely on organic matter additions may be costly and not meet the nutrient requirements of crops throughout their entire growing seasons. Therefore, combining organic matter and chemical fertilizers may be a promising approach for achieving optimal crop yields and soil health [14]. Currently, the mechanisms underlying the long-term effects of combined applications of organic matter and chemical fertilizers on soil CO2 emissions, SOC sequestration, and crop yields under double rice production systems are still not fully understood.
Fragrant rice accounts for 15–18% of the global rice market, and is becoming increasingly preferred by consumers in South China due to its higher quality [15]. According to previous research, the combination of organic matter and chemical fertilizers can significantly improve the yields and aroma of fragrant rice [16]. However, few studies have investigated the effects of long-term organic matter additions on SOC accumulation and CO2 emissions. Soil microbial diversity is a critical indicator of soil health and is easily influenced by anthropogenic activities [17]. Indeed, organic matter additions could change microbial abundance and enhance soil microbial diversity and SOC accumulation [18,19,20].
However, soil microbial responses to organic matter additions are site-and seasonal-specific. Different water management regimes affect the balance between greenhouse gas emissions and soil organic carbon sequestration. Controlled irrigation shows an enhanced carbon sequestration capacity compared to flooded irrigation, while controlled irrigation can reduce methane emissions to mitigate the greenhouse effect in paddy fields [21]. Therefore, further research is required to expand the knowledge of soil microbial functions and compositions under organic matter addition conditions, particularly in double-fragrant rice cropping systems in South China.
In this context, from a 6-year experiment area with organic amendments, we collected 12 soil samples on 2 April 2022 and 16 July 2022 for two rounds of soil bacterial sequencing and SOC analysis. Three rounds of paddy field CO2 emission analysis were conducted on 12 May 2022, 14 September 2022, and 22 May 2023, and ten rice yield measurements were carried out from the late season of 2017 to the early season of 2022. The chief goals of this research are, firstly, to delve into the impact of organic matter in conjunction with chemical fertilizers on SOC reservoirs and CO2 exchanges in fragrant rice fields after six years of experimental administration; secondly, to evaluate the soil bacterial diversity and configurations, along with forecasting the functional aptitudes of the bacterial ecosystem. Our hypothesis postulates that the amalgamation of organic matter and chemical fertilizers might elevate CO2 exchanges due to heavy C input and SOC reservoirs, which are fundamentally guided by the soil microbial compositions and functionalities.
2. Materials and Methods
2.1. Site of Experiment and Climatic Conditions
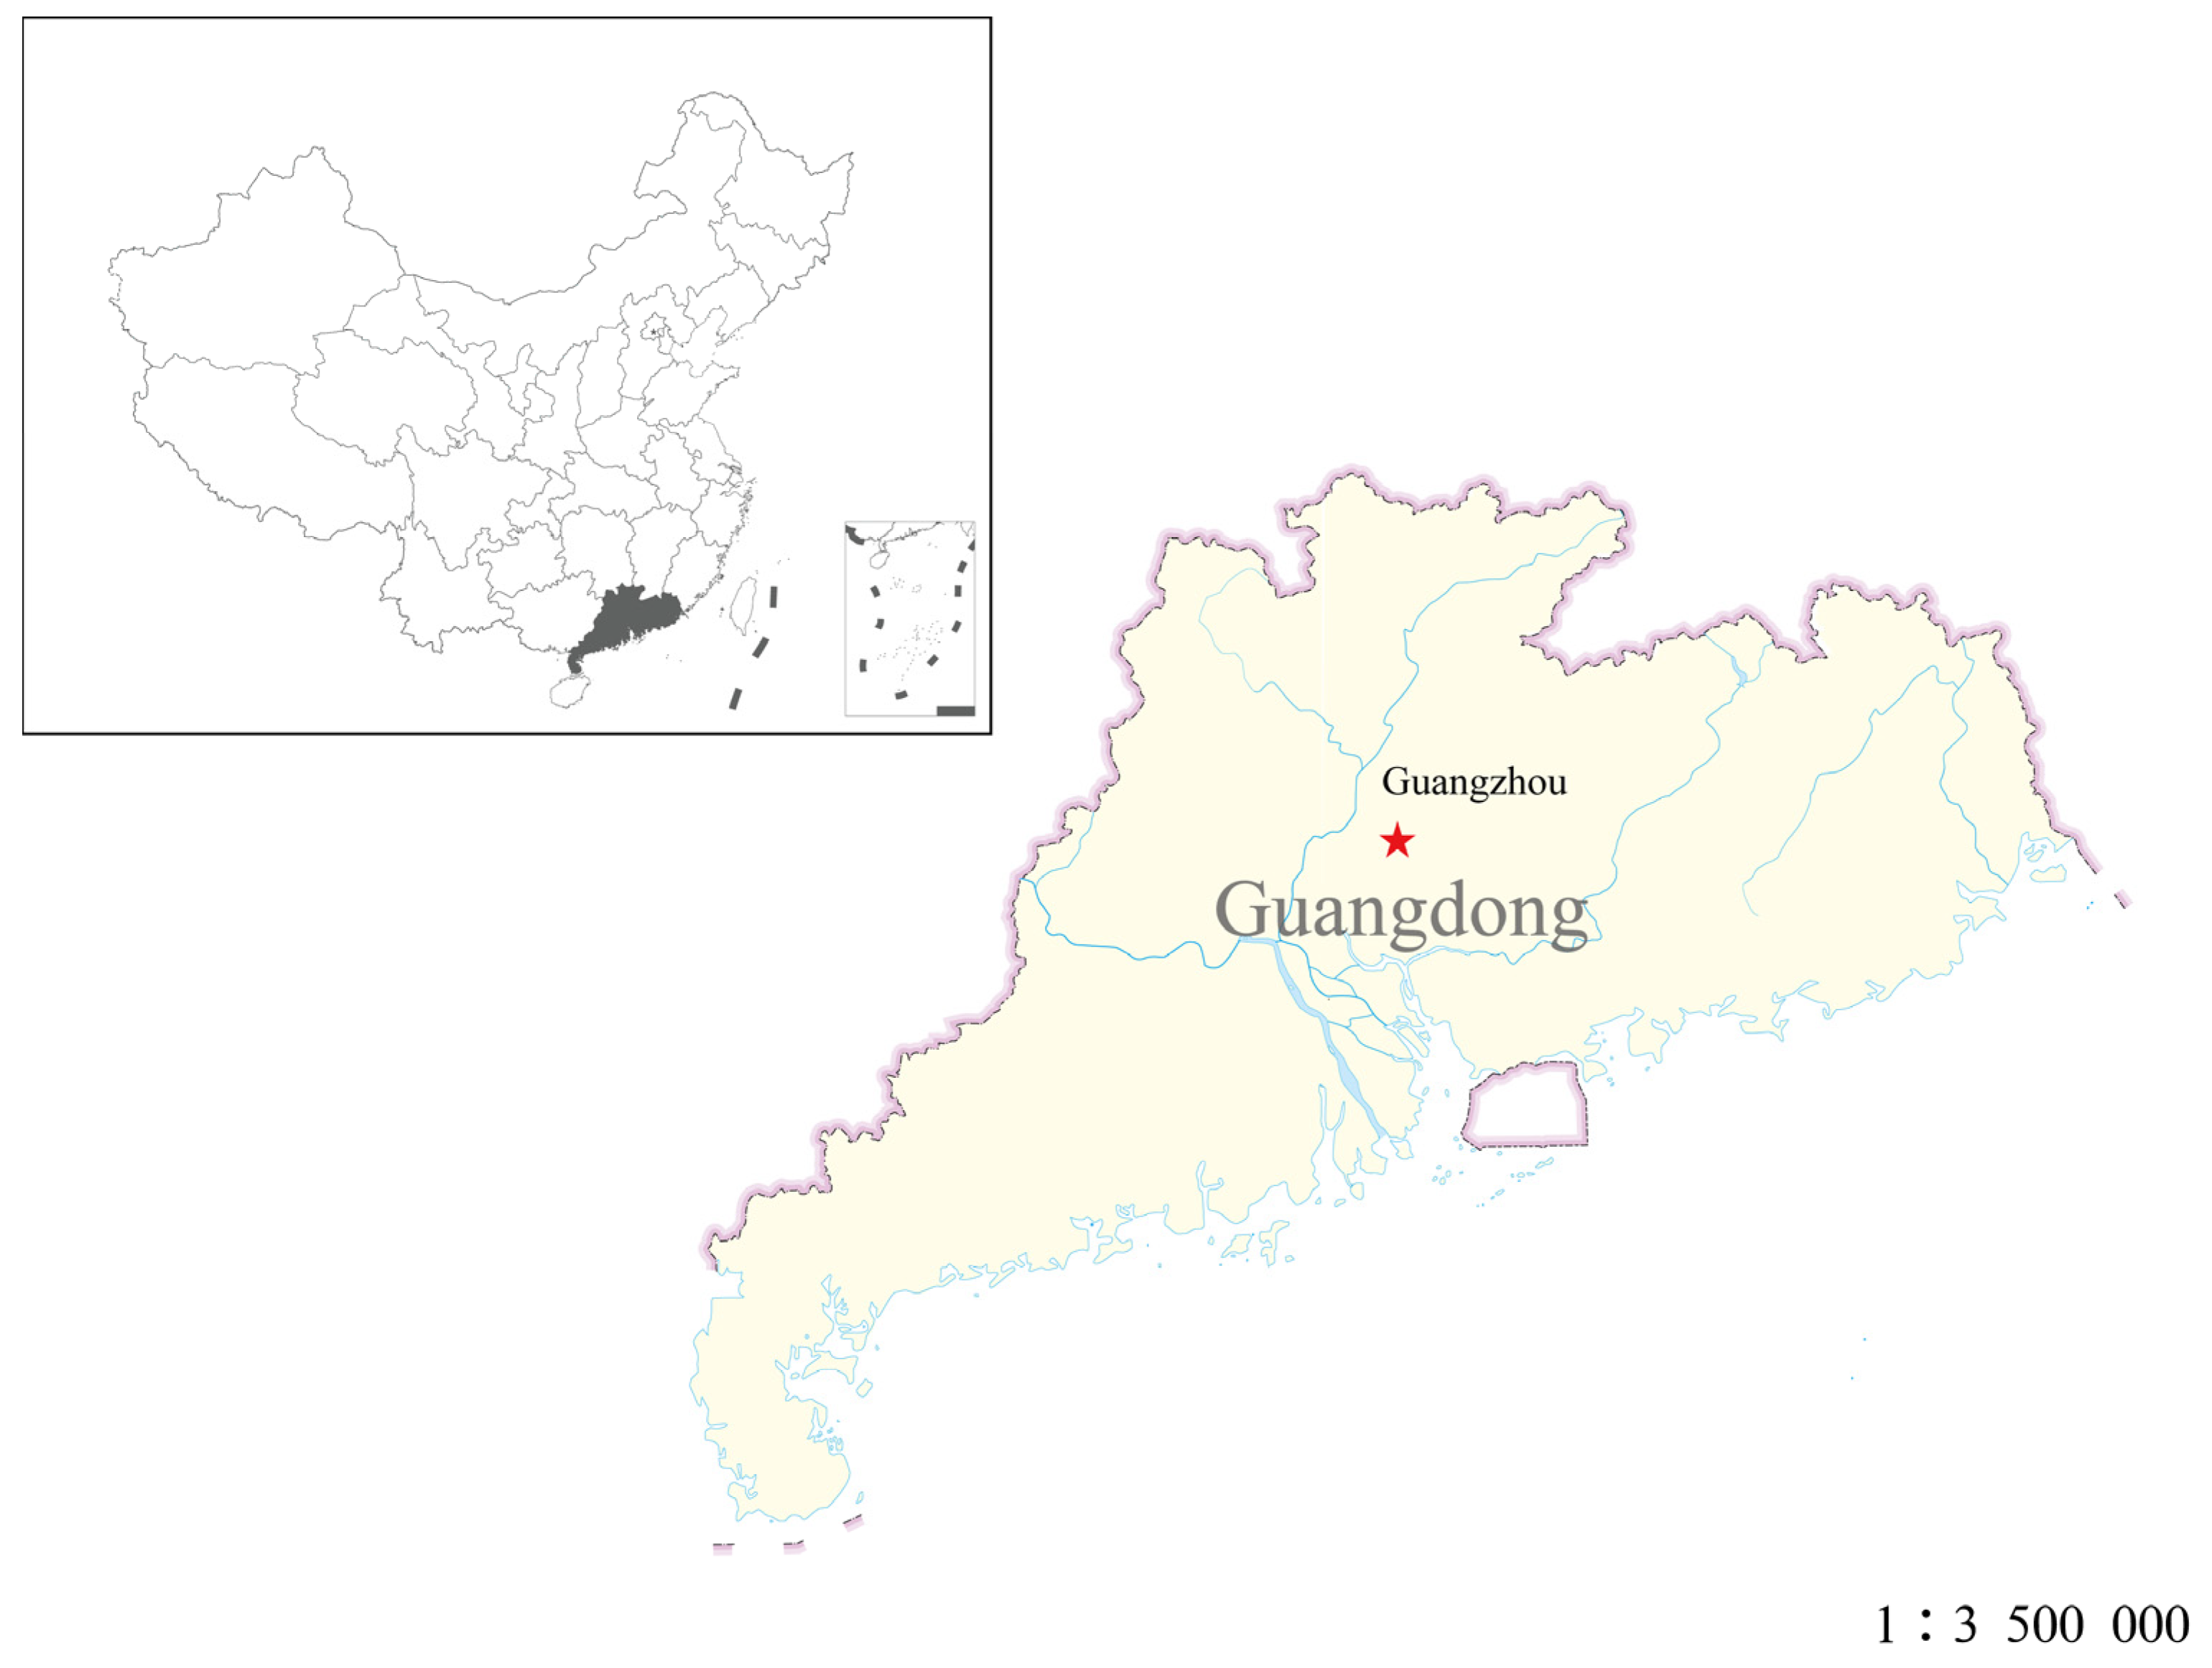
The field experiment was conducted from July 2017 to July 2023 at the Field Experimental Station of South China Agricultural University, which is located at latitude 23°17′ N and longitude 113°37′ E, situated at an elevation of 12 m (Figure 1). The experiment site falls within a subtropical monsoon climate zone, characterized by an average annual temperature of 23 °C and an accumulated annual precipitation measuring 2032.7 mm in 2022. The soil type present at the experimental site is categorized as sandy loam [22]. The main soil physicochemical properties of the study site are reported in Table 1.
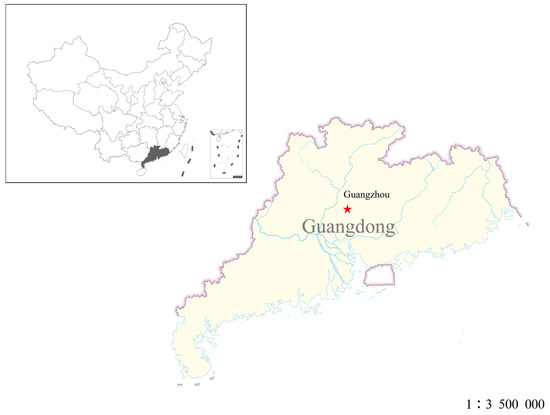
Figure 1.
Experimental Site Map-Guangzhou, Guangdong, China. Note: The red star represents the experimental site.

Table 1.
Soil basic properties.
2.2. Experiment Design and Field Management
The setup of the experiment followed a randomized complete block design, employing six blocks. Each of these blocks covered a surface area of 240 square meters, with dimensions being 16 m by 15 m. It consisted of two fertilization types, namely chemical fertilizer (NPK) and chemical fertilizer combined with organic matter (NPK+OM). The organic matter consists of livestock manure, primarily accumulated through multiple fermentations of chicken manure, and then formed into granules via a granulator. These by-products are rich in nutrients and commonly used as natural fertilizers to improve soil in agricultural practices. The NPK treatment involved the applications of urea, calcium superphosphate, and potassium chloride at the rates of 292.5, 300, and 90 kg·hm−2, corresponding to N, P2O5, and K2O amounts of 135, 36, and 54 kg·hm−2, respectively. In the NPK+OM treatment, a special fertilizer for fragrant rice was applied at the rate of 900 kg·hm−2, containing 15, 4, and 6% of N, P2O5, and K2O, respectively (N, P2O5, and K2O amounts of 135, 36, and 54 kg·hm−2), with 10% organic matter (85.61 g·kg−1 organic C and 164.01 g·kg−1 total nitrogen). Before rice transplanting, two fertilization treatments (NPK and NPK+OM) were applied manually to the experimental plots, specifically between 15 and 30 March (early season) and 15 and 30 July (late season) each year. Besides that, all other field management measures for the two fertilizer treatments (NPK and NPK+OM) were identical. The fragrant rice variety was Meixiangzhang-2. Pot seedling trays and transplanters were used for seedling cultivation and transplanting. Pre-sowing preparations involved soaking the rice seeds in water for a period of 12 h. Post-soaking, the seeds were placed in an incubator set to a steady temperature of 36 °C for an additional 12 h to encourage germination. With the help of an automatic seeder, the sprouted seeds were then sown into pot seed trays. After allowing 15 days from the sowing date, the rice seedlings were meticulously transplanted to the established paddy field. In the early-season rice crop, the seeds were sown, transplanted, and harvested in March, April, and July, respectively. Whereas in the late-season rice crop, the seeds were sown, transplanted, and harvested in July, August, and November, respectively. After transplanting, the paddy field was flooded with water to a constant depth of about 3 cm until the end of the tillering stage, then dried to eliminate unproductive tillers. After the drying process, water was again supplied until the end of the grain-filling stage. Afterward, the paddy field was dried again to achieve suitable dry conditions for harvesting. Rice yields were determined for early and late rice from 2017 to 2022, by sampling 1 m2 of fragrant rice during the maturation stage of each plot [17].
2.3. Soil Sampling and Analysis
2.3.1. Soil Sampling
This study involved comprehensive soil sampling, accomplished using a soil auger. Collection periods were set for April and July 2022, timed to precede the early rice transplanting phase and the later season rice harvest, respectively. During two seasons, soil samples were collected from 2 soil layers (0–10 cm and 10–20 cm) treated with 2 types of fertilizers (NPK and NPK+OM), with 3 blocks designed, resulting in a total of 12 soil samples (2 soil layers × 2 treatments × 3 blocks). Notably, each plot contributed 1 kg of soil sample. The extracted soil sample from each plot was then methodically divided into two separate portions [17]. The sample was stored at −80 °C for DNA extraction and microbial sequencing. The soil properties were determined after soil samples were sieved through a 0.25 mm sieve.
2.3.2. Analysis of Soil Properties
The soil properties were determined using the soil samples sieved through a 0.25 mm sieve. The soil samples were first pretreated with 4 M HCl solution to eliminate inorganic carbon, then analyzed for the SOC and total nitrogen (TN) contents using an elemental analyzer (Vario Macro Cube, Elementar, Langenselbold, Germany). In addition, 10.0 g of soil was mixed with 25 mL of ultrapure water and then measured for pH values using a pH meter (TitroLine 5000, SI Analytics, Mainz, Germany). The available nitrogen, available phosphorus, and available potassium contents in the sieved soil samples were determined according to the method described [23,24].
2.3.3. Determination of C Fluxes and Mineralization
The soil carbon fluxes in the paddy field were measured in this study following the rice tillering stage using a portable carbon flux meter (EGM-5, PP Systems, Haverhill, MA, USA). The determination of organic carbon mineralization is according to [25]. Sieved soil (30.0 g) was passed through a 2 mm mesh screen and placed in a culture bottle, then water was added until reaching 75% of the water-holding capacity (WHC). Three culture bottles without soil samples were set up as a control to decrease the influence of atmosphere CO2. The soil sample was pre-incubated at 25 °C in darkness for 5 days. A small beaker containing 10 mL of 0.5 M NaOH solution was placed into the culture bottle for incubation in darkness at 25 °C. After 5 days of incubation, all the sodium hydroxide solution was transferred from the small beaker to a centrifuge tube. Then, 10 mL of 0.5 M sodium hydroxide was added to the beaker and incubated further at 25 °C in the dark. The process was repeated on the 10th, 20th, 40th, 60th, 80th, 100th, and 120th days of incubation. The solutions that were collected were mixed with 1 mL of 1 M BaCl2, followed by centrifugation to induce precipitate formation. Aphenolphthalein was added as an indicator to the solution and titrated with a 0.2 M HCl solution, recorded as V1. The accumulated SOC mineralization was calculated based on the following equations [26]:
2.3.4. Detection of Microbial Diversity and Abundance
In order to assess the microbial diversity and abundance in the soil, amplification and sequencing of the V3-V4 variable region of the bacterial 16S rRNA gene were performed. Using a soil DNA extraction kit from MO BIO Laboratories located in Carlsbad, CA, USA, the total genomic DNA is extracted from a 0.5 g portion of the soil sample. The universal PCR primers, specifically 341F and 806R, were utilized to amplify the V3-V4 variable region of the bacterial 16S rRNA [27,28]. The extracted DNA was electrophoresed using a 1% agarose gel, and the quality of the target gene bands was determined using NanoDrop 2000 UV-vis spectrophotometer (NC2000, Thermo Scientific, Waltham, MA, USA). The PCR products were quantified using a microplate reader (FLx800 microplate reader, BioTek, Winooski, VT, USA) with fluorescence detection. The sequencing libraries were prepared using a library preparation kit (TruSeq Nano DNA LT Library Prep Kit, Illumina, San Diego, CA, USA). Prior to sequencing, the libraries were first quality-checked using a bioanalyzer (Agilent High Sensitivity DNA Kit) to confirm their quality, then quantified using a fluorescence quantification kit (Quant-iT PicoGreen dsDNA Assay Kit, Thermo Fisher Scientific, Waltham, MA, USA) in a fluorescence quantification system (Quant-iT PicoGreen dsDNA Assay Kit, Thermo Fisher Scientific, Waltham, MA, USA). The qualified libraries were sequenced using a DNA sequencer at an appropriate ratio according to the required sequencing volume of the samples to obtain the bacterial microbial nucleic acid sequences of the soil samples.
2.4. Data Analysis
2.4.1. Bioinformatic Analysis of Microbiome Data
The bacterial microbial nucleic acid sequences were processed using QIIME2 (2019.4) combined with the DADA2 denoising pipeline [29]. Indeed, the primary sequence data underwent two processes for further analysis. They were first demultiplexed using the demux plugin to separate sequences that were mixed together. The sequences were then trimmed utilizing the cutadapt plugin, which helped in removing unwanted sections or adapters from the sequences for a more focused and efficient data analysis [30]. After demultiplexing, the sequences were filtered, denoised, and merged. Chimeric sequences, which are artificial outcomes of PCR amplification, were eliminated using the DADA2 plugin to maintain data accuracy [31]. The non-singleton amplicon sequence variants (ASVs) were aligned using MAFFT [32]. QIIME2 (2019.4) was used to evaluate microbial α-diversity using Chao1 and Shannon indices [33,34]. Kruskal-Wallis and Dunn’s post hoc tests were performed for statistical comparisons. Microbial β-diversity was assessed and visualized via the Bray-Curtis distance matrix and NMDS (Non-Metric Multidimensional Scaling), respectively, using R software packages (R version 4.3.0).
2.4.2. Data Analysis
The statistical differences between the treatments at the p < 0.05 level were evaluated using ANOVA in IBM SPSS Statistics 20 (IBM SPSS Statistics 20, IBM, Armonk, NY, USA). Statistical significance outputs were used as the basis for the analysis of the obtained results. All graphs and plots were generated using Origin 2023b (OriginLab, Northampton, MA, USA).
3. Results
3.1. Rice Yield Variations
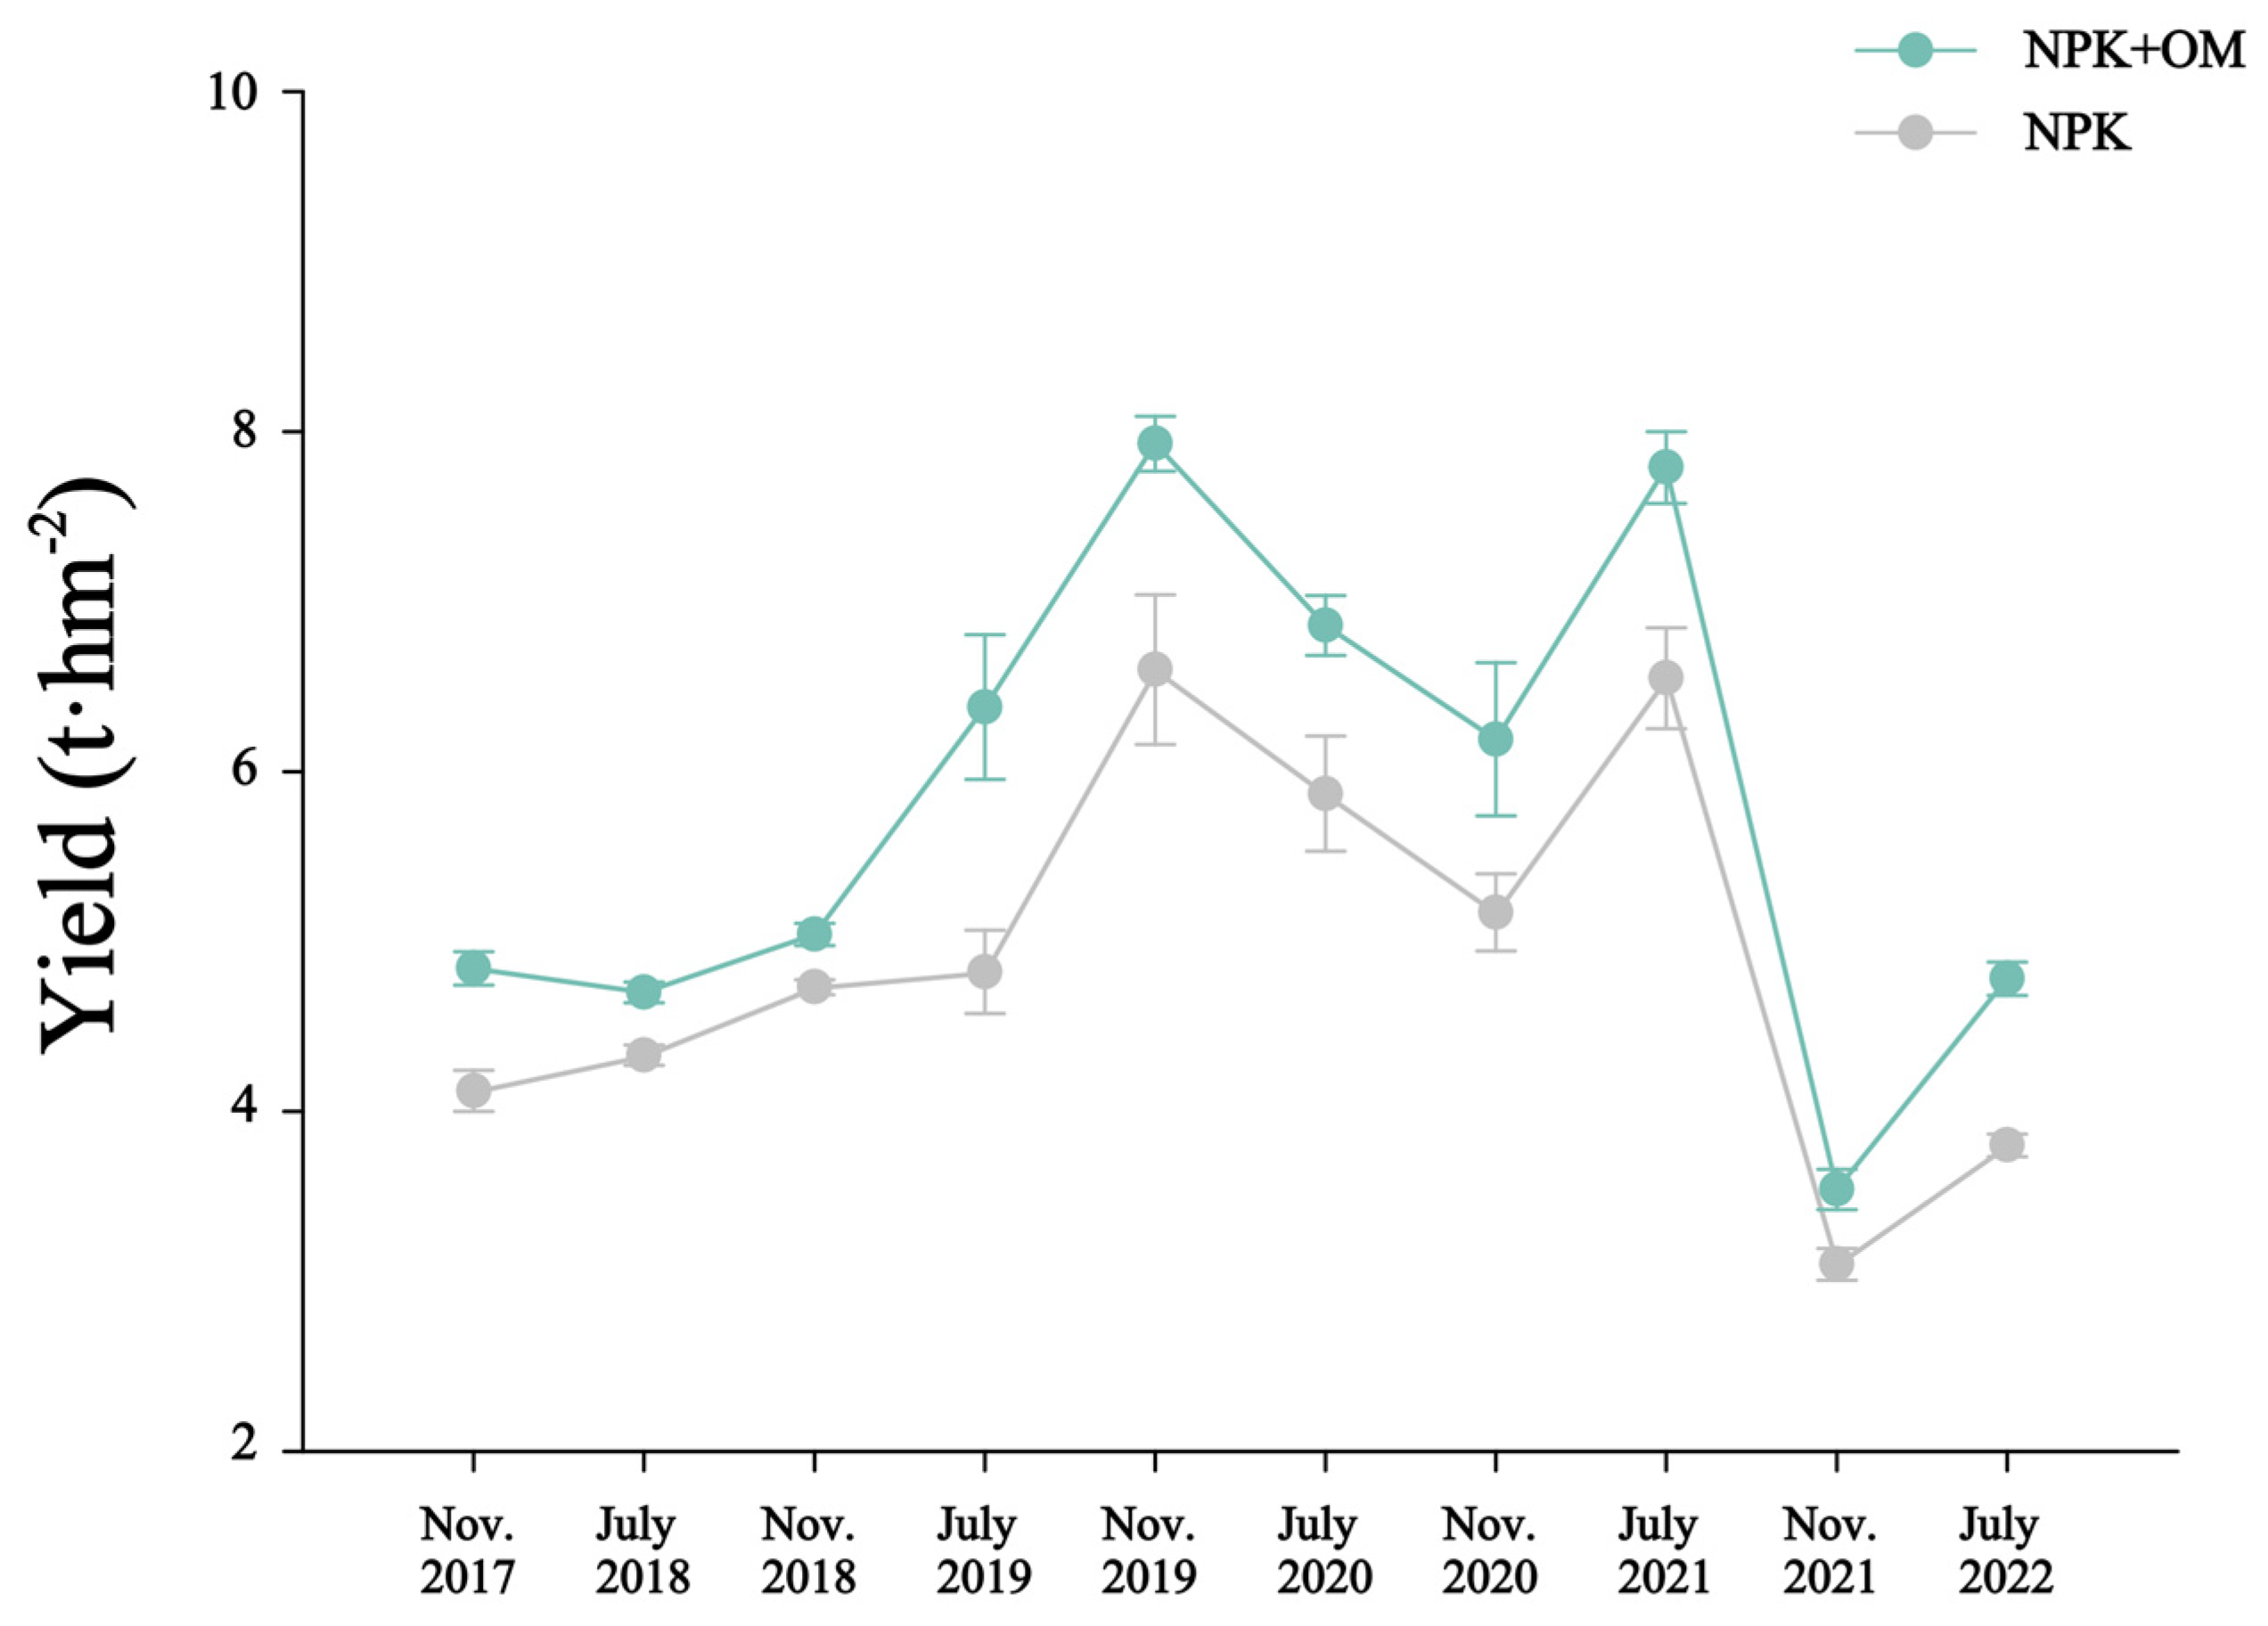
The observed yields from the late-season rice in November 2017 to the early-season rice in July 2022 are shown in Figure 2. The yield data observed over 10 seasons indicated significantly higher rice yields in the NPK+OM treatment than those in the NPK treatment by 6.68 to 32.35%.
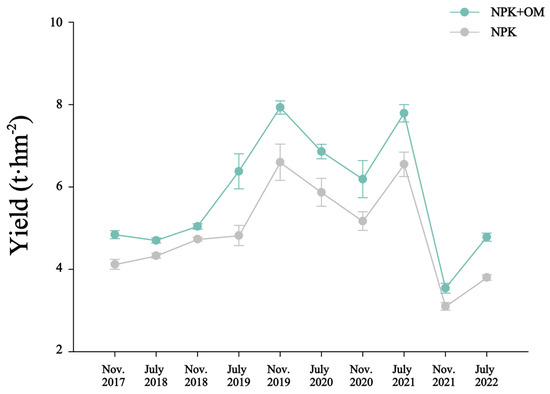
Figure 2.
Impact of organic matter addition on rice yield from the late-season rice in November 2017 to the early-season rice in July 2022. Error bars represent the standard errors (n = 3).
3.2. Soil C Contents, Emissions, and Mineralization
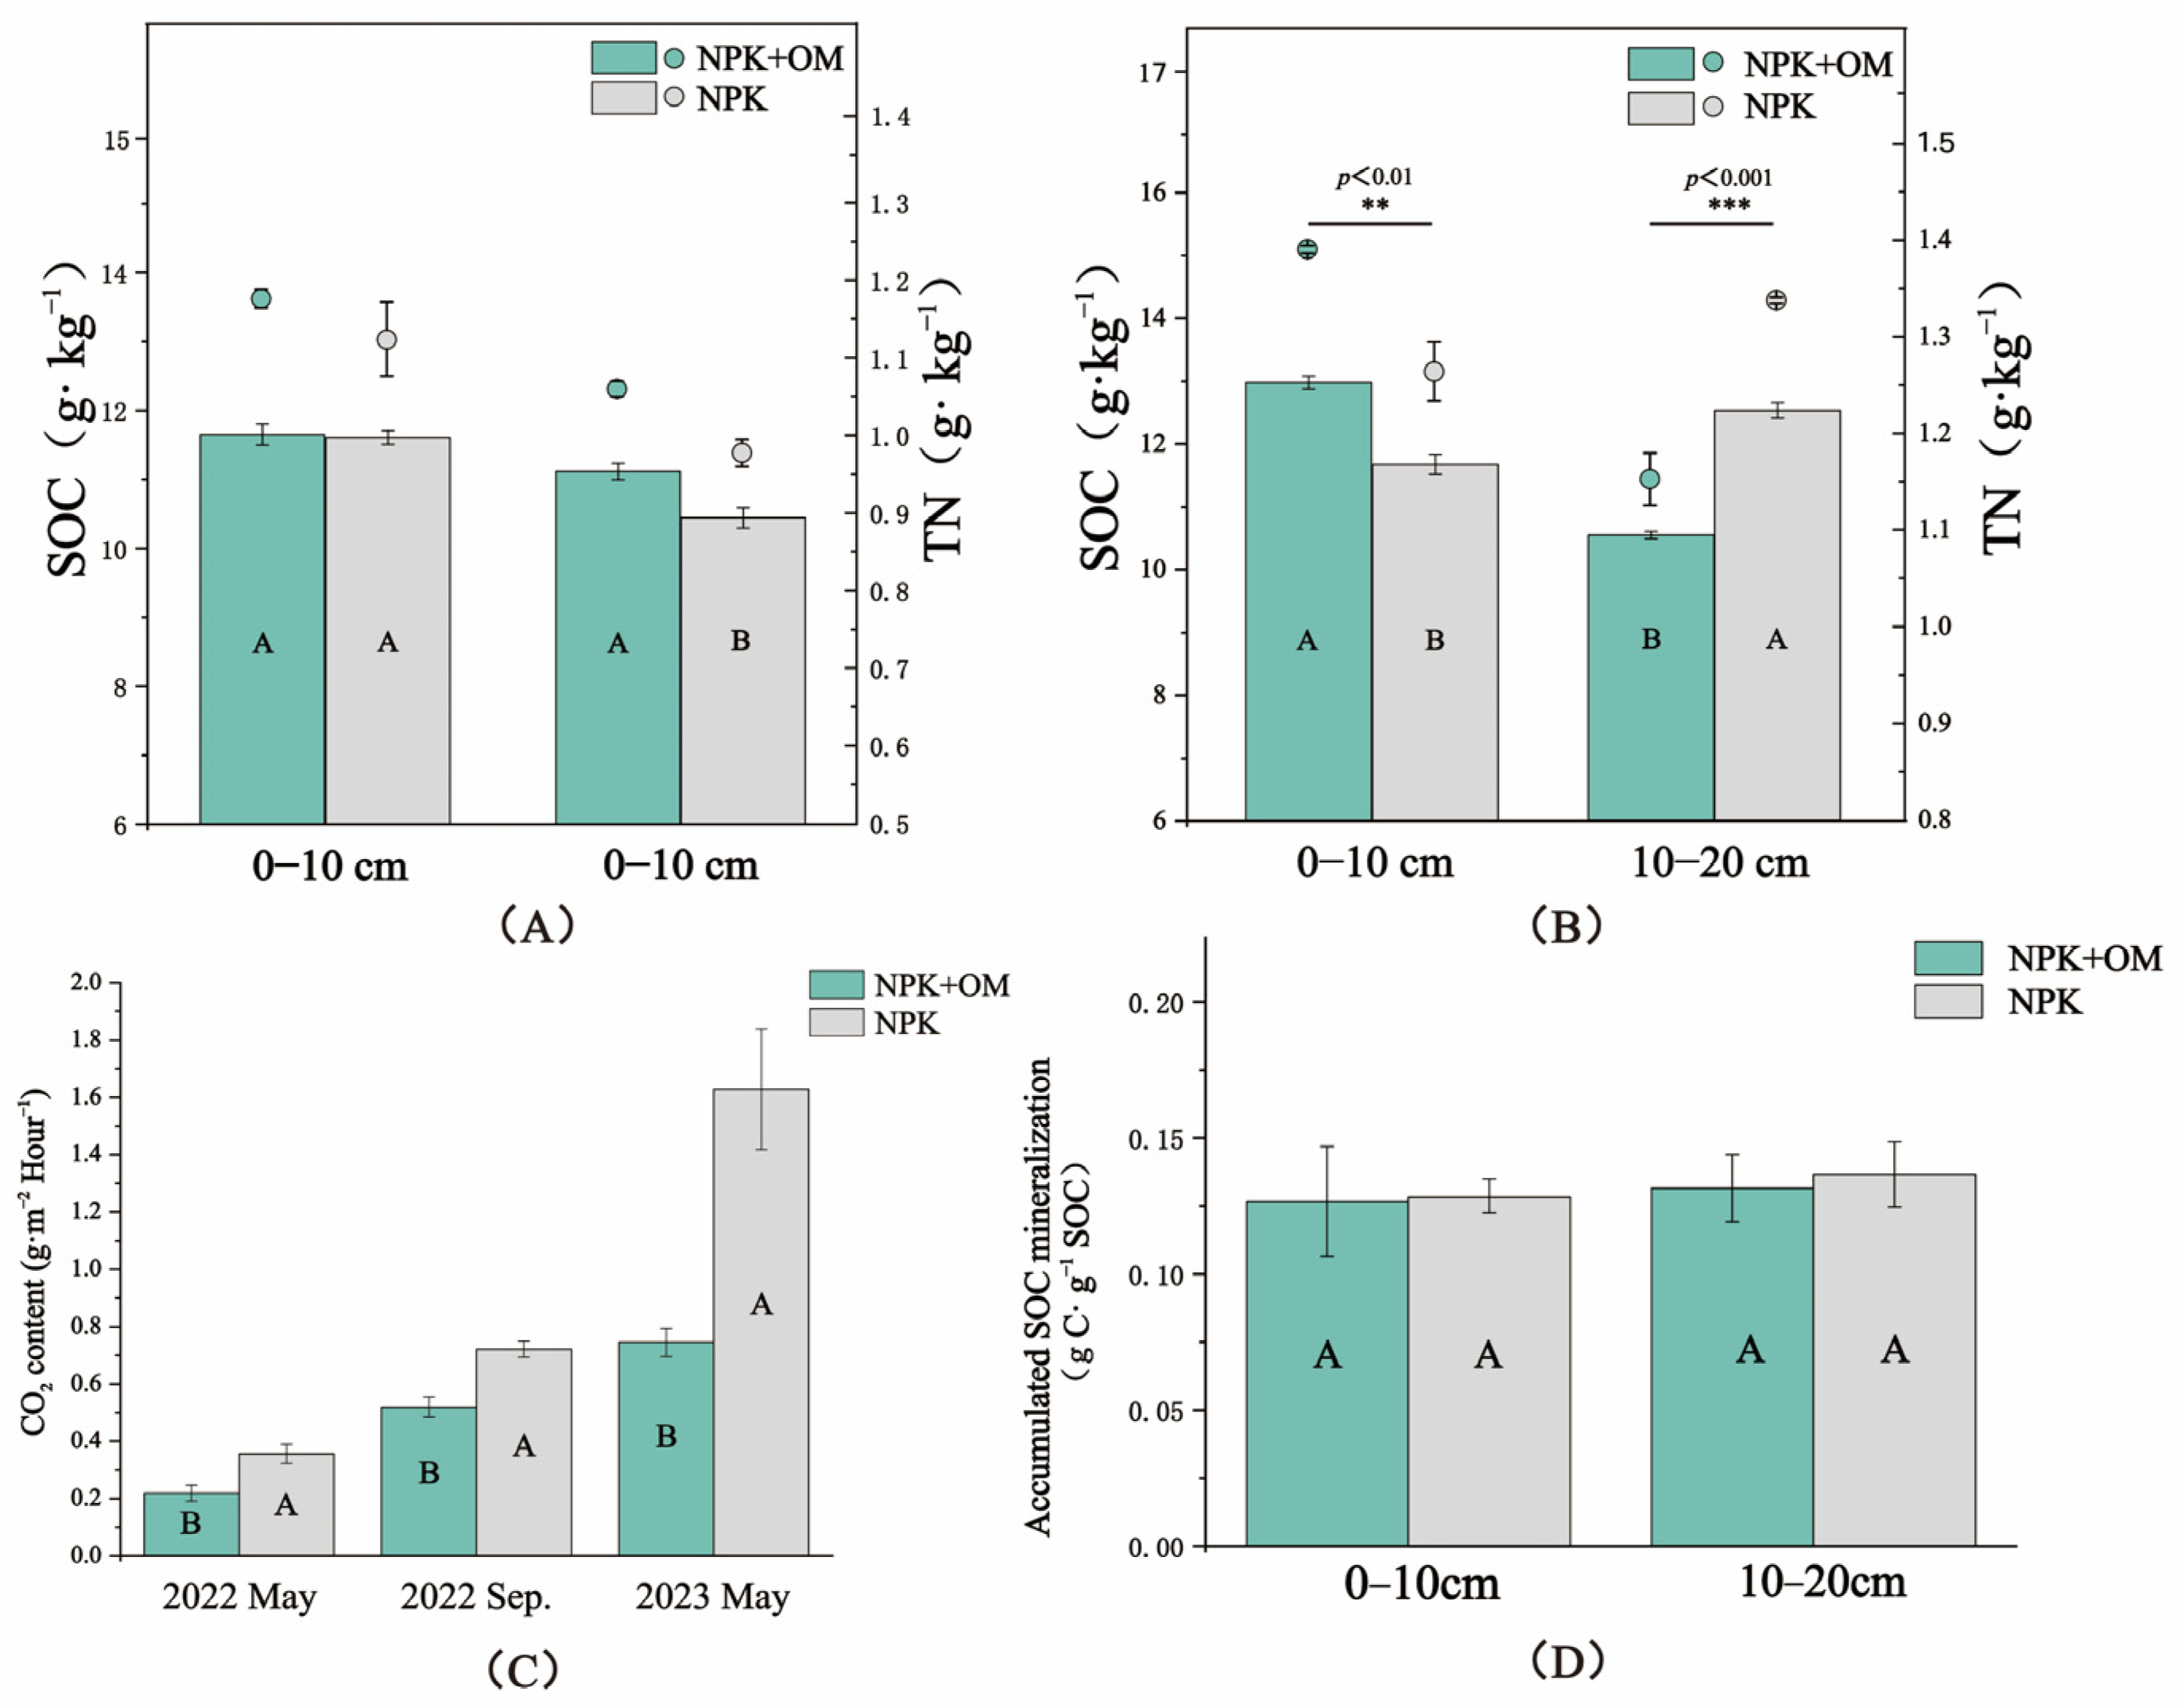
The obtained results showed a lack of significant differences in the observed SOC and TN contents in the 0–10 cm soil layer between the NPK+OM and NPK treatment scenarios in April (Figure 3A). In contrast, significantly higher SOC contents under the NPK+OM treatment scenario were observed in the 10–20 cm soil layer compared to those under the NPK treatment scenario by 6.51%, while no significant differences were observed in the TN contents in the same soil layer. On the other hand, significant differences in the SOC and TN contents were observed between the NPK+OM and NPK treatment scenarios in July in the 0–10 and 10–20 cm soil layers (Figure 3A).
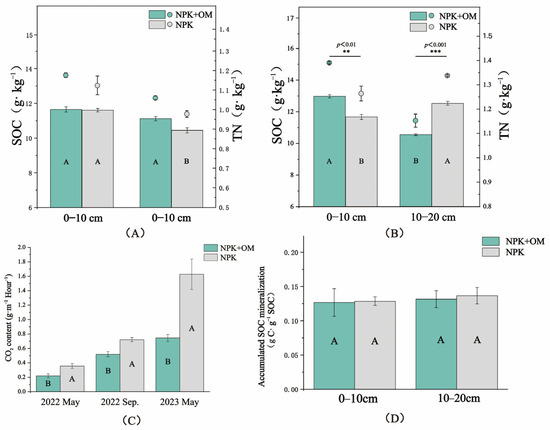
Figure 3.
Effects of organic matter addition on soil organic carbon (SOC), total nitrogen (TN), CO2 fluxes, and accumulated SOC mineralization. (A,B) represent the SOC and TN in the soil at different depths in April and July 2022. **, and *** indicate significance levels of p < 0.01, and p < 0.001. (C) represents the impact of organic matter addition on CO2 fluxes. (D) represents the effect of organic matter addition on Accumulated SOC mineralization in April. Uppercase letters indicate significance levels at p < 0.05. Error bars represent the standard errors (n = 3).
The results of the soil CO2 emission fluxes from 2022 to 2023 are shown in Figure 3C. Based on multiple sampling seasons, the CO2 fluxes in the NPK+OM treatment were significantly lower than those in the NPK treatment. Indeed, compared with NPK, NPK+OM reduced the C fluxes by 62.47, 38.70, and 118.59% in May 2022, September 2022, and May 2023, respectively. On the other hand, there were no significant differences in the accumulated SOC mineralization rates between the NPK+OM and NPK treatment scenarios after 120 days of indoor incubation (Figure 3D).
3.3. Soil Microbial Diversity and Functions
3.3.1. Alpha and Beta Diversity
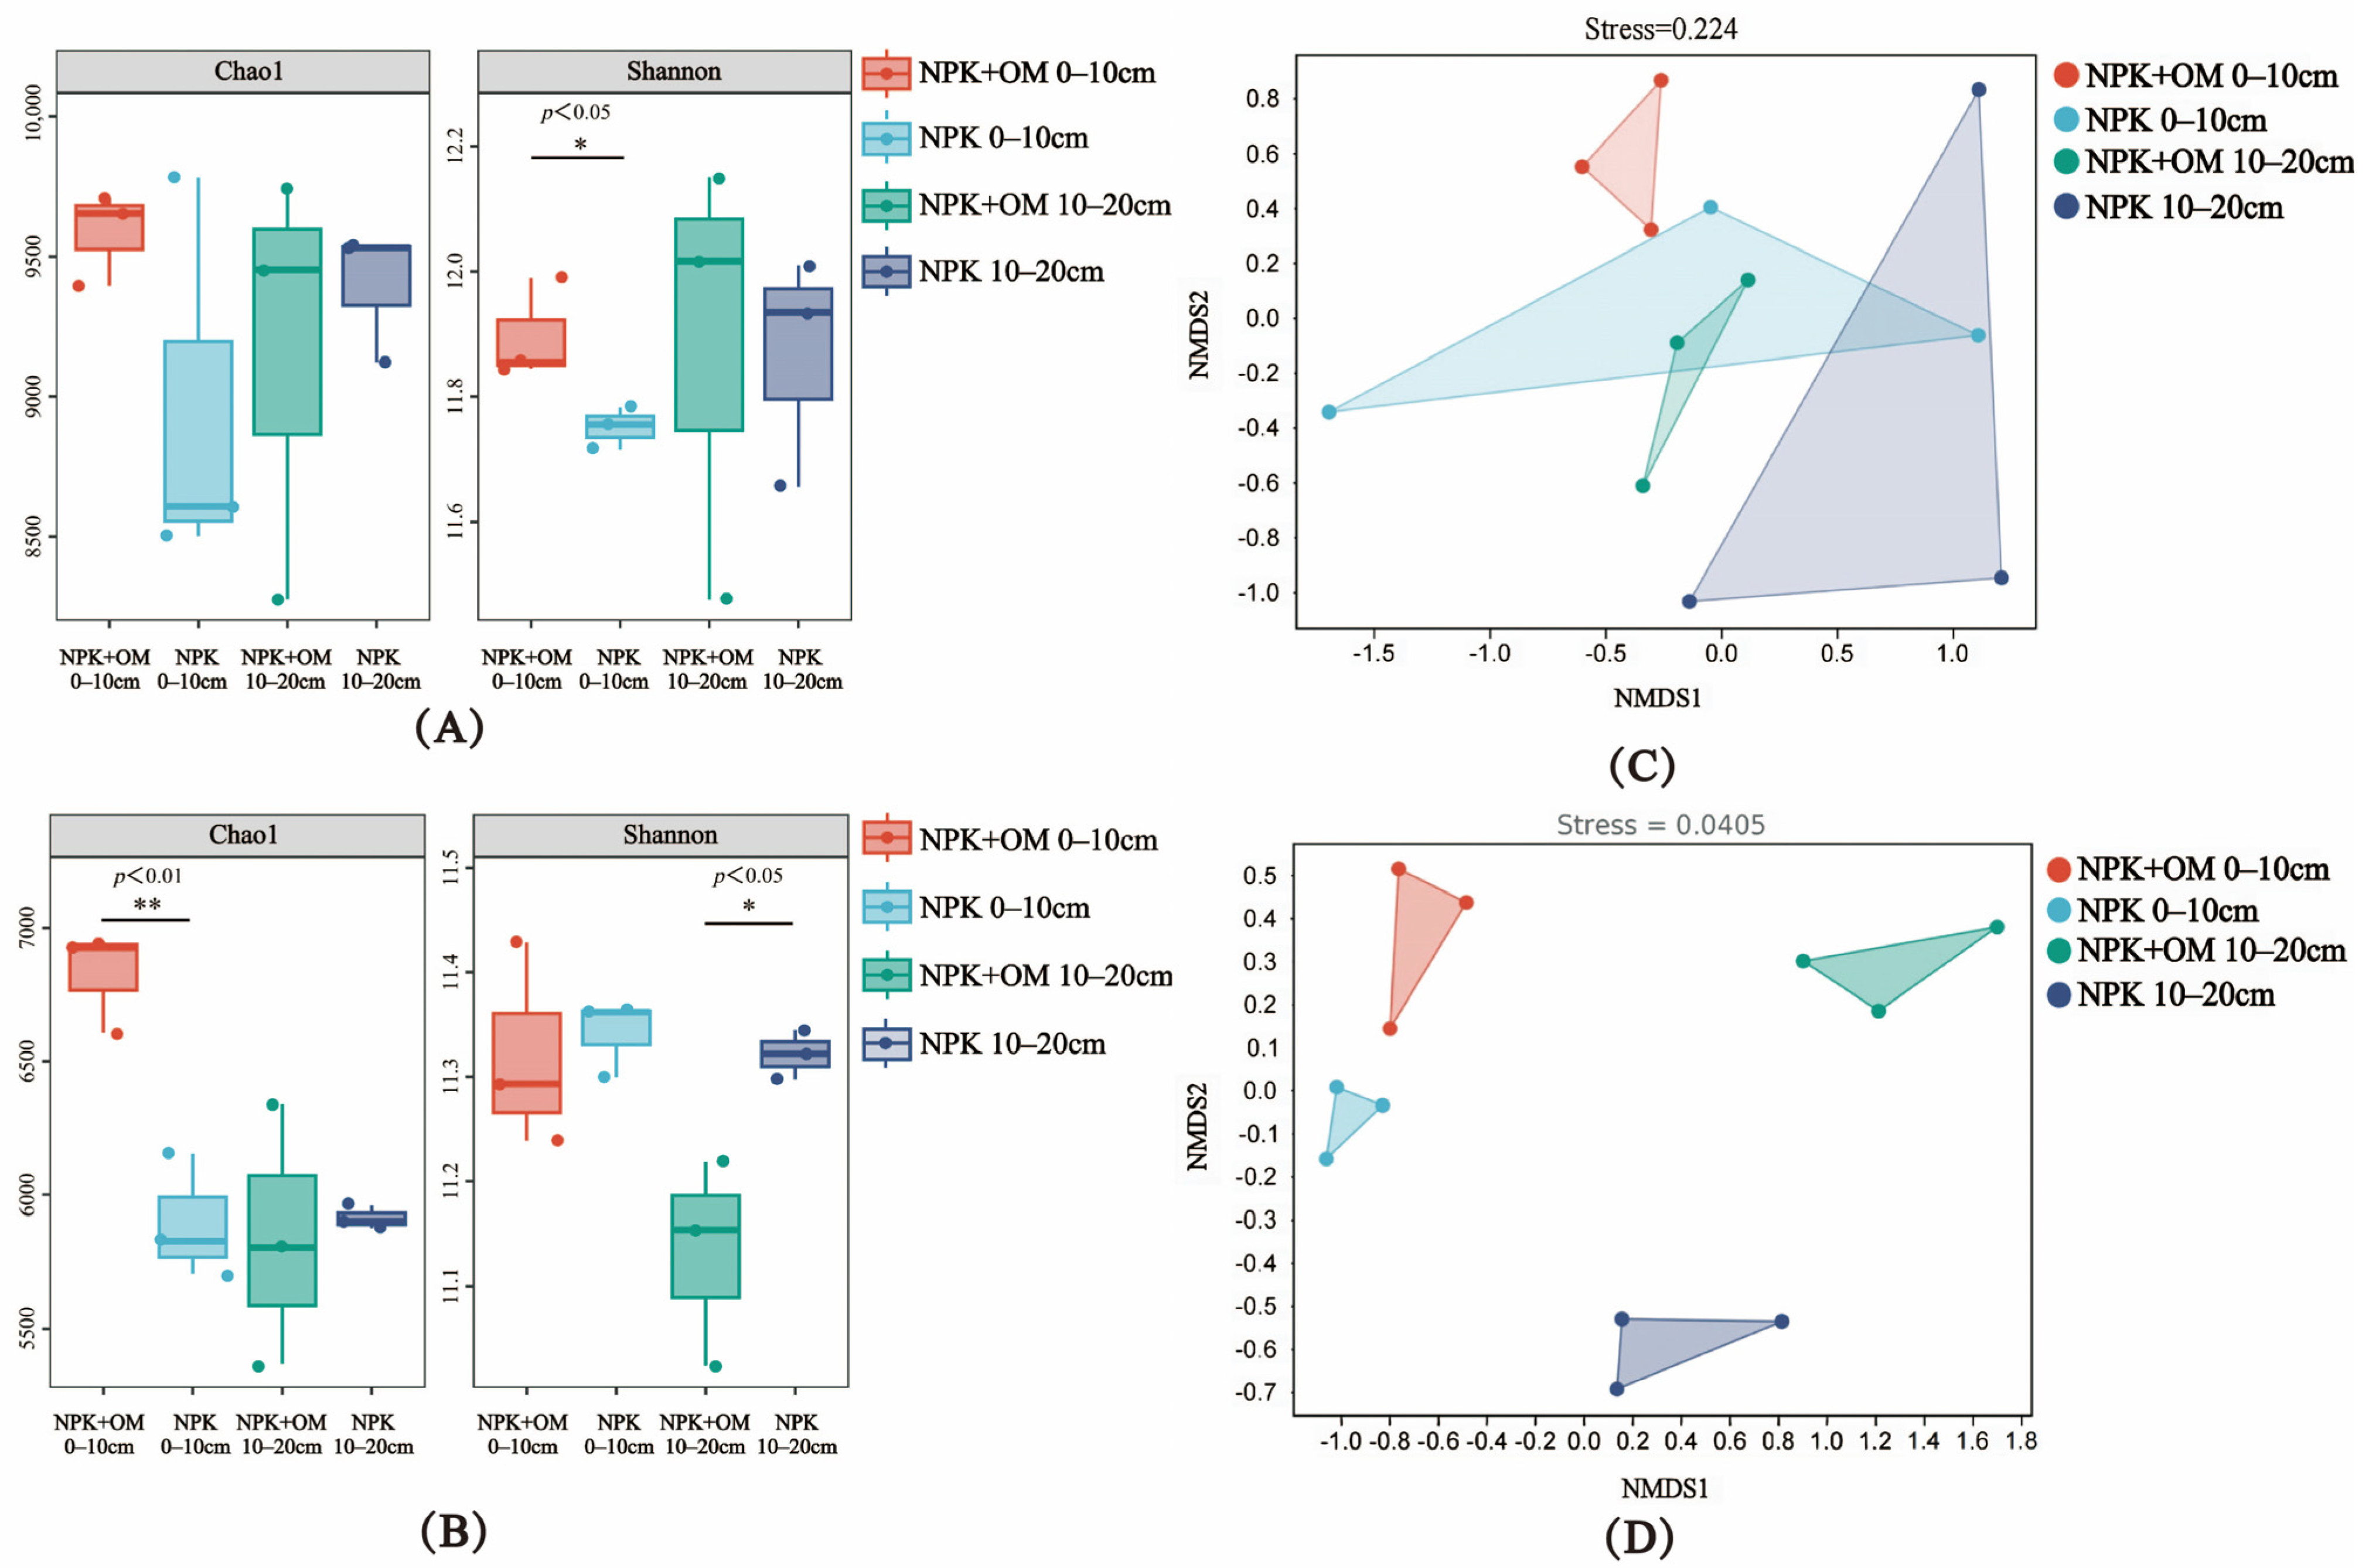
According to the obtained bacterial Alpha-diversity (Chao1 and Shannon indices) of the 0–10 cm soil layer in April, the NPK+OM treatment significantly increased the richness (Shannon, p < 0.05) and diversity (Chao1, p < 0.01) of the bacterial community in April and July, respectively, compared to the NPK treatment (Figure 4A,B). In contrast, significant decreases in the bacterial Alpha-diversity were observed in the 10–20 cm soil layer under the NPK+OM treatment scenario (Shannon, p < 0.05).
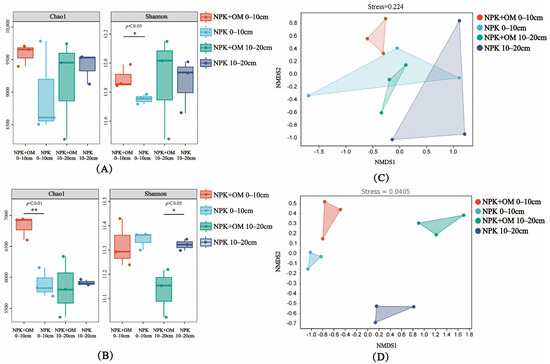
Figure 4.
Effects of organic matter addition on bacterial α-diversity and β-diversity in different soil layers. (A,B) represent the α-diversity of bacteria in April and July 2022. The * and ** indicate significance levels of p < 0.05 and p < 0.01. (C,D) represent the NMDS analysis based on the Bray-Curtis distance matrix in April and July 2022.
The NMDS analysis results of the soil bacterial Beta-diversity in April and July are shown in Figure 4C,D. Obvious differences between the NPK+OM and NPK treatments were observed in the different soil layers in both April and July.
3.3.2. Bacterial Community Structure
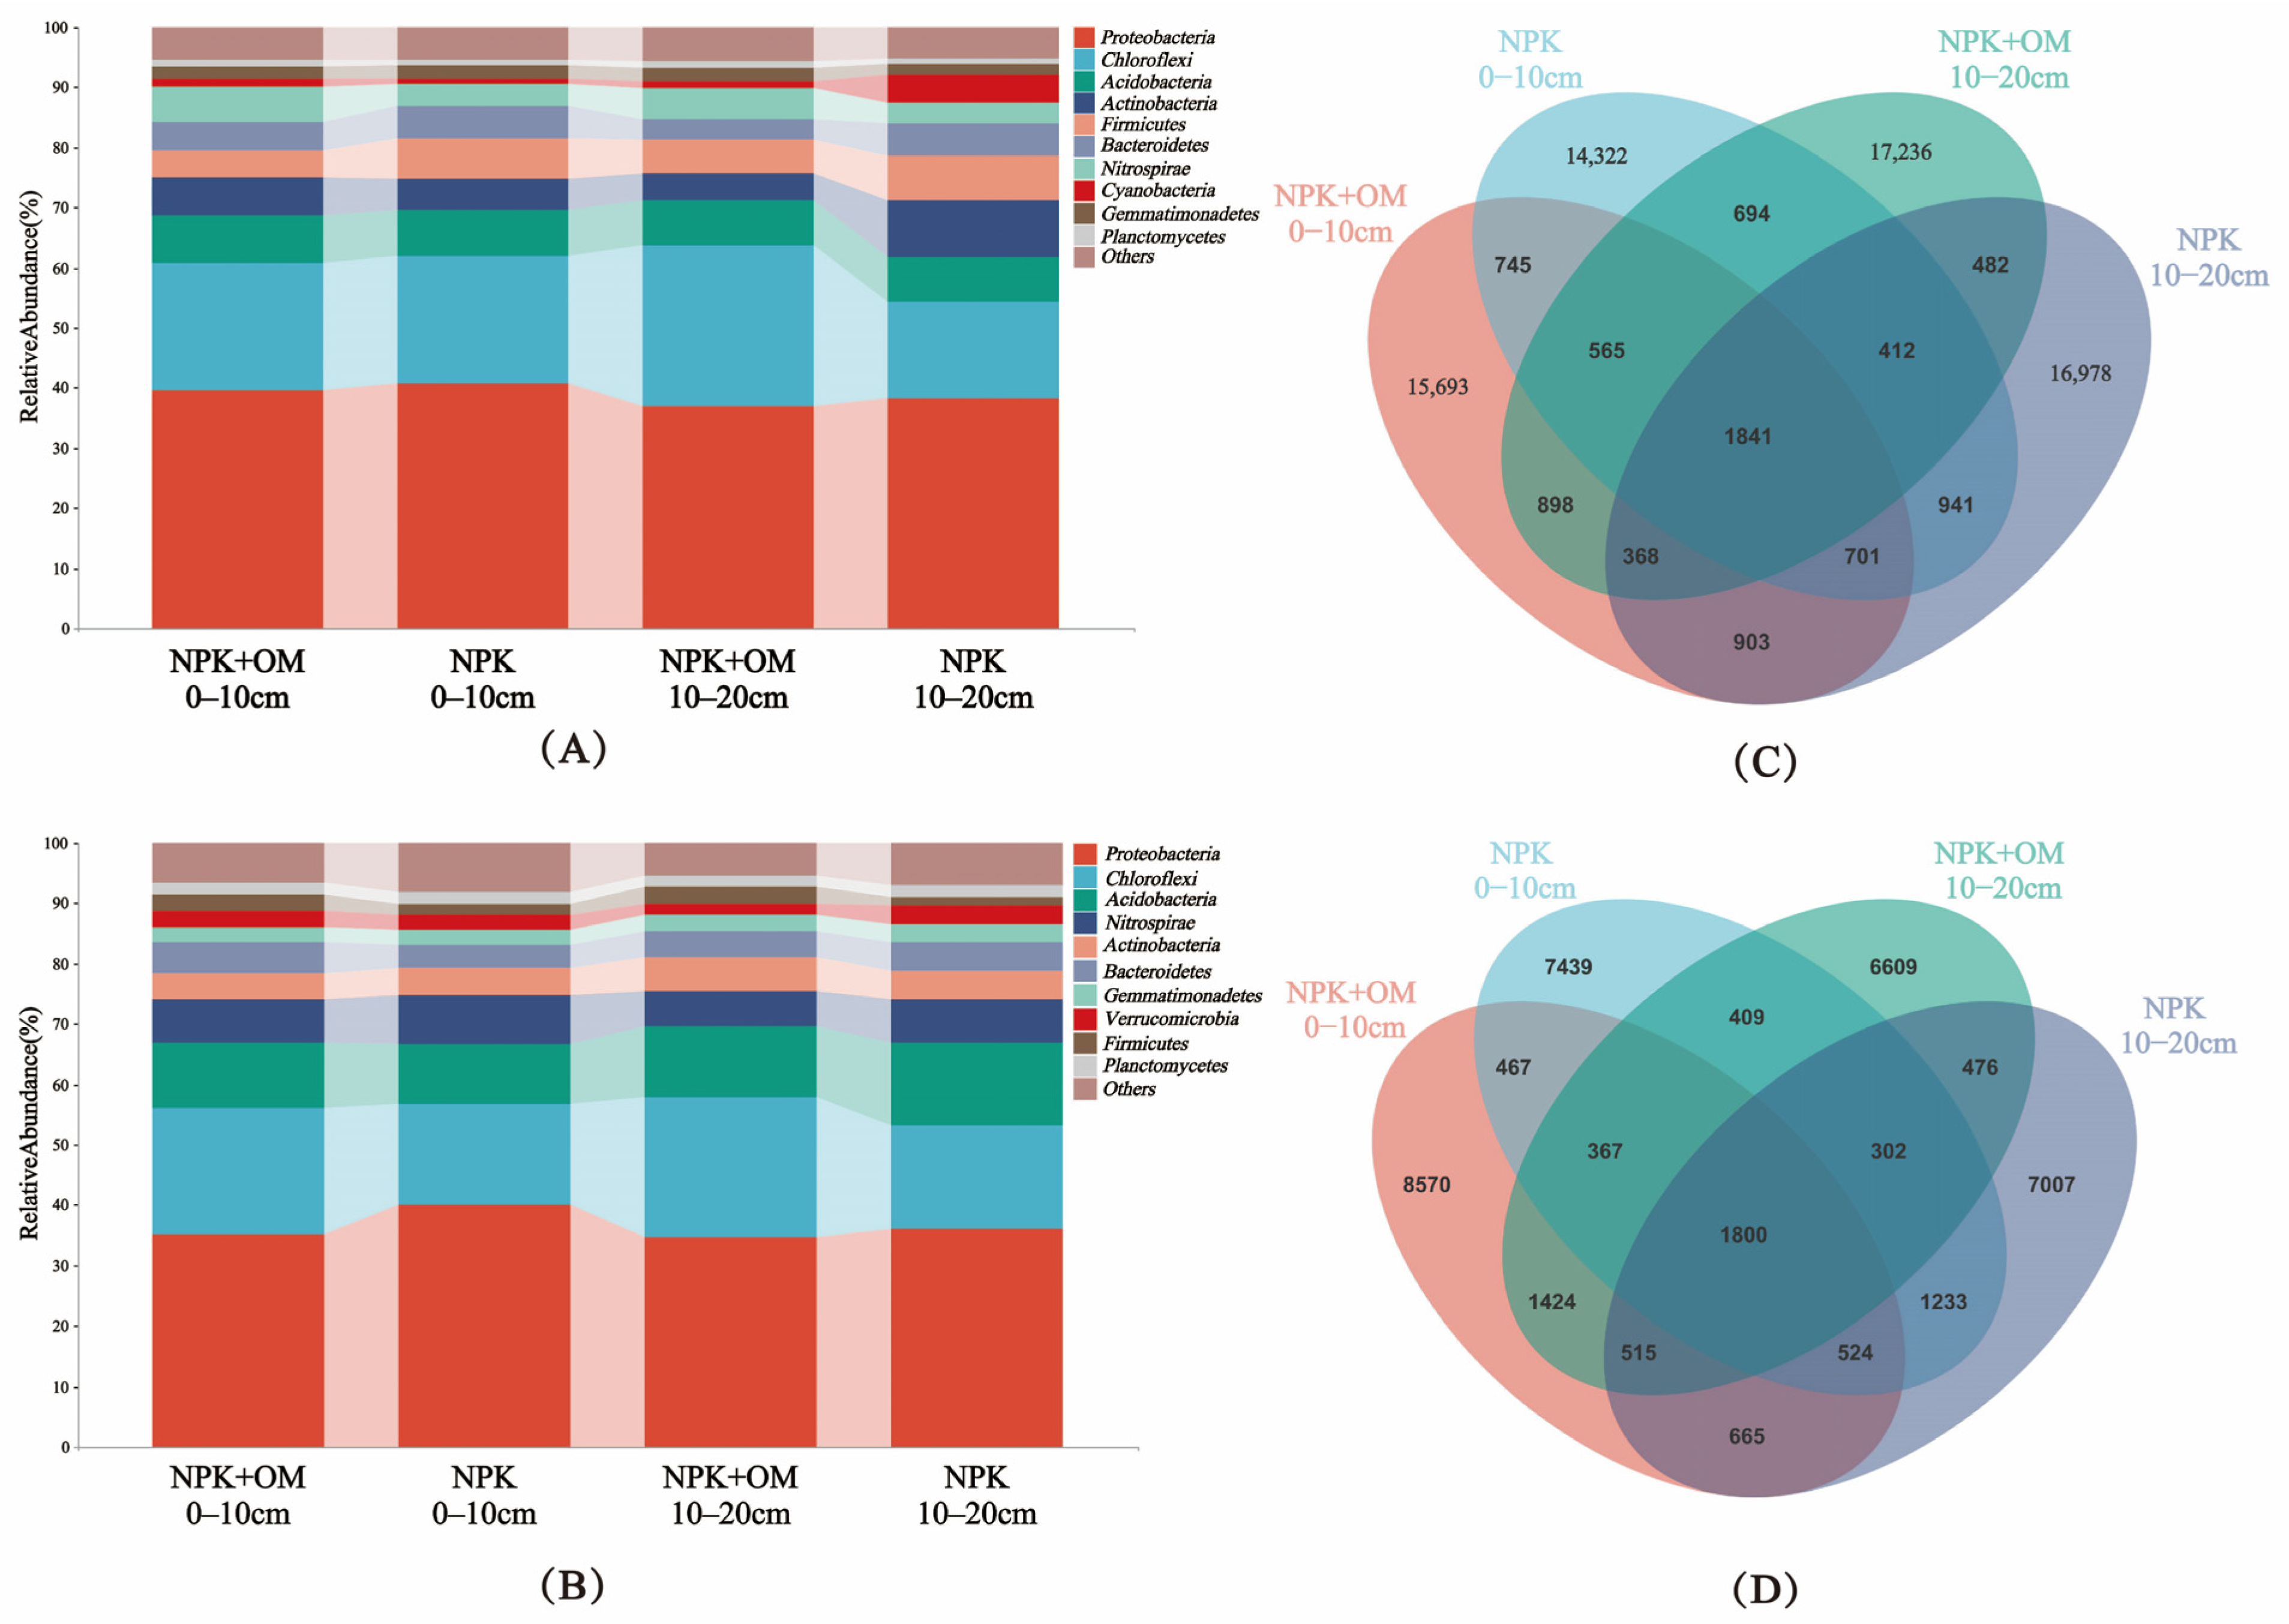
The effects of the organic matter addition on the relative abundance of bacteria in the different soil layers in April and July were analyzed at the phylum level, as shown in Figure 5A–D. The community structure distributions represented by operational taxonomic units (OTUs) and at the phylum level in different samples are shown in Figure 5A,B.

Figure 5.
Effects of organic matter addition on the relative abundance of bacteria in different soil layers. (A,B) represent the relative abundance of bacteria at the phylum level in April and July 2022. (C,D) represent the total ASVs (amplicon sequence variants) and shared ASVs in organic matter addition in April and July 2022.
In April, the top 10 most abundant phyla of soil bacteria were Proteobacteria, Chloroflexi, Acidobacteria, Actinobacteria, Firmicutes, Bacteroidetes, Nitrospirae, Cyanobacteria, Gemmatimonadetes, and Planctomycetes, showing relative abundance ranges of 36.95–40.68%, 15.93–26.83%, 7.28–8.05%, 4.64–9.56%, 4.48–7.40%, 3.42–5.53%, 3.31–5.92%, 1.14–4.88%, 0.92–1.29%, and 1.72–2.27%, respectively (Figure 5A). In July, the top 10 most abundant phyla were Proteobacteria, Chloroflexi, Acidobacteria, Nitrospirae, Actinobacteria, Bacteroidetes, Gemmatimonadetes, Verrucomicrobia, Firmicutes, and Planctomycetes, showing relative abundance ranges of 34.62–40.03%, 16.74–23.19%, 9.97–13.79%, 5.84–7.96%, 4.39–5.60%, 3.90–5.19%, 2.35–2.90%, 1.81–3.13%, 1.73–2.99%, and 1.91–2.11%, respectively (Figure 5B).
The clustering of the Valid Tags from all samples at a 97% similarity level resulted in a difference in the ASV distribution between the NPK+OM and NPK treatment scenarios (Figure 5C,D). The Venn diagram of shared ASVs (amplicon sequence variants) among soil bacteria shows that compared to NPK, the number of OTUs (operational taxonomic units) in the 0–10 cm soil layer increased by 1371 and 1131 for NPK+OM in April and July, respectively. This finding demonstrates that NPK+OM can effectively enhance soil bacterial diversity. The difference in bacterial diversity between April and July samples is due to the approximately 4-month period of winter dormancy before April and the soil sampling in July following the early-season rice harvest.
3.3.3. Bacterial Compositions and Functions
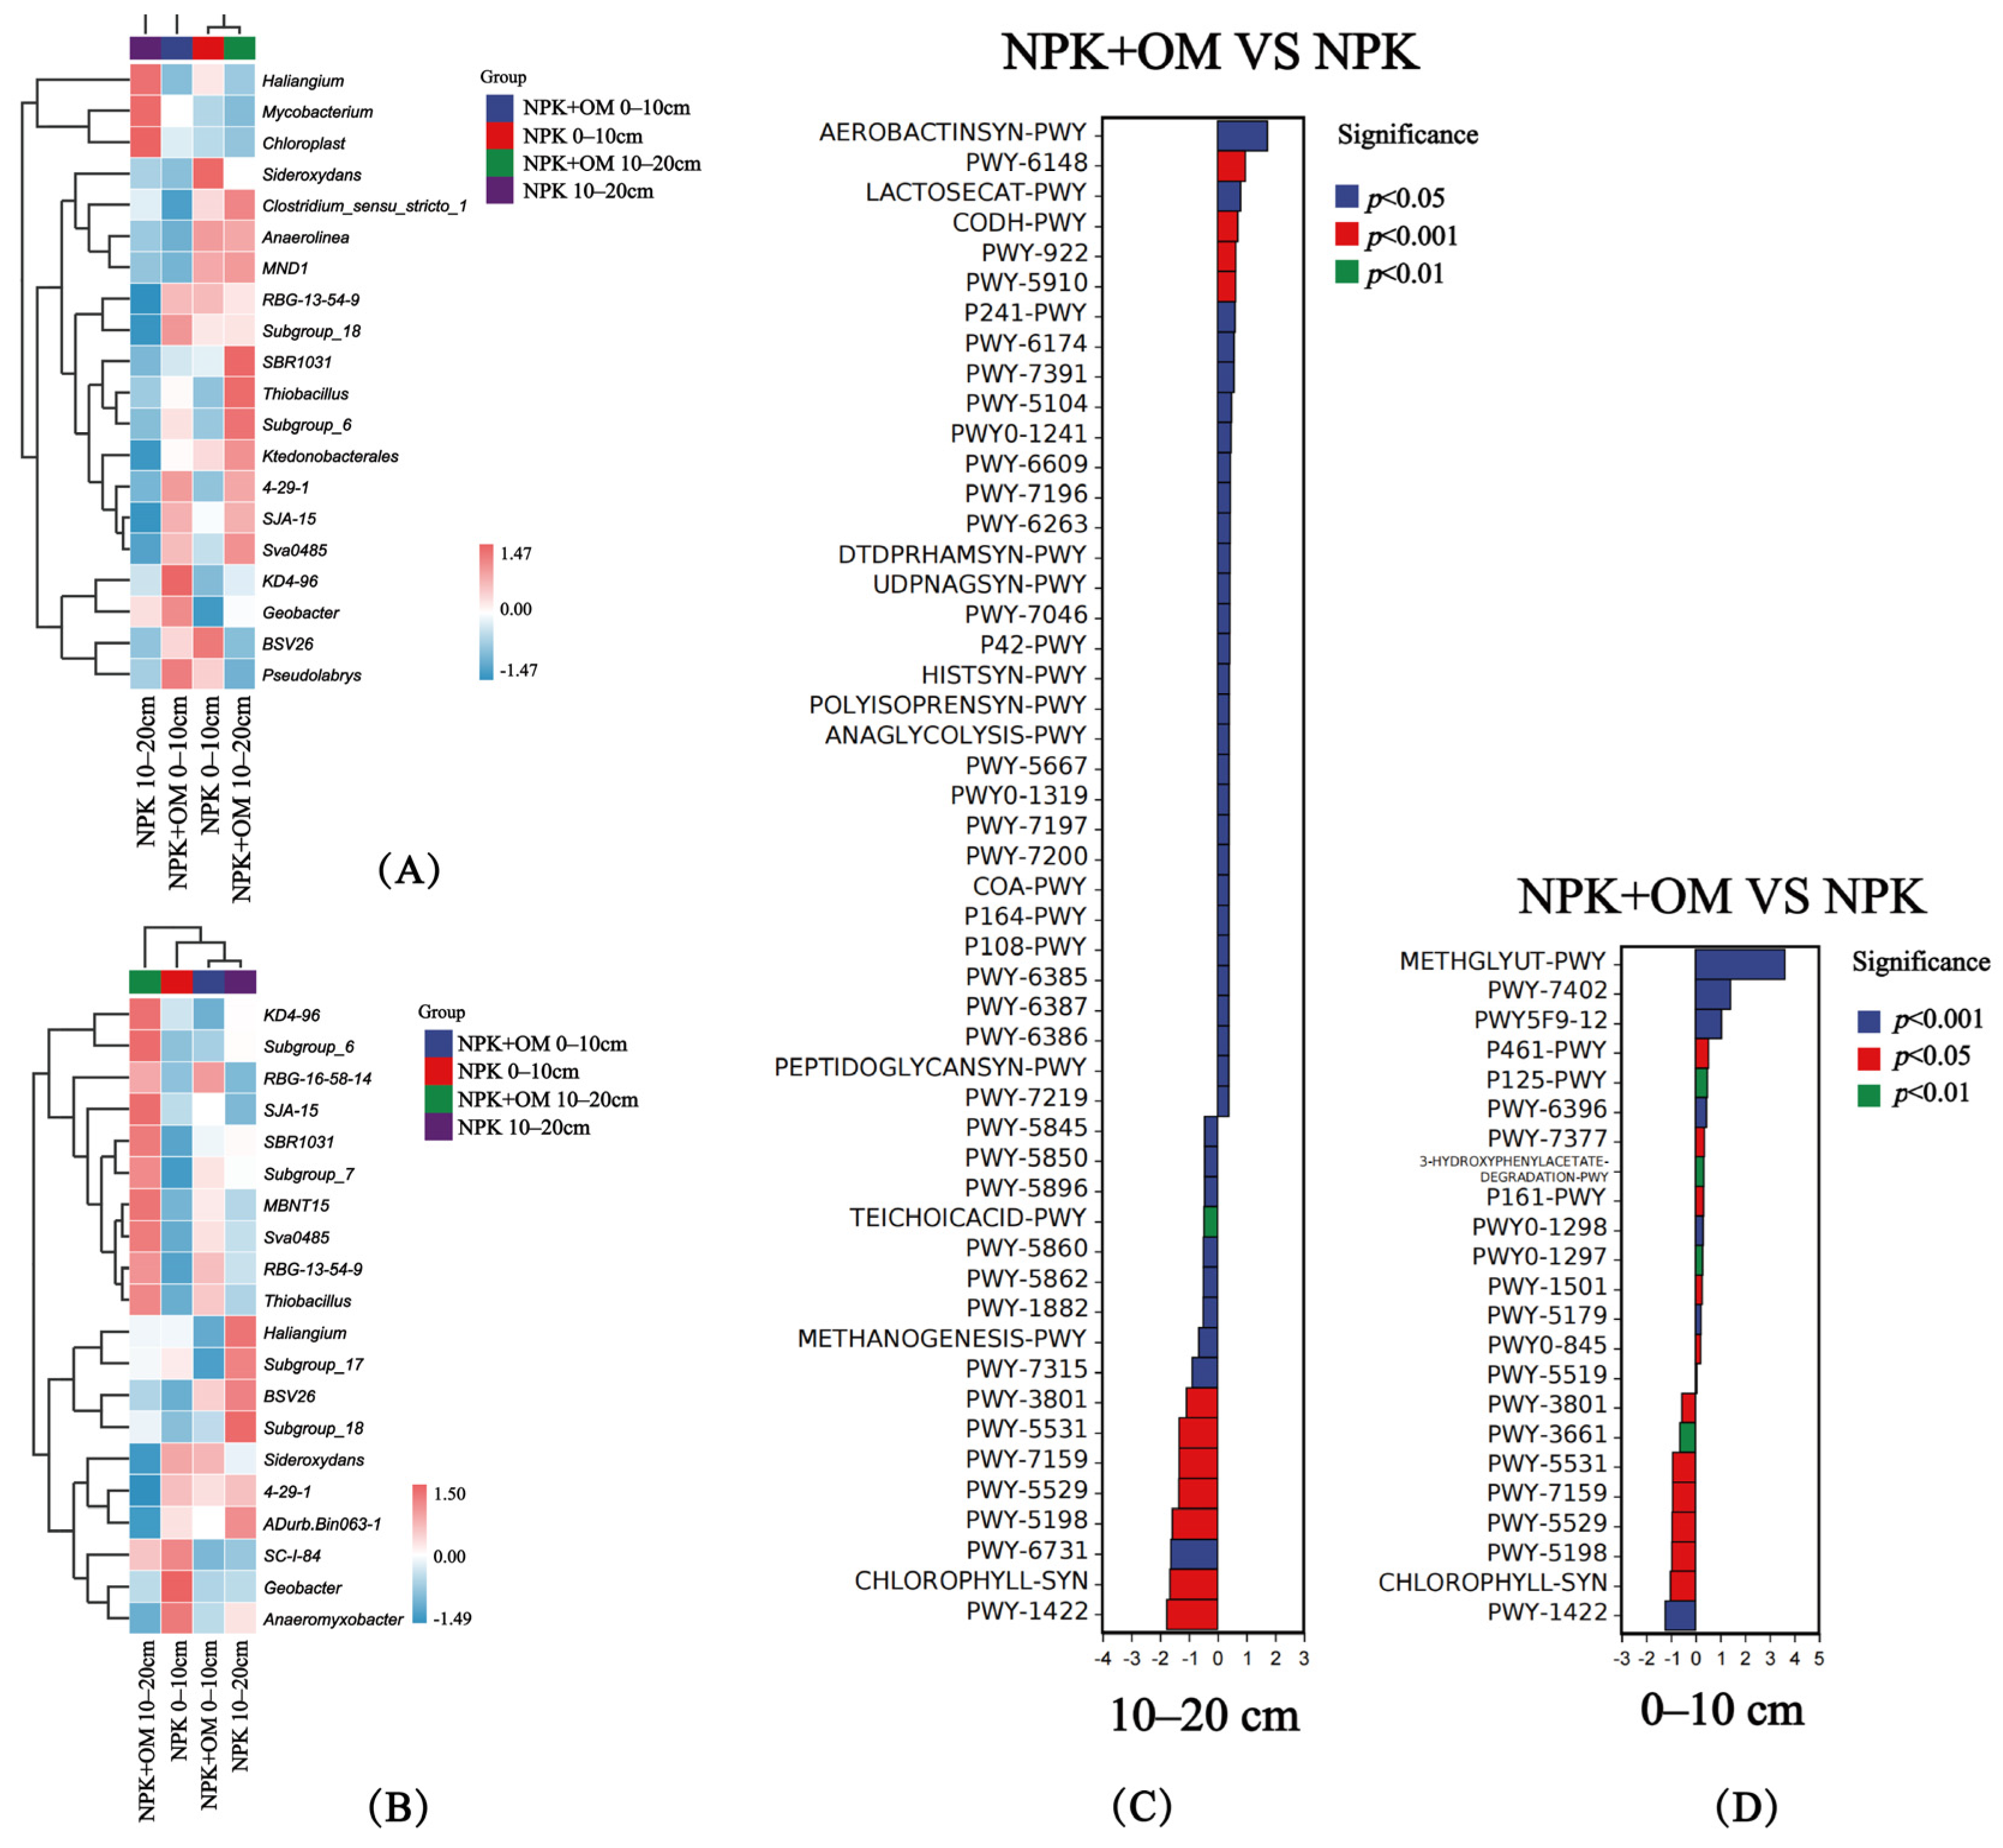
The results revealed significant differences in the soil bacteria at the genus level in April between the soil layers and treatments (Figure 6A). In the 0–10 cm soil layer, the abundances of RBG-13-54-9, Subgroup_18, 4-29-1, SJA-15, Sva0485, KD4-96, Geobacter, BSV26, and Pseudolabrys genera were upregulated, while those of Sideroxydans, Clostridium_sensu_stricto_1, Anaerolinea, and MND1 were downregulated, in the NPK+OM treatment compared to the NPK treatment. In the 10–20 cm soil layer, the abundances of Clostridium_sensu_stricto_1, Anaerolinea, MND1, RBG-13-54-9, SBR1031, Thiobacillus, Subgroup_6, Ktedonobacterales, 4-29-1, SJA-15, and Sva0485 were upregulated, while those of Haliangium, Mycobacterium, and Chloroplast genera were downregulated, in the NPK+OM treatment compared to the NPK treatment. Significant differences were also observed in soil bacteria at the genus level in July between the soil layers and treatments (Figure 6B). The abundances of RBG-16-58-14, Subgroup_7, MBNT15, Sva0485, RBG-13-54-9, and Thiobacillus were upregulated, while those of SC-I-84, Geobacter, and Anaeromyxobacter were downregulated, in the NPK+OM treatment compared to the NPK treatment. In the 10–20 cm soil layer, the abundances of KD4-96, Subgroup_6, RBG-16-58-14, SJA-15, SBR1031, Subgroup_7, MBNT15, Sva0485, RBG-13-54-9, and Thiobacillus genera were upregulated, while those of Haliangium, Subgroup_17, BSV26, Subgroup_18, Sideroxydans, 4-29-1, ADurb.Bin063-1, and Anaeromyxobacter were downregulated, in the NPK+OM treatment compared to the NPK treatment.
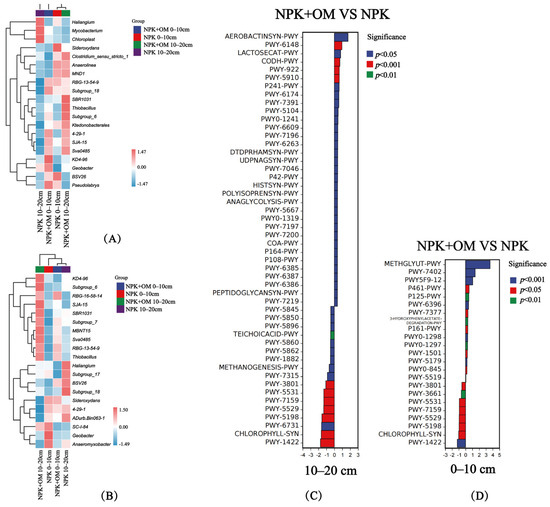
Figure 6.
Effects of organic matter addition on the species composition and metabolic pathway differences at the bacterial genus level. (A,B) represent the heatmap of organic matter addition on the species composition at the bacterial genus level in April and July 2022. (C,D) represent the effects of organic matter addition on the differences in bacterial metabolic pathways. Positive values of logFC indicate up-regulation of NPK+OM compared to NPK, while negative values indicate down-regulation. The Y-axis represents different pathway labels. The legend color indicates the significance level.
3.4. Relationships of Soil Bacterial Functions with the C Contents and Emissions
The NPK+OM treatment significantly upregulated the AEROBACTINSYN-PWY, PWY-6148, LACTOSECAT-PWY, and CODH-PWY pathways in the 10–20 cm soil layer in April 2022 compared to the NPK treatment (Figure 6C), which are associated with aerobactin biosynthesis, tetrahydromethanopterin biosynthesis, lactose and galactose degradation I, and reductive acetyl coenzyme A pathway, respectively. In addition, NPK+OM significantly downregulated the PWY-6731, CHLOROPHYLL-SYN, and PWY-1422 pathways associated with starch degradation III, chlorophyllide a biosynthesis I (aerobic and light-dependent), and vitamin E biosynthesis (tocopherols), respectively. On the other hand, compared with NPK, NPK+OM significantly upregulated the METHGLYUT-PWY, PWY-7402, PWY5F9-12, and P461-PWY pathways in the 0–10 cm soil layer in April (Figure 6D), which are associated with the methylglyoxal degradation superpathway, benzoate fermentation to acetate and cyclohexane carboxylate, biphenyl degradation, and hexitol fermentation to lactate, formate, ethanol, and acetate, respectively. At the same time, NPK+OM significantly downregulated the PWY-5531, PWY-7159, PWY-5529, CHLOROPHYLL-SYN, and PWY-1422 pathways, associated with chlorophyllide a biosynthesis II (anaerobic), chlorophyllide a biosynthesis III (aerobic and light-independent), the superpathway of bacteriochlorophyll a biosynthesis, chlorophyllide a biosynthesis I (aerobic and light-dependent), and vitamin E biosynthesis (tocopherols), respectively.
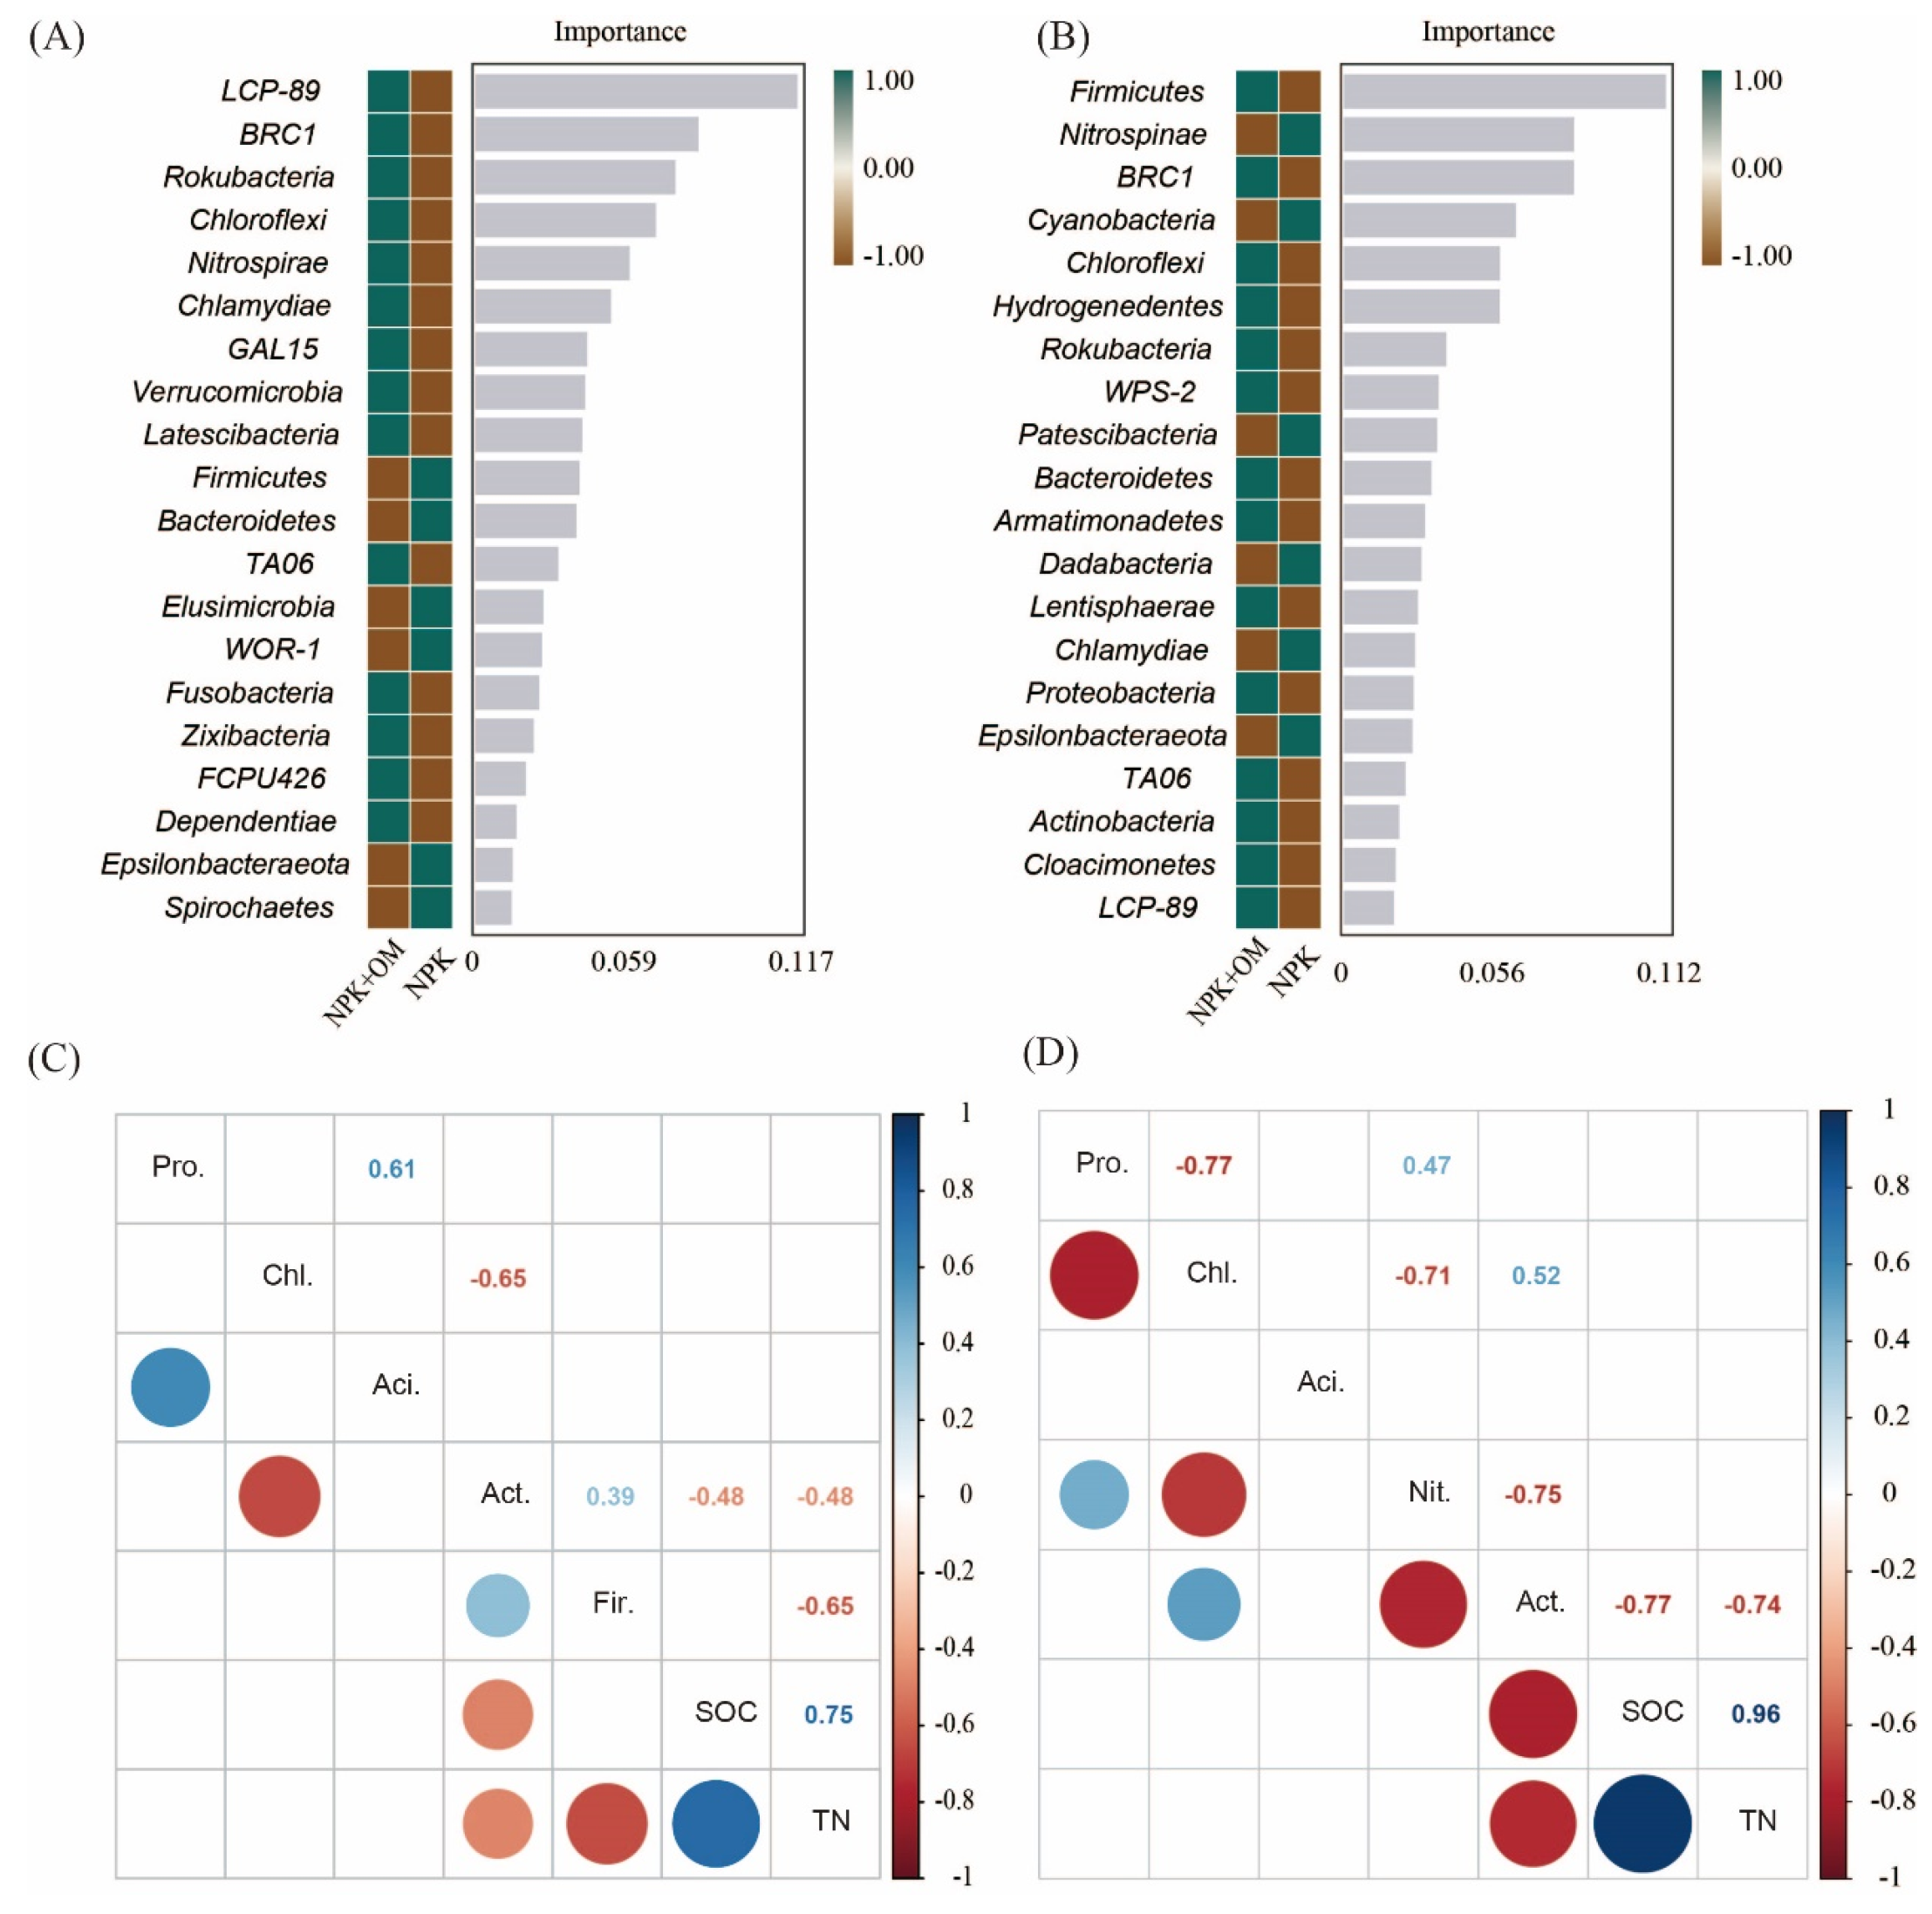
The relative importance of the soil bacteria at the phylum level under the NPK and NPK+OM treatment was assessed in this study using the Random Forest algorithm. According to the obtained results, LCP-89, BRC1, Rokubacteria, and Chloroflexi were the most important soil bacteria under the NPK+OM treatment scenario in April, as well as Firmicutes, Nitrospinae, BRC1, Cyanobacteria, and Chloroflexi in July (Figure 7). Additionally, among the top abundant bacteria, the soil Actinobacteria abundances were negatively correlated with the SOC contents in April and July.

Figure 7.
Important soil bacteria at phylum level and the relation of top abundant bacteria with SOC content. The (A,B) represent the important bacterial phylum between NPK and NPK+OM in the sampling seasons of April and July, respectively. The (C,D) represent the relation of top five phylum of bacteria to SOC content in the sampling seasons of April and July, respectively.
4. Discussion
4.1. SOC and CO2 Fluxes
Our results showed that NPK+OM significantly increased rice yields and reduced CO2 fluxes based on long-term observation for 6 years. These findings indicate that the addition of organic matter can significantly increase SOC accumulation, which might be due to two main reasons. Firstly, the addition of organic matter in paddy fields can increase the C/N ratios, slowing down the microbial decomposition and availability of soil nutrients and, consequently, reducing the CO2 fluxes [35]. Secondly, the addition of organic matter might affect the compositions and functions of soil bacteria in paddy fields, promoting the fixation of atmospheric CO2 by some genera (e.g., Geobacter and Thiobacillus) [36,37], thereby increasing the SOC contents. Besides the organic matter-derived C inputs, the increased rice yields under the NPK+OM treatment might also increase the C inputs derived from rice straw.
4.2. Soil Microbial Diversity and Abundance
The alpha-diversity indices, namely Chao1 and Shannon, reflecting soil microbial diversity, were influenced by the addition of organic matter. The addition of organic matter in the 0–10 cm soil layer significantly increased the bacterial diversity and abundance, as indicated by significant differences in the Chao1 (p < 0.01) and Shannon (p < 0.05) indices between the treatment scenarios. The assessment of microbial β-diversity by the NMDS analysis demonstrated the great negative effects of the organic matter addition on the microbial compositions and structures. In addition, the Venn diagram displayed significant differences in the number of bacterial OTUs in the 0–10 cm soil layer.
The heatmap of bacterial species abundance demonstrated that the organic matter addition altered the bacterial species compositions at the genus level, affecting the metabolic and functional properties of the soil bacterial community. This might be attributed to the changes in the C/N ratios caused by the organic matter addition, which slows down the microbial utilization of the fertilizer [38]. The utilization of more recalcitrant carbon sources led to gradual changes in the bacterial compositions and functions in soils [39]. On the other hand, changes in the compositions and functions of the soil bacteria also influenced the physicochemical properties of the soil.
4.3. Relationships of the Soil Microbial Composition with the SOC Contents and C Fluxes
The increase in the SOC contents in the NPK+OM treatment scenario was mainly attributed to the addition of organic matter. In addition, the organic matter addition enhanced the diversity and abundance of soil bacteria and altered the bacterial species compositions and functions to some extent [18]. Indeed, LCP-89 was upregulated in April and July in the NPK+OM treatment, making it the most influenced soil bacteria by the organic matter addition. According to a previous study, LCP-89 may contribute to carbon fixation and nutrient cycling in deep-sea sediments of the northern South China Sea [40]. However, few studies have focused on the LCP-89 functions in soils. Additionally, we found that abundance of Actinobacteria was negatively correlated with SOC contents. The abundance of Actinobacteria was associated with the mineralization SOC mostly from recalcitrant compounds [41], such as phenol-like substances [42]. Ref. [43] showed an increase in the abundance of Actinobacteria following biochar addition, which might be due to their ability to degrade aromatic components and, consequently, result in the decomposition of SOC through the production of extracellular enzymes.
We also observed that the organic matter addition significantly upregulated the degradation pathways of formaldehyde and biphenyl, reducing their toxic effects on soil bacteria [44]. On the other hand, the organic matter addition increased the abundance of Thiobacillus, Geobacter, Anaerolinea, and Ktedonobacterales in the soil. These genera may assimilate C fluxes through photosynthesis. The different proportions of the available C sources also led to changes in the microbial community compositions. At the genus level, there were significant changes in the soil bacterial community, accompanied by an upregulation of the synthesis of various organic compounds, contributing to the increase in the SOC contents to some extent (Figure 6C,D).
5. Implications and Limitations
According to the findings observed over multiple years, the fragrant rice yields increased by 6.68 to 32.35%, while the SOC contents at the rice harvest increased in the 0–10 cm soil layer and the CO2 fluxes reduced by 38.70 to 118.59%, following the organic matter addition. Therefore, our results confirm the economic and ecological benefits of chemical fertilizers combined with the applications of organic matter or organic fertilizers. Moreover, the costs of fertilizers for fragrant rice production under the NPK and NPK+OM treatment scenarios were almost similar, which were 1573 and 1619 RMB·t−1, respectively. Therefore, the applications of organic matter or organic fertilizers are recommended for rice production in South China. However, the present study has some potential limitations. Previous studies have indicated that greenhouse gas emissions, such as carbon dioxide (CO2), methane (CH4), and nitrous oxide (N2O), are associated with rice production under different conditions of drought or irrigation [45,46]. In China, the prevailing rice field management practice is still flooded irrigation, which promotes methane emissions as an important greenhouse gas [47]. Although we only measured the CO2 fluxes in non-flooded paddy soil, without considering CH4 emissions, this could be considered a potential limitation of our study. The CO2 flux measurements under non-flooded conditions allowed for comparisons between in-situ and ex-situ carbon emissions, reflecting soil carbon stability and quality. Additionally, the assessment of soil bacterial sequences was conducted in two sampling seasons, which may not fully capture the seasonal variations in soil bacterial diversity. Therefore, long-term investigation studies are necessary to examine the effects of agricultural management practices on soil microbial properties.
6. Conclusions
The results revealed an increase in the SOC content in the 10–20 cm soil layer by 6.51% following six years of organic matter addition. In contrast to our hypothesis, the organic matter addition significantly reduced the CO2 fluxes, which might be related to the soil bacterial compositions and their metabolic pathways. In addition, the organic matter addition enhanced the fixation of CO2 by various bacterial genera and the degradation and assimilation of multiple compounds, which, in turn, influenced the SOC accumulation and CO2 fluxes. In conclusion, combining organic matter with inorganic fertilizers can be an effective measure to mitigate the negative impacts of inorganic fertilizers alone on soil health, providing both economic and ecological benefits.
Author Contributions
Methodology, X.Y. and X.T.; Validation, X.Y. and X.Z.; Formal analysis, X.Z. and M.D.; Investigation, X.Y., X.Z., M.D., Y.Y., Q.X., H.L., J.P., Z.M. and S.P.; Resources, X.T.; Writing—original draft, X.Y.; Writing—review & editing, M.D., Y.Y., Q.X., H.L., J.P., Z.M., S.P. and X.T. All authors have read and agreed to the published version of the manuscript.
Funding
This study was supported by the National Natural Science Foundation of China (Grant No. 32201921), the Technology System of Modern Agricultural Industry in Guangdong (2020KJ105), and the Guangzhou Science and Technology Project (202103000075).
Data Availability Statement
The original contributions presented in the study are included in the article, further inquiries can be directed to the corresponding author.
Conflicts of Interest
The authors declare no conflicts of interest.
References
- Oldfield, E.E.; Bradford, M.A.; Wood, S.A. Global meta-analysis of the relationship between soil organic matter and crop yields. Soil 2019, 5, 15–32. [Google Scholar] [CrossRef]
- Minasny, B.; Malone, B.P.; McBratney, A.B.; Angers, D.A.; Arrouays, D.; Chambers, A.; Chaplot, V.; Chen, Z.-S.; Cheng, K.; Das, B.S. Soil carbon 4 per mille. Geoderma 2017, 292, 59–86. [Google Scholar] [CrossRef]
- Walker, W.S.; Gorelik, S.R.; Cook-Patton, S.C.; Baccini, A.; Farina, M.K.; Solvik, K.K.; Ellis, P.W.; Sanderman, J.; Houghton, R.A.; Leavitt, S.M. The global potential for increased storage of carbon on land. Proc. Natl. Acad. Sci. USA 2022, 119, e2111312119. [Google Scholar] [CrossRef]
- Tang, H.; Liu, Y.; Li, X.; Muhammad, A.; Huang, G. Carbon sequestration of cropland and paddy soils in China: Potential, driving factors, and mechanisms. Greenh. Gases Sci. Technol. 2019, 9, 872–885. [Google Scholar] [CrossRef]
- Liu, Y.; Ge, T.; van Groenigen, K.J.; Yang, Y.; Wang, P.; Cheng, K.; Zhu, Z.; Wang, J.; Li, Y.; Guggenberger, G. Rice paddy soils are a quantitatively important carbon store according to a global synthesis. Commun. Earth Environ. 2021, 2, 154. [Google Scholar] [CrossRef]
- Qi, J.-Y.; Yao, X.-B.; Duan, M.-Y.; Huang, X.-W.; Fan, M.-Y.; Yang, Y.; Luo, H.-W.; Tang, X.-R. Effects of contrasting tillage managements on the vertical distribution of plant-and microbial-derived carbon in rice paddy. Sci. Total Environ. 2023, 892, 164348. [Google Scholar] [CrossRef]
- Guo, L.; Zhao, S.; Song, Y.; Tang, M.; Li, H. Green finance, chemical fertilizer use and carbon emissions from agricultural production. Agriculture 2022, 12, 313. [Google Scholar] [CrossRef]
- Savci, S. Investigation of effect of chemical fertilizers on environment. APCBEE Proc. 2012, 1, 287–292. [Google Scholar] [CrossRef]
- Dan, W.; Qian, Y.; Zhang, J.-Z.; Shuang, W.; Chen, X.-L.; Zhang, X.-L.; Wei-Qun, L. Bacterial community structure and diversity in a black soil as affected by long-term fertilization. Pedosphere 2008, 18, 582–592. [Google Scholar]
- Bhatt, M.K.; Labanya, R.; Joshi, H.C. Influence of long-term chemical fertilizers and organic manures on soil fertility—A review. Univers. J. Agric. Res. 2019, 7, 177–188. [Google Scholar]
- Liu, E.; Yan, C.; Mei, X.; He, W.; Bing, S.H.; Ding, L.; Liu, Q.; Liu, S.; Fan, T. Long-term effect of chemical fertilizer, straw, and manure on soil chemical and biological properties in northwest China. Geoderma 2010, 158, 173–180. [Google Scholar] [CrossRef]
- Assefa, S.; Tadesse, S. The principal role of organic fertilizer on soil properties and agricultural productivity—A review. Agric. Res. Technol. Open Access J. 2019, 22, 556192. [Google Scholar] [CrossRef]
- Zhengchao, Z.; Zhuoting, G.; Zhouping, S.; Fuping, Z. Effects of long-term repeated mineral and organic fertilizer applications on soil organic carbon and total nitrogen in a semi-arid cropland. Eur. J. Agron. 2013, 45, 20–26. [Google Scholar] [CrossRef]
- Sharma, A.; Chetani, R. A review on the effect of organic and chemical fertilizers on plants. Int. J. Res. Appl. Sci. Eng. Technol. 2017, 5, 677–680. [Google Scholar] [CrossRef]
- Giraud, G. The world market of fragrant rice, main issues and perspectives. Int. Food Agribus. Manage. Rev. 2013, 16, 1–20. [Google Scholar]
- Ruan, S.; Luo, H.; Wu, F.; He, L.; Lai, R.; Tang, X. Organic cultivation induced regulation in yield formation, grain quality attributes, and volatile organic compounds of fragrant rice. Food Chem. 2023, 405, 134845. [Google Scholar] [CrossRef]
- Qi, J.-Y.; Yao, X.-B.; Lu, J.; He, L.-X.; Cao, J.-L.; Kan, Z.-R.; Wang, X.; Pan, S.-G.; Tang, X.-R. A 40% paddy surface soil organic carbon increase after 5-year no-tillage is linked with shifts in soil bacterial composition and functions. Sci. Total Environ. 2023, 859, 160206. [Google Scholar] [CrossRef]
- Fontaine, S.; Mariotti, A.; Abbadie, L. The priming effect of organic matter: A question of microbial competition? Soil Biol. Biochem. 2003, 35, 837–843. [Google Scholar] [CrossRef]
- Schmidt, M.W.; Torn, M.S.; Abiven, S.; Dittmar, T.; Guggenberger, G.; Janssens, I.A.; Kleber, M.; Kögel-Knabner, I.; Lehmann, J.; Manning, D.A. Persistence of soil organic matter as an ecosystem property. Nature 2011, 478, 49–56. [Google Scholar] [CrossRef]
- Tian, J.; Lou, Y.; Gao, Y.; Fang, H.; Liu, S.; Xu, M.; Blagodatskaya, E.; Kuzyakov, Y. Response of soil organic matter fractions and composition of microbial community to long-term organic and mineral fertilization. Biol. Fertil. Soils 2017, 53, 523–532. [Google Scholar] [CrossRef]
- Han, Y.; Zhang, Z.; Li, T.; Chen, P.; Nie, T.; Zhang, Z.; Du, S. Straw return alleviates the greenhouse effect of paddy fields by increasing soil organic carbon sequestration under water-saving irrigation. Agric. Water Manag. 2023, 287, 108434. [Google Scholar] [CrossRef]
- Shi, X.; Yu, D.; Xu, S.; Warner, E.; Wang, H.; Sun, W.; Zhao, Y.; Gong, Z. Cross-reference for relating Genetic Soil Classification of China with WRB at different scales. Geoderma 2010, 155, 344–350. [Google Scholar] [CrossRef]
- Olsen, S.R.; Cole, C.V.; Watanabe, F.S.; Dean, L.A. Estimation of Available Phosphorus in Soils by Extraction with Sodium Bicarbonate (No. 939); Department of Agriculture Circular: Washington, DC, USA, 1954. [Google Scholar]
- Peverill, K.I. Soil Analysis: An Interpretation Manual, Reprinted Edition; CSIRO Publishing: Melbourne, Australia, 2005. [Google Scholar]
- Kan, Z.-R.; Liu, Q.-Y.; Virk, A.L.; He, C.; Qi, J.-Y.; Dang, Y.P.; Zhao, X.; Zhang, H.-L. Effects of experiment duration on carbon mineralization and accumulation under no-till. Soil Tillage Res. 2021, 209, 104939. [Google Scholar] [CrossRef]
- Qi, J.-Y.; Jing, Z.-H.; He, C.; Liu, Q.-Y.; Wang, X.; Kan, Z.-R.; Zhao, X.; Xiao, X.-P.; Zhang, H.-L. Effects of tillage management on soil carbon decomposition and its relationship with soil chemistry properties in rice paddy fields. J. Environ. Manag. 2021, 279, 111595. [Google Scholar] [CrossRef]
- Sundberg, C.; Al-Soud, W.A.; Larsson, M.; Alm, E.; Yekta, S.S.; Svensson, B.H.; Sørensen, S.J.; Karlsson, A. 454 pyrosequencing analyses of bacterial and archaeal richness in 21 full-scale biogas digesters. FEMS Microbiol. Ecol. 2013, 85, 612–626. [Google Scholar] [CrossRef]
- Caporaso, J.G.; Lauber, C.L.; Walters, W.A.; Berg-Lyons, D.; Lozupone, C.A.; Turnbaugh, P.J.; Fierer, N.; Knight, R. Global patterns of 16S rRNA diversity at a depth of millions of sequences per sample. Proc. Natl. Acad. Sci. USA 2011, 108, 4516–4522. [Google Scholar] [CrossRef]
- Bolyen, E.; Rideout, J.R.; Dillon, M.R.; Bokulich, N.A.; Abnet, C.C.; Al-Ghalith, G.A.; Alexander, H.; Alm, E.J.; Arumugam, M.; Asnicar, F. Reproducible, interactive, scalable and extensible microbiome data science using QIIME 2. Nat. Biotechnol. 2019, 37, 852–857. [Google Scholar] [CrossRef]
- Martin, M. Cutadapt removes adapter sequences from high-throughput sequencing reads. EMBnet. J. 2011, 17, 10–12. [Google Scholar] [CrossRef]
- Callahan, B.J.; McMurdie, P.J.; Rosen, M.J.; Han, A.W.; Johnson, A.J.A.; Holmes, S.P. DADA2: High-resolution sample inference from Illumina amplicon data. Nat. Methods 2016, 13, 581–583. [Google Scholar] [CrossRef] [PubMed]
- Katoh, K.; Misawa, K.; Kuma, K.I.; Miyata, T. MAFFT: A novel method for rapid multiple sequence alignment based on fast Fourier transform. Nucleic Acids Res. 2002, 30, 3059–3066. [Google Scholar] [CrossRef] [PubMed]
- Chao, A. Nonparametric estimation of the number of classes in a population. Scand. J. Stat. 1984, 11, 265–270. [Google Scholar]
- Shannon, C.E. A mathematical theory of communication. Bell Syst. Tech. J. 1948, 27, 379–423. [Google Scholar] [CrossRef]
- Khan, K.S.; Mack, R.; Castillo, X.; Kaiser, M.; Joergensen, R.G. Microbial biomass, fungal and bacterial residues, and their relationships to the soil organic matter C/N/P/S ratios. Geoderma 2016, 271, 115–123. [Google Scholar] [CrossRef]
- Zhang, T.; Shi, X.-C.; Ding, R.; Xu, K.; Tremblay, P.-L. The hidden chemolithoautotrophic metabolism of Geobacter sulfurreducens uncovered by adaptation to formate. ISME J. 2020, 14, 2078–2089. [Google Scholar] [CrossRef]
- Choe, H.; Joo, J.C.; Cho, D.H.; Kim, M.H.; Lee, S.H.; Jung, K.D.; Kim, Y.H. Efficient CO2-reducing activity of NAD-dependent formate dehydrogenase from Thiobacillus sp. KNK65MA for formate production from CO2 gas. PLoS ONE 2014, 9, e103111. [Google Scholar] [CrossRef] [PubMed]
- Huang, Y.; Zou, J.; Zheng, X.; Wang, Y.; Xu, X. Nitrous oxide emissions as influenced by amendment of plant residues with different C: N ratios. Soil Biol. Biochem. 2004, 36, 973–981. [Google Scholar] [CrossRef]
- Perrin, E.; Ghini, V.; Giovannini, M.; Di Patti, F.; Cardazzo, B.; Carraro, L.; Fagorzi, C.; Turano, P.; Fani, R.; Fondi, M. Diauxie and co-utilization of carbon sources can coexist during bacterial growth in nutritionally complex environments. Nat. Commun. 2020, 11, 3135. [Google Scholar] [CrossRef] [PubMed]
- Huang, J.-M.; Baker, B.J.; Li, J.-T.; Wang, Y. New microbial lineages capable of carbon fixation and nutrient cycling in deep-sea sediments of the northern South China Sea. Appl. Environ. Microbiol. 2019, 85, e00523-19. [Google Scholar] [CrossRef] [PubMed]
- Blagodatskaya, E.; Kuzyakov, Y. Mechanisms of real and apparent priming effects and their dependence on soil microbial biomass and community structure: Critical review. Biol. Fertil. Soils 2008, 45, 115–131. [Google Scholar] [CrossRef]
- Ling, L.; Fu, Y.; Jeewani, P.H.; Tang, C.; Pan, S.; Reid, B.J.; Gunina, A.; Li, Y.; Li, Y.; Cai, Y. Organic matter chemistry and bacterial community structure regulate decomposition processes in post-fire forest soils. Soil Biol. Biochem. 2021, 160, 108311. [Google Scholar] [CrossRef]
- Bao, Y.; Dolfing, J.; Guo, Z.; Chen, R.; Wu, M.; Li, Z.; Lin, X.; Feng, Y. Important ecophysiological roles of non-dominant Actinobacteria in plant residue decomposition, especially in less fertile soils. Microbiome 2021, 9, 84. [Google Scholar] [CrossRef]
- Bazurto, J.V.; Nayak, D.D.; Ticak, T.; Davlieva, M.; Lee, J.A.; Hellenbrand, C.N.; Lambert, L.B.; Benski, O.J.; Quates, C.J.; Johnson, J.L. EfgA is a conserved formaldehyde sensor that leads to bacterial growth arrest in response to elevated formaldehyde. PLoS Biol. 2021, 19, e3001208. [Google Scholar] [CrossRef] [PubMed]
- Islam, S.M.M.; Gaihre, Y.K.; Islam, M.R.; Ahmed, M.N.; Akter, M.; Singh, U.; Sander, B.O. Mitigating greenhouse gas emissions from irrigated rice cultivation through improved fertilizer and water management. J. Environ. Manag. 2022, 307, 114520. [Google Scholar] [CrossRef] [PubMed]
- Li, L.; Li, F.; Dong, Y. Greenhouse Gas Emissions and Global Warming Potential in Double-Cropping Rice Fields as Influenced by Two Water-Saving Irrigation Modes in South China. J. Soil Sci. Plant Nutr. 2020, 20, 2617–2630. [Google Scholar] [CrossRef]
- He, G.; Wang, Z.; Cui, Z. Managing irrigation water for sustainable rice production in China. J. Clean. Prod. 2020, 245, 118928. [Google Scholar] [CrossRef]
Disclaimer/Publisher’s Note: The statements, opinions and data contained in all publications are solely those of the individual author(s) and contributor(s) and not of MDPI and/or the editor(s). MDPI and/or the editor(s) disclaim responsibility for any injury to people or property resulting from any ideas, methods, instructions or products referred to in the content. |
© 2024 by the authors. Licensee MDPI, Basel, Switzerland. This article is an open access article distributed under the terms and conditions of the Creative Commons Attribution (CC BY) license (https://creativecommons.org/licenses/by/4.0/).