Article

Effects of a Photovoltaic Plant on Microclimate and Crops’ Growth in a Mediterranean Area

1
Department of Agricultural Sciences, University of Naples Federico II, Via Università 100, 80055 Portici, Italy
2
Novamont SpA, Via G. Fauser 8, 28100 Novara, Italy
3
Department of Agricultural and Environmental Sciences, University of Milan, Via Celoria 2, 20133 Milan, Italy
4
Enel Green Power SpA, Innovation, Via A. Pisano 120, 56122 Pisa, Italy
*
Author to whom correspondence should be addressed.
Agronomy 2024, 14(3), 466; https://doi.org/10.3390/agronomy14030466
Submission received: 5 February 2024 / Revised: 23 February 2024 / Accepted: 26 February 2024 / Published: 27 February 2024
(This article belongs to the Section Soil and Plant Nutrition)

Abstract

:
The effects of the co-location of energy production from a photovoltaic (PV) plant and aromatic crops (thyme, oregano, and Greek mountain tea) in a hot and dry environment have been investigated in Enel Green Power PV plant located in Kourtesi (Greece). The study was aimed at evaluating the influence of the PV plant on microclimate, on soil temperature and water potential, and on the crops’ growth in a testing area (the corridors between two modules rows) compared to a full sunlight control area. The net radiation and of the wind speed recorded in the testing area showed a 44% and 38% reduction respectively, compared to the control area, while air temperature and relative humidity did not show any difference. Among crop/soil monitored parameters, cumulative reference evapotranspiration (ET0) and the average soil temperature were found 29% and 8% lower in the testing area, conversely the soil water potential (SWP) was 34% higher compared to control area. No significant differences in the plant growth have been detected between testing and control areas, except for oregano whose weight was higher in testing area. The results suggest that in hot and dry climatic conditions, the reduction of climatic stress could compensate the decrease of photosynthesis due to the shading effect of the PV modules, thus not damaging crops’ growth.

1. Introduction

Transition to renewable energy (RE) aimed at decarbonization for mitigating climate changes is now planned at international level [1,2]: RE capacity was 2800 GW in 2021, which represented 80% of all the new electricity capacity [3].
Although fully aligned with sustainable development principles [4], numerous researchers point out the potential conflict between renewable energy production and food crop cultivation for land use, which may deviate from core sustainability tenets [5,6]. Among the different technologies for RE, the higher increase in the last years was due to solar energy, whose land use is estimated in 1.5–2.0 million ha at global level [3,7].
In this framework, ground-mounted (standard) photovoltaic power plants (PVs) integrated with agricultural activities, here presented, have been proposed as a mutual beneficial solution that could match the needs of both energy and food production [8], enabling a more sustainable development of the photovoltaics.
Indeed, despite the recent diffusion of the new APVs (agro—photovoltaic plants) designs aimed at reducing the shading and the consequent impact on crop photosynthesis and growth, with PV structures above 4 m high [9,10], many standard PV plants (i.e., fixed configuration) are still worldwide operative. In Italy, as an example, in 2022 the 34% of PV were fixed type, covering around 16,000 ha [11]. In US, standard fixed PVs have been estimated to be 44% of total solar energy plants in 2012 [12]. Therefore, there is a wide interest to also integrate such PV plants with agricultural activities, and one of the prevailing perspectives is considered the co-location of energy and food production, such as cultivating crops in the corridors between the PV modules’ rows [13].
The crops’ selection is a key-factor for the success of an agrivoltaic system, by selecting shade tolerant crops and considering specific tailored solutions for each location, based on environmental, morphological, social and economic aspects. In particular, scarce water resources are a constraint for crop development in hot and dry areas [14]. This issue can be overcome with an APV system, in which a specific microclimate is generated. The reduction of the net solar radiation is the main impacted parameter, but also soil temperature, air temperature and humidity and wind speed are affected by variations [15,16], with effects on the water use efficiency and, subsequently, on water savings [17].
In a review of the state of the art on the effects on microclimate in APV systems [15], have reported that there are few agrivoltaic cases studies related to ground-mounted PV plants and, specifically, that there are only few data related to APV systems in arid climates.
Hassanpour et al. [18] have reported that ground-mounted PVs plants with a fixed structure 2.2 m high have reduced evapotranspiration in drylands or in areas with severe water stress. This reduction in water loss can alleviate drought conditions and enhance soil moisture, promoting plant growth and increasing biomass yield. Yue and colleagues [19] observed that in desert regions, both fixed PV structures standing 3 m high, and monoaxial tracker PV systems have led to warmer soil temperatures during winter and cooler temperatures in other seasons. They also noted an overall rise in soil moisture by an average of 11–15% compared to conditions with full sunlight exposure, suggesting that these effects could improve plant-soil agro-ecosystem in arid areas.
Therefore, in a perspective of climate changes and increased water shortage in many world areas, reducing water consumption thanks to the shading effect of PVs, could be crucial. Particularly in areas with arid climates and in drylands this could significantly contribute to improve yield stability and crop resilience to climate change [20].
The research reported in this study was addressed at measuring the impacts of a standard PV plant with fixed structure on the microclimate created between the PV modules’ rows in a Mediterranean area, characterized by hot and dry climatic conditions through the coexistence of PV modules and aromatic crops typical of the area. The crops have been grown in a testing and in a control area. This test is included within the massive experimental Agrivoltaic program launched by Enel Green Power in January 2021 and made up of nine demonstration tests in Europe (i.e., two in Greece, five in Spain, two in Italy) and one in Australia, aimed at investigating the coexistence of agro-zoological solutions in large standard PV plants with a holistic approach.

2. Materials and Methods
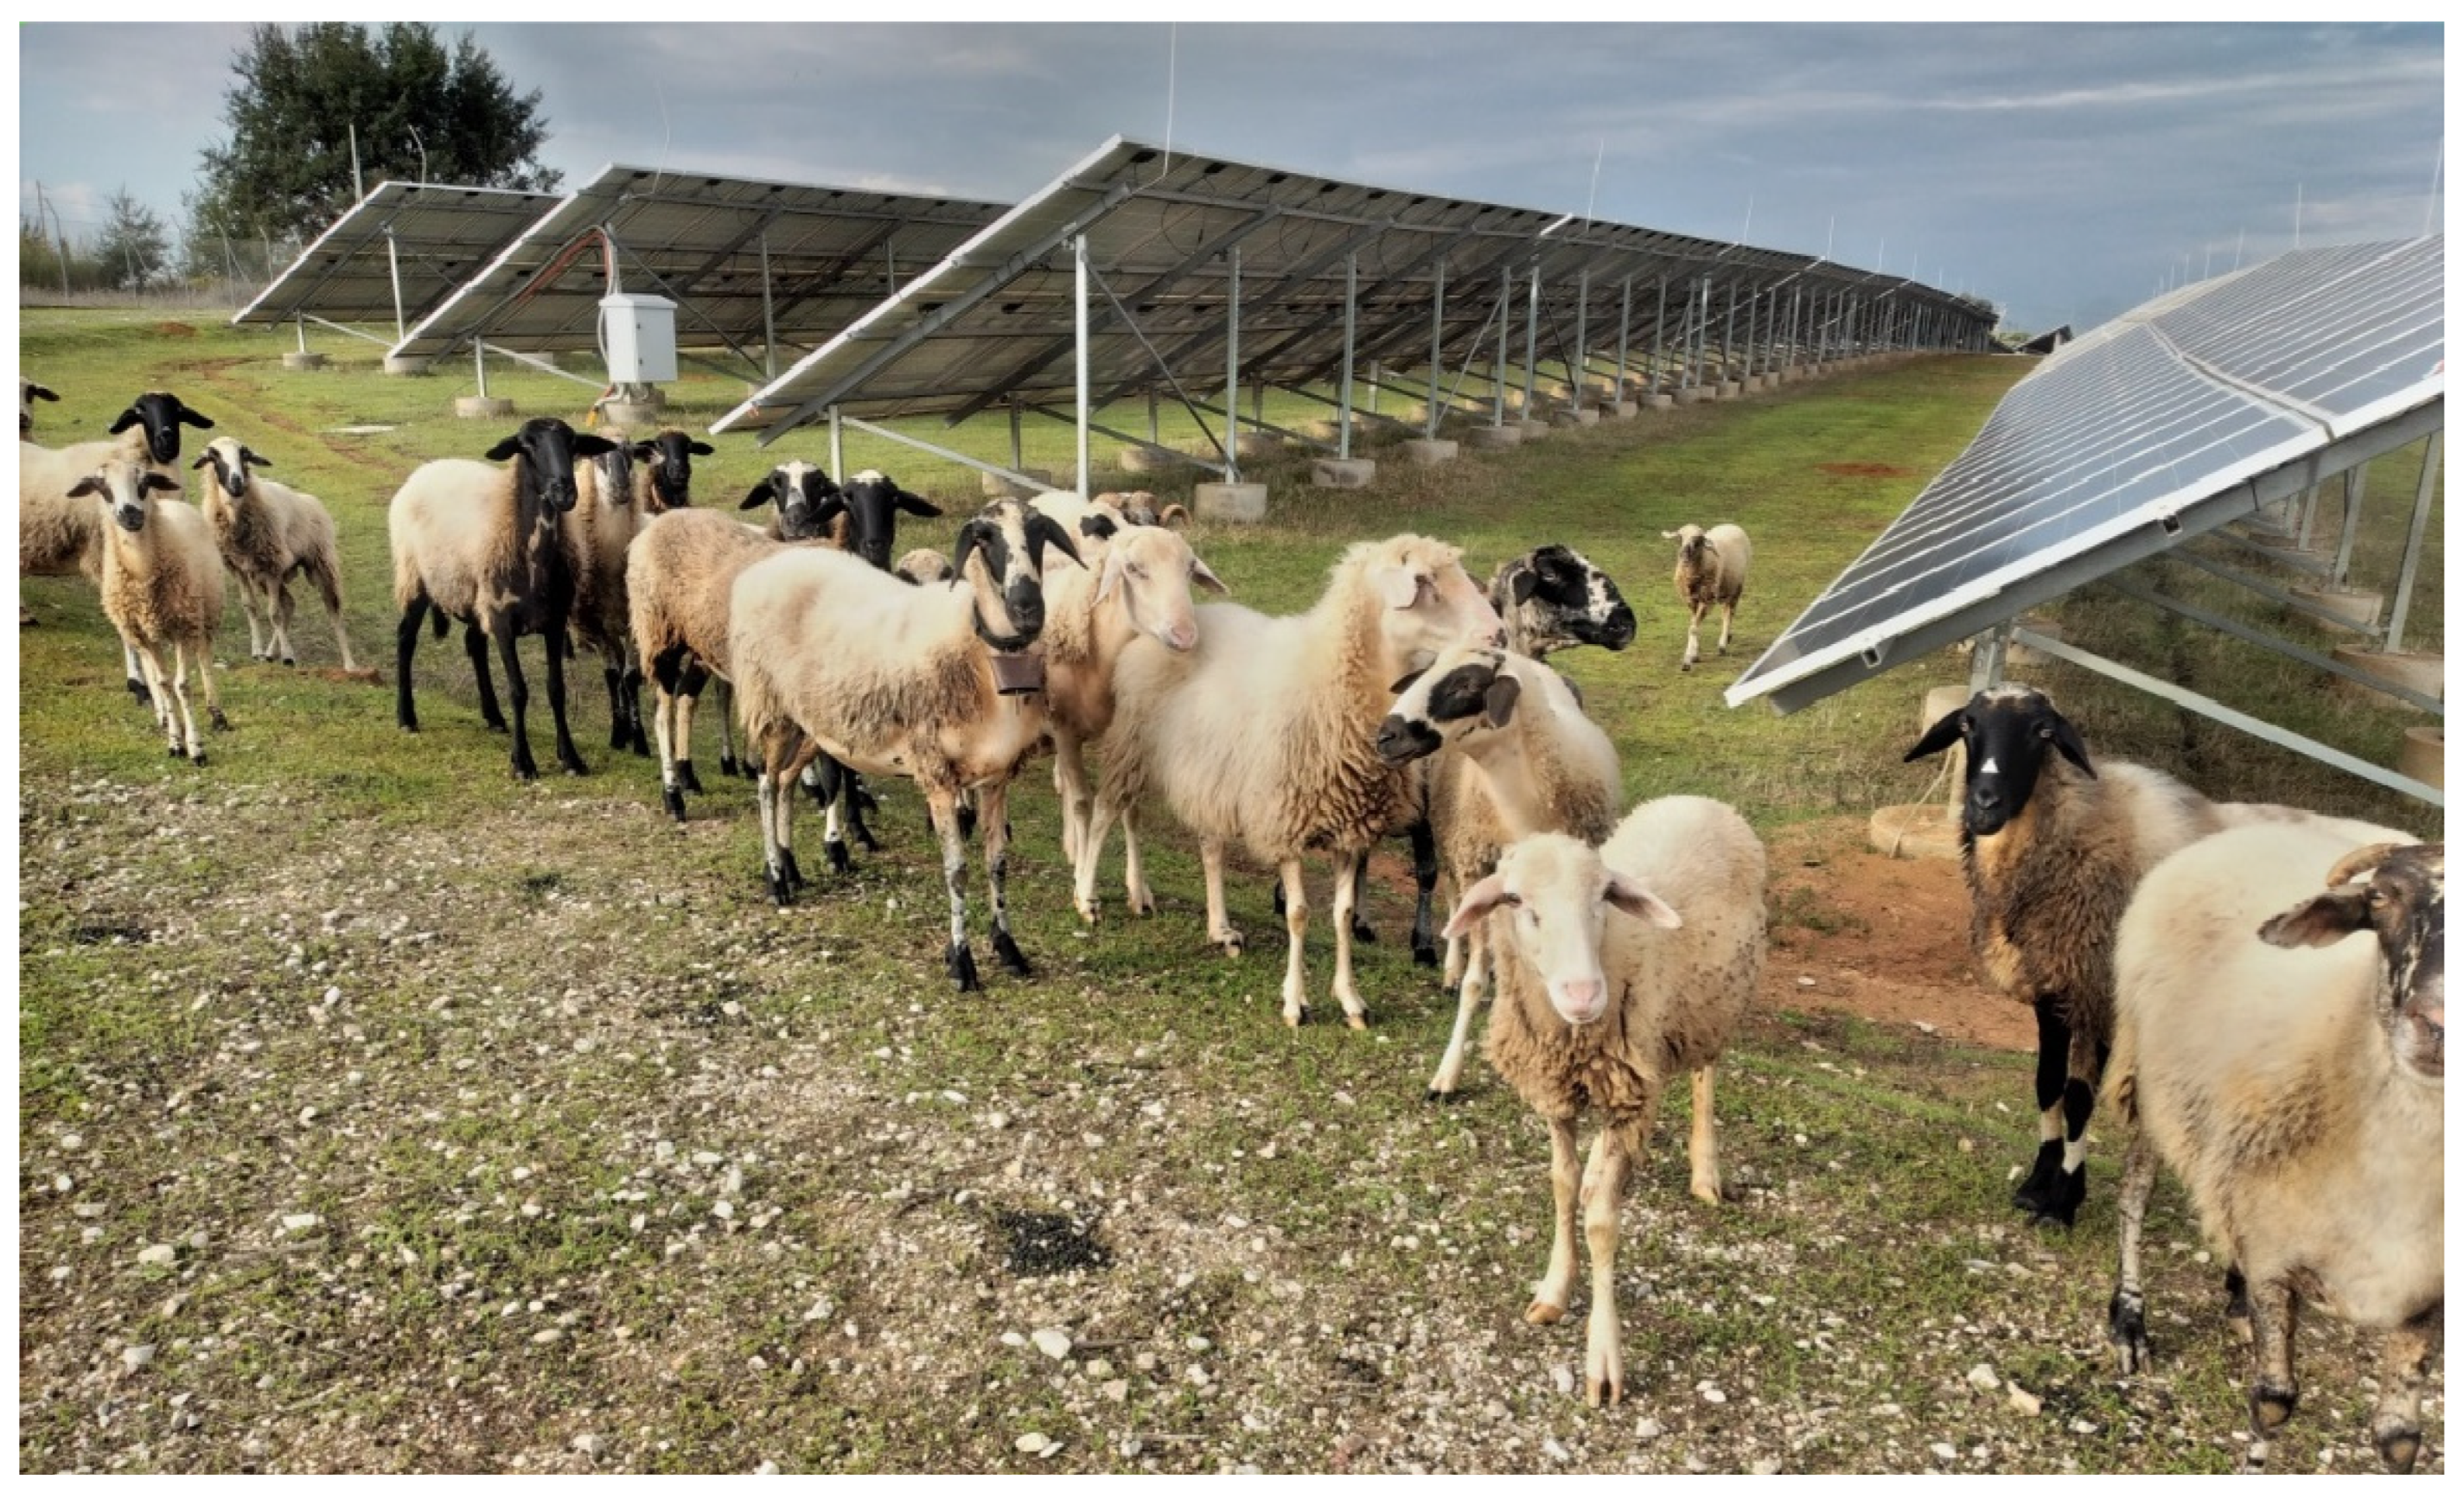
2.1. Site Features

The study case has been a photovoltaic (PV) plant of Enel Green Power [21] located in Kourtesi, in the western part of Peloponnesus in Greece (Municipality of Kyllini, Prefecture of Elis, 37.974358 N, 21.362540 E, 10 m a.s.l.).
The plant is characterized by a fixed layout, with PV modules 2.2 m high, 30° tilted toward south, with corridors between PV modules rows 3.5 m spaced, in which sheep grazing for vegetation management is already a well assessed and win-win solution of integration with PV plant (Figure 1).
The area has a Mediterranean climate with mild winters and hot and dry summers. Minimum temperatures are observed in January and February, but values never drop below 10° C on monthly average. The maximum temperatures are reached in July and August, about 26° C on monthly average. The mean long-term rainfall recorded in the area is about is 770 mm/year and is mainly distributed in autumn-winter period.
The relative humidity in the coldest periods doesn’t exceed 80% and decreases in the spring-summer period, thanks to the winds that intensify during this period, blowing mainly from the North to the South.
With the aim at collecting some preliminary data about crops’ responses to the microclimatic conditions between the panel rows, testing area (TA) has been located in corridors between two PV modules rows in Kourtesi PV plant. The data collected in TA have been then compared with the ones collected in a control area (CA), located in an organic commercial farm of the surroundings, that has been in charge of all the soil preparation activities, crops’ transplant and management in both the sites.
The soils (0–30 cm) of the two areas are both sandy-loam, with similar chemical features excepted for the higher N and P content in the soil of CA, maybe due to the fertilization usually made in the past years, as part of the usual management of the crops in the commercial farm, that is focused on the production (Table 1).

2.2. Crops Selection

Thyme (Thymus vulgaris L.), oregano (Origanum vulgare L.) and Greek mountain tea (Sideritis raeseri Boiss. & Heldr.) have been selected for the experimentation, through an analysis of the most relevant and typical crops of Kourtesi area (Figure 2).
The plants for the PV plant have been provided by the same commercial organic farm in which the CA has been located, thus the same genotypes have been compared. Transplant (0.40 × 0.40 m) has been carried out in November 2021 both in control and testing area. All the cultivation techniques have been made by the same personnel belonging to the commercial farm in both the sites. As regards weeds control, a Mater-Bi® mulching film, certified as completely biodegradable in soil according to standard EN17033, provided by Novamont S.p.A, has been adopted as a sustainable agricultural practice, both in the testing and in the control area, with the aim to reduce weed growth.
A drip irrigation system, with a flow rate of 17 m3/h, has been installed in both the areas. Three emergency waterings with 128.5 mm have been carried out on 9 July, 2 August and 3 September 2022, per a total of 385.5 mm of water supply. Fertigation has been performed on 25 May 2022, with 115 kg ha−1 of a ternary fertilizer (20% N, 20% P2O5 and 20% K2O).
During the plant growth, non-destructive measurements of plant height and the percentage of the vegetation cover have been made on ten randomly selected plants in the two areas. The vegetation cover has been measured by taking a photo from 1.5 m above of each sampling point and image elaboration has been made with ImageJ software (Figure 3). Images elaboration have included image scaling, sampling area measurement (cm2), and vegetated area identification (through color analysis) and measurement (cm2). Sampling area has been about 1000 cm2. The vegetation cover percentage has been then calculated as the ratio between vegetated area and the sampling area multiplied by 100.
On 6–8 June 2023 harvesting data have been collected in the two areas, by cutting and weighing ten randomly selected plants in each site at the height of 10 cm from the soil.

2.3. Microclimatic and Soil Data

Microclimatic data have been collected by using two weather stations (Vantage Pro2TM by DAVIS Instruments Hayward, CA, USA) placed at 1.50 m above soil. One station was located in the control area, while the other was situated in the test area, centrally placed between the rows of panels.
Five albedometers (PCTRA068, MTX S.r.l., Campogalliano (MO), Italy), used for measuring both the albedo (the ratio between upward radiation and downward radiation) and the net radiation (the difference between upward and downward radiation), have been placed at 2.00 m above the ground, but exclusively in the control area. The average data of the albedometers have been then used for the further analyses.
They were not placed in the testing area to avoid skewed measurements due to the partial shading from the 2.2-m-high PV modules. Therefore, the net radiation at crop level has been estimated in the testing area by using the model proposed by Pulido-Mancebo et al. [22] in a similar Mediterranean area, by using the following parameters of PV geometry: width of collectors (𝑎 = 3.31), average height of supports of the collectors (ℎ = 1.35 m), angle of inclination of the collectors (𝛼 = 30°), distance between collectors (𝑑 = 5.16), width of the lane not covered by the modules (c = 3.50 m), distance of referring point from the end of the lane (x = 1.75 m).
All these data (estimated net radiation and measured data) have been used for calculating reference evapotranspiration (ET0) by using the Penman-Monteith equation suggested by FAO drainage and irrigation paper n.56 [23], since all the other methods in Mediterranean areas have led to under- or over-estimation [24].
Soil temperature and soil water potential have been measured by sensors placed at 30 and 60 cm of depth (DS6470, Davis Instruments, Hayward, CA, USA and WATERMARK 200SS, The Irrometer Company, INC., Riverside, CA, USA, respectively) both in control and in testing area (at the centre of corridors between panel rows). Soil water potential (SWP) represents the negative pressure (water suction) that is necessary for roots uptake. In other words, the more negative the values, the drier the soil is, and the roots must use more energy for uptake soil water. The average data related to 0–60 cm soil layer are reported in the next sections of this study.

2.4. Statistical Analysis

The significance of differences between the average values of the crop’s variables have been tested using the t test at p = 0.05. Prior to apply the t test, the variances have been checked for homogeneity using the F test. Where the hypotesis of homogeneity of variances were rejected, the Whelch appoach fot t test were adopted.

3. Results

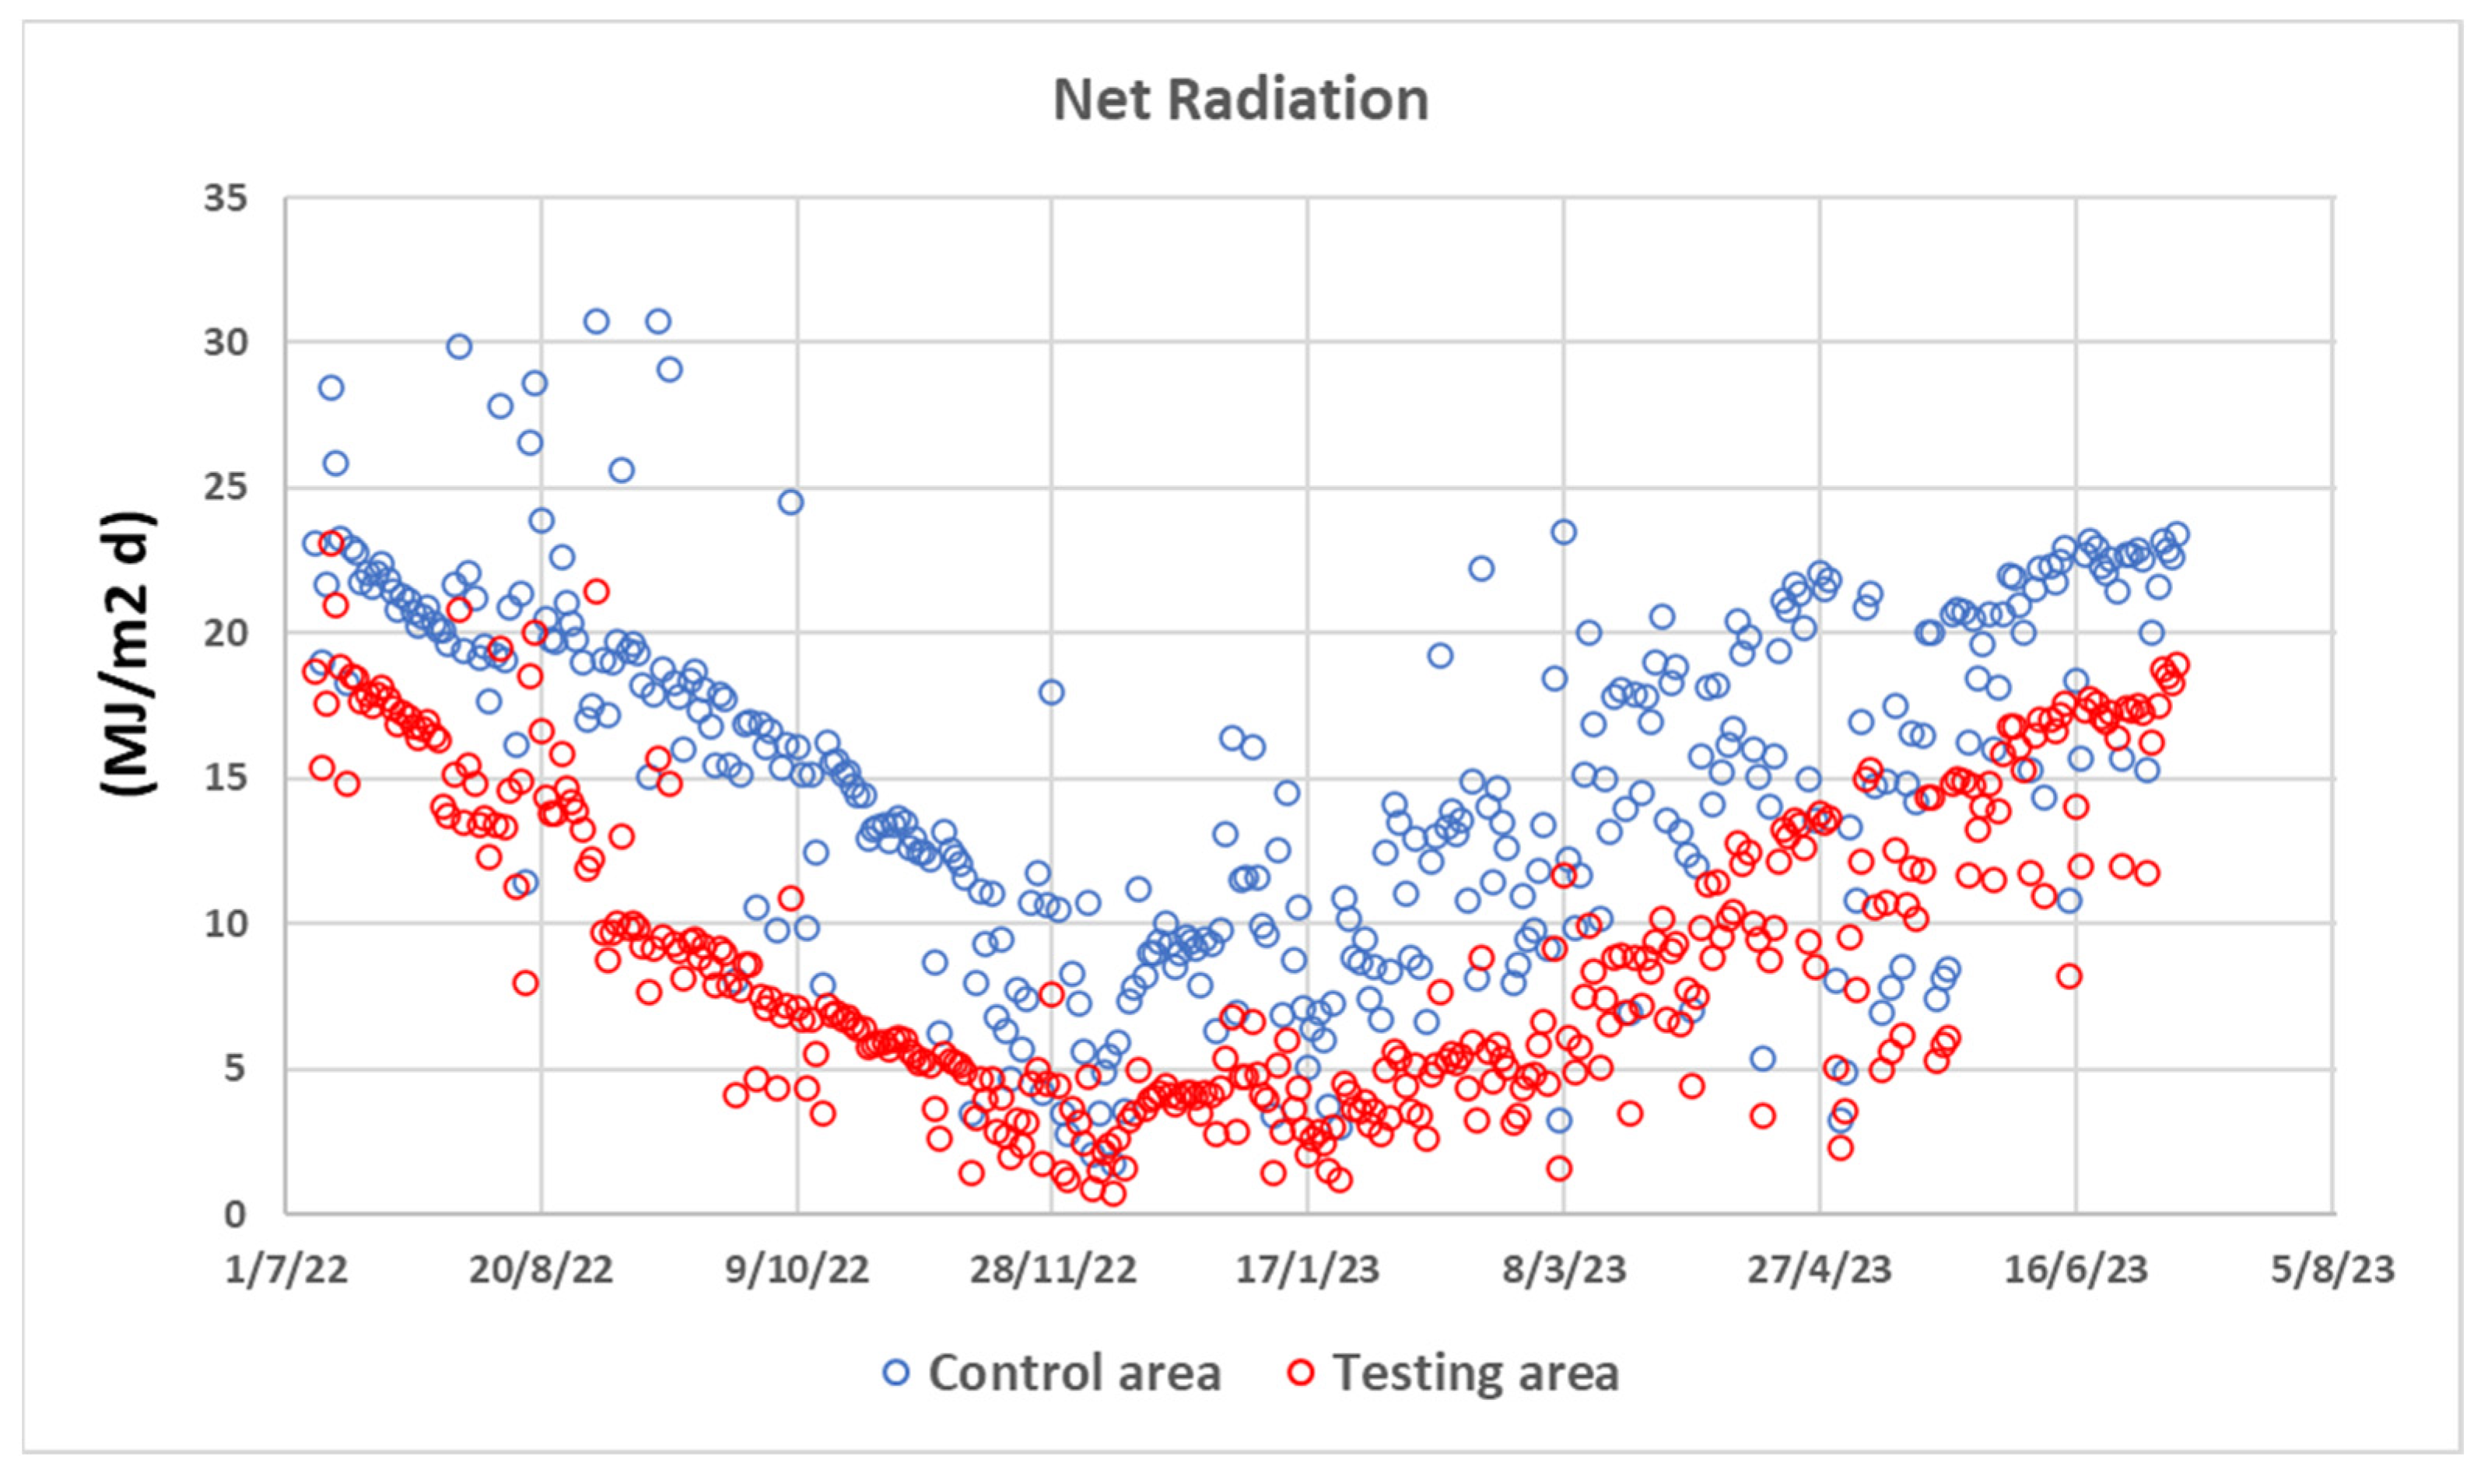
3.1. Microclimatic Conditions
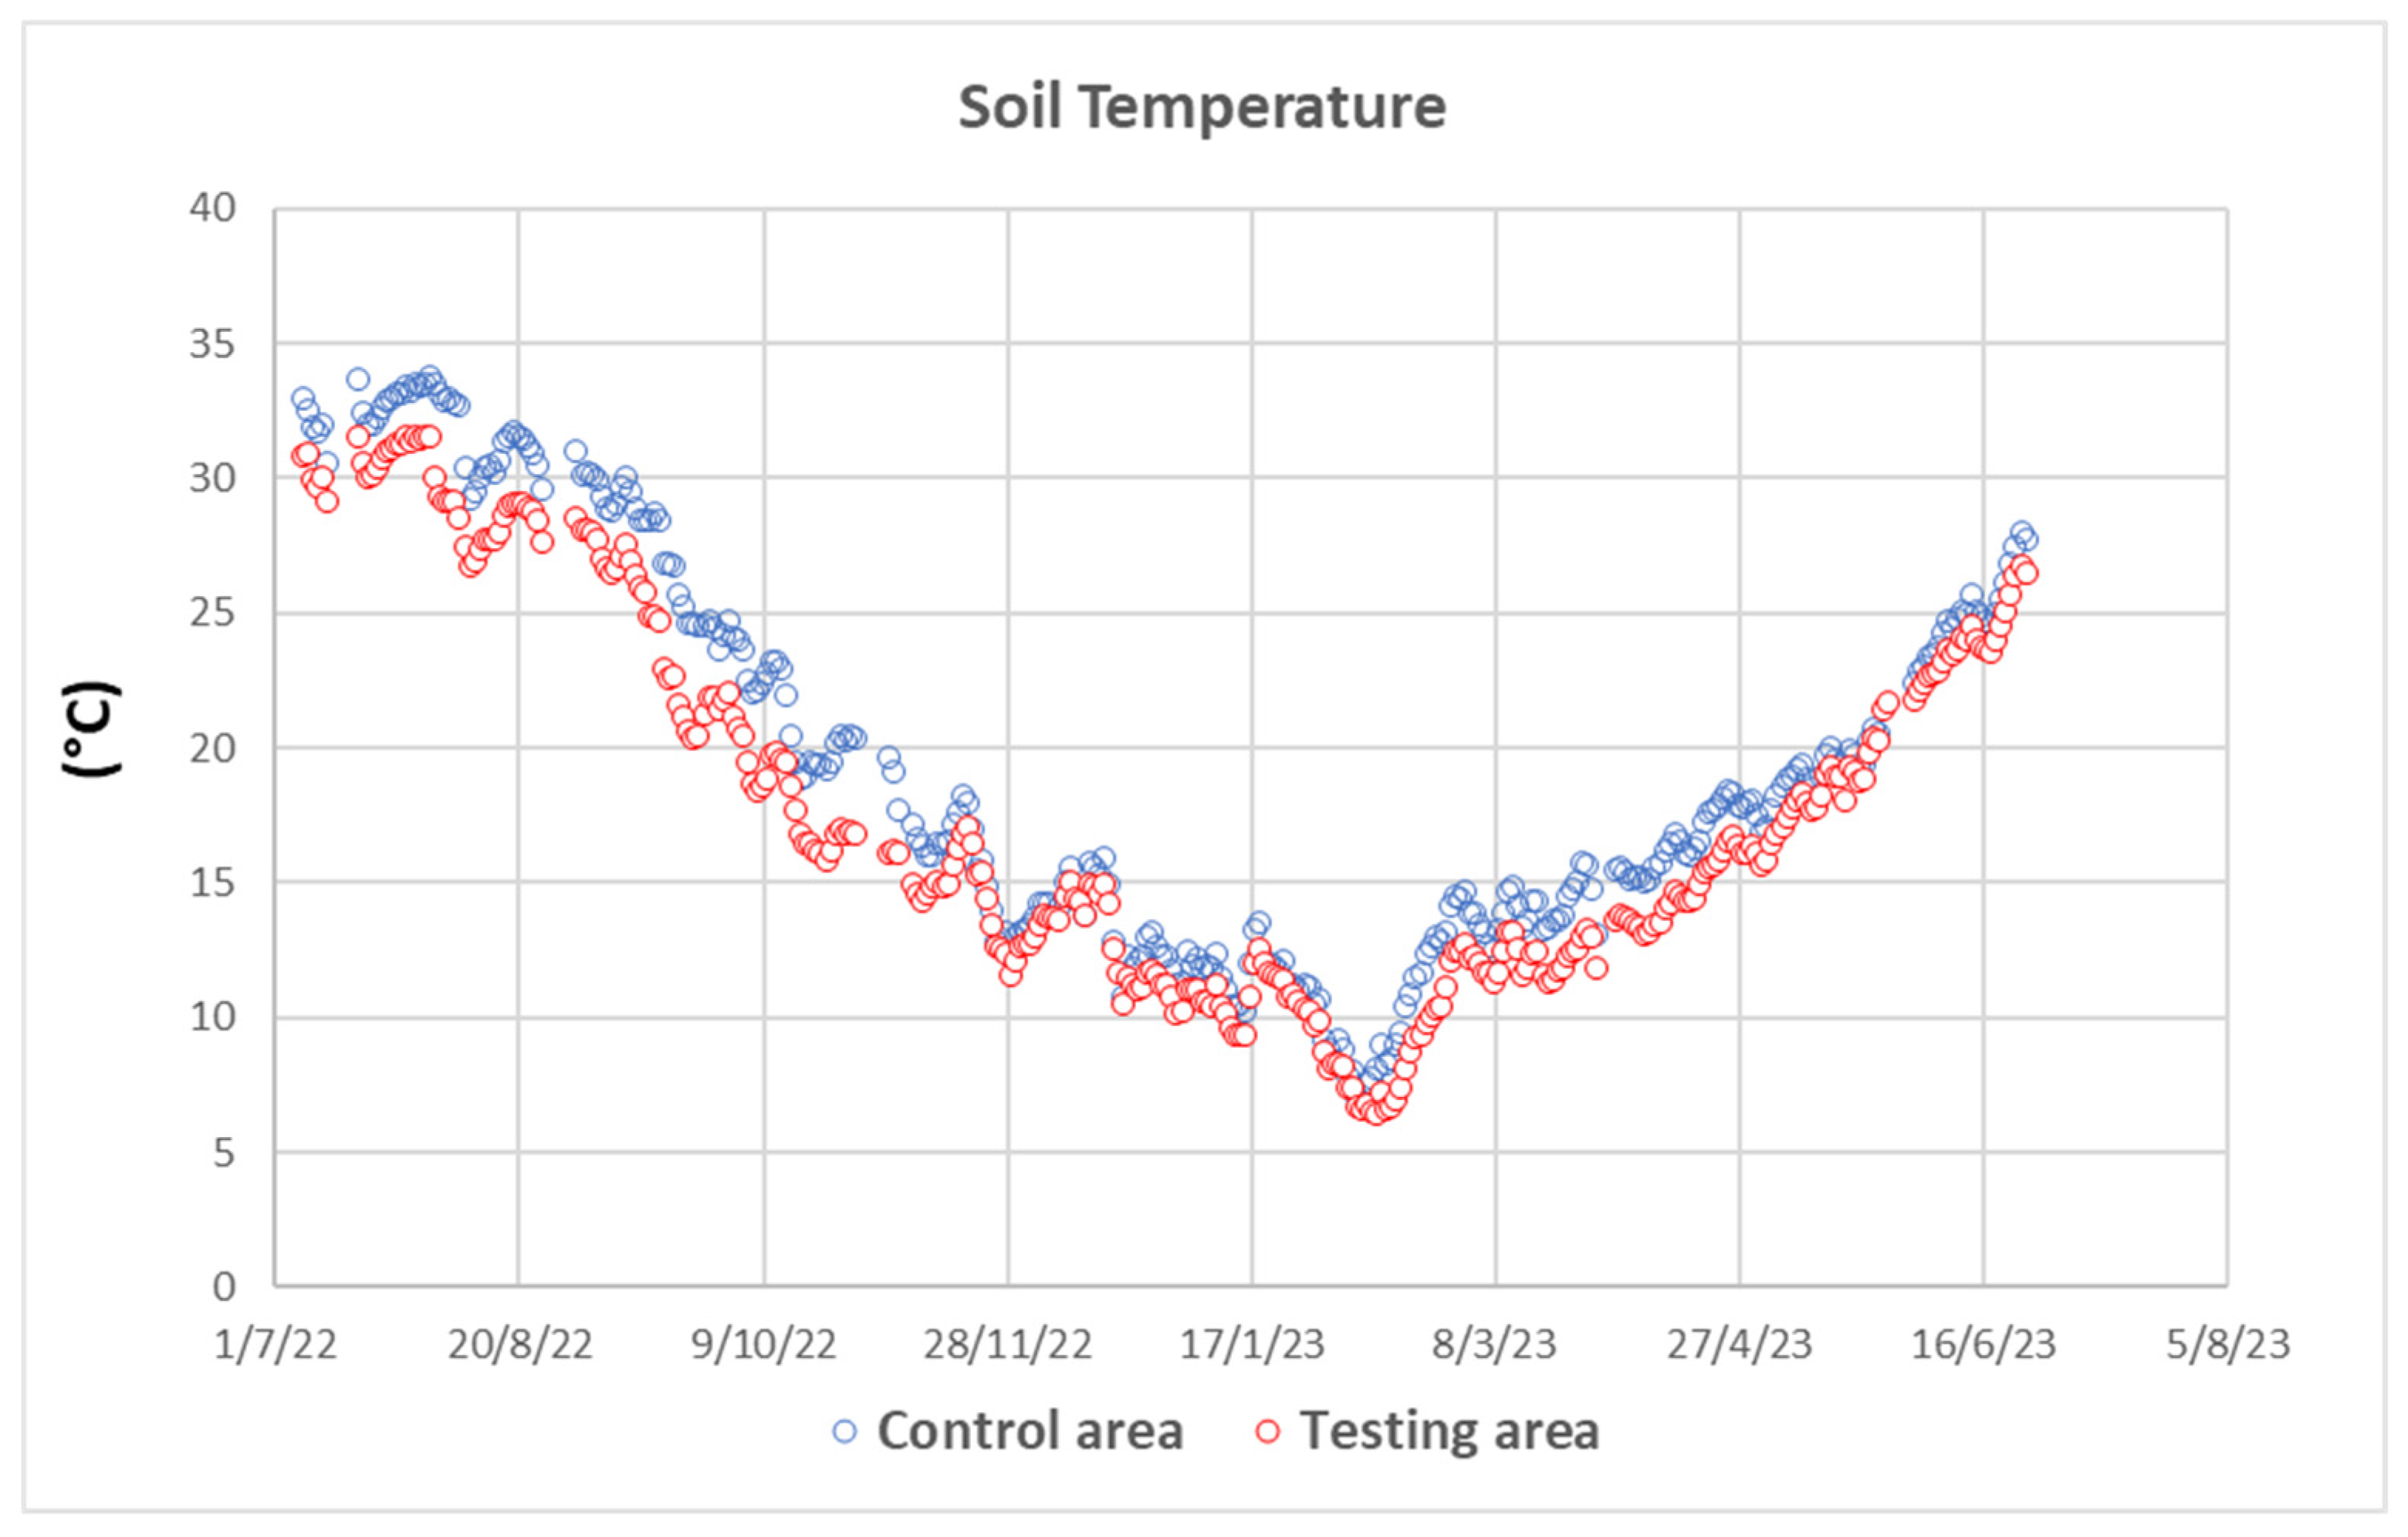
From the data obtained with the model used for estimating the net radiation in the testing area [22], the average value resulted 44% lower than in the control area, with differences in winter months (−60% in February) higher than in the summer ones (−19%). The average net radiation of the whole sampling period was 15 MJ/m2 d in the control area and 9.0 MJ/m2 in the testing area (Figure 4).
Regarding the other microclimatic parameters (Table 2), no appreciable difference has been recorded for air temperature and relative humidity, while a 38% reduction of the wind speed has been measured in the testing area, with respect to the control area on the average of the monitoring period.
All these data have been used for calculating ET0 [23]. From the analysis of the data (Figure 5) during the 2022–2023 season, the total ET0 has been 1.622 mm per year in control area and 1.149 mm in the testing area. Therefore, the reduction of the wind speed and of the net radiation in the testing area caused a 29% decrease of ET0, corresponding to 474 mm.

3.2. Soil Data

During the whole measuring period (Table 3), average soil temperature has been 8% lower in testing area, compared to the control area. The average value for the soil water potential in the investigated period has been 34% higher in the testing area, compared to the one of the control area, suggesting a lower water deficit and thus confirming the microclimatic data, which have shown lower reference evapotranspiration in the testing area due to lower net radiation and wind speed.
The soil temperature and the soil water potential in control and testing area are reported in Figure 6 and Figure 7, respectively. The main differences have been concentrated during the spring-summer months, while in winter the differences have been more limited.
It is evident that the decrease of SWP after irrigation during summer months has been more severe in the control area than in the testing area.

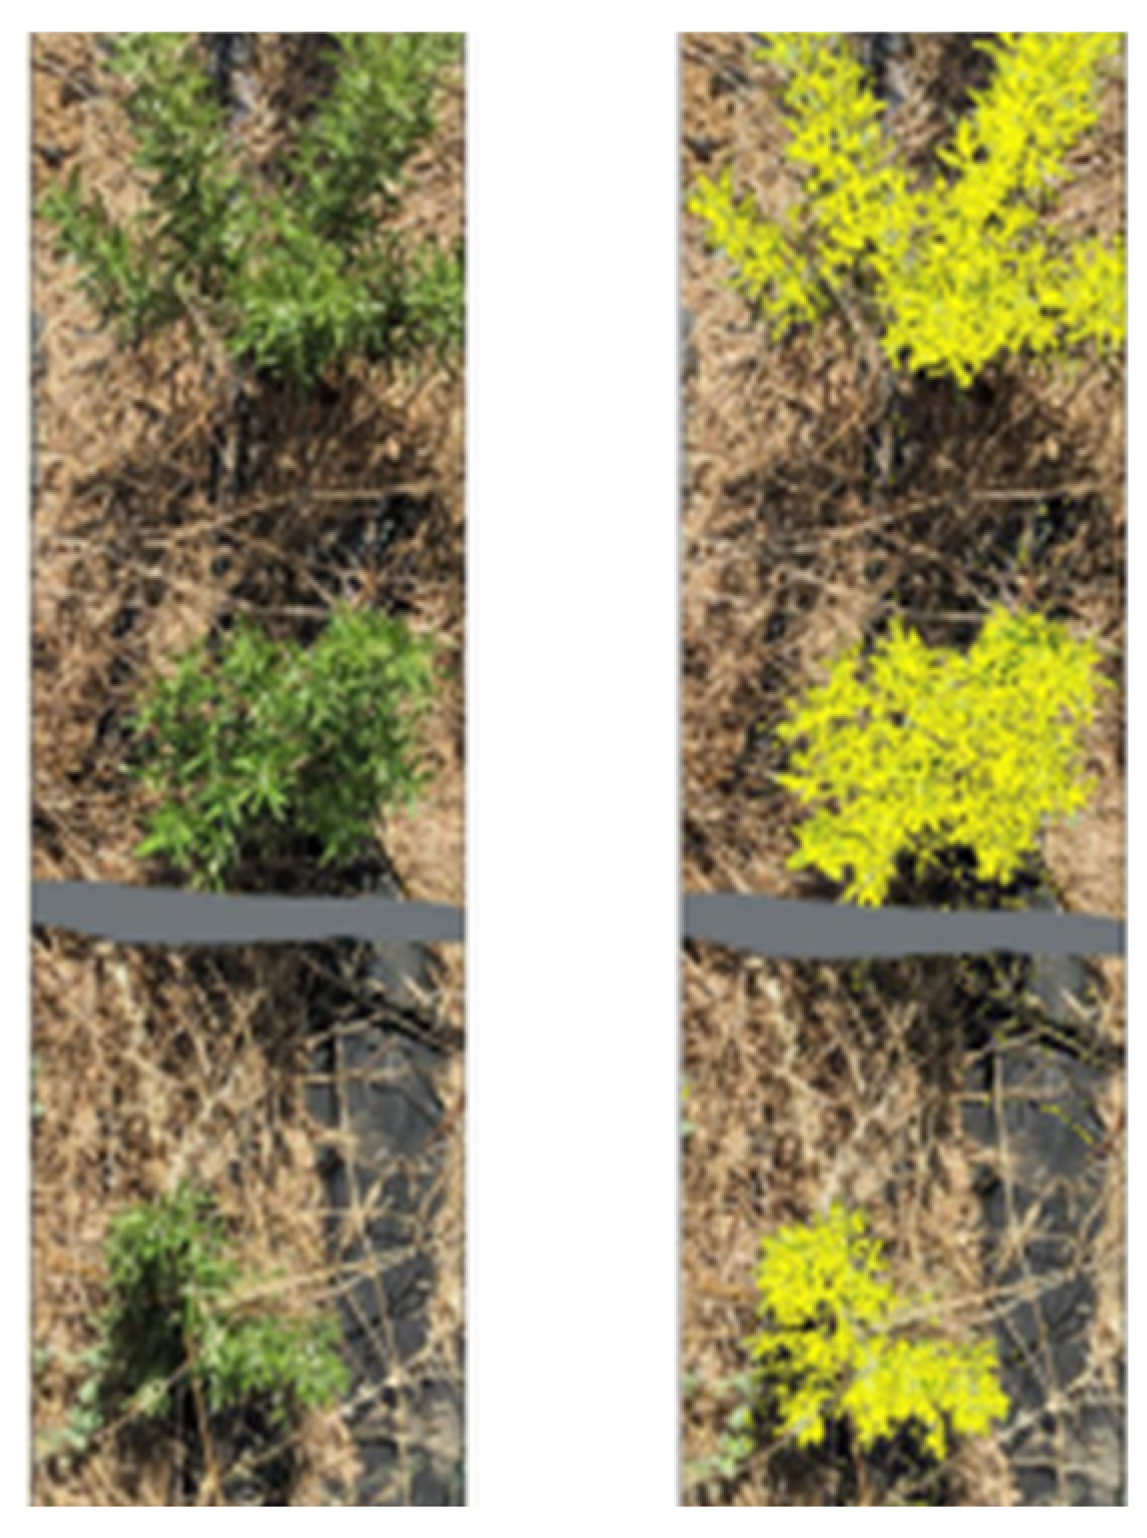
3.3. Plant Measurements

The data collected in control and in testing area during the harvest made in June 2023 (Table 4), have shown no differences in terms of plant height and vegetation cover. Plant fresh weight (g/plant) has been higher in testing area (+6% for thyme, +32% for oregano and +47% for Greek mountain tea), even if the differences with the control area have been significant only for oregano (p ≤ 0.05), due to the high variability of the data. Standard deviation has been very high for Greek mountain tea at both the sites, maybe for the extreme climatic conditions (i.e., thermal and drought stress), that have altered the growth of this species, native of mountain environments.

4. Discussion

Throughout the monitoring period (7 July 2022–6 July 2023), the average shading in the testing area, where rows of PV modules are spaced 3.5 m apart and the PV structure stands 2.2 m tall, resulted in a 44% reduction in net radiation in the cultivated zones (namely, the corridors between the PV modules) compared to the levels recorded in the control area. These effects have been consistent with findings reported by Marrou et al. [16] who observed a 30% of net radiation decrease with PV structures 4 m high and rows 3.2 m apart. Similarly, Edouard et al. [25] reported a net radiation reduction of 29–44% with PV structures 4.5 m tall and rows 12 m apart.
In Kourtesi PV plant, the wind speed has been 38% lower in the testing area, compared to the one measured in the control area on the average, with very similar values to the ones measured by Hassanpour et al. [18] in a PV plant with fixed panels 1.1–2.2 m high. Wind speed reduction, coupled with the net radiation reduction, allowed to reduce evapotranspiration by 29% and to increase soil water potential by 34%. These findings corroborate the results of Hassanpour et al. [18] who reported that in a PV located in areas with a severe water stress (Corvallis, Oregon, U.S.), with a design similar to the Kourtesi plant, tended to enhanced biomass in semiarid pastures. This improvement was attributed to increased soil moisture due to a 30% decrease of ET0, as a consequence of a reduction in net radiation and wind speed. The increase of water availability in PV plants has also been reported by [26] with fixed PV structure 3.3 m above soil surface and with bi-axial PV structure 4.5 m high [25].
These studies highlighted that PV modules can led to a reduction of net radiation and wind speed potentially mitigating drought stress in crops and conserving water. However, the effects on crop yield reported in literature, are variable. In the case presented in this paper, no significant difference in the yield of aromatic plants typical of Mediterranean areas has been noticed between testing and control area.
Regarding ground-mounted PV layouts, Hernández et al. [27] reported that, in a semi-arid climate, the intermittent shade and microclimate generated in the corridor zone between panel rows could contribute to minimizing the impact of the stress caused by high solar radiation and high temperature, improving the growth of the aloe (14% and 29% increase of plant height and leaf area compared to the control area), thereby enhancing productivity per unit of cropped area.
In areas with severe water stress, shading due to fixed PV ground-mounted structures (2.2 m high), reduced evapotranspiration and increased soil moisture levels, thus reducing drought stress, and improving productivity up to 90% in semi-arid pastures [18], but the response of other crops varied among the genotypes. A clear picture of the higher variability in crop response to PV layouts with height ranging from 1.9–5.0 m, can be obtained taking in account the most recent studies involving vegetables and fruit crops as well as forage crops.
The increased shading on the crops due to 4 m high PV structure has reduced the total dry matter accumulation of cucumber to 42–79% of values recorded in full sun [16].
Edouard et al. [25] in a PV plant with 4.5 m high biaxial solar structure, arranged in rows 12 m spaced, have reported an effect of PV modules on alfalfa yield ranging from −21% to +40% as compared to control area in open air; Marrou et al., [16,28] with 4 m high PV modules reported variable effects on yield among different lettuce genotypes, ranging from −39% to +7%; Barron-Gafford et al. [26] in drylands (Arizona) have reported that fixed PV structure 3.3 m high could prevent the depression of photosynthesis due to heat and light stress, but the effects on crop yield varied among the species; Ferrara et al. [29] in a PV plant with a fixed structure, used as a pergola, with height from 1.9 to 2.6 m have reported the reduction of soil temperature and ET0, and the consequent increase of soil water potential in particular at more negative values at the end of the growing season, without significant effects on grape yield under hot and dry conditions in Italy. Weselek et al. [30] have reported, regarding the hottest and the driest years, yield increases of 2.7% for winter wheat and of 11% for potatoes under bifacial photovoltaic modules with a row distance of 6.3 m and a clearance height of 5 m.

5. Conclusions

(a) The reduction of the net radiation and of the wind speed due to PV modules decreases water consumption due to evapotranspiration, thus increasing soil water availability for crops and enabling water savings.
(b) In hot and dry climatic conditions, the reduction of the climatic stress could compensate the decrease of photosynthesis due to the shading effect of PV modules, thus not damaging crop’s yield.
(c) It is possible to cultivate crops in the rows between PV modules also in the case of fixed PV layouts; the development of tailored solutions for each specific location, based on environmental, agronomical, morphological, socio-economic aspects is crucial for determining the success of the co-location of energy and food production.
(d) In the climatic conditions of Southern Mediterranean, the integration of a PV plant with aromatic crops has proved its worth, and thus it could represent an opportunity for the development of new business models, creating shared value for the local communities of western Greece. These results confirm that the choice of the genotypes must be carefully evaluated on the basis of their adaptability to the specific climatic conditions of the area and to the shading effect of the specific PV plant design.

Author Contributions

M.F. (Massimo Fagnano): research concept development and design, data analysis and paper writing, review and editing. N.F.: data analysis and manuscript revision. D.V.: data collection. G.M.B.: development and data collection. M.F. (Michele Falce): development and supervision. M.A.: conceptualization and revision of the paper. M.G. and M.D.B.: project management and supervision, paper review. All authors have read and agreed to the published version of the manuscript.

Funding

The authors declare that this study was funded by Enel Green Power SpA. The funder had the following involvement with the study: project management and supervision, paper review.

Data Availability Statement

Due to the confidential nature of the information used, supporting data are not available.

Acknowledgments

Special thanks to Enel Green Power Operation & Maintenance personnel Georgios Koutroumpezis (Athens, Greece) and to Vasileios Samiotakis (Athens, Greece) for the support provided in the on field activities and to Christos Thanopoulos (Achaia, Greece) for the plants supply and for the assistance in the crop management and sampling activity.

Conflicts of Interest

Authors M.G. and M.D.B. are employed by the company Enel Green Power SpA; G.M.B. and M.F. (Michele Falce) are employed by the company Novamont SpA. The remaining authors declare that the research was conducted in the absence of any commercial or financial relationships that could be construed as a potential conflict of interest. The authors declare that this study received funding from Enel Green Power SpA. The funder had the following involvement with the study: project man-agement and supervision, paper review.

References

  1. EU. Directive (EU) 2018/2001 of the European Parliament and of the Council of 11 December 2018 on the Promotion of the Use of Energy from Renewable Sources. 2018. Available online: https://eur-lex.europa.eu/eli/dir/2018/2001/oj (accessed on 1 September 2023).
  2. UNEP. Global Climate Litigation Report; Status Review: Nairobi, Kenya, 2023. [Google Scholar]
  3. IRENA. Renewable Capacity Statistics; International Renewable Energy Agency (IRENA): Abu Dhabi, United Arab Emirates, 2021. [Google Scholar]
  4. Dincer, I. Renewable energy and sustainable development a crucial review. Renew. Sustain. Energy Rev. 2000, 4, 157–175. [Google Scholar] [CrossRef]
  5. Nonhebel, S. Renewable energy and food supply: Will there be enough land? Renew. Sustain. Energy Rev. 2005, 9, 191–201. [Google Scholar] [CrossRef]
  6. van der Horst, D.; Vermeylen, S. Spatial scale and social impacts of biofuel production. Biomass Bioenergy 2011, 35, 2435–2443. [Google Scholar] [CrossRef]
  7. Vineesh, V.; Bhattacharya, J. Comparing hut-shaped-east-west array for fixed photovoltaic panels against conventional equator facing parallel rows for power output per unit field area. Energy Sustain. Dev. 2022, 70, 225–238. [Google Scholar] [CrossRef]
  8. Sacchelli, S.; Garegnani, G.; Geri, F.; Grilli, G.; Paletto, A.; Zambelli, P.; Ciolli, M.; Vettorato, D. Trade-off between photovoltaic systems installation and agricultural practices on arable lands: An environmental and socio-economic impact analysis for Italy. Land Use Policy 2016, 56, 90–96. [Google Scholar] [CrossRef]
  9. Dupraz, C.; Marrou, H.; Talbot, G.; Dufour, L.; Nogier, A.; Ferard, Y. Combining solar photovoltaic panels and food crops for optimizing land use: Towards new agrivoltaic schemes. Renew. Energy 2011, 36, 2725–2732. [Google Scholar] [CrossRef]
  10. Amaducci, S.; Yin, X.; Colauzzi, M. Agrivoltaic systems to optimize land use for electric energy production. Appl. Energy 2018, 220, 545–561. [Google Scholar] [CrossRef]
  11. GSE. Statistiche Trimestrali Sul Settore Fotovoltaico in Italia. 2022. Available online: https://www.expoclima.net/save-download/Documenti/5231 (accessed on 3 October 2023).
  12. Ong, S.; Campbell, C.; Denholm, P.; Margolis, R.; Heath, G. Land-Use Requirements for Solar Power Plants in the United States; Technical Report NREL/TP-6A20-56290; NREL: Denver, CO, USA, 2013.
  13. Goldberg, Z.A. Solar energy development on farmland, Three prevalent perspectives of conflict; synergy and compromise in the United States. Energy Res. Soc. Sci. 2023, 101, 103145. [Google Scholar] [CrossRef]
  14. Alsharif, W.; Saad, M.M.; Hirt, H. Desert microbes for boosting sustainable agriculture in extreme environments. Front. Microbiol. 2020, 11, 1666. [Google Scholar] [CrossRef]
  15. Touil, S.; Richa, A.; Fizir, M.; Bingwa, B. Shading effect of photovoltaic panels on horticulture crops production: A mini review. Rev. Environ. Sci. Biotechnol. 2021, 20, 281–296. [Google Scholar] [CrossRef]
  16. Marrou, H.; Dufour, L.; Wery, J. How does a shelter of solar panels influence water flows in a soil-crop system? Eur. J. Agron. 2013, 50, 38–51. [Google Scholar] [CrossRef]
  17. Weselek, A.; Ehmann, A.; Zikeli, S.; Lewandowski, I.; Schindele, S.; Högy, P. Agrophotovoltaic systems: Applications, challenges, and opportunities. A review. Agron. Sustain. Dev. 2019, 39, 35. [Google Scholar] [CrossRef]
  18. Hassanpour, A.E.; Selker, J.S.; Higgins, C.W. Remarkable agrivoltaic influence on soil moisture; micrometeorology and water-use efficiency. PLoS ONE 2018, 13, 0203256. [Google Scholar] [CrossRef] [PubMed]
  19. Yue, S.; Guo, M.; Zou, P.; Wu, W.; Zhou, X. Effects of photovoltaic panels on soil temperature and moisture in desert areas. Environ. Sci. Pollut. Res. 2021, 28, 17506–17518. [Google Scholar] [CrossRef] [PubMed]
  20. Wallace, J.S. Increasing agricultural water use efficiency to meet future food production. Agric. Ecosyst. Environ. 2000, 82, 105–119. [Google Scholar] [CrossRef]
  21. EGP. The Kourtesi Solar Farm: Greece 2011. Available online: https://www.enelgreenpower.com/our-projects/operating/kourtesi-solar-farm (accessed on 1 September 2023).
  22. Pulido-Mancebo, J.S.; López-Luque, R.; Fernández-Ahumada, L.M.; Ramírez-Faz, J.C.; Gómez-Uceda, F.J.; Varo-Martínez, M. Spatial Distribution Model of Solar Radiation for Agrivoltaic Land Use in Fixed PV Plants. Agronomy 2022, 12, 2799. [Google Scholar] [CrossRef]
  23. Allen, R.; Pereira, L.; Raes, D.; Smith, M. FAO Irrigation and Drainage Paper No. 56; Food and Agriculture Organization of the United Nations: Rome, Italy, 1998; pp. 26–40. [Google Scholar]
  24. Aschale, T.M.; Sciuto, G.; Pere, D.J.; Gullotta, A.; Cancelliere, A. Evaluation of Reference Evapotranspiration Estimation Methods for the Assessment of Hydrological Impacts of Photovoltaic Power Plants in Mediterranean Climates. Water 2022, 14, 2268. [Google Scholar] [CrossRef]
  25. Edouard, S.; Combes, D.; Van Iseghem, M.; Tin, M.N.W.; Escobar-Gutiérrez, A.J. Increasing land productivity with agriphotovoltaics: Application to an alfalfa field. Appl. Energy 2023, 329, 120207. [Google Scholar] [CrossRef]
  26. Barron-Gafford, G.A.; Pavao-Zuckerman, M.A.; Minor, R.L.; Sutter, L.F.; Barnett-Moreno, I.; Blackett, D.T.; Thompson, M.; Dimond, K.; Gerlak, A.K.; Nabhan, G.P.; et al. Agrivoltaics provide mutual benefits across the food–energy–water nexus in drylands. Nat. Sustain. 2019, 2, 848–855. [Google Scholar] [CrossRef]
  27. Hernández, V.; Cos, J.; Andrés, R.; Di Blasi, M.; Genovese, M.; Hellín, P.; Contreras, F.; Guevara, A.; Fenoll, J.; Flores, P. Impact of an agrivoltaic system on Aloe vera growth in a semi-arid climate. ISHS Acta Hortic. 2022, 1355. [Google Scholar] [CrossRef]
  28. Marrou, H.; Guilioni, L.; Dufour, L.; Dupraz, C.; Wery, J. Microclimate under agrivoltaic systems, is crop growth rate affected in the partial shade of solar panels? Agric. For. Meteorol. 2013, 177, 117–132. [Google Scholar] [CrossRef]
  29. Ferrara, G.; Boselli, M.; Palasciano, M.; Mazzeo, A. Effect of shading determined by photovoltaic panels installed above the vines on the performance of cv. Corvina (Vitis vinifera L.). Sci. Hort. 2023, 308, 311595. [Google Scholar] [CrossRef]
  30. Weselek, A.; Bauerle, A.; Hartung, J.; Zikeli, S.; Lewandowski, I.; Högy, P. Agrivoltaic system impacts on microclimate and yield of different crops within an organic crop rotation in a temperate climate. Agron. Sustain. Dev. 2021, 41, 59. [Google Scholar] [CrossRef]
Figure 1. Sheep grazing in Kourtesi PV plant (2021).
Agronomy 14 00466 g001
Figure 2. Aromatic plants cultivated in Kourtesi Photovoltaic plant.
Agronomy 14 00466 g002
Figure 3. Measurement of vegetation cover.
Agronomy 14 00466 g003
Figure 4. Net radiation in control and testing area (7 July 2022–6 July 2023).
Agronomy 14 00466 g004
Figure 5. Reference evapotranspiration in control and testing area (7 July 2022–6 July 2023).
Agronomy 14 00466 g005
Figure 6. Soil temperature during the monitoring period (7 July 2022–6July 2023).
Agronomy 14 00466 g006
Figure 7. Soil water potential during the monitoring period (7 July 2022–6 July 2023).
Agronomy 14 00466 g007
Table 1. Physical-chemical features of the soil in CA and TA.
SitepH 1:2.5E.C.
1:5
Organic Carbon NC/NP2O5
Assim.
K2O
Exchang.
ClaySiltSandTexture
μS/cm (%)% ppmppm%%%
CA7.05117.00.940.127.975.015819.014.566.5sandy loam
TA6.8283.90.890.0910.423.418214.58.577.0sandy loam
Table 2. Microclimatic parameters measured in control and testing area. Average values of the period 7 July 2022–6 July 2023.
TmaxTminTmeanRHmaxRHminWS
°C°C°C%%m/s
CA24.4712.1318.0790.0347.164.28
TA24.6812.3218.0589.8851.732.63
TA: CA ratio1.011.021.001.001.100.62
Note: T: Air temperature, RH: relative humidity; WS: wind speed.
Table 3. Average of daily data of soil parameters (7 July 2022–6 July 2023).
Soil Water Potential
(KPa)
Soil Temperature
(°C)
AverageAverageMinimumMaximum
CA−38.119.46.933.7
TA −25.117.76.431.7
TA: CA ratio0.660.910.930.94
Table 4. Data of plant growth at harvest (June 2023).
CATA
AverageSt.dev.AverageSt.dev.p (t)
Thyme
Height (cm)33.74.136.65.10.18
Vegetation cover (%)90.51.189.40.70.02
Fresh weight (g/plant)235.632.3249.081.70.64
Oregano
Height (cm)50.66.855.49.40.21
Vegetation cover (%)81.12.677.58.20.20
Fresh weight (g/plant)215.032.8283.370.10.01
Greek mountain tea
Height with flower (cm)37.95.736.07.70.54
Vegetation cover (%)83.61.774.62.60.00
Fresh weight (g/plant)62.532.891.740.70.09
Note: average values, standard deviation and p-value of test t (n = 10).
Disclaimer/Publisher’s Note: The statements, opinions and data contained in all publications are solely those of the individual author(s) and contributor(s) and not of MDPI and/or the editor(s). MDPI and/or the editor(s) disclaim responsibility for any injury to people or property resulting from any ideas, methods, instructions or products referred to in the content.

