Article

Analysis of the Photosynthetic Parameters, Grain Yield, and Quality of Different Winter Wheat Varieties over a Two-Year Period

1
Department for Breeding & Genetics of Small Cereal Crops, Agricultural Institute Osijek, Juzno predgradje 17, 31000 Osijek, Croatia
2
Department of Biology, Josip Juraj Strossmayer University of Osijek, Cara Hadrijana 8a, 31000 Osijek, Croatia
3
Faculty of Agriculture, University of Zagreb, Svetosimunska cesta 25, 10000 Zagreb, Croatia
*
Author to whom correspondence should be addressed.
Agronomy 2024, 14(3), 478; https://doi.org/10.3390/agronomy14030478
Submission received: 1 February 2024 / Revised: 19 February 2024 / Accepted: 20 February 2024 / Published: 27 February 2024
(This article belongs to the Section Plant-Crop Biology and Biochemistry)

Abstract

:
Due to increasingly frequent unfavorable climate changes, achieving a high grain yield of wheat is a challenge for breeders. The relationships between wheat productivity and photosynthesis traits are not very well understood during the growing season. This study investigated the effect of chlorophyll a fluorescence parameters (maximum quantum yield of primary photochemistry (TRO/ABS) and performance index on absorption basis (PIABS)) on grain yield and the yield-related and technological quality traits of six wheat varieties over two growing seasons. In the first growing season (2021/2022), grain yield was significantly positively correlated with 1000 kernel weight and TRO/ABS at the second measurement point (growth stage 25 (GS 25)). Only the highest-yielding variety Bubnjar (104.0 dt ha−1) showed values of TRO/ABS at the same significance level between the second and third measurement points. Due to elevated virus and disease infections in the second growing season (2022/2023), the grain yield of the investigated varieties decreased between 37.9% (Bubnjar) and 67.6% (Anđelka) relative to the first growing season. The three highest-yielding varieties (Bubnjar, Rujana, and Silvija) in 2022/2023 were the tallest, were later in maturity, escaped yellow rust pressure at the stem elongation stage more efficiently, and also showed the lowest increase in TRO/ABS at this stage (fourth measurement point at GS 47, compared to the third at GS 32). In addition, the highest-yielding variety Bubnjar showed the highest increase in PIABS at the last measurement (seventh) at GS 71 compared to the sixth (GS 69), thus maintaining the vitality of flag leaves at the grain-filling stage, while the other varieties showed a very small increase or even a significant decrease. Therefore, plant photosynthetic activity over the entire growing season contributes to crop productivity.

1. Introduction

Wheat (Triticum aestivum L.) is one of the most important staple foods consumed globally [1], contributing 20% of the caloric and protein intake of the human population [2]. Wheat productivity is hindered by the climate change that represents danger for food security due to increased extreme weather events leading to abiotic stresses such as floods, drought, and heat stress [3]. Climate change scenarios predict increasing occurrences of irregular rainfall, whereas the frequency of drought is certain to increase in the future as a result of global warming, which will result in a decline in overall food production. For example, grain yield reductions for wheat are predicted to range from 25 to 50%, depending on latitude and different soil properties and agronomical management features [4]. In the sowing structure of Croatia, wheat is the second most represented crop, sown on approximately 161,000 hectares in 2022 [5]. According to the Global Facility for Disaster Reduction and Recovery, there is an up to 20% chance that droughts will occur in the next ten years in Croatia. Worldwide, drought stress is already considered a major limitation of crop productivity [6], and affects crop quality as well [7]. According to the study by Nouri-Ganbalani et al. [8], grain yield can decrease by up to 70% due to drought. Further, conditions of reduced water by 40% resulted in grain yield decreasing by 20.6% [9]. A risk assessment of the possible impacts of climate change on wheat grain quality in an irrigated area showed that grain protein content decreased between 7.3% and 27.2% [10].
Drought can occur at all stages of wheat growth, with various consequences depending on the growth stage or drought intensity [11,12], but drought occurrence is more critical during the flowering and grain-filling stages, resulting in significant grain yield losses [13]. Drought is expected as a result of prolonged water deficiency, but drought-tolerant plants maintain high internal water content [14]. Therefore, the morpho-physiological traits of plants that improve vegetative growth and root development are used to increase drought resistance [15], but these traits do not guarantee higher grain yields in terminal drought conditions [16,17].
On the other hand, increasing rainfall and carbon dioxide (CO2) concentrations are beneficial for crop production to some extent, but high temperatures may diminish this effect [18]. It is well known that temperature and water play an important role in the spread of pathogens and insects. It seems that an increase in rainfall enhances pathogen life cycles and helps in pathogen colonization and growth during initial infection [19]. Temperature and rainfall alone are not the only factors influencing wheat grain yields. Higher levels of CO2 in the atmosphere have a positive effect on photosynthesis and water retention, as the CO2 assimilated by the photosynthetic apparatus is the basis of crop production, whereas the Calvin cycle reactions of photosynthetic CO2 fixation take place in the chloroplast stroma [20]. Also, in the last few years, many areas of the world have been faced with serious ozone (O3) pollution [21]. O3 not only affects the health of the human population, but also affects the photosynthesis of crops, resulting in a decrease in crop yields [22]. The primary determinant of grain yield could be the cumulative rate of photosynthesis over the vegetative season. It has been reported that even small increases in the rate of net photosynthesis can translate into large increases in biomass, and hence grain yield, since carbon assimilation is integrated over the entire vegetative season of wheat plants [23]. Hence, a positive correlation between grain yield and net photosynthetic rate has been reported previously [24]. Improvements in photosynthesis to increase grain yields within climate change scenarios should become one of the main targets in wheat breeding [25]. For example, according to the recent research by Kubar et al. [26], fertilization with nitrogen resulted in increased leaf area and significantly prompted the photosynthetic rate, which resulted in an improvement in grain yield. In addition, plants exhibit genetic variations in photosynthetic response under abiotic and biotic stresses [27,28]. When plants are exposed to disease stress factors, especially during the flowering stage, disruption in the photosynthetic apparatus can occur, causing a decrease in plant productivity and overall grain yield [29]. Some wheat genotypes showed a reduction in grain yield as a consequence of higher Fusarium head blight pressure due to increased precipitation during the anthesis stage [30].
Modern agriculture is faced with different climatic changes, and it needs faster selection for the creation of varieties with high, stable, and high-quality grain yields in different growing conditions. However, recognized winter wheat varieties cannot always guarantee high-quality grain crops. The solution to this problem can be obtained by the deeper study of photosynthetic activity (using chlorophyll a fluorescence measurements throughout the whole growing season in field conditions) of wheat plants and the use of indicators in selection. Therefore, the objectives of this study were to examine the effects of different weather conditions on photosynthetic parameters, grain yield, yield-related, and technological quality traits of six bread wheat varieties in two-year field experiments, as well to check the effects of photosynthesis on grain yield and quality of winter wheat.

2. Materials and Methods

2.1. Plant Material and Field Trial

Six winter wheat varieties (Rujana, Silvija, Fifi, Bubnjar, Anđelka, and Pepeljuga) from the Agricultural Institute Osijek were used for the experiment. They were previously characterized in the study of Duvnjak et al. [31]. This study was conducted at the experimental site of the Agricultural Institute Osijek (45°27′ N, 18°48′ E) during two growing seasons (2021/2022 and 2022/2023). The soil of the experimental site is eutric cambisol (Table 1). The previous crop was maize in the 2021/2022 growing season and soybean in the 2022/2023 growing season. In the basic fertilization in the first growing season, nitrogen, phosphorus, and potassium (NPK 0-20-30) were added in the amount of 400 kg ha−1, and urea (46% nitrogen) in the amount of 100 kg ha−1, while in the second season, 200 kg ha−1 NPK 7-20-30 and 100 kg ha−1 urea were applied. The field experiment was laid out in eight row plots 1.08 m wide and 7 m long with a surface area of plots 7.56 m2 in four replicates in a randomized complete block design. Through two fertilization events (growth stage 25 (GS 25) and GS 35), the total amount of 300 and 200 kg ha−1 calcium ammonium nitrate (CAN) was applied in the first and second growing seasons, respectively. The agro-technical measures used during this study are listed in Table 2. Fungicidal treatment was omitted.
The amount of rainfall (mm) and average temperatures (°C) during the two growing seasons (October 2021–June 2022 and October 2022–June 2023) are shown in Figure 1A, obtained from the Croatian Meteorological and Hydrological Service. The total accumulated rainfall during the first growing season was 440.8 mm with an average temperature of 9.3 °C. The total accumulated rainfall in the second growing season was 564.2 mm with an average temperature of 10.2 °C. The daily rainfall and temperatures at the time when chlorophyll a fluorescence was measured are shown in Figure 1B.
The measurements of chlorophyll a fluorescence were conducted at seven measurement points: 1st on 21 January (GS 23), 2nd on 2 February (GS 25), 3rd on 17 March (GS 32), 4th on 28 April (GS 47), 5th on 12 May (GS 59), 6th on 26 May (GS 69), and 7th on 6 June (GS 71) in both growing seasons. The growth stages were determined according to the growth stages of cereals [32]. After the seventh measurement point, parameters of chlorophyll a fluorescence were no longer measurable as the plants entered senescence. Wheat plants were harvested on 28 June in 2021/2022 and 30 June in 2022/2023 when grain moisture was below 14%.

2.2. Measurement of Agro-Morphological Traits

The barley yellow dwarf virus symptoms were scored at the tillering stage, while yellow rust incidence was scored at the beginning of the stem elongation stage. These traits were supplementary due to the high pressure of virus and yellow rust in the second growing season. Plant height was measured in cm from the ground to the top of spikes, excluding awns, whereas stem height was measured from the ground to the base of spikes. The differences between plant and stem height was used to calculate spike length (cm). The heading date was recorded when more than 50% of the wheat plants in the plot were in the anthesis stage. Harvesting was performed using a Wintersteiger grain harvester, with grains taken from the entire plot. Grain yield was recorded and corrected to 14% moisture and expressed in dt ha−1. Test weight (kg hL−1) was determined using a GAC 2100 (DICKEY-john, AUBURN, US), while the MARVIN grain analyzer (MARViTECH GmbH, Wittenburg, Germany) was used to calculate the 1000 kernel weight (g).

2.3. Measurement of Grain and Flour Quality Traits

Technological quality parameters were measured in the Wheat Quality Laboratory of the Department for Breeding & Genetics of Small Cereal Crops (Agricultural Institute Osijek). Protein content was measured with the Infratec 1241, Foss Tecator. Wet gluten content was determined using ICC method No. 155, while ICC method No. 116/1 and ICC method No. 107/1 were used to measure the Zeleny sedimentation volume and Hagberg falling number [33].

2.4. Chlorophyll a Fluorescence Measurement

The chlorophyll a fluorescence of leaves was measured seven times (1st measurement: main shoot and three tillers stage (GS 23); 2nd measurement: main shoot and five tillers stage (GS 25); 3rd measurement: second node detectable stage (GS 32); 4th measurement: flag leaf sheath opening stage (GS 47); 5th measurement: ear complete emergence above flag leaf ligule (GS 59); 6th measurement: flowering complete stage (GS 69); and 7th measurement: watery ripe stage (GS 71)) in both growing seasons in the time frame from January till June using the Plant Efficiency Analyser (Handy PEA, Hansatech, Pentney, UK). Before measurement, five representative leaves per plot were fully dark-isolated for 30 min by using a lightweight leaf clip shutter plate. The chlorophyll a fluorescence was induced with a saturated red light pulse (3200 µmol m−2 s−1, peak at 650 nm). Parameters were calculated with JIP test to calculate biophysical parameters that quantify the stepwise energy flow through Photosystem II (PSII). The parameters calculated and included in this study were: maximum quantum yield of primary photochemistry (TRO/ABS) and performance index on absorption basis (PIABS) [34,35]. The mean values of the two parameters were calculated from five measurements for each plot.

2.5. Statistical Analysis

For the agronomic and qualitative traits (grain yield, test weight, 1000 kernel weight, plant height, spike length, heading date, protein content, sedimentation value, wet gluten content, and Hagberg falling number), a combined analysis of variance (ANOVA) was performed over two years, whereas for the chlorophyll a fluorescence parameters (TRO/ABS and PIABS), ANOVA was combined over growing seasons and measurement points. Fisher’s least significant difference (LSD) test was used to compare trait means and Spearman’s rank correlation analysis was performed to determine the association among traits. The statistical analyses were performed using Statistica software (version 14.0). Principal component analysis was performed using Addinsoft XLSTAT (New York, NY, USA).

3. Results

The analysis of variance (ANOVA) for agro-morphological and quality traits showed a significant effect of variety (V) for all traits, a significant effect of year (Y) for all traits except protein content and wet gluten content, and a significant V × Y interaction for all traits except 1000 kernel weight (Table 3). Due to significant differences between years, the results will be presented separately for each growing season.
Analysis of variance for photosynthetic parameters showed a significant effect of measurement point (M) and a significant Y × M interaction for TRO/ABS, whereas for PIABS variety, year, and measurement point, as well as V × M, Y × M, and V × Y × M, interactions were significant (Table 4).

3.1. Agro-Morphological and Technologically Quality Traits in 2021/2022 Vegetative Season

In the 2021/2022 growing season, the highest grain yield was recorded for the varieties Bubnjar (104.0 dt ha−1) and Rujana (102.5 dt ha−1), while the lowest grain yield was recorded for variety Anđelka (88.8 dt ha−1) (Figure 2A). Varieties Silvija (98.3 dt ha−1), Fifi (97.6 dt ha−1), and Pepeljuga (97.1 dt ha−1) had a significantly lower grain yield, compared to Bubnjar.
The highest test weight (86.5 kg hL−1) was observed in Fifi, followed by Rujana (85.9 kg hL−1), while Anđelka had a significantly lower test weight (81.8 kg hL−1), compared to all other varieties (Figure 2B).
The 1000 kernel weight of the variety Bubnjar was 43.4 g, which was significantly higher than the 1000 kernel weight of Fifi (39.8 g), Silvija (39.0 g), Pepeljuga (34.3 g), and Anđelka (31.6 g) (Figure 2C). The heading date of Bubnjar (May 10) was two days after the earliest heading date of Fifi and Anđelka (8), and two days earlier from the latest heading date of Rujana (12) (Figure 2D). The highest plant height (100.3 cm) was observed in Rujana, followed by Bubnjar (93.5 cm), while Anđelka had the lowest plant height (69.3 cm), which was significantly different from the other varieties (Figure 2E). The highest spike length (20.5 cm) was recorded in Pepeljuga, followed by Anđelka (20.0 cm), while varieties Bubnjar, Rujana, Silvija, and Fifi had significantly different spike length from the previous two varieties (Figure 2F).
Protein content in grains was highest in Fifi (14.5%) and Rujana (14.4%), and lowest in Bubnjar (13.5%), whose protein content was not significantly different from the protein content of Pepeljuga and Anđelka (Figure 3A). The sedimentation value was the highest in Bubnjar (42.0 mL) and Silvija (40.5 mL) (Figure 3B). Rujana had the highest wet gluten content (33.2%), which was significantly different from that of all other varieties, of which Bubnjar had the lowest value (27.1%) (Figure 3C). The Hagberg falling number was highest in Bubnjar (350.8 s), followed by Fifi (333.8 s), and the lowest falling number was observed in Rujana (305.5 s) (Figure 3D).

3.2. Agro-Morphological and Technological Quality Traits in 2022/2023 Vegetative Season

During tillering in 2022/2023, all varieties were affected by the barley yellow dwarf virus to a similar extent, with incidence ranging from 2.3% in Anđelka to 4.8% in Silvija (Table 5). On the other hand, a greater variation was observed among varieties in the incidence of yellow rust during the stem elongation stage, ranging from 0% (Bubnjar) to 90% (Anđelka). In the previous growing season, there were no visible symptoms of barley yellow dwarf virus or yellow rust, so the varieties were not screened for symptoms. Further, a reduction in grain yield was observed in all varieties in the 2022/2023 growing season compared to 2021/2022, with a mean reduction of 46.4% (Table S1).
In the second growing season, the highest grain yield was recorded for the variety Bubnjar (64.6 dt ha−1), followed by Silvija (61.1 dt ha−1) (Figure 4A). Grain yield of Rujana and Pepeljuga was not significantly different from Silvija, but was significantly different from Bubnjar. The lowest grain yield was recorded for the variety Anđelka (28.7 dt ha−1). The highest test weight was recorded in Pepeljuga (84.6 kg hL−1), and the lowest in Anđelka (72.3 kg hL−1) (Figure 4B). The highest 1000 kernel weight was observed in Bubnjar (39.1 g) and Rujana (38.5 g), while Pepeljuga (27.4 g) and Anđelka (25.2 g) had the lowest 1000 kernel weight (Figure 4C). The latest heading date was recorded for Bubnjar (9 May) and Rujana (9 May), followed by Silvija (8 May), Pepeljuga (8 May), Anđelka (3 May), and Fifi (3 May) (Figure 4D). The highest plant height (111.3 cm) was recorded in Rujana and Bubnjar (103.8 cm), followed by Silvija and Fifi, while Pepeljuga and Anđelka had the lowest plant heights (79.0 and 77.3 cm, respectively) (Figure 4E). The spike length of the variety Pepeljuga (13.0 cm) was significantly greater than the spike length of all other varieties (Figure 4F).
Protein content in grains was the highest (14.9%) in Pepeljuga, followed by Fifi and Anđelka, while the lowest protein content (13.2%) was observed in Bubnjar (Figure 5A). The sedimentation value was highest in Pepeljuga (49.4 mL), followed by Bubnjar (42.0 mL) and Silvija (42.0 mL), while the lowest sedimentation value was found in Fifi (38.5 mL) and Rujana (36.8 mL) (Figure 5B). Pepeljuga and Rujana had the highest wet gluten content (33.0 and 31.2%, respectively), although that of Rujana was not significantly different from the wet gluten content of Fifi and Anđelka, while Bubnjar had the lowest wet gluten content (24.7%) (Figure 5C). The Hagberg falling number was highest in Fifi (322.8 s) followed by Anđelka (318.5 s), while the lowest falling number was observed for Pepeljuga (302.3 s) (Figure 5D).

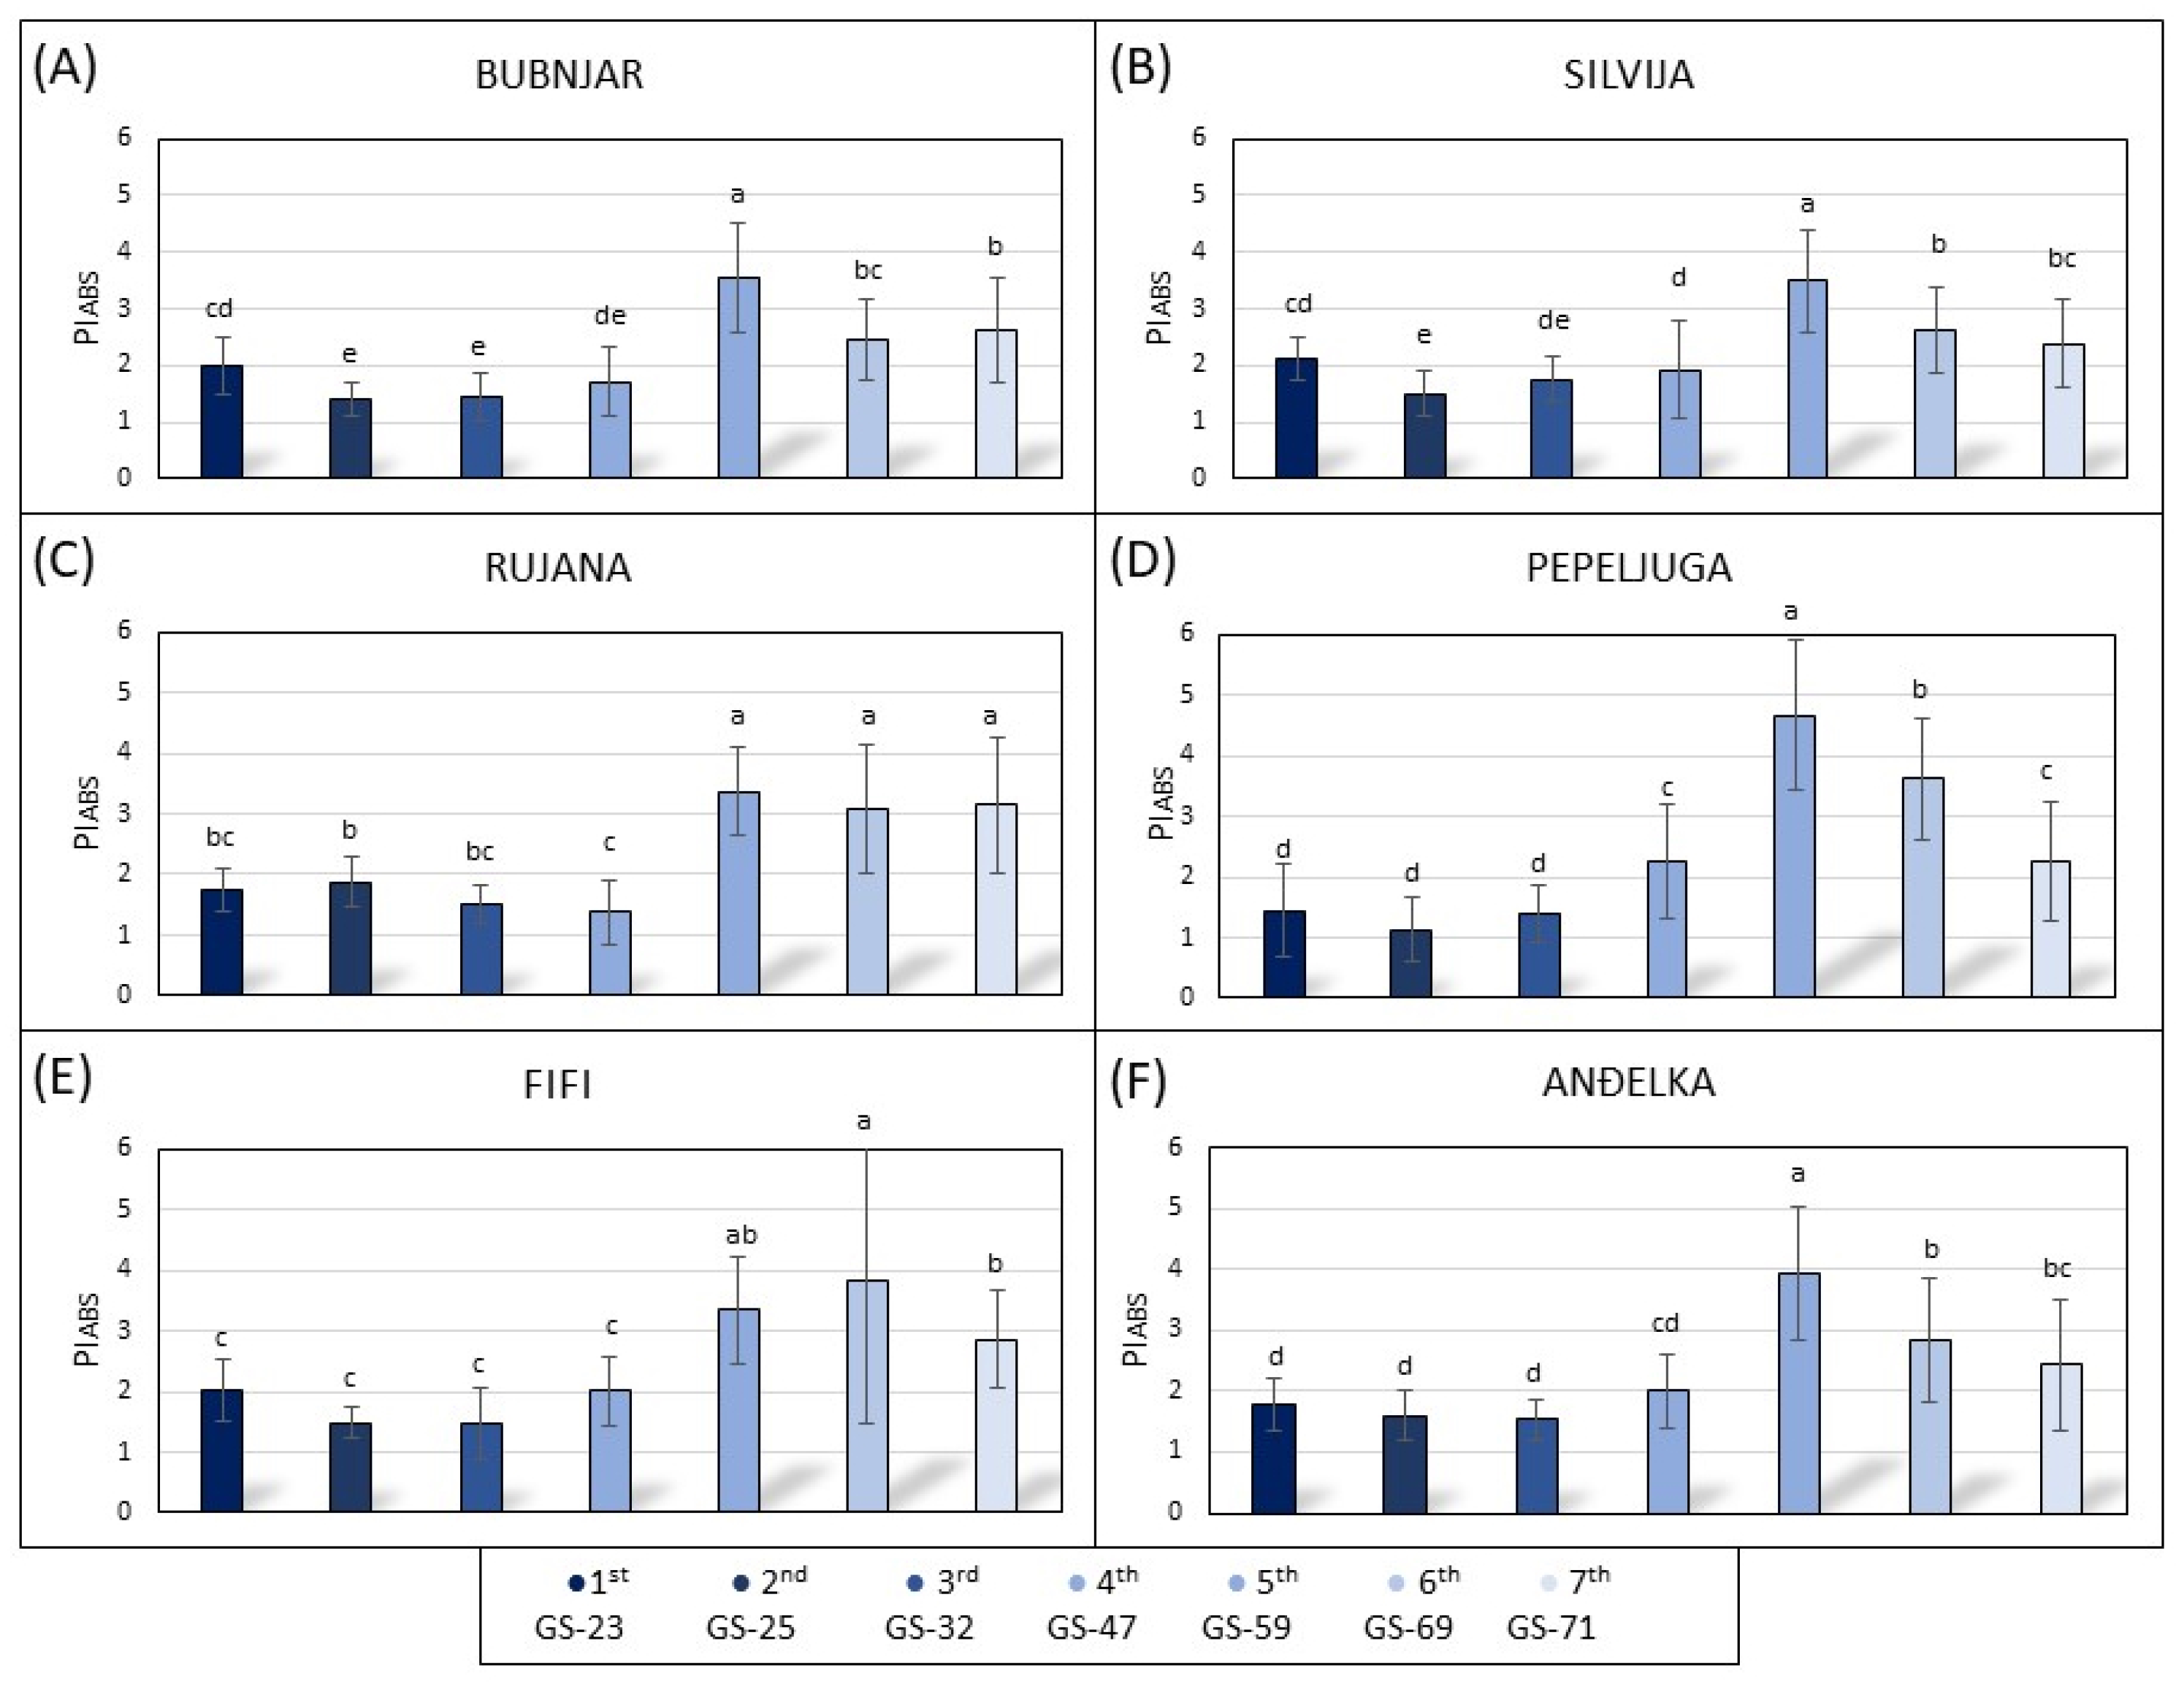
3.3. Photosynthetic Parameters of the Leaves during the 2021/2022 Growing Season

In the 2021/2022 growing season, all wheat varieties had a significant gradual increase in TRO/ABS from the 1st to the 3rd measurement point, except the variety Bubnjar, where the values of TRO/ABS remained at the same level at the 2nd and 3rd measurement points (Figure 6A–F). Further, Bubnjar, Rujana, Pepeljuga, and Anđelka kept TRO/ABS at the same level at the last three measurements, while Silvija significantly reduced it at the last measurement point (7th), compared to the previous one (6th). It is also evident that Rujana, Fifi, and Anđelka significantly increased TRO/ABS at the 7th measurement point, compared to the 2nd measurement point, Bubnjar and Pepeljuga significantly increased it compared to the 4th and 3rd measurement points, while Silvija significantly increased it at the 7th measurement point, compared to the 6th. All varieties significantly increased TRO/ABS at the 7th measurement point, compared to the 1st measurement point.
The variety Bubnjar had PIABS at the same level at the 2nd and 3rd measurement, while Rujana remained the values of PIABS at the same level at the 1st and 2nd measurement (Figure 7A,B). Silvija and Fifi significantly gradually increased PIABS from the 1st to the 3rd measurement point, Pepeljuga to the 4th, and Anđelka to the th measurement point (Figure 7C–F). It can also be seen that only variety Fifi kept the PIABS value at the same level from the 3rd to the 5th measurement point. All varieties significantly decreased PIABS at the last measurement point (7th) compared to the previous one (6th).

3.4. Photosynthetic Parameters of the Leaves during the 2022/2023 Growing Season

In the 2022/2023 growing season, a significant decrease in TRO/ABS was observed at the 3rd measurement, compared to the 1st measurement in the varieties Bubnjar, Silvija, Rujana, and Anđelka (Figure 8A–C,F). All varieties significantly increased it at the 5th measurement point, compared to the 1st, except Pepeljuga (Figure 8A–F). All varieties significantly decreased TRO/ABS at the last measurement point (7th) compared to the 5th, except Fifi.
The PIABS value significantly decreased at the 2nd measurement point compared to the 1st in varieties Bubnjar and Silvija, while other varieties remained PIABS at the same level during the first three measurements (Figure 9A–F). At the 5th measurement point, all varieties significantly increased PIABS, compared to the previous measurements. Further, Bubnjar, Silvija, Pepeljuga, and Anđelka significantly decreased it at the 6th measurement point, compared to the 5th, while Fifi and Rujana kept it at the same level. Only Fifi and Pepeljuga significantly decreased it at the 7th measurement point, compared to the 6th.

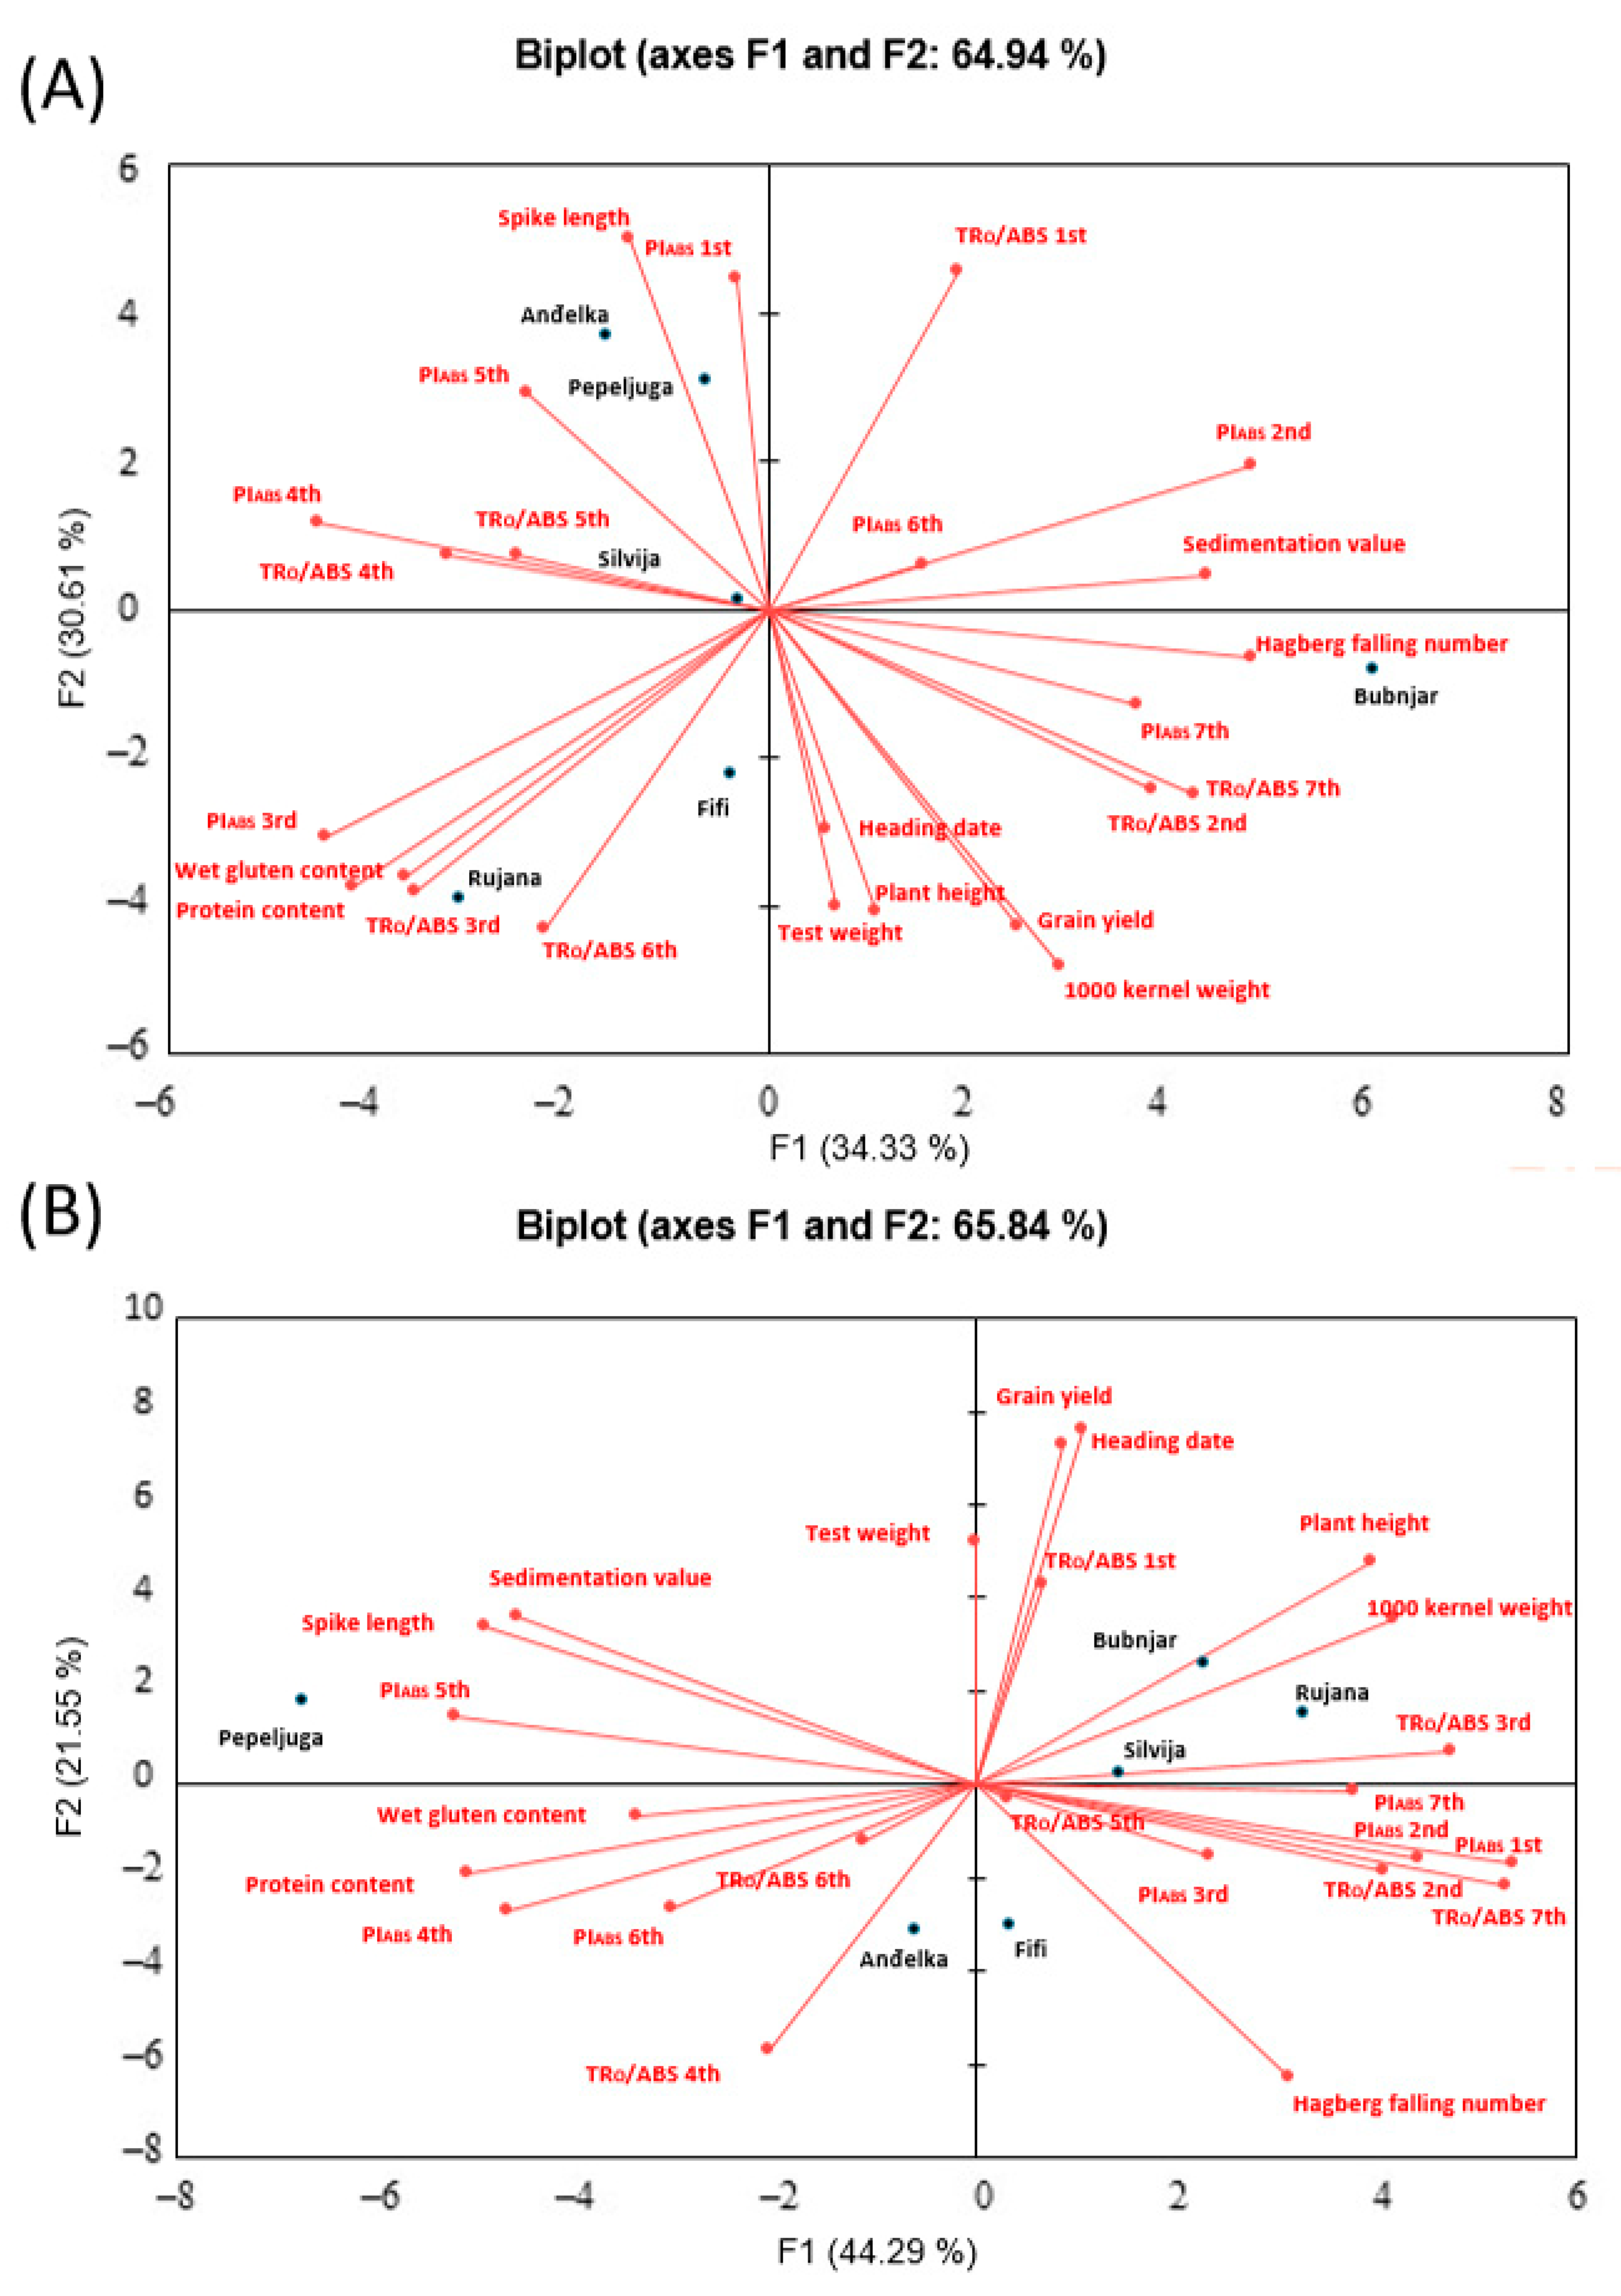
3.5. Correlation between Traits

The principal component analysis (PCA) and correlation analysis for the 2021/2022 and 2022/2023 growing seasons are presented in Figure 10A and Figure 10B, Table S2 and Table S3, respectively.
In the 2021/2022 growing season, the 1000 kernel weight, heading date, and TRO/ABS (2nd, measured on 2 February) were found to be significantly positively correlated with grain yield, as was PIABS (3rd, measured on 17 March) with test weight (Figure 10A; Table S2). There was also a positive correlation of TRO/ABS (2nd and 7th, measured on 2 February and 6 June) with 1000 kernel weight, TRO/ABS (2nd, measured on 2 February) with plant height and heading date, and PIABS (1st and 5th, measured on 21 January and 26 May) with spike length. Protein content showed a positive correlation with wet gluten content and TRO/ABS (6th, measured on 26 May), but a negative correlation with PIABS (2nd, measured on 2 February). In addition, sedimentation value was significantly negatively correlated with PIABS (4th, measured on 28 April), but positively correlated with falling number. Wet gluten content was also significantly positively correlated with TRo/ABS and PIABS (3rd, measured on 17 March), but negatively correlated with PIABS (2nd, measured on 2 February). TRO/ABS (1st, measured on 21 January) and PIABS (2nd, measured on 2 February) were significantly negatively correlated with TRO/ABS (6th, measured on 26 May). A positive correlation was found between TRO/ABS and PIABS at the 3rd measurement (measured on 17 March), and between PIABS in the 1st and 5th measurement (measured on 21 January and 12 May). In the 2022/2023 growing season, a significant negative correlation was observed between grain yield and TRO/ABS (4th, measured on 28 April), while 1000 kernel weight was in positive correlation with plant height and TRO/ABS (2nd, measured on 2 February) and negatively correlated with PIABS (4th, measured on 28 April) (Figure 10B; Table S3).
Plant height was in positive correlation with TRO/ABS (2nd, measured on February 2), but negatively correlated with PIABS (4th, measured on 28 April). Heading date correlated negatively with TRO/ABS (4th, measured on 28 April), as did spike length with Hagberg falling number and PIABS (1st, measured on 21 January). Protein content correlated negatively with TRO/ABS (3rd, measured on 17 March), and positively with PIABS (4th, measured on 28 April), while sedimentation value correlated negatively with PIABS (7th, measured on 6 June) and TRO/ABS (7th, measured on 6 June). Wet gluten content correlated positively with PIABS (6th, measured on 26 May). TRO/ABS (1st, measured on 21 January) was in positive correlation with TRO/ABS (3rd, measured on 17 March), while TRO/ABS (2nd, measured on 2 February) showed a positive correlation with TRO/ABS (7th, measured on 6 June) and PIABS (7th, measured on 6 June), but a negative correlation with PIABS (4th, measured on 28 April) along with TRO/ABS (3rd, measured on 17 March).

4. Discussion

Wheat productivity is highly influenced by climate changes. Both temperature and rainfall variations have a significant impact on plants’ phenology [36]. One of the most effective adaptation strategies to climate change is the development of new genetic wheat varieties with improved tolerance to biotic and abiotic stresses, where plants could take advantage of periods of optimal temperatures and rainfall [37]. It is believed that the efficiency of photosynthetic energy conversion could be increased under field conditions [38], thereby contributing to a higher grain yield [39]. To analyze the relationship between photosynthesis and other investigated traits, we systematically measured photosynthesis-related parameters in a time-course manner in six winter wheat varieties.

4.1. Vegetative Season 2021/2022

In the 2021/2022 growing season, after sowing, an increase in rainfall was recorded, compared to the multi-year average, but this trend did not continue during the growing season. From January to April in 2022, a rainfall deficit was recorded, so this period was declared dry. This period includes root growth, leaf emergence on the main shoot, tillering, and the beginning of the stem elongation stage. However, despite this four-month long drought period, wheat plants were likely able to absorb water from the soil reserves accumulated during the previous period (October to December 2021), which allowed them to achieve normal development of tillers and stem elongation. A recent study has shown that adequate levels of soil water storage in the early stage can ensure the promotion of tillering in winter wheat, and finally increase the effective number of tillers to increase the grain yield [40]. This could especially be the case for the varieties Bubnjar and Rujana, previously declared drought tolerant [31], which in the 2021/2022 growing season had higher grain yields (above 100 dt ha−1) than the other four varieties with yields between 88 and 98 dt ha−1. Therefore, the observed differences in grain yield among the six varieties could be, to some extent, the result of their different tolerance to drought. According to the previous research of Eitzinger et al. [41], drought has significant negative effects on the grain yield of winter wheat, especially during the flowering and grain-filling stages. Furthermore, drought stress during the flowering stage can negatively impact net photosynthetic rate, reduce the period of photosynthesis, and considerably increase flag leaf senescence [42]. In the current study, drought was not pronounced during the flowering period through April–June in 2022. Obembe et al. [1] reported that a one cm reduction in precipitation from the average decreases grain yield by 1.35% in the fall, 1.11% in the winter, and 0.3% in the spring. Due to climate changes in Southern Europe, the increase in temperatures accompanied by drought intervals have resulted in a reduction in wheat yield of about 5% [43].
The correlation matrix showed that grain yield was significantly positively correlated with 1000 kernel weight and plant height, which was consistent with previous studies [44,45,46]. Further, grain yield was significantly correlated with TRo/ABS at the 2nd measurement that coincides with tillering stage. The previous study indicated that enhanced photosynthesis, even at the level of a single leaf, may increase plant yields [47]. Tillering is the stage when plants start to produce side shoots (tillers), which are very important for wheat productivity [48]. This growth stage is controlled by the environment from the three-leaf stage to the jointing stage (GS 13–GS 30). The tillering stage depends on the genetic background, and it has previously been observed that fertile tillers per plant are associated with more total shoots initiated, faster tillering rate, delayed tillering onset, and higher survival [49]. It is believed that the growth of tillers is regulated by the concentration and ratio of phytohormones such as indole-3-acetic acid (IAA), abscisic acid (ABA), and zeatin (ZT) in tiller nodes [50]. ABA application reduced the effect of drought stress, increased photosynthetic parameters, and decreased the decline in the functions of photosystem II [51]. It is important that those tillers first initiated at the plant will always have an advantage in growth and development, compared to those initiated later [48]. In the current research, from January to April in 2022, there was a lack of precipitation and it can be assumed that plants were in mild drought stress not in strong one as a result of sufficient water accumulation in the soil in previous months. High yield is still possible even if there is less precipitation during the growing season [52]. In a previous study of Duvnjak et al. [31], ABA was increased under drought stress, suggesting its role as a hormone involved in the regulation of stress response, such as the increase in the number of leaves and tillers in drought stress conditions, and further maintaining turgor pressure and osmotic adjustment in leaves. In the same study, the ABA increase was particularly pronounced in the variety Bubnjar. In the current study, the same variety was the most yielding and also the only variety where TRO/ABS and PIABS remained at the same level during the 2nd and 3rd measurements. We can assume that Bubnjar maintained lower photosynthetic activity during that phase, compared to other varieties, thus enabling more productive tillering. It was previously concluded that more drought-tolerant wheat varieties could conserve water content in photosynthetic tissue, that in our case are represented by the leaves, where evapotranspiration water losses could be less pronounced [53]. This means that all wheat varieties, except Bubnjar, accelerated photosynthesis during tillering and probably went through this stage faster than in Bubnjar. Also, Bubnjar had the highest 1000 kernel weight. This could also be explained by the fact that tillers with a larger leaf area will produce more kernels, heavier kernels, and are less likely to be lost due to tiller mortality [48]. The 1000 kernel weight strongly correlated with the values of TRO/ABS at the 2nd measurement, but also at the last (7th) measurement, which coincided with the grain-filling stage. Zhang et al. [54] suggested that increasing flag leaf photosynthesis improves the 1000 kernel weight, contributing to high grain yield.
Plant height and grain yield were also significantly positively correlated, and it was observed that the two highest yielding varieties (Bubnjar and Rujana) were also the tallest. This was in accordance with the research of Mahdy et al. [55], while Spanic et al. [56] reported a negative correlation between plant height and grain yield, but in the case of very tall varieties used in the past.
Further, the current study showed that the highest yielding varieties were the latest in maturity, as the heading date was in significant positive correlation with plant height, which in turn was positively correlated with grain yield. Heading date is critical as this is the stage immediately followed by flowering that could be delayed and reproductive development accelerated, resulting in reduced grain-filling [57]. It is interesting to note that the heading date was closely related to TRO/ABS at the 2nd measurement, but also with the grain yield, 1000 kernel weight, and plant height. It was observed that spike length was significantly positively correlated with PIABS at the 1st and 5th measurement. Zhou et al. [58] did not found a significant difference between the spike length and spikelet number of two wheat varieties, although they differed in the number of grains per spike and therefore greater total grain volume per spike.
Protein content and wet gluten content were significantly positively correlated, which was in line with the previous research of Kaushik et al. [59], as the gluten–protein complex is derived from the storage proteins of wheat grain. However, the correlation matrix showed that protein content was strongly positively correlated with TRO/ABS at the 6th measurement, which coincided with the beginning of the grain-filling stage. This was expected since proteins are formed at this stage [60]. In addition, the higher sedimentation values indicate a high protein quantity and/or stronger gluten [61]. It was observed that the sedimentation value was in significant positive correlation with the Hagberg falling number, which is an indicator of α-amylase activity. In the study of Laidig et al. [62], there were strong relationships between protein content, sedimentation value, and loaf volume.

4.2. Vegetative Season 2022/2023

In contrast to the first growing season, in the second growing season (2022/2023), significantly less rainfall was recorded at the time of sowing. According to the previous research of Iizumi and Ramankutty [63], wheat sowing under severe drought has the shortest grain-filling duration. However, in the present study, a higher amount of rainfall was recorded from November 2022 to May 2023, compared to the multi-year average.
Although increased amounts of rainfall were recorded, grain yield drastically decreased in all varieties studied, largely owing to a sharp increase in leaf and spike diseases associated with a high incidence of aphids in the autumn, which are vectors of barley yellow dwarf virus and weakened the plants already in the autumn. Aphids have been reported to be responsible for transmitting 50% of the virus [64] and virus infection reduced grain yield in wheat by up to 84% [65]. In the current study, disease development was favored by large amounts of rainfall during April and May 2023. In addition, high pressure of yellow or stripe rust (Puccinia striiformis) was recorded starting from April. It was concluded that yellow rust can cause more than a 25% reduction in grain yield [66]. Other studies have reported 10–16% grain yield losses due to diseases and pests [67,68]. In addition, yellow rust, Septoria spp. were present throughout the growing season, and furthermore, Fusarium head blight (FHB) occurred during flowering, but data for FHB and Septoria attacks are not shown due to the severe attack of yellow rust. The frequency of either very wet days (>10 mm rainfall) or consecutive wet days (three days with at least 1 mm of rain) during the early growth of the wheat crop has been found to be one of the most important factors in the distribution of Septoria tritici [69]. Grain yield losses can reach 25 to 50% under severe epidemics with Septoria spp. [70]. FHB infection was also expected in the current study as a result of the increased temperatures and rainfall in April and May 2023, as the most susceptible period for Fusarium infection of wheat is the flowering stage, with optimal temperatures for infection between 20 and 25 °C and moisture content of 95% [71]. Further, FHB-infected grains become shriveled thus reducing grain yield and quality of wheat [72].
TRo/ABS at the 4th measurement was in significant negative correlation with grain yield, indicating that lower TRO/ABS at this stage resulted in higher grain yields. The stage at the 4th measurement corresponds with the stem elongation when severe infection with yellow rust occurred. This is also the stage when the transition from the vegetative to the reproductive stage occurs and when spikelet primordiums are formed, showing its importance for spike development [31]. It is likely that the varieties that retained TRO/ABS at lower rates during this period maintained the energy for the generative development stage. It has been previously reported that the number of spikelets and grains will be reduced when stress occurs in the stem elongation stage [73]. Three varieties (Bubnjar, Silvija, and Rujana) showed the lowest increase in TRO/ABS from the 3rd to the 4th measurement, compared to other varieties with a lower grain yield. The presence of any type of stress can inactivate or damage PSII, leading to a decrease in TRO/ABS [29]. However, a drastic decline in the activities of PSII and PSI was not the case for any of the varieties that could inhibit photosynthesis in the last four measurements.
Further, varieties Bubnjar, Silvija, and Rujana had higher 1000 kernel weight, plant height, and were later in maturity. Heading dates showed a negative correlation with TRO/ABS at the 4th measurement where those varieties that were later in maturity could have escaped virus/disease pressure more efficiently than earlier varieties. Further, the varieties with the highest grain yield (Bubnjar, Silvija, and Rujana) showed an increase in PIABS, or a slight decrease in the case of Silvija, from the 6th to the 7th measurement, compared to other varieties showing a pronounced decrease between these two measurements. In the previous research, it was reported that longer integrity of functional PSII units and extended preservation of the optimal level of energetic connectivity among PSII units during grain filling resulted in better agronomic performance [28]. Higher grain yield resulted from increased 1000 kernel weight, which could be related to the source/sink ratio established during the early grain-filling stage [74]. Usually, high or low photosynthetic activity may be used as a very important quality indicator in wheat varieties. Furthermore, photosynthetic efficiency is especially important during flowering and the early grain-filling stage as its reduction at these stages can lead to spikelet sterility and lower grain yield [29]. Also, it was reported that 70% of grain yield is produced by photosynthesis in leaf and spike tissues after the heading stage [75]. In the current study, biotic stress as a result of viral and disease attack occurred much earlier than the heading stage began (around stem elongation stage due to yellow rust pressure). After this stage, varieties with better photosynthetic efficiency were able to save up energy better.
The lowest protein content was observed in Bubnjar, Rujana, and Silvija, which was to be expected, since these varieties were the most yielding. It is very well known that higher grain yields are associated with lower protein concentration [76]. It is difficult to achieve high grain yield and high protein content at the same time, because of the negative correlation between these two traits [77,78,79]. It is hypothesized that the negative correlation is the result of competition between carbon and nitrogen for energy [80] and the dilution effect of nitrogen by carbon-based compounds [81]. However, based on the observed negative correlation between TRO/ABS at the 3rd measurement during tillering and PIABS at the last measurement (7th) in the dough stage, it can be assumed that photosynthesis had an influence on protein formation, especially at the last measurement. This could also be observed for the sedimentation value, which negatively correlated with the parameters of photosynthesis at the last measurement (7th). It has previously been found that stress during the grain-filling stage in wheat significantly modified kernel traits, grain protein content, and composition [82]. In the current study, temperatures during June were above the 33-year average, which could result in a decline in technological quality. It has been observed that heat stress (>27 °C) is common during the grain-filling stage that deteriorates cellular organelles and reduces photosynthesis [83].

5. Conclusions

In both years, Bubnjar, Rujana, and Silvija may have delayed leaf senescence during the reproductive period, resulting in a higher 1000 kernel weight and grain yield. In this experiment, we determined that grain yield was in a significant positive correlation with 1000 kernel weight and TRO/ABS at the 2nd (GS 25) and the 7th measurement points (GS 71) in the first growing season. In addition, our results showed that the variety Bubnjar was the highest yielding (104.0 dt ha−1) and the only variety where TRO/ABS and PIABS remained at the same level at the 2nd and 3rd measurement (GS 32), which coincided with the tillering stage when a mild drought was recorded. In the second growing season (2022/2023), grain yield drastically decreased (46.4% for all varieties together), compared to the first one, due to infestations of leaf and ear diseases on plants already weakened by viruses in this season. Furthermore, our results indicated that the varieties with the highest grain yield showed the smallest change in PIABS from the 6th (GS 69) to the 7th measurement, compared to the other varieties. Overall, grain yield, 1000 kernel weight, plant height, and heading date were positively associated. Increased knowledge about the extent of genetic variation in the chlorophyll fluorescence will increase our understanding of wheat adaptations in relation to different weather conditions. Understanding the physiology of wheat in future investigations will also aid in the identification of better and more stable varieties for adaptation to stressed environments.

Supplementary Materials

The following supporting information can be downloaded at: https://www.mdpi.com/article/10.3390/agronomy14030478/s1, Table S1: Reduction in grain yield in the 2022/2023 relative to the 2021/2022 growing season; Table S2: Spearman’s rank correlation coefficients between twenty-four traits in 2021/2022 growing season; Table S3: Spearman’s rank correlation coefficients between twenty-four traits in 2022/2023 growing season.

Author Contributions

Conceptualization, V.S.; methodology, V.S. and J.D.; software, J.D.; validation, J.D. and Z.K.; formal analysis, J.D. and V.S.; investigation, J.D. and V.S.; resources, V.S. and H.S.; data curation, J.D.; writing—original draft preparation, J.D.; writing—review and editing, V.S., Z.K. and H.S.; visualization, J.D.; supervision, H.S., Z.K. and V.S.; project administration, V.S. All authors have read and agreed to the published version of the manuscript.

Funding

The work of doctoral student Jurica Duvnjak was supported in part by the “Young researchers’ career development project—training of doctoral students” of the Croatian Science Foundation. This research was funded by European Union, who provided the EUROPEAN REGIONAL DEVELOPMENT FUND, grant number K.K.01.1.1.04.0067 and by the European Union—NextGenerationEU.

Data Availability Statement

The datasets used and analyzed during the current study are available from the corresponding author on reasonable request.

Conflicts of Interest

The authors declare no conflicts of interest.

References

  1. Obembe, O.S.; Hendricks, N.P.; Tack, J. Decreased wheat production in the USA from climate change driven by yield losses rather than crop abandonment. PLoS ONE 2021, 16, e0252067. [Google Scholar] [CrossRef]
  2. Cosgrove, D.J. Expanding wheat yields with expansin. New Phytol. 2021, 230, 403–405. [Google Scholar] [CrossRef] [PubMed]
  3. Anderson, R.; Bayer, P.E.; Edwards, D. Climate change and the need for agricultural adaptation. Curr. Opin. Plant Biol. 2020, 56, 197–202. [Google Scholar] [CrossRef] [PubMed]
  4. Mereu, V.; Gallo, A.; Trabucco, A.; Carboni, G.; Spano, D. Modeling high-resolution climate change impacts on wheat and maize in Italy. Clim. Risk Manag. 2021, 33, 100339. [Google Scholar] [CrossRef]
  5. Croatian Bureau of Statistics. Available online: https://podaci.dzs.hr/2022/hr/29384 (accessed on 23 May 2023).
  6. Onyemaobi, O.; Sangma, H.; Garg, G.; Wallace, X.; Kleven, S.; Suwanchaikasem, P.; Roessner, U.; Dolferus, R. Reproductive stage drought tolerance in wheat: Importance of stomatal conductance and plant growth regulators. Genes 2021, 12, 1742. [Google Scholar] [CrossRef]
  7. Waraich, E.A.; Ahmad, R.; Ashraf, M.Y. Role of mineral nutrition in alleviation of drought stress in plants. Aust. J. Crop Sci. 2011, 5, 764–777. [Google Scholar]
  8. Nouri-Ganbalani, A.; Nouri-Ganbalani, G.; Hassanpanah, D. Effects of drought stress condition on the yield and yield components of advanced wheat genotypes in Ardabil, Iran. J. Food Agric. Environ. 2009, 77, 228–234. [Google Scholar]
  9. Daryanto, S.; Wang, L.; Jacinthe, P.A. Global Synthesis of Drought Effects on Maize and Wheat Production. PLoS ONE 2016, 11, e0156362. [Google Scholar] [CrossRef]
  10. Liu, J. Risk assessment of possible impacts of climate change and irrigation on wheat yield and quality with a modified CERES-Wheat model. J. Water Clim. Chang. 2021, 12, 2444–2459. [Google Scholar] [CrossRef]
  11. Tatar, O.; Bruck, H.; Asch, F. Photosynthesis and remobilization of dry matter in wheat as affected by progressive drought stress at stem elongation stage. J. Agron. Crop Sci. 2016, 202, 292–299. [Google Scholar] [CrossRef]
  12. Vukovic, R.; Stolfa Camagajevac, I.; Vukovic, A.; Sunic, K.; Begovic, L.; Mlinaric, S.; Sekulic, R.; Sabo, N.; Spanic, V. Physiological, biochemical and molecular response of different winter wheat varieties under drought stress at germination and seedling growth stage. Antioxidants 2022, 11, 693. [Google Scholar] [CrossRef]
  13. Farooq, M.; Hussain, M.; Siddique, K.H.M. Drought stress in wheat during flowering and grain-filling periods. Crit. Rev. Plant Sci. 2014, 33, 331–349. [Google Scholar] [CrossRef]
  14. Ntuli, T.M. Drought and desiccation-tolerance and sensitivity in plants. In Botany; IntechOpen: London, UK, 2012; pp. 29–60. [Google Scholar]
  15. Brodersen, C.; Jansen, S.; Choat, B.; Rico, C.; Pittermann, J. Cavitation resistance in seedless vascular plants: The structure and function of interconduit pit membranes. Plant Physiol. 2014, 165, 895–904. [Google Scholar] [CrossRef]
  16. Senapati, N.; Stratonovitch, P.; Paul, M.J.; Semenov, M.A. Drought tolerance during reproductive development is important for increasing wheat yield potential under climate change in Europe. J. Exp. Bot. 2019, 70, 2549–2560. [Google Scholar] [CrossRef]
  17. Khadka, K.; Earl, H.J.; Raizada, M.N.; Navabi, A. A physio-morphological trait-based approach for breeding drought tolerant wheat. Front. Plant Sci. 2020, 11, 715. [Google Scholar] [CrossRef]
  18. Malhi, G.S.; Kaur, M.; Kaushik, P. Impact of climate change on agriculture and its mitigation strategies. Sustainability 2021, 13, 1318. [Google Scholar] [CrossRef]
  19. Launay, M.; Caubel, J.; Bourgeois, G.; Huard, F.; Cortazar-Atauri, I.G.; Bancal, M.O.; Brisson, N. Climatic indicators for crop infection risk: Application to climate change impacts on five major foliar diseases in Northern France. Agric. Ecosyst. Environ. 2014, 197, 147–158. [Google Scholar] [CrossRef]
  20. Ainsworth, E.A.; Rogers, A. The response of photosynthesis and stomatal conductance to rising [CO2]: Mechanisms and environmental interactions. Plant Cell Environ. 2007, 30, 258–270. [Google Scholar] [CrossRef] [PubMed]
  21. Lu, X.; Hong, J.; Zhang, L.; Cooper, O.R.; Schultz, M.G.; Xu, X.; Wang, T.; Gao, M.; Zhao, Y.; Zhang, Y. Severe surface ozone pollution in China: A global perspective. Environ. Sci. Technol. 2018, 5, 487–494. [Google Scholar] [CrossRef]
  22. Xu, J.; Zhao, H.; Wang, S.; Zheng, Y.; Mai, B.; Zhang, X. Assessment of photosynthesis and yield loss of winter wheat under ground-level ozone exposure. Environ. Technol. Innov. 2023, 29, 103013. [Google Scholar] [CrossRef]
  23. Parry, M.A.J.; Reynolds, M.; Salvucci, M.E.; Raines, C.; Andralojc, P.J.; Zhu, X.G.; Price, G.D.; Condon, A.G.; Furbank, R.T. Raising yield potential of wheat. II. Increasing photosynthetic capacity and efficiency. J. Exp. Bot. 2011, 62, 453–467. [Google Scholar] [CrossRef]
  24. Yan, Y.; Hou, P.; Duan, F.; Niu, L.; Dai, T.; Wang, K.; Zhao, M.; Li, S.; Zhou, W. Improving photosynthesis to increase grain yield potential: An analysis of maize hybrids released in different years in China. Photosynth. Res. 2021, 150, 295–311. [Google Scholar] [CrossRef]
  25. Long, S.P.; Marshall-Colon, A.; Zhu, X.G. Meeting the global food demand of the future by engineering crop photosynthesis and yield potential. Cell 2015, 161, 56–66. [Google Scholar] [CrossRef]
  26. Kubar, M.S.; Alshallash, K.S.; Asghar, M.A.; Feng, M.; Raza, A.; Wang, C.; Saleem, K.; Ullah, A.; Yang, W.; Kubar, K.A.; et al. Improving Winter Wheat Photosynthesis, Nitrogen Use Efficiency, and Yield by Optimizing Nitrogen Fertilization. Life 2022, 12, 1478. [Google Scholar] [CrossRef]
  27. Katanic, Z.; Mlinaric, S.; Katanic, N.; Cosic, J.; Spanic, V. Photosynthetic efficiency in flag leaves and ears of winter wheat during Fusarium head blight infection. Agronomy 2021, 11, 2415. [Google Scholar] [CrossRef]
  28. Spanic, V.; Sunic, K.; Duvnjak, J.; Yin-Gang, H.; Katanic, Z. Chlorophyll a fluorescence during flag leaf senescence of field-grown winter wheat plants under drought conditions. Ann. Appl. Biol. 2023, 183, 80–92. [Google Scholar] [CrossRef]
  29. Spanic, V.; Mlinaric, S.; Zdunic, Z.; Katanic, Z. Field study of the effects of two different environmental conditions on wheat productivity and Chlorophyl fluorescence induction (OJIP) parameters. Agriculture 2021, 11, 1154. [Google Scholar] [CrossRef]
  30. Spanic, V.; Sarcevic, H. Evaluation of effective system for tracing FHB resistance in wheat: An editorial commentary. Agronomy 2023, 13, 2116. [Google Scholar] [CrossRef]
  31. Duvnjak, J.; Loncaric, A.; Brkljacic, L.; Samec, D.; Sarcevic, H.; Salopek-Sondi, B.; Spanic, V. Morpho-physiological and hormonal response of winter wheat varieties to drought stress at stem elongation and anthesis stages. Plants 2023, 12, 418. [Google Scholar] [CrossRef]
  32. Zadoks, J.C.; Chang, T.T.; Konzak, C.F. A decimal code for growth stages of cereals. Weed Res. 1974, 14, 415–421. [Google Scholar] [CrossRef]
  33. Spanic, V.; Cosic, J.; Zdunic, Z.; Drezner, G. Characterization of agronomical and quality traits of winter wheat (Triticum aestivum L.) for Fusarium head blight pressure in different environments. Agronomy 2021, 11, 213. [Google Scholar] [CrossRef]
  34. Strasser, R.J.; Srivastava, A.; Tsimilli-Michael, M. The fluorescent transient as a tool to characterise and screen photosynthetic samples. In Probing Photosynthesis: Mechanisms, Regulation and Adaptation; Yunus, M., Pathre, U., Mohanty, P., Eds.; CRC Press: New York, NY, USA, 2000; pp. 445–483. [Google Scholar]
  35. Strasser, R.J.; Tsimilli-Michael, M.; Srivastava, A. Analysis of the chlorophyll a fluorescence transient. In Chlorophyll a Fluorescence; Advances in Photosynthesis and Respiration; Springer: Dordrecht, The Netherlands, 2004; Volume 19. [Google Scholar]
  36. Piao, S.; Liu, Q.; Chen, A.; Janssens, I.A.; Fu, Y.; Dai, J.; Liu, L.; Lian, X.; Shen, M.; Zhu, X. Plant phenology and global climate change: Current progresses and challenges. Glob. Chang. Biol. 2019, 25, 1922–1940. [Google Scholar] [CrossRef] [PubMed]
  37. Prasad, P.V.V.; Bheemanahalli, R.; Jagadish, S.V.K. Field crops and the fear of heat stress-opportunities, challenges and future directions. Field Crops Res. 2017, 200, 114–121. [Google Scholar] [CrossRef]
  38. Reynolds, M.P.; Maarten van Ginkel, M.; Ribaut, J.M. Avenues for genetic modification of radiation use efficiency in wheat. J. Exp. Bot. 2000, 51, 459–473. [Google Scholar] [CrossRef]
  39. Slattery, R.A.; Ainsworth, E.A.; Ort, D.R. A meta-analysis of responses of canopy photosynthetic conversion efficiency to environmental factors reveals major causes of yield gap. J. Exp. Bot. 2013, 64, 3723–3733. [Google Scholar] [CrossRef] [PubMed]
  40. Li, C.; Liu, W.Z.; Lin, W.; Han, X.Y.; Zhou, L.; Wang, Y.P. Grain Yield and WUE Responses to Different Soil Water Storage before sowing and water supplies during growing period for winter wheat in the loess tableland. Sci. Agric. Sin. 2017, 50, 3549–3560. [Google Scholar]
  41. Eitzinger, J.; Štastná, M.; Žalud, Z.; Dubrovskỳ, M.A. Simulation study of the effect of soil water balance and water stress on winter wheat production under different climate change scenarios. Agric. Water Manag. 2003, 61, 195–217. [Google Scholar] [CrossRef]
  42. Wu, J.D.; Li, J.C.; Wei, F.Z.; Wang, C.Y.; Zhang, Y.; Sun, G. Effects of nitrogen spraying on the post-anthesis stage of winter wheat under waterlogging stress. Acta Physiol. Plant. 2014, 36, 207–216. [Google Scholar] [CrossRef]
  43. Moore, F.C.; Lobell, D.B. The fingerprint of climate trends on European crop yields. Proc. Natl. Acad. Sci. USA 2015, 112, 2670–2675. [Google Scholar] [CrossRef]
  44. Sharma, R.C.; Tiwary, A.K.; Ortiz-Ferrara, G. Reduction in kernel weight as a potential indirect selection criterion for wheat grain yield under terminal heat stress. Plant Breed. 2008, 127, 241–248. [Google Scholar] [CrossRef]
  45. Mohammadi, M.; Sharifi, P.; Karimizadeh, R.; Shefazadeh, M.K. Relationships between grain yield and yield components in bread wheat under different water availability (dryland and supplemental irrigation conditions). Not. Bot. Horti Agrobot. Cluj Napoca 2012, 40, 195–200. [Google Scholar] [CrossRef]
  46. Nofouzi, F. Evaluation of seed yield of durum wheat (Triticum durum) under drought stress and determining correlation amongsome yield components using path coefficient analysis. Cuad. Investig. 2018, 10, 179–183. [Google Scholar]
  47. Makino, A. Photosynthesis, grain yield, and nitrogen utilization in rice and wheat. Plant Physiol. 2011, 155, 125–129. [Google Scholar] [CrossRef]
  48. Tilley, M.S.; Heiniger, R.W.; Crozier, C.R. Tiller initiation and its effects on yield and yield components in winter wheat. Agron. J. 2019, 111, 1323–1332. [Google Scholar] [CrossRef]
  49. Xie, Q.; Mayes, S.; Sparkes, D.L. Optimizing tiller production and survival for grain yield improvement in a bread wheat × spelt mapping population. Ann. Bot. 2016, 117, 51–66. [Google Scholar] [CrossRef] [PubMed]
  50. Shang, Q.; Wang, Y.; Tang, H.; Sui, N.; Zhang, X.; Wang, F. Genetic, hormonal, and environmental control of tillering in wheat. Crop J. 2021, 9, 986–991. [Google Scholar] [CrossRef]
  51. Souza, T.; Magalhães, P.C.; Mauro de Castro, E.; Pereira de Albuquerque, P.R.; Marabesi, M.A. The influence of ABA on water relation, photosynthesis parameters, and chlorophyll fluorescence under drought conditions in two maize hybrids with contrasting drought resistance. Acta Physiol. Plant 2013, 35, 515–527. [Google Scholar] [CrossRef]
  52. Shunqing, A.; Gengshan, L.; Anhong, G. Consumption of available soil water stored at planting by winter wheat. Agric. Water Manag. 2003, 63, 99–107. [Google Scholar] [CrossRef]
  53. Izanloo, A.; Condon, A.G.; Langridge, P.; Tester, M.; Schnurbusch, T. Different mechanisms of adaptation to cyclic water stress in two South Australian bread wheat cultivars. J. Exp. Bot. 2008, 59, 3327–3346. [Google Scholar] [CrossRef] [PubMed]
  54. Zhang, C.; Zheng, B.; He, Y. Improving grain yield via promotion of kernel weight in high yielding winter wheat genotypes. Biology 2021, 11, 42. [Google Scholar] [CrossRef] [PubMed]
  55. Mahdy, R.E.; Ashehri, D.; Alatawi, H.A.; Al-Amrah, H.; Mahdy, E.E. Direct and indirect selection for grain yield and grain weight in late generations of bread wheat under drought stress and normal irrigation environments. Plants 2022, 11, 1604. [Google Scholar] [CrossRef]
  56. Spanic, V.; Drezner, G.; Dvojkovic, K.; Horvat, D. Traits of 25 Winter wheat varieties grown in Croatia in the last 100 years. Agron. Glas. 2016, 78, 3–16. [Google Scholar]
  57. Dubey, R.; Pathak, H.; Singh, S.; Chakrabarti, B.; Fagodiya, R.K. Impact of sowing dates on terminal heat tolerance of different wheat (Triticum aestivum L.) cultivars. Natl. Acad. Sci. Lett. 2019, 42, 445–449. [Google Scholar] [CrossRef]
  58. Zhou, H.; Riche, A.B.; Hawkesford, M.J.; Whalley, W.R.; Atkinson, B.S.; Sturrock, C.J.; Mooney, S.J. Determination of wheat spike and spikelet architecture and grain traits using X-ray Computed Tomography imaging. Plant Methods 2021, 17, 26. [Google Scholar] [CrossRef] [PubMed]
  59. Kaushik, R.; Kumar, N.; Sihag, M.K.; Ray, A. Isolation, characterization of wheat gluten and its regeneration properties. J. Food Sci. Technol. 2015, 52, 5930–5937. [Google Scholar] [CrossRef] [PubMed]
  60. Zhang, S.; Ghatak, A.; Bazargani, M.M.; Bajaj, P.; Varshney, R.K.; Chaturvedi, P.; Jiang, D.; Weckwerth, W. Spatial distribution of proteins and metabolites in developing wheat grain and their differential regulatory response during the grain filling process. Plant J. 2021, 107, 669–687. [Google Scholar] [CrossRef] [PubMed]
  61. Turksoy, S.; Onar, D.A. Rapid detection of whole wheat gluten quality by a novel chemometric technique-glutopeak. Foods 2022, 11, 1927. [Google Scholar] [CrossRef]
  62. Laidig, F.; Piepho, H.P.; Rentel, D.; Drobek, T.; Meyer, U.; Huesken, A. Breeding progress, environmental variation and correlation of winter wheat yield and quality traits in German official variety trials and on-farm during 1983–2014. Theor. Appl. Genet. 2017, 130, 223–245. [Google Scholar] [CrossRef]
  63. Iizumi, T.; Ramankutty, N. How do weather and climate influence cropping area and intensity. Glob. Food Secur. 2015, 4, 46–50. [Google Scholar] [CrossRef]
  64. Nault, L.R. Arthropod transmission of plant viruses-a new synthesis. Ann. Entomol. Soc. Am. 1997, 90, 521–541. [Google Scholar] [CrossRef]
  65. Nancarrow, N.; Aftab, M.; Hollaway, G.; Rodoni, B.; Trębicki, P. Yield losses caused by barley yellow dwarf virus-PAV infection in wheat and barley: A three-year field study in South-Eastern Australia. Microorganisms 2021, 9, 645. [Google Scholar] [CrossRef]
  66. Wellings, C.R. Global status of stripe rust: A review of historical and current threats. Euphytica 2011, 179, 129–141. [Google Scholar] [CrossRef]
  67. Oerke, E.C. Crop losses to pests. J. Agric. Sci. 2006, 144, 31–43. [Google Scholar] [CrossRef]
  68. Strange, R.N.; Scott, P.R. Plant disease: A threat to global food security. Annu. Rev. Phytopathol. 2005, 43, 83–116. [Google Scholar] [CrossRef]
  69. Fones, H.; Gurr, S. The impact of Septoria tritici blotch disease on wheat: An EU perspective. Fungal Genet. Biol. 2015, 79, 3–7. [Google Scholar] [CrossRef]
  70. Berraies, S.; Salah Gharbi, M.; Rezgui, S.; Yahyaoui, A. Estimating grain yield losses caused by septoria leaf blotch on durum wheat in Tunisia. Chil. J. Agric. Res. 2014, 74, 432–437. [Google Scholar] [CrossRef]
  71. Persic, V.; Bozinovic, I.; Varnica, I.; Babic, J.; Spanic, V. Impact of fusarium head blight on wheat flour quality: Examination of protease activity, technological quality and rheological properties. Agronomy 2023, 13, 662. [Google Scholar] [CrossRef]
  72. Spanic, V.; Zdunic, Z.; Drezner, G.; Viljevac Vuletic, M. Differences in physiological traits at the initial stage of Fusarium head blight infection in wheat. Biol. Plant. 2020, 64, 185–192. [Google Scholar] [CrossRef]
  73. Hlaváčová, M.; Klem, K.; Rapantová, B.; Novotná, K.; Urban, O.; Hlavinka, P.; Smutná, P.; Horáková, V.; Škarpa, P.; Pohanková, E.; et al. Interactive effects of high temperature and drought stress during stem elongation, anthesis and early grain filling on the yield formation and photosynthesis of winter wheat. Field Crops Res. 2018, 221, 182–195. [Google Scholar] [CrossRef]
  74. Gambin, B.L.; Borras, L.; Otegui, M.E. Source-sink relations and kernel weight differences in maize temperate hybrids. Field Crops Res. 2006, 95, 316–326. [Google Scholar] [CrossRef]
  75. Mu, H.; Jiang, D.; Wollenweber, B.; Dai, T.; Qin, J.; Cao, W. Long-term low radiation decreases leaf photosynthesis, photochemical efficiency and grain yield in winter wheat. J. Agron. Crop Sci. 2010, 196, 38–47. [Google Scholar] [CrossRef]
  76. Jablonskytė-Raščė, D.; Maikštėnienė, S.; Mankevičienė, A. Evaluation of productivity and quality of common wheat (Triticum aestivum L.) and spelt (Triticum spelta L.) in relation to nutrition conditions. Zemdirb. Agric. 2013, 100, 45–56. [Google Scholar] [CrossRef]
  77. Saint Pierre, C.; Peterson, J.; Ross, A.; Ohm, J.B.; Verhoeven, M.; Larson, M.; Hoefer, B. White wheat grain quality changes with genotype, nitrogen fertilization, and water stress. Agron. J. 2008, 100, 414–420. [Google Scholar] [CrossRef]
  78. Bogard, M.; Allard, V.; Martre, P.; Hezmenez, E.; Snape, J.W.; Orford, S.; Griffiths, S.; Gaju, O.; Foulkes, J.; Le Gouis, J. Identifying wheat genomic regions for improving grain protein concentration independently of grain yield using multiple inter-related populations. Mol. Breed. 2012, 31, 587–599. [Google Scholar] [CrossRef]
  79. Geyer, M.; Mohler, V.; Hartl, L. Genetics of the inverse relationship between grain yield and grain protein content in common wheat. Plants 2022, 11, 2146. [Google Scholar] [CrossRef] [PubMed]
  80. Munier-Jolain, N.; Salon, C. Are the carbon costs of seed production related to the quantitative and qualitative performance? An appraisal for legumes and other crops. Plant Cell Environ. 2005, 28, 1388–1395. [Google Scholar] [CrossRef]
  81. Acreche, M.M.; Slafer, G.A. Variation of grain nitrogen content in relation with grain yield in old and modern Spanish wheats grown under a wide range of agronomic conditions in a mediterranean region. J. Agric. Sci. 2009, 147, 657–667. [Google Scholar] [CrossRef]
  82. Tanaka, H.; Gorafi, Y.S.A.; Fujita, M.; Sasaki, H.; Tahir, I.S.A.; Tsujimoto, H. Expression of seed storage proteins responsible for maintaining kernel traits and wheat flour quality in common wheat under heat stress conditions. Breed. Sci. 2021, 71, 184–192. [Google Scholar] [CrossRef] [PubMed]
  83. Wardlaw, I.F. Interaction between drought and chronic high temperature during kernel filling in wheat in a controlled environment. Ann. Bot. 2002, 90, 469–476. [Google Scholar] [CrossRef] [PubMed]
Figure 1. Total monthly rainfall (mm) and average temperatures (°C) during the growing season (from October to June calculated for the period 1990–2023 and singled out for the growing seasons 2021/2022 and 2022/2023 in which this study was conducted) (A); and daily rainfall (mm) and temperatures (°C) during the period of chlorophyll a fluorescence measurements at seven points in 2021/2022 and 2022/2023 (21 January, 2 February, 17 March, 28 April, 12 May, 26 May and 6 June) (B).
Agronomy 14 00478 g001
Figure 2. Grain yield in dt ha−1 (A), test weight in kg hL−1 (B), 1000 kernel weight in g (C), heading date that represents the date of heading in May for each variety (D), plant height in cm (E), and spike length in cm (F) of six winter wheat varieties in the 2021/2022 growing season. Data are presented as mean value of four replicates ± standard deviation. Trait means followed by the same letter are not significantly different at p < 0.05 according to LSD test.
Agronomy 14 00478 g002
Figure 3. Protein content in % (A), sedimentation value in ml (B), wet gluten content in % (C), and Hagberg falling number in s (D) of six winter wheat varieties in the 2021/2022 growing season. Data are presented as mean value of four replicates ± standard deviation. Trait means followed by the same letter are not significantly different at p < 0.05 according to LSD test.
Agronomy 14 00478 g003
Figure 4. Grain yield in dt ha−1 (A), test weight in kg hL−1 (B), 1000 kernel weight in g (C), heading date that represents the date of heading in May for each variety (D), plant height in cm (E), and spike length in cm (F) of six winter wheat varieties in the 2022/2023 growing season. Data are presented as mean value of four replicates ± standard deviation. Trait means followed by the same letter are not significantly different at p < 0.05 according to LSD test.
Agronomy 14 00478 g004
Figure 5. Protein content in % (A), sedimentation value in ml (B), wet gluten content in % (C), and Hagberg falling number in s (D) of six winter wheat varieties in the 2022/2023 growing season. Data are presented as mean value of four replicates ± standard deviation. Trait means followed by the same letter are not significantly different at p < 0.05 according to LSD test.
Agronomy 14 00478 g005
Figure 6. The maximum quantum yield of primary photochemistry (TRO/ABS) of varieties Bubnjar (A), Rujana (B), Silvija (C), Fifi (D), Pepeljuga (E), and Anđelka (F) at seven measurement points (1st—GS 23, 2nd—GS 25 2, 3rd—GS 32, 4th—GS 47, 5th—GS 59, 6th—GS 69, and 7th—GS 71) in the 2021/2022 growing season. Data are presented as mean value of 20 replicates ± standard deviation. Trait means followed by the same letter are not significantly different at p < 0.05 according to LSD test.
Agronomy 14 00478 g006
Figure 7. Performance index on absorption basic (PIABS) of varieties Bubnjar (A), Rujana (B), Silvija (C), Fifi (D), Pepeljuga (E), and Anđelka (F) at seven measurement points (1st—GS 23, 2nd—GS 25 2, 3rd—GS 32, 4th—GS 47, 5th—GS 59, 6th—GS 69, and 7th—GS 71) in the 2021/2022 growing season. Data are presented as mean value of 20 replicates ± standard deviation. Trait means followed by the same letter are not significantly different at p < 0.05 according to LSD test.
Agronomy 14 00478 g007
Figure 8. The maximum quantum yield of primary photochemistry (TRO/ABS) of varieties Bubnjar (A), Silvija (B), Rujana (C), Pepeljuga (D), Fifi (E), and Anđelka (F) at seven measurement points (1st—GS 23, 2nd—GS 25 2, 3rd—GS 32, 4th—GS 47, 5th—GS 59, 6th—GS 69, and 7th—GS 71) in 2022/2023 vegetative season. Data are presented as mean value of 20 replicates ± standard deviation. Trait means followed by the same letter are not significantly different at p < 0.05 according to LSD test.
Agronomy 14 00478 g008
Figure 9. Performance index on absorption basic (PIABS) of varieties Bubnjar (A), Silvija (B), Rujana (C), Pepeljuga (D), Fifi (E), and Anđelka (F) at seven measurement points (1st—GS 23, 2nd—GS 25 2, 3rd—GS 32, 4th—GS 47, 5th—GS 59, 6th—GS 69, and 7th—GS 71) in the 2022/2023 growing season. Data are presented as mean value of 20 replicates ± standard deviation. Trait means followed by the same letter are not significantly different at p < 0.05 according to LSD test.
Agronomy 14 00478 g009
Figure 10. Principal component analysis (PCA) showing the relationship between grain yield, test weight, 1000 kernel weight, plant height, heading date, spike length, protein content, sedimentation value, wet gluten content, Hagberg falling number, and photosynthetic parameters (TRO/ABS 1st, TRO/ABS 2nd, TRO/ABS 3rd, TRO/ABS 4th, TRO/ABS 5th, TRO/ABS 6th, TRO/ABS 7th, PIABS 1st, PIABS 2nd, PIABS 3rd, PIABS 4th, PIABS 5th, PIABS 6th, and PIABS 7th) of six winter wheat varieties (Rujana, Silvija, Fifi, Anđelka, Bubnjar, and Pepeljuga) at (A) 2021/2022 and (B) 2022/2023 growing season.
Agronomy 14 00478 g010
Table 1. Soil properties of eutric cambisol at location Osijek.
ComponentQuantity
pHKCl6.25
Humus2.00–2.20%
P2O539.70 mg 100 g−1
H2O37.70mg 100 g−1
Table 2. Agro-technical measures during the growing seasons 2021/2022 and 2022/2023.
Agro-Technical MeasureAgent and Concentrations of Active Compounds
2021/2022
Pre-sowing seed treatment in 2021Maxim Extra 050 FS (fludioxonil 25 g L−1; difenoconazole 25 g L−1)
Weed control in November 2021Sharpen 330 EC (pendimethalin 330 g L−1)
Pest control in April 2022Vantex 60 CS (gamma-cyhalothrin 60 g L−1)
Weed control in May 2022Lodin (fluroxypyr-metil 295.5 g L−1) + Tribe 75 WG (tribenuron 750 g kg−1)
Pest control in May 2022Cythrin Max (cypermethrin 500 g L−1)
2022/2023
Pre-sowing seed treatment in 2022Maxim Extra 050 FS (fludioxonil 25 g L−1; difenoconazole 25 g L−1)
Weed control in February 2023Alister New (diflufenican 120 g L−1; jodosulfuron 7.5 g L−1; mesosulfuron 9 g L−1)
Weed control in May 2023Sekator (amidosulfuron 100 g L−1; jodosulfuron metil 25 g L−1) + Tribe 75 WG (tribenuron 750 g kg−1)
Pest control in April 2023Cyclone (lambda-cyhalothrin 50 g L−1)
Pest control in May 2023Cyclone (lambda-cyhalothrin 50 g L−1)
Table 3. Analysis of variance for agro-morphological and quality traits of six wheat varieties evaluated across two years.
Source of
Variability
DFMean Square
Grain
Yield
Test Weight1000 Kenel WeightHeading DatePlant HeightSpike
Length
Protein ContentSedimentation ValueWet Gluten ContentHagberg Falling Number
Variety (V)5712.8 ***64.0 ***206.0 ***40.6 ***1204.1 ***13.6 ***1.1 ***67.1 ***36.3 ***829.0 **
Year (Y)124,797.5 ***314.7 ***278.4 ***80.1 ***475.7 ***1160.3 ***0.1125.5 ***1.21210.0 **
V × Y5186.2 ***15.4 ***6.583.0 ***63.5 ***3.43 **0.8 ***54.0 ***15.6 ***464.0 **
Error369.10.62.760.44.71.90.12.51.4183
***, **, = significant at p < 0.001, 0.01, respectively; DF—degrees of freedom.
Table 4. Analysis of variance for photosynthetic parameters TRO/ABS and PIABS of six wheat varieties evaluated across two years and seven measurement points.
Source of VariabilityDFMean Square
TRO/ABSPIABS
Variety (V)50.011.72 **
Year (Y)10.0332.93 ***
Measurement point (M)60.32 ***206.87 ***
V × Y50.010.82
V × M300.012.16 ***
Y × M60.13 ***65.73 ***
V × Y × M300.083.29 ***
Error15960.010.05
***, **, = significant at p < 0.001, 0.01, respectively; DF—degrees of freedom.
Table 5. Incidence of barley yellow dwarf virus and yellow rust in the 2022/2023 growing season.
VarietyBarley Yellow Dwarf Virus (%)Yellow Rust (%)
Bubnjar3.80
Silvija4.83
Rujana2.85
Pepeljuga4.010
Fifi3.220
Anđelka2.390
The score was taken as the mean of four replicates.
Disclaimer/Publisher’s Note: The statements, opinions and data contained in all publications are solely those of the individual author(s) and contributor(s) and not of MDPI and/or the editor(s). MDPI and/or the editor(s) disclaim responsibility for any injury to people or property resulting from any ideas, methods, instructions or products referred to in the content.

