Article

Contact Electrification of Liquid Droplets Impacting Living Plant Leaves

1
Key Laboratory of Plant Protection Equipment, Ministry of Agriculture and Rural Affairs, Jiangsu University, Zhenjiang 212013, China
2
Key Laboratory of Modern Agricultural Equipment and Technology, Ministry of Education, Jiangsu University, Zhenjiang 212013, China
*
Author to whom correspondence should be addressed.
Agronomy 2024, 14(3), 573; https://doi.org/10.3390/agronomy14030573
Submission received: 30 January 2024 / Revised: 6 March 2024 / Accepted: 8 March 2024 / Published: 13 March 2024
(This article belongs to the Section Agricultural Biosystem and Biological Engineering)

Abstract

:
Contact electrification has attracted interest as a mechanism for generating electrical charges on surfaces. To explore the factors contributing to electrification by droplets impacting the leaf surface, high-speed image capture and current measurements were used to quantitatively characterize the electrical response under different droplet parameters and leaf surface conditions. Upon impact and rebound from the leaf surface, neutral droplets acquire a positive charge. While this electrification phenomenon has been observed previously, there has been limited understanding of the parameters influencing the extent of droplet charging. In this study, we examine the effects of four parameters (droplet size, impact velocity, droplet ion concentration, and various leaf surfaces) on the electrical response signal. The results indicate that this electrification phenomenon is contingent upon the droplet–leaf contact area and droplet ion concentration. We propose a theoretical model based on the electric double layer to elucidate the electrification process.

1. Introduction

Droplet interactions with surfaces are ubiquitous in nature [1,2]. These interactions find a broad array of applications in agriculture and industry. These applications encompass crop protection spraying [3], on-farm disinfection [4], surface coating [5], and power transmission [6]. Prior research on crop protection spraying has concentrated on spray deposition [7], the bouncing behavior of droplets impacting stationary leaves [8], and the mechanical modeling and motion behavior of leaves under droplet load [9,10]. However, the mechanism between contact electrification (CE) and motion behavior during droplet impact on the leaf surface remains poorly understood. This study explores the interplay between the principles of electrification and motion behavior during droplet impact on a living leaf surface.
CE has gained attention as a mechanism through which liquids generate charges on solid surfaces [11]. Wu et al. [12] proposed a fully biodegradable water droplet energy harvester based on the leaves of living plants. They investigated the power generation phenomenon and working mechanism of a triboelectric nanogenerator under diverse droplet compositions, different external resistive loads, and different droplet impact locations in contact conditions. Armiento et al. [13] conducted an experimental comparison of droplet impacts on leaves with waxy layers under three conditions: retaining the wax layer, melting the wax layer, and removing the wax layer. The results indicated that the removal of leaf epicuticular waxes negatively affected the signal generation of droplet impacts on plant leaves. Recently, droplet impact and motion have been suggested as potential sources of power generation [14,15,16,17,18,19,20,21,22]. However, the above studies primarily concentrated on the electrification behavior and power generation efficiency of droplets impacting solid surfaces, while neglecting the relationship between the electrification behavior of liquid–solid surface contact and the wetting ability.
However, it has been shown that droplet charging affects the dynamic wetting behavior of a surface. Mats et al. [23] experimentally measured the contact angle between a charged droplet and an uncharged droplet on an artificial surface. The results of the study showed a significant decrease in the liquid–solid contact angle after the droplet was charged. Li et al. [24] charged the droplets with positive and negative voltages, and the results of the study showed that the spreading diameter of the droplets on the artificial surface increased with the increase in voltage. The above study shows that droplet charging can significantly enhance the wetting ability of droplets on a surface. Therefore, the field of crop protection electrostatic spraying has started to have a strong interest in this charging process of droplets hitting the leaf.
In agriculture, sprays are one of the most common means of delivering pesticides and some nutrients to crops. Electrostatic spraying technology can improve the uniformity of droplets and enhance the adsorption capacity between droplets and plant leaves [25]. Maski et al. [26] investigated the effects of parameters such as electrode voltage, spray liquid flow rate, and liquid properties on spray chargeability. Salcedo et al. [27] conducted a field test comparing droplet deposition distribution under various operating parameters, such as wind speed, charging status, and traveling speed. Patel et al. [28] developed an air-assisted electrostatic spray nozzle and assessed the droplet charge-to-mass ratio under different spray parameters, including applied air pressure, applied voltage, target distance, and liquid conductivity. The above studies mainly focused on the optimization of electrostatic spraying system parameters, the measurement of charged droplet charge-to-mass ratios, and the collection of droplet depositions on plant leaves. However, in order to improve crop protection equipment and ensure sufficient and effective droplet deposition on crop leaves, cutting-edge research is shifting to the microscopic leaf scale, looking especially at the behavior of droplets impacting the surface of crop leaves. Although few existing studies have focused on the electrification phenomenon of droplets impacting the leaf surface, the electrification phenomenon can potentially affect the dynamic wetting behavior of droplets on a leaf surface. The actual charge measurements of charged droplets deposited on crop leaves after charge attenuation over transport distances and charge transfer modeling between droplet and leaf must be urgently investigated.
In this present work, a current measurement instrument and high-speed image system were used to capture the droplet–leaf friction current and droplet breakup, respectively. The influence of the electrical response amplitude by parameters such as droplet size, impact velocity, droplet ion concentration, and various leaf surfaces remains unclear. This is a prerequisite for understanding the droplet–leaf electrification mechanism and controlling the amount of charge. Our main goal is to optimize the parameters of spray equipment and provide new insights into the crop protection spraying process.

2. Materials and Methods

2.1. Plant Species and Preparation

Seedlings of Capsicum frutescens L. were purchased online from a plant nursery (Shouhe, Shouguang City, Shandong Province, China). The seedlings were transplanted into 4 L plastic pots and placed in greenhouses at the College of Agricultural Engineering, Jiangsu University (11°30′47″ E, 32°12′11″ N). The seedlings were cultivated with temperatures controlled between 25 and 35 °C and relative humidity between 50 and 70%, with daily watering. Epipremnum aureum was cultivated in the laboratory at the College of Agricultural Engineering, Jiangsu University. The temperature was maintained between 20 and 30 °C, with a relative humidity of 40–70%, watering once a day every 2 days. Natural leaves (Nelumbo nucifera, Nerium oleander, Broussonetia papyrifera, and Prunus serrulata) were collected from plants in the school landscape in October 2023. Experimental measurements were conducted on healthy leaves free of pests and diseases. All tests were performed within 2 h of removing the leaves from the plants.

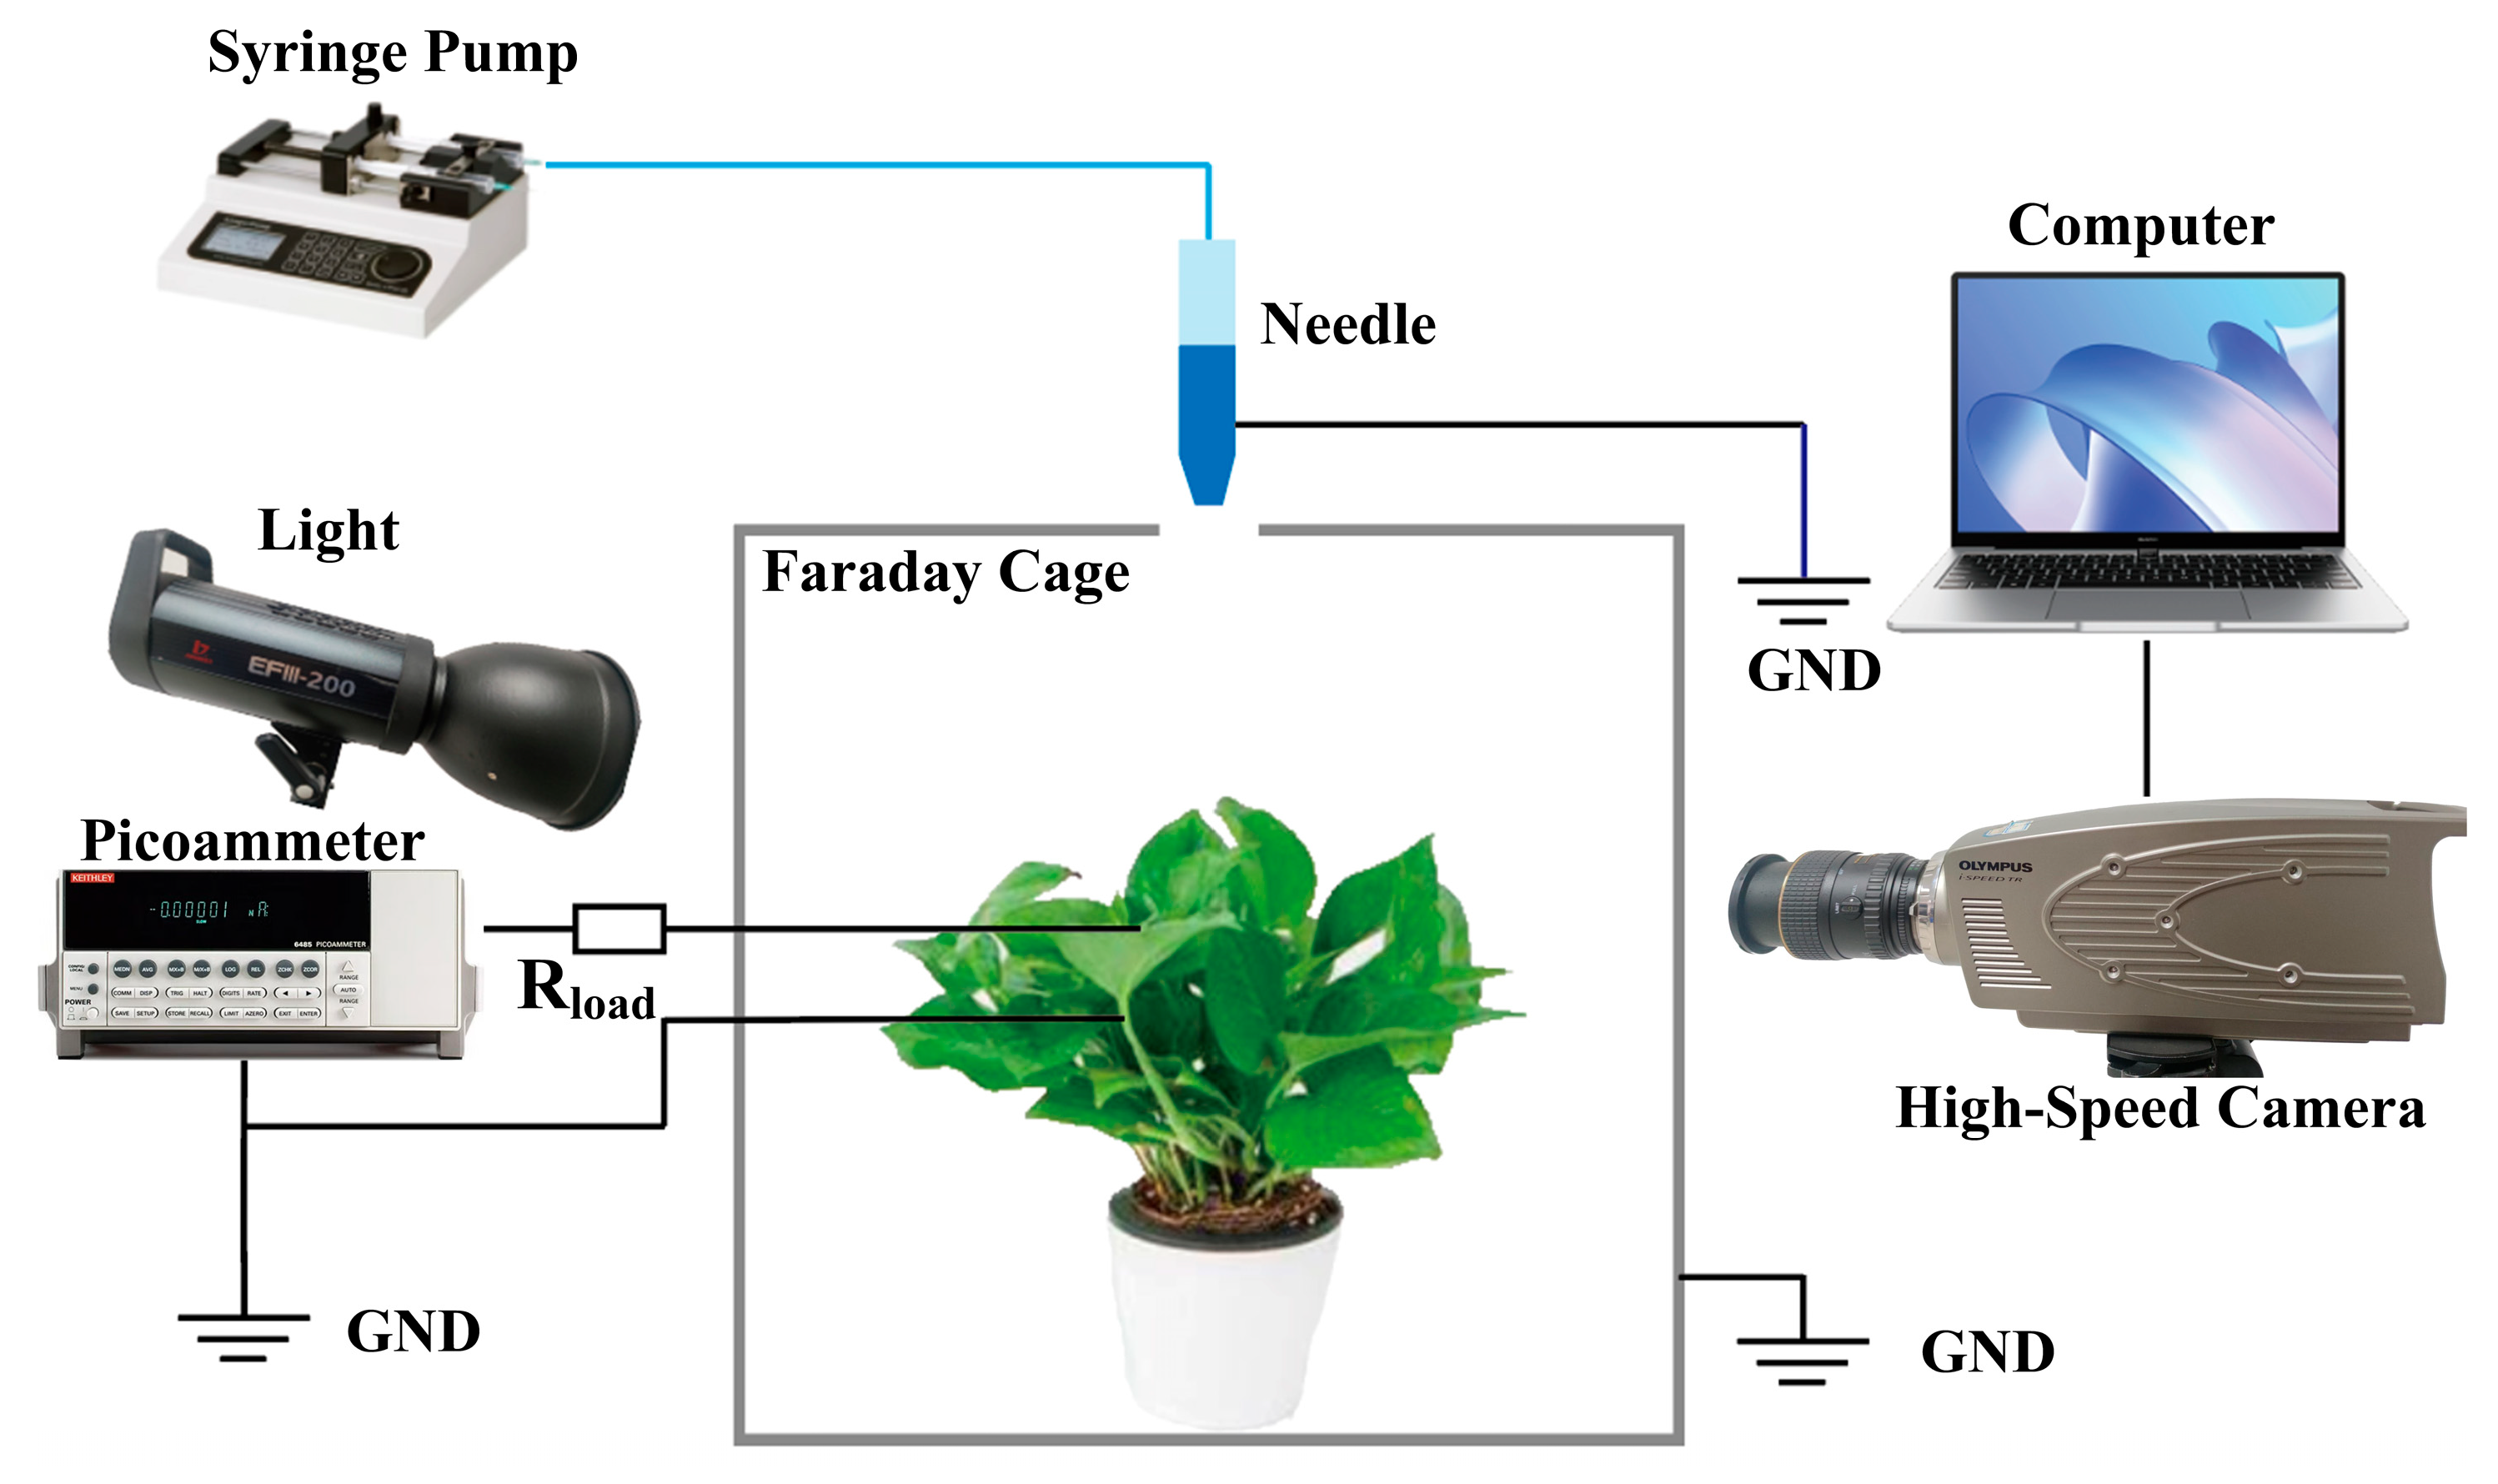
2.2. Dedicated Measurement Set-Up

A Faraday cage was custom-built from a shielded metal box. The cage was grounded through an external cable to ensure that external electrical fields did not affect the measurements. A syringe pump was essential for administering controlled amounts of liquid droplets. The liquid was then directed through a polyethylene pipette that had a metal needle capable of being electrically grounded. This setup minimized any charge build-up that could occur due to liquid movement, which could have interfered with the precise electrical measurements intended in the experiment. The pipette and needle assembly were positioned above the Faraday cage. The height from which droplets were released could be adjusted to accommodate the size of the plant inside the cage. The plant itself was placed inside the cage on an insulating plate, which was used to prevent any direct electrical influence from the cage itself. A silver wire with a diameter of 0.1 mm was used as the measuring wire. It was carefully taped to the leaf’s upper surface without significantly damaging the leaf or affecting its natural electrical properties. A silver-plated copper wire with a diameter of 0.25 mm was used as the lower electrode and inserted into the petiole of the measured leaf. Both of the wires were connected to a picoammeter (6485, Keithley, Cleveland, OH, USA) through a shielded cable, as shown in Figure 1. Droplets of deionized water (DI) (Elix Essential 5, Millipore SAS, Burlington, MA, USA) and sodium chloride (NaCl) solutions of specified molarity (0.01 M, 0.1 M, 1 M) were prepared using NaCl (AR, Xilong Scientific Co., Ltd., Guangzhou, China). Before each experiment, the leaf surface was gently wiped with a soft paper towel to absorb moisture.

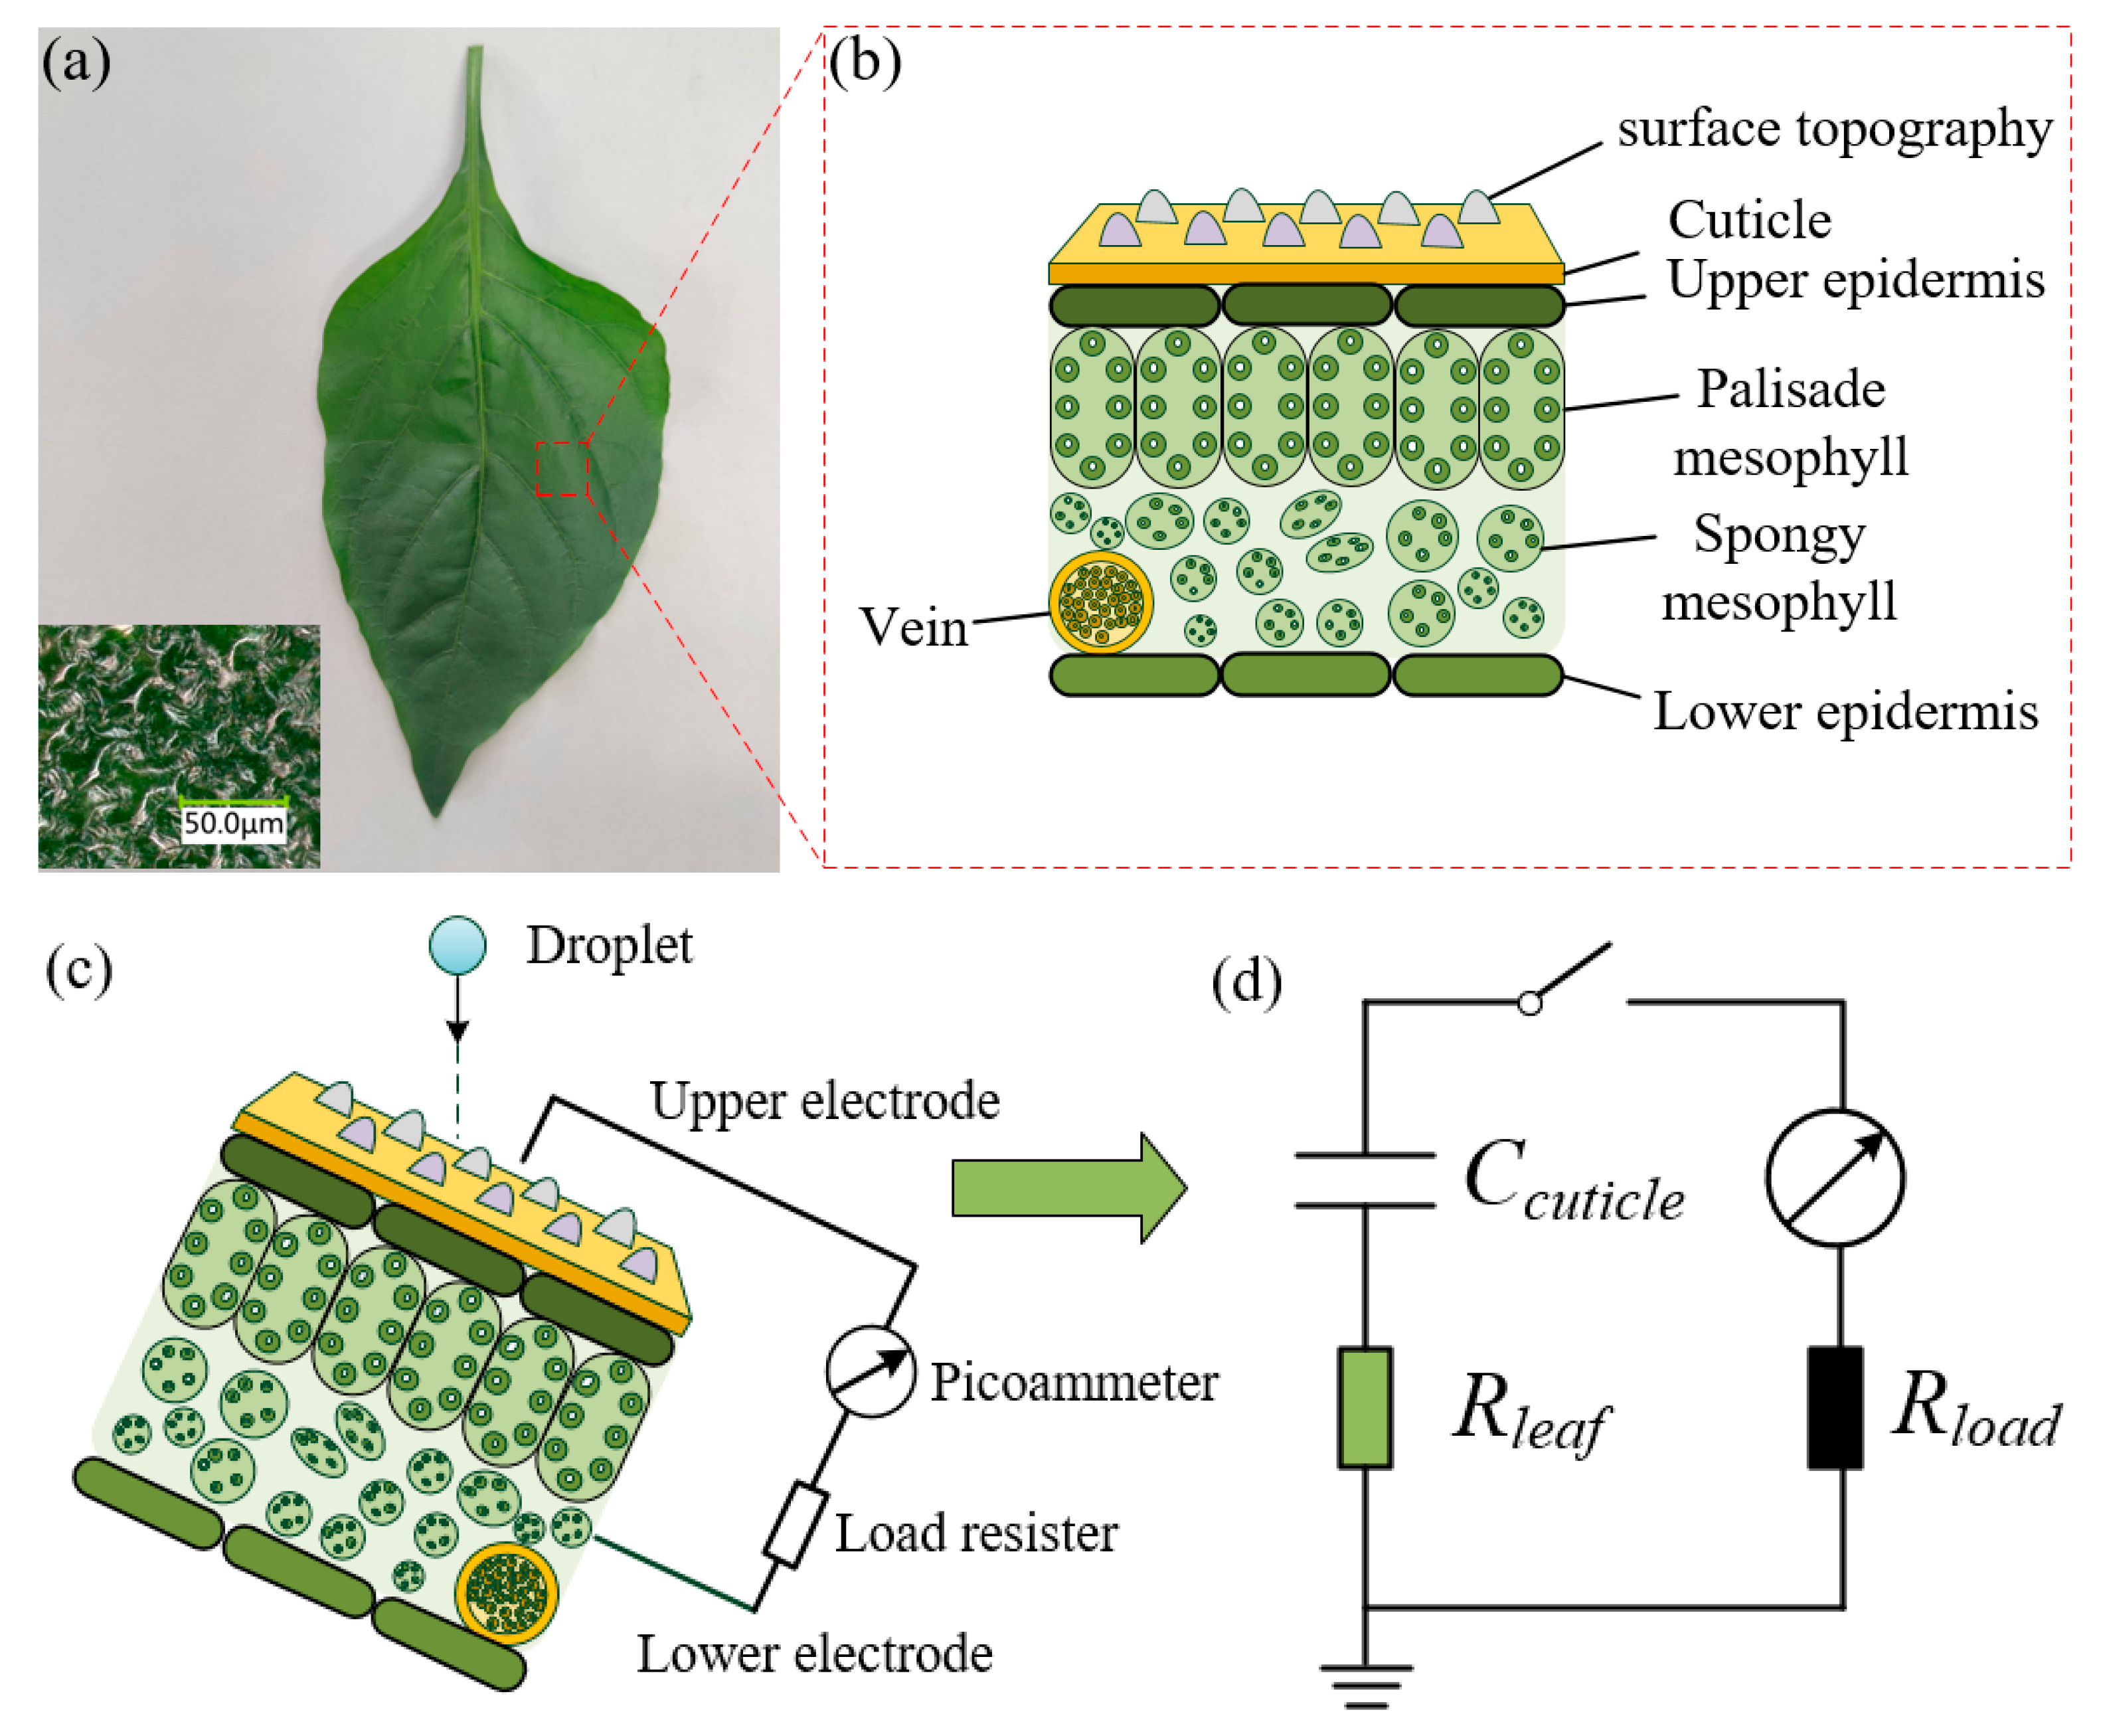
2.3. Contact Angle and Surface Topography Measurements

Fresh and healthy leaves were carefully chosen to ensure that the plant’s physiological state did not skew the results. Considering that the contact angle of the droplets would be affected by the leaf veins [29], the primary and secondary leaf vein locations were avoided, a flat portion of the leaf surface of 20 × 20 mm2 was intercepted, and the back of the intercepted leaf was glued to the slide (76 mm in length, 25 mm in width, and 1 mm in height) with double-faced adhesive to obtain a flat leaf surface. The static contact angle of the upper surface of the samples (droplet volume of 2 μL) was determined at room temperature using an optical contact angle measuring system (OCA 25, Dataphysics, Filderstadt, Germany). The leaf surface structure was characterized by a digital microscope (VHX-900F, Keyence, Osaka, Japan) with an objective lens of 200×. The leaf contact angle measurements and leaf surface topography were photographed as shown in Supplementary Figure S1a,b, respectively.

2.4. Measurement of Droplet Velocity and Diameter

The measurement system for the droplet velocity and diameter consisted of a high-speed camera (i-Speed TR, Olympus Co., Shinjuku, Tokyo, Japan), a macro lens (AT-X Pro D 100 mm F2.8 macro lens, Kenko Tokina Co., Ltd., Langenzenn, Germany), and accessories. The camera parameters were set to a frame rate of 2000 FPS and a resolution of 1280 × 1024 pixels after weighing the relationship between the memory space (16 GB), image quality, and recording time of the high-speed camera. Velocity and diameter measurements were performed in 2 steps. First, the velocity of droplets released at three different heights (10, 50, and 100 cm) was measured for the subsequent analysis of the effect of different droplet velocities on the surface charging behavior of the leaf. A droplet’s position and its time of flight were crucial for velocity calculation. The experiment defined very specific frames of reference for the camera to capture: the first frame when the droplet was 5 mm above and the second frame when it was 5 mm below a predefined measurement point. The distance the droplet fell between these two points and the time that elapsed, determined by the high-speed camera frame rate, allowed for calculating the velocity with precision. To ensure accurate measurements, the focal plane of the camera needed to be calibrated. A naturally drooping lead hammer, suspended by a cotton thread and aligned parallel to the droplet release needle, was used to ascertain the plane of focus. The calibration employed a dot calibration plate (dots separated by 6 mm) to ensure that the camera’s focus was precise and that the measurement scale was accurate.
Since a falling droplet changes shape due to stretching and eventually breaking apart, it was essential to measure the diameter while the droplet approximated a corresponding circular shape. The high-speed camera captured the necessary images, which were then screened manually to select the appropriate frame that would reflect the diameter of a corresponding circular droplet. ImageJ 1.54g (http://imagej.nih.gov, accessed on 18 October 2023), open-source image processing and analysis software, was utilized to analyze the selected images and measure the droplet diameters.

2.5. Data and Statistical Analysis

The current data measured by the pico-ammeter were analyzed using Matlab (2022b, MathWorks, Natick, MA, USA). Each experiment was performed multiple times in order to account for statistically sound results. The first step involved preprocessing the data to remove background noise from the electrical signal measurements. Out of the complete dataset (2500 data points), the first 100 data points in each file were averaged. This averaging was likely performed at the beginning, when no signal of interest (droplet impact) was expected, and thus it served to establish a baseline for noise. This processing did not affect signal peaks and amplitudes. The Matlab FindPeaks() function was used to identify local maximums within the data that corresponded to the impact signals of the droplets. Following the identification of the peaks, their amplitudes were evaluated to determine the strength of the signal associated with each droplet impact. The average amplitudes and standard deviations of at least 20 peaks (corresponding to 20 droplets) were calculated. For visualization and further analysis, the average peak amplitudes of these 20 droplet signals and their standard deviations were extracted. Box-and-whisker plots were used to display the distribution of the current signals under different experimental conditions. These plots provided insight into the median, quartiles, and extremes of the datasets, and were very effective for comparing the responses under different parameters.

3. Results

3.1. Electric Signals Generated by Droplet–Leaf Interaction

The CE experiments were carried out by connecting the two electrodes in a two-electrode mode, which was considered as a probe to study the charge transfer at the liquid–solid interface [12,30,31]; the device structure is shown in Figure 2c. The C. frutescens leaf used in this work is shown in Figure 2a as a typical crop leaf with microstructures present on its surface (inset of Figure 2a), which may increase the effective contact area during frictional priming. The microstructures present on the surface of C. frutescens leaves have hydrophobic properties, allowing droplets to slide off the surface upon impact. The experiment involved four stages. The droplets were first released freely from the needle to fall into imminent contact with the leaf surface; then, the droplets spread to their maximum area on the leaf surface and contacted the upper electrode. Then, the droplets contracted and fragmented into satellite droplets and, finally, the satellite droplets slid down and off the surface of the leaf.
Figure 2c illustrates a cross-section of a leaf connected to an external circuit. Leaves were typically composed of five different tissue layers: cuticle, upper epidermis, palisade mesophyll, spongy mesophyll, and lower epidermis [32]. Since the palisade mesophyll and spongy mesophyll of living leaves are filled with electrolytes, the charge could be transported throughout the plant by ions in the electrolytes. [33,34] In contrast, the cuticle of the plant that covers the epidermis is a naturally hydrophobic and dielectric material, allowing the formation of an electric double layer (EDL) during droplet–leaf surface contact [31].
For external circuits, a copper wire connected at one end and inserted into the petiole of the leaf to be measured (in contact with the plant’s electrolyte) formed the lower electrode. At the other end was a conductive silver wire immediately above the surface of the leaf, forming the upper electrode when the wire came into contact with a droplet. Thus, the leaf model could be abstracted as a two-layer model, with the yellow upper layer abstracting the cuticle and upper epidermis as the dielectric layer and the green lower layer abstracting the palisade mesophyll and spongy mesophyll as the conductive layer, as in Supplementary Figure S4a. The circuit model could be categorized according to the moments before and after the droplet came into contact with the upper electrode, as shown in Supplementary Figure S4. Before the droplet came into contact with the upper electrode, the circuit model was considered an open circuit state since there was no closed loop of induced current formed between the lower and upper electrodes. The equivalent circuit at the open circuit stage is shown in Supplementary Figure S4b: Ccuticle, Rleaf, Rdrop, and RLoad. When a droplet hit the surface of the leaf and came into contact with the conductive wire (Supplementary Figure S4c), the droplet acted as an upper electrode to connect the external circuit to the leaf, thus forming a closed loop for the induced charge to flow through (Supplementary Figure S4d).
The adhesion of the droplet to the surface was related to the amount of charge carried by the droplet, and it was necessary to analyze the mechanism of droplet–leaf surface CE to explore the factors that promoted droplet–leaf surface CE. Assuming that the leaf surface was saturated with friction charge by the continuous impact of the droplet, the mechanism of current generation can be explained as shown in Figure 3b, and the process was divided into four stages for the sake of clearly illustrating the mechanism:
(1) Before a new droplet was about to impact the leaf surface, there was an electrostatic equilibrium between the positive charge of the dielectric layer on the leaf surface and the opposite charge induced on the conductive layer.
(2) When the droplet impacted the leaf surface and spread, an EDL was formed on the droplet–leaf surface, while the droplet slid along the dielectric layer of the leaf, and the surface energy spread on the dielectric layer of the leaf due to the conversion of the kinetic energy of the droplet into surface energy. When the droplet spread to the maximum area and touched the wire on the dielectric layer, the ions of the droplet started to arrange themselves. These ions were influenced by the positively charged dielectric layer of the leaf, and they moved in such a way that the negative ions were close to the dielectric layer and the positive ions were far from the dielectric layer [35,36]. The ions aligned in the droplets shielded the electric field generated by the surface charge of the leaf dielectric layer (shielding effect), thus breaking the initial electrostatic equilibrium. In order to balance the potential difference between the upper and lower electrodes, part of the induced negative charge moved from the lower electrode to the upper electrode via a wire to achieve a new electrostatic equilibrium, resulting in a reversed current. Considering that this process was comparable to the capacitor discharge process, the resulting current showed an exponentially decreasing behavior.
At stage (3), the droplet shrank and broke up, the droplet–leaf contact area decreased, and the shielding was weakened along with the decrease in the area of the EDL. As a result, the direction of the induced charge was reversed and the current flowed from the upper electrode to the lower electrode. This working mechanism can also be explained by a simplified equivalent circuit model [37,38]. Here, the droplets on the leaf surface, the dielectric layer, and the lower electrode can be modeled as a capacitor because the dielectric layer consisted of a charged dielectric material, and the droplets were considered as conductors with a specific resistance.
At stage (4), when the droplet left the surface, the current amplitude fell to zero. Photographs of the four stages are shown in Figure 3a.

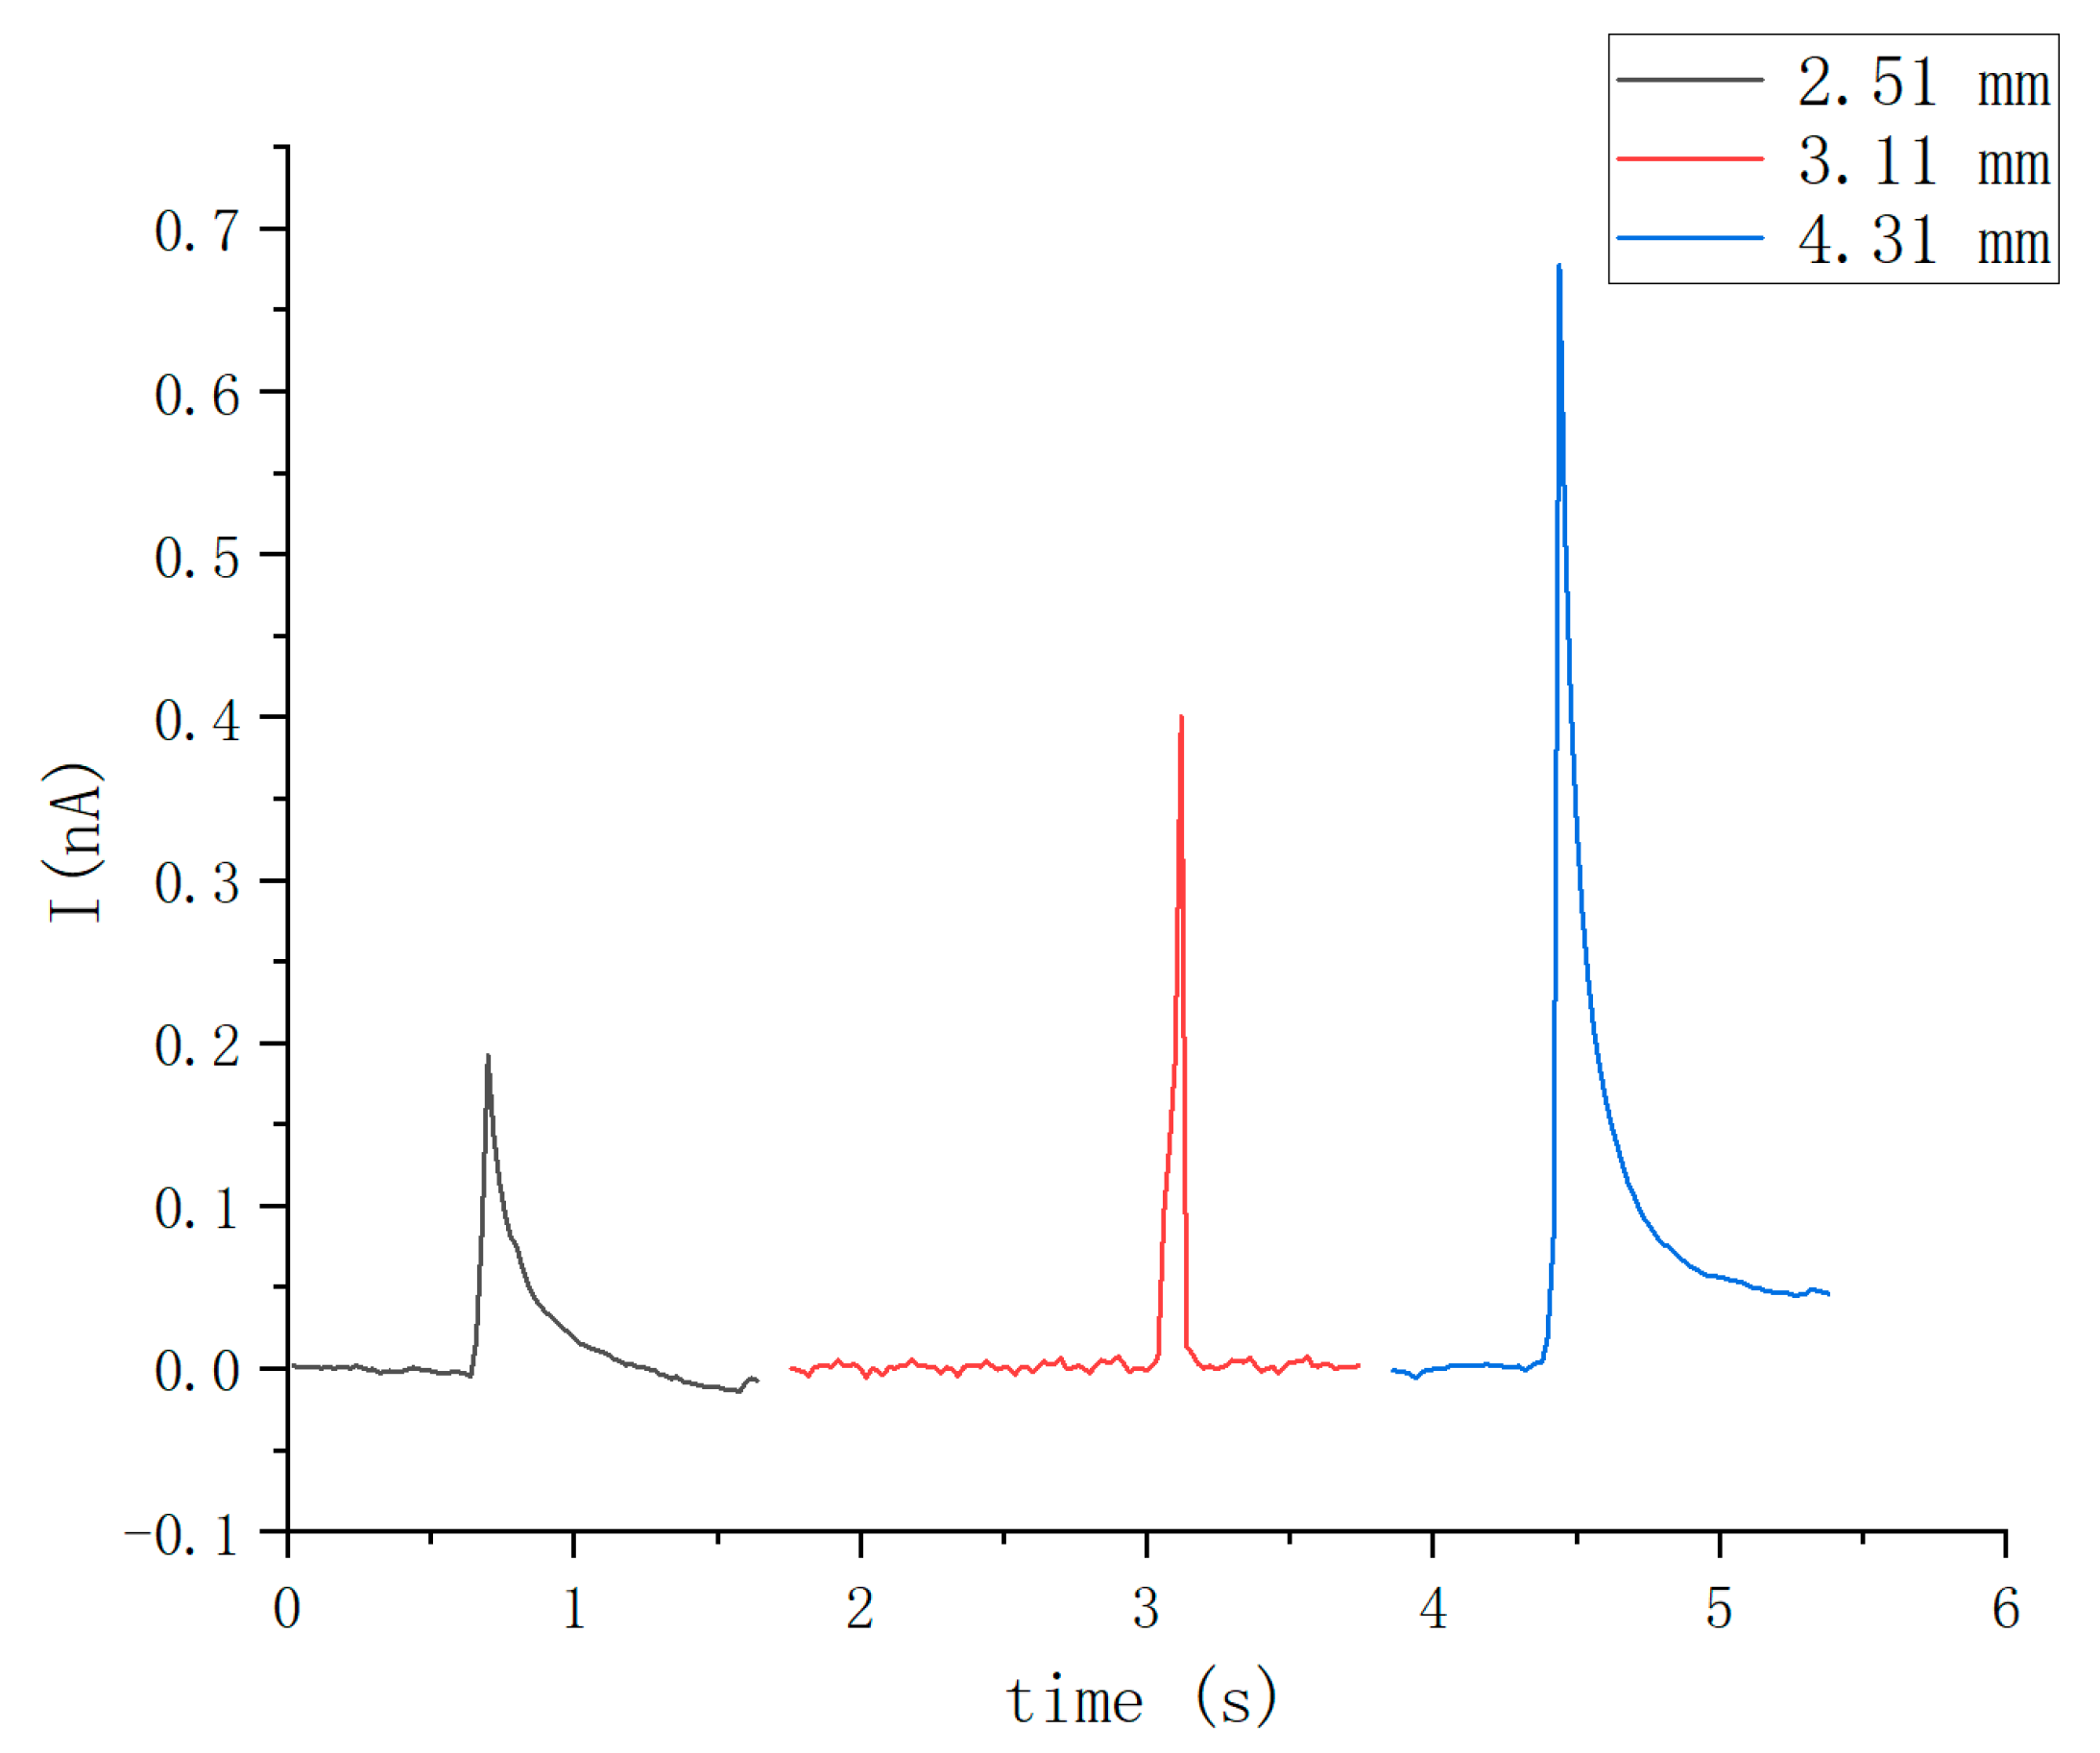
3.2. Influence of Droplet Diameter on the Electric Signals

In the experimental setup, we collected data on the current signals generated by DI water droplets impacting the leaf surface. Droplets of three different diameters (2.51 mm, 3.11 mm, and 4.31 mm) were investigated. Data analysis revealed the relationship between droplet diameter and current amplitude at a constant height of 10 cm, as illustrated in Figure 4. As depicted in the figure, the peak value of the impinging current signal demonstrated an increasing trend with the droplet diameter. A notable disparity was observed in both the peak value and the shape of the current. As the surface of the leaf was not a standard flat surface, and each line on the leaf had a different curvature, the droplets slid down different curves upon impact. The signal in Figure 4 was generated as a droplet spread to its maximum spreading area in contact with the wire, and it disappeared as the droplet slipped away from the wire. The peak of the signal was related to the maximum area of droplet spreading and the width of the signal was affected by the droplet contact time with the wire; therefore, the 3.11 mm droplet may have slipped along a line with a greater inclination, reducing the droplet contact time with the wire. This observation suggests that the current signals resulting from droplets impacting the hydrophobic surface were influenced by various factors.

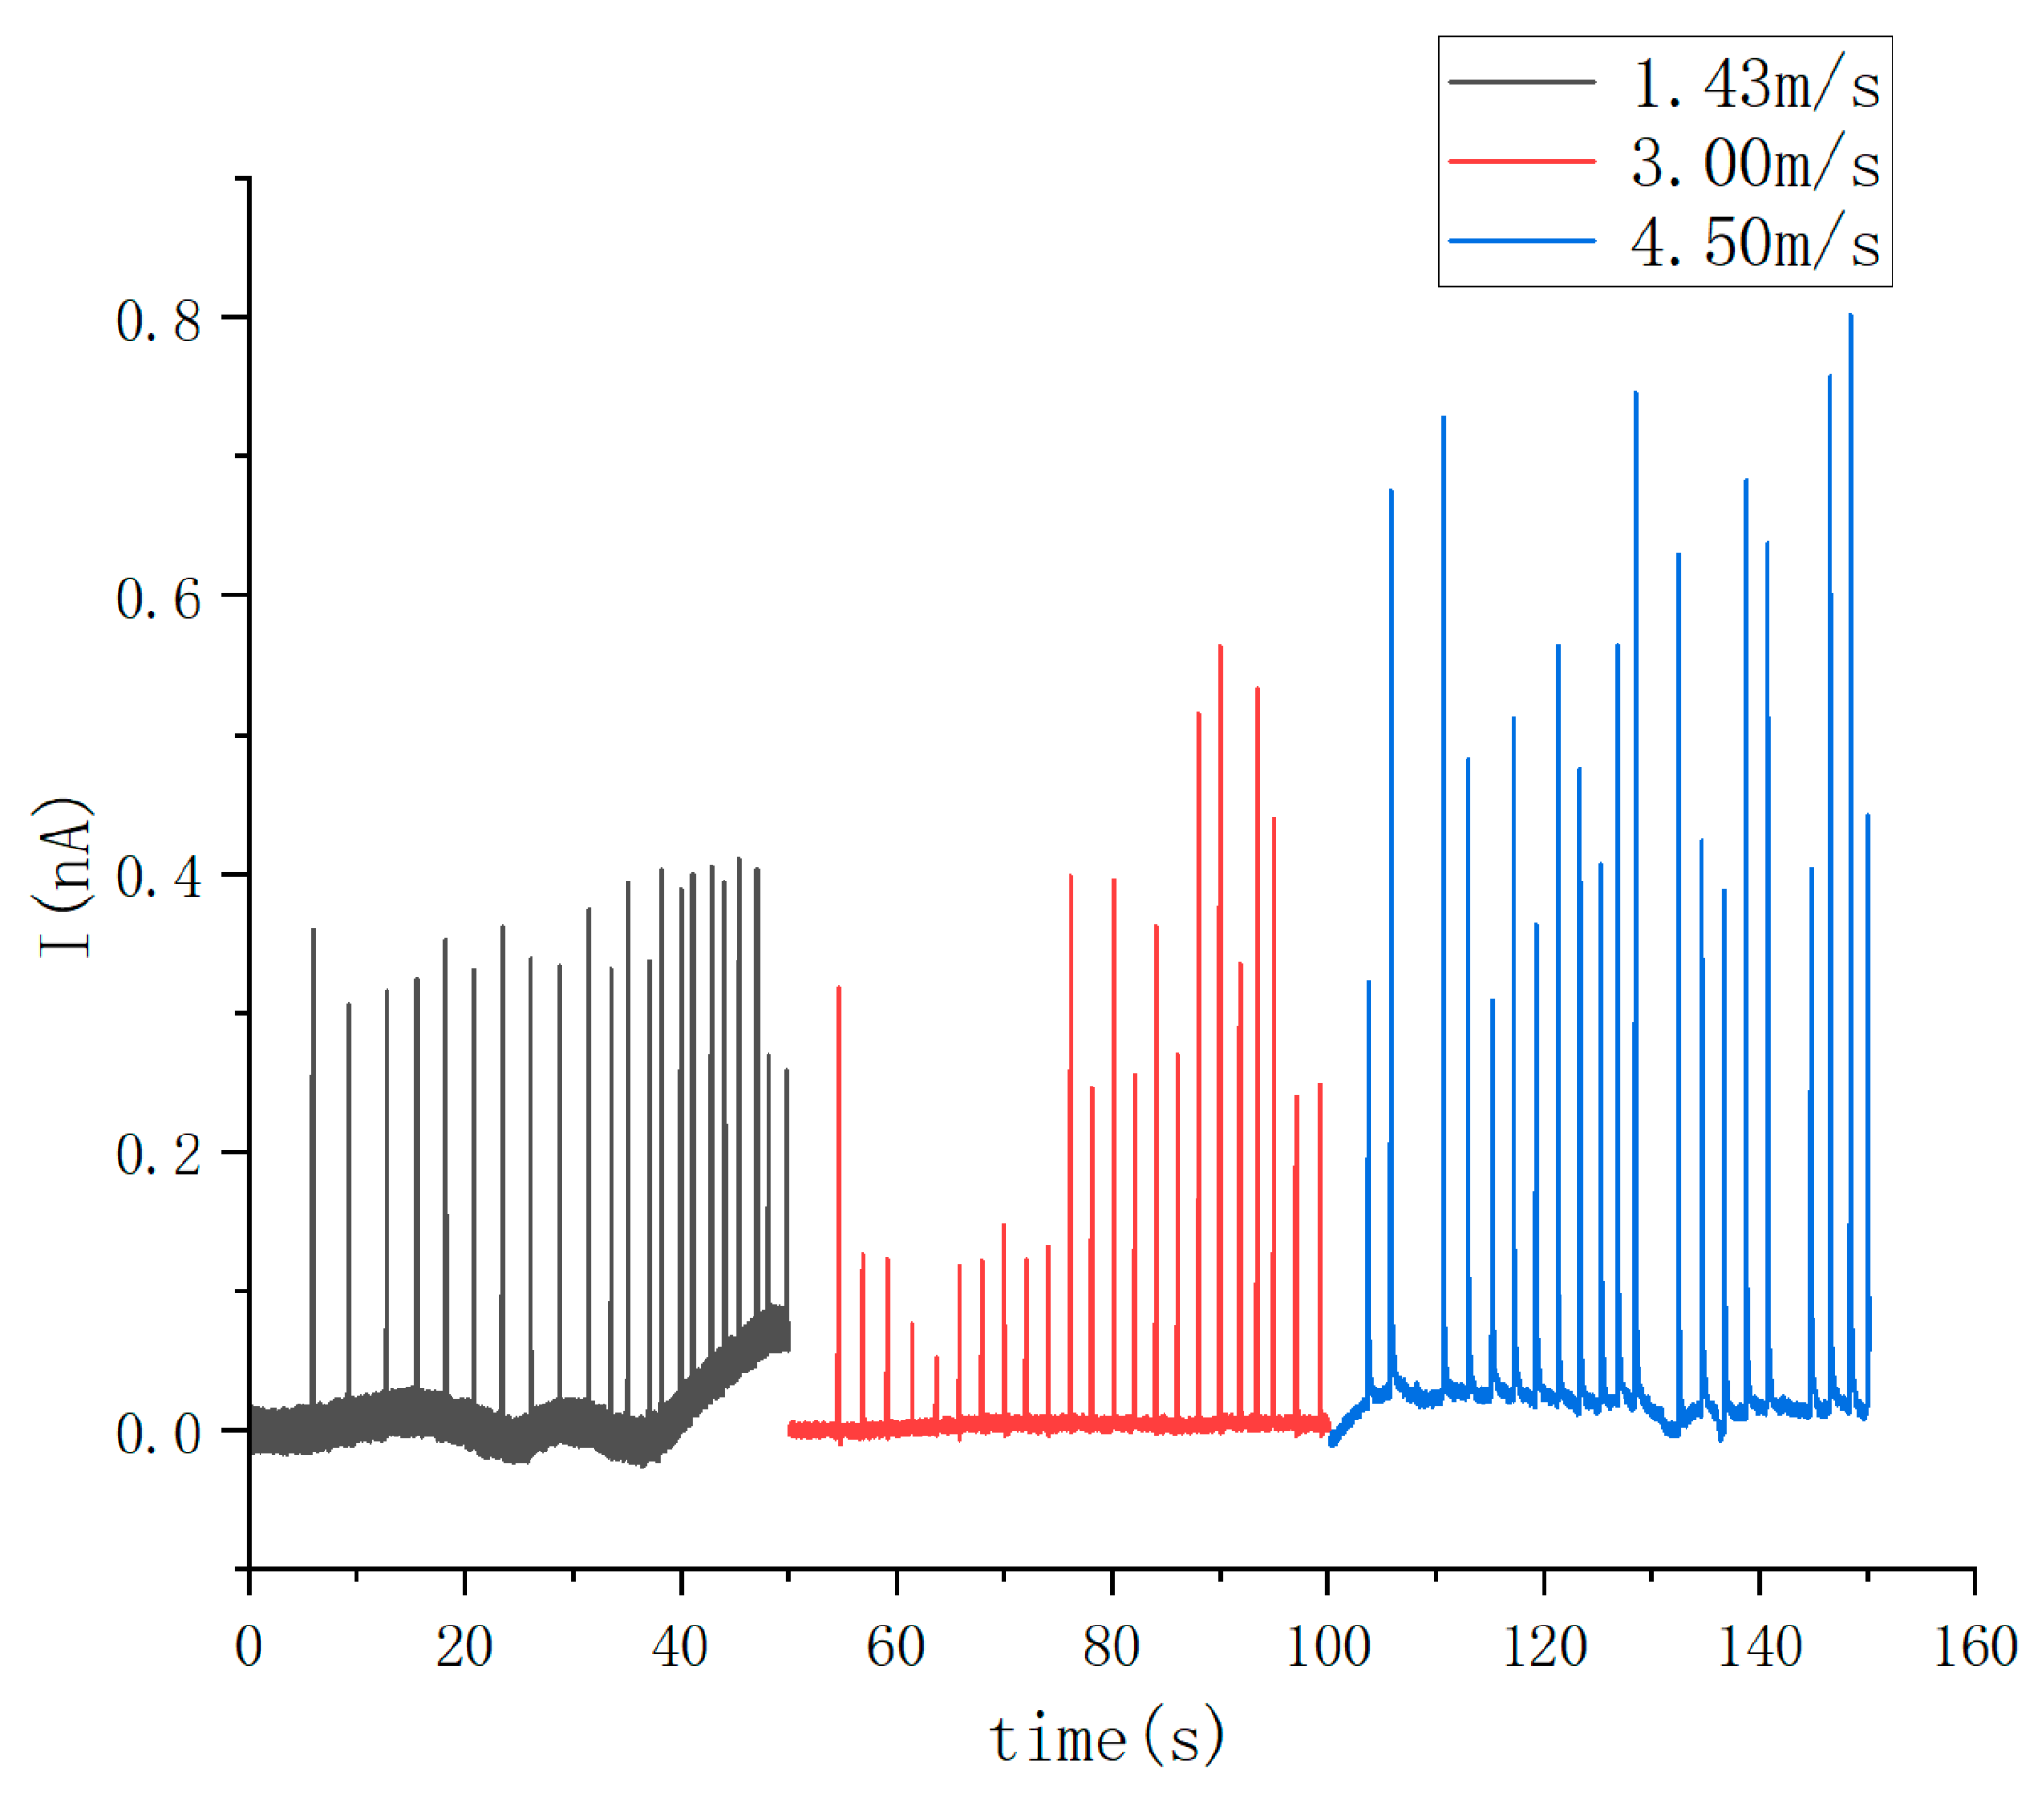
3.3. Influence of Droplet Velocity on the Electric Signals

To explore the impact of varying droplet impact velocities on droplet–leaf CE, we measured the currents generated by droplets released from three different heights (10, 50, and 100 cm). The impacted droplets had a diameter of approximately 4.31 mm and their average impact velocities were 1.43, 3.00, and 4.50 m/s, respectively, as measured by high-speed camera shots. In Figure 5, the results illustrate that the droplet–leaf impact velocity increased with the rising release height, while the droplet size remained constant. Additionally, the amplitude of the current signal increased with the rising droplet impact velocity. Observations from the experiments suggest that this phenomenon can be primarily attributed to the increase in droplet kinetic energy. As the kinetic energy rose, the spreading area of the droplet in contact with the leaf surface increased, generating more friction charge and resulting in a higher current amplitude. However, further increasing the droplet release height led to droplet splitting. This resulted in the creation of numerous satellite droplets that rebounded from the contact surface and eventually detached from the leaf instead of sliding on it. Moreover, the detachment of some droplets from the leaf surface negatively affected the current amplitude.

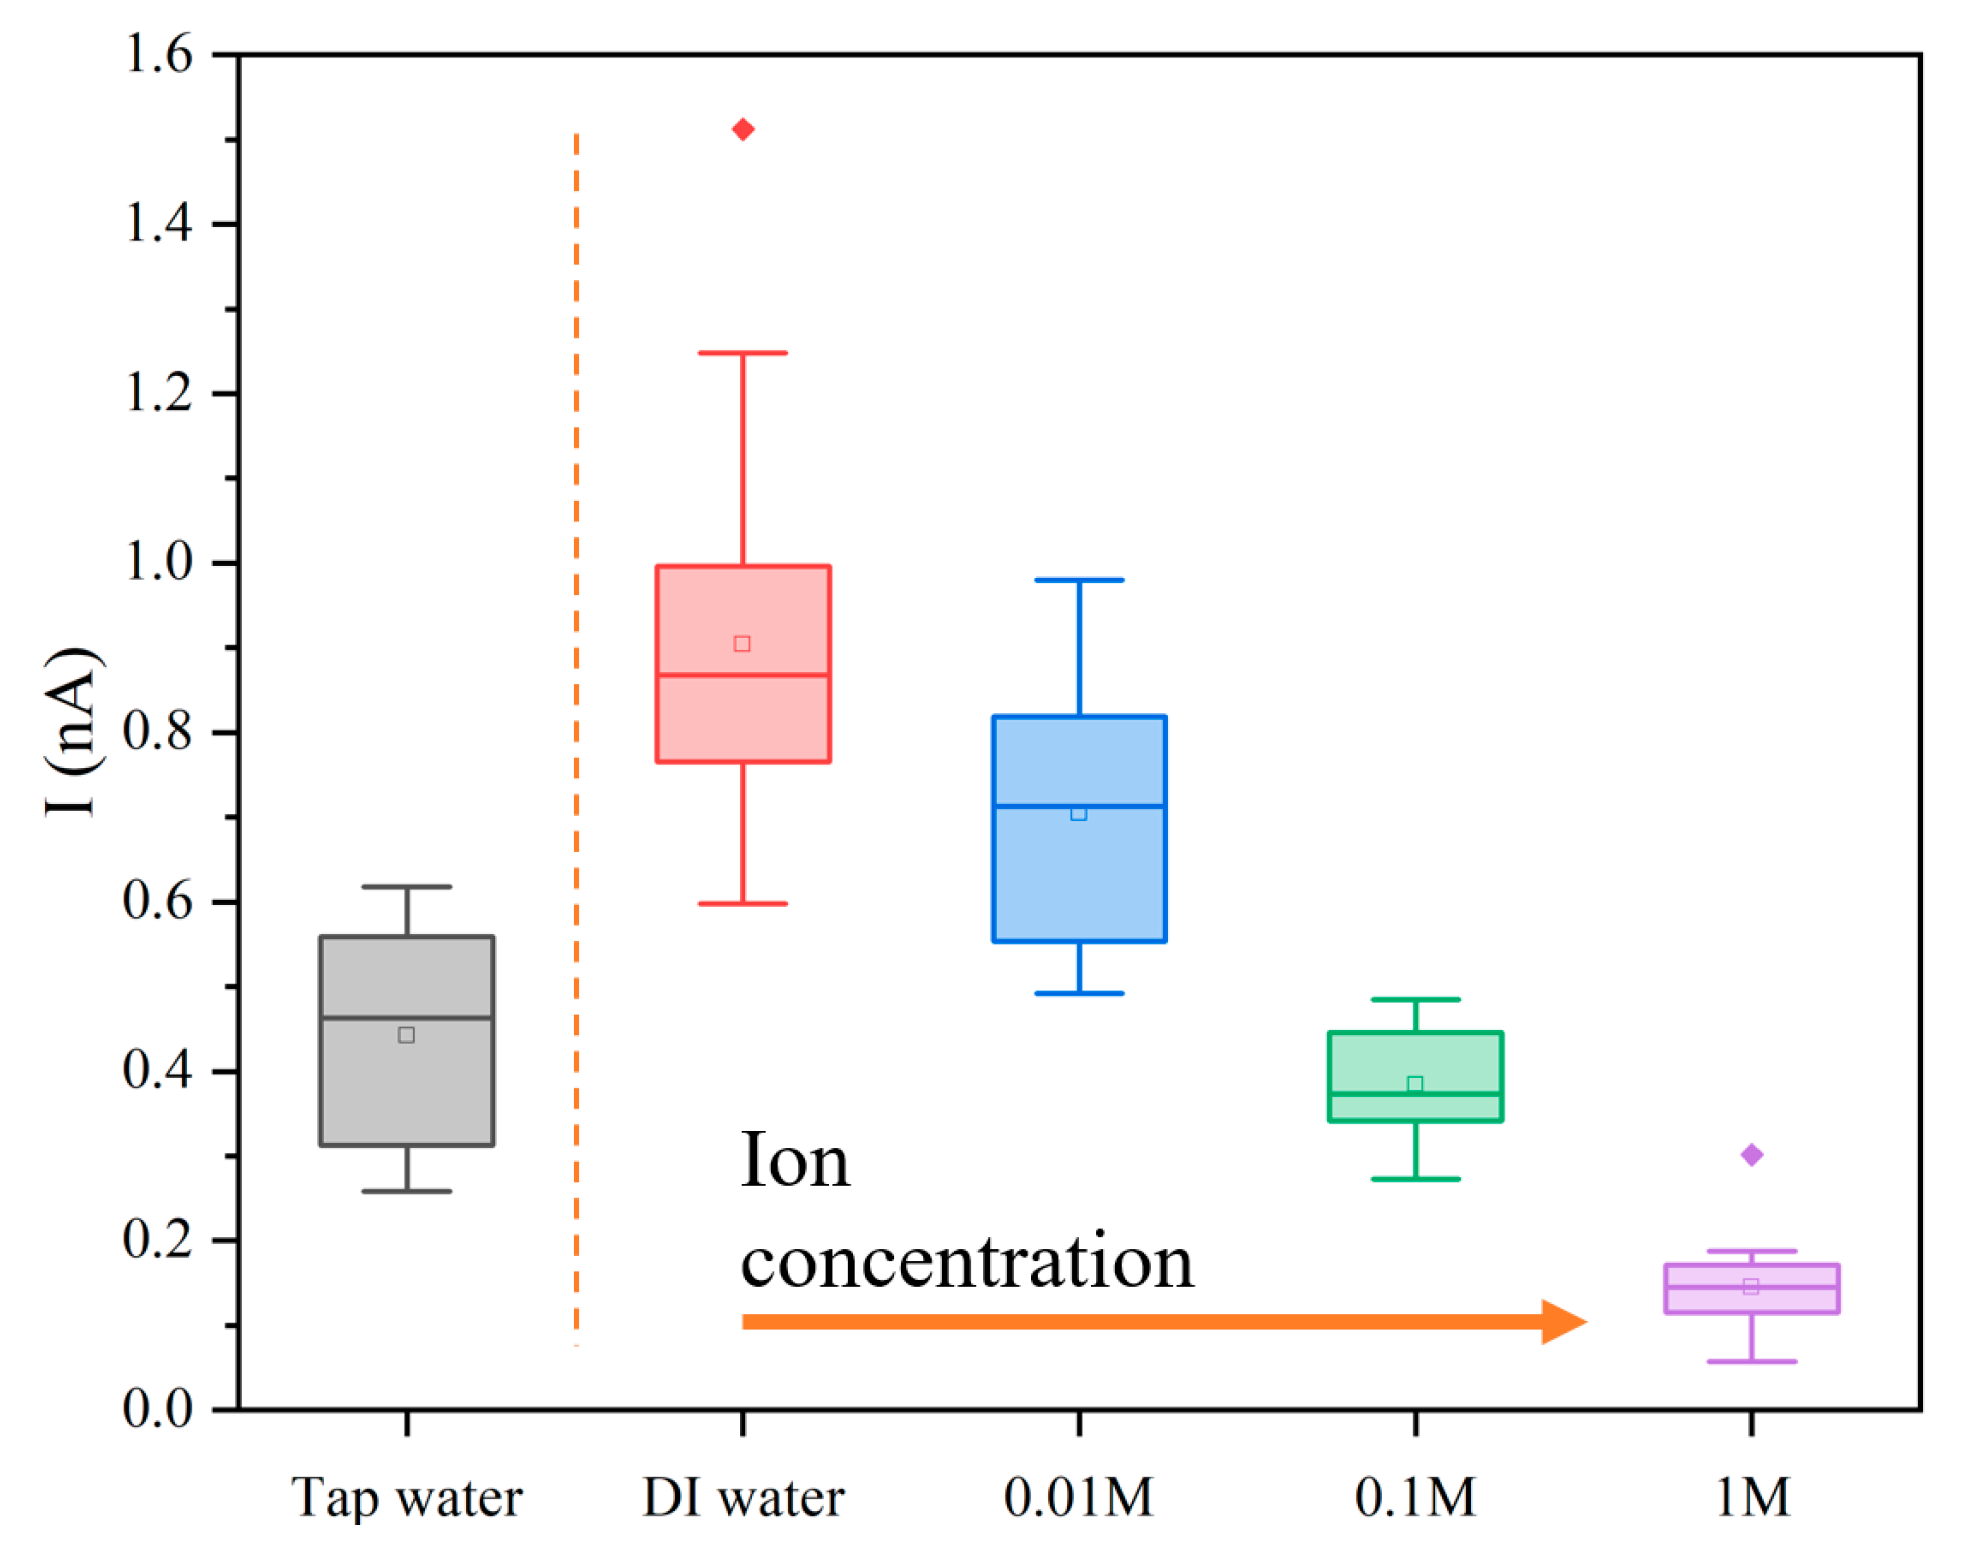
3.4. Influence of Ion Concentration on the Electric Signals

As previously mentioned, the charge generated by the droplet impact on the leaf relied on several factors. One key factor was the kinetic energy of the droplet E k = 0.5 m v 2 (where m is the mass of the droplet and v is the velocity at the moment of impact), primarily determined by the height of release (neglecting friction, v 2 = 2 g h , where h is the height at which the droplet falls and g is the acceleration due to gravity). In the subsequent experiments involving droplet impact leaf electrification, DI water and various concentrations of NaCl solutions were utilized. Figure 6 illustrates a significant difference in the current amplitude generated by the DI water droplet compared to that generated by the 1 M NaCl solution. Consistent with expectations, a higher ion concentration diminished the transferable charge, consequently reducing the current associated with droplet–leaf CE. It was found that the charge density on the solid surfaces decreased with the increase in the NaCl concentration. Consequently, tap and DI water were anticipated to yield the maximum output owing to their low ionic concentration. Of note, the 0.1 M NaCl solution exhibited current values similar to tap water. This observation suggests that tap water, unlike DI water, may not be ultrapure and could contain other ions, particles, etc., resulting in analogous electrification behavior for tap water and the 0.1 M NaCl solution.

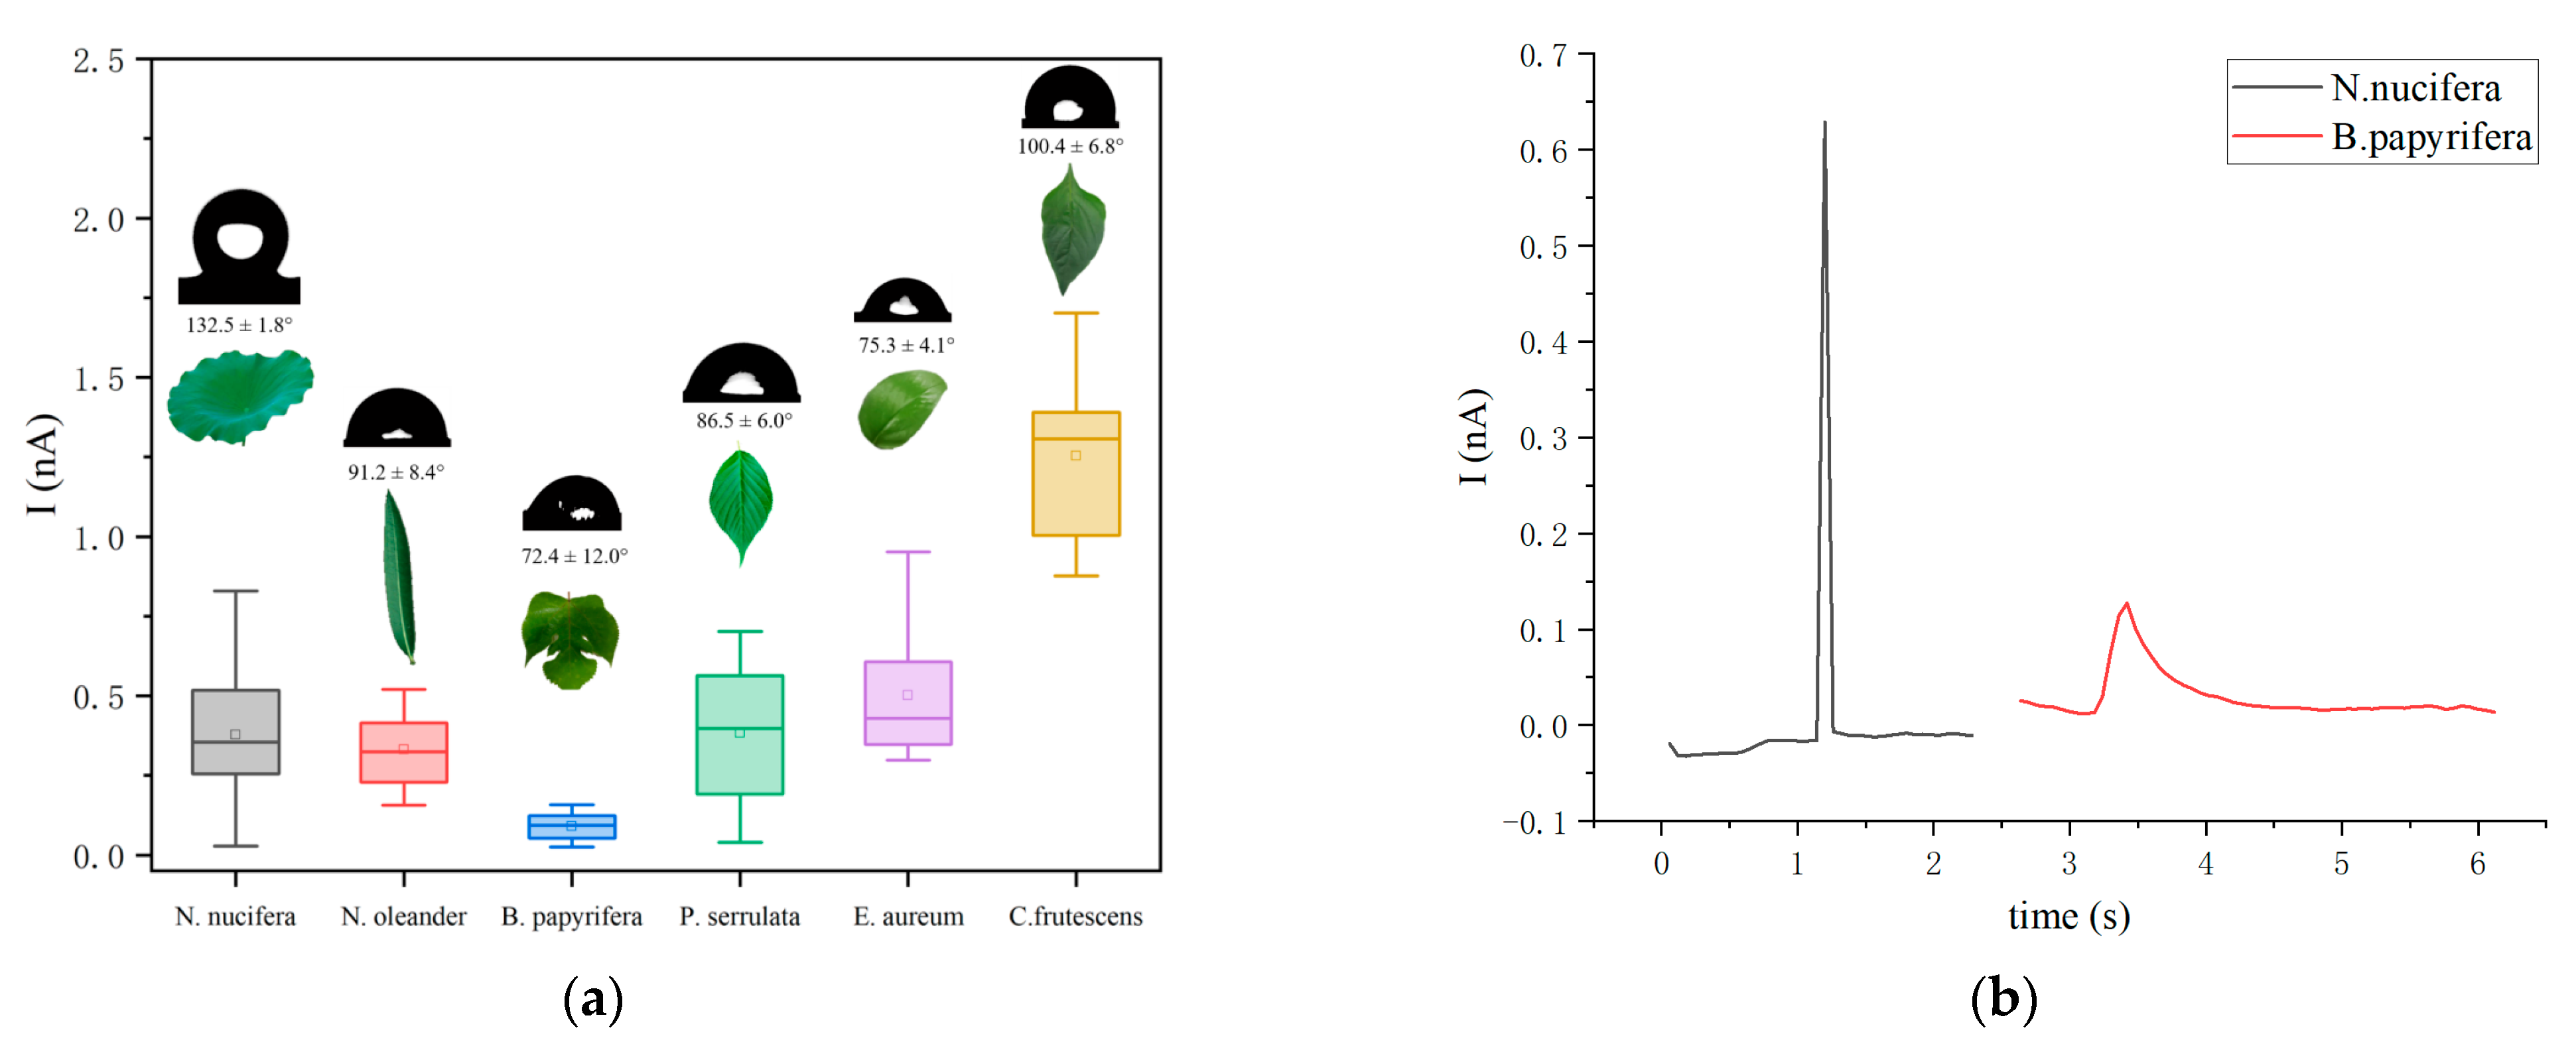
3.5. Comparison with Different Plant Species Surfaces

To assess the widespread applicability of droplet–leaf CE, we conducted repeated tests using various leaves, as depicted in Figure 7a. Subsequently, we categorized the hydrophobicity of the surface based on the surface contact angle of the DI droplet on the leaf. The surface contact angle was experimentally measured at the macroscopic scale and was attributed to the local thermodynamic equilibrium of interfacial tensions at the contact line, where the solid–liquid–gas triple phase intersected [39]. Consequently, the six crop leaves were classified into three hydrophobic species (N. nucifera, N. oleander, and C. frutescens) and three hydrophilic species (B. papyrifera, P. serrulata, and E. aureum). Figure 7b illustrates the currents generated by a single droplet impacting the leaves of N. nucifera and B. papyrifera. As evident from Figure 7b, during droplet–leaf interactions, hydrophobic leaves typically generated larger current amplitudes than hydrophilic leaves. Leaves with hydrophobic surfaces often produced high and sharp current peaks. Conversely, for leaves with relatively hydrophilic surfaces, such as those of B. papyrifera, the current curves were broad, and the current amplitudes were typically at a lower level.

4. Discussion

Our results clearly elucidated which factors of droplet contact with living leaves lead to higher or lower CE signals. Usually, the effects of these factors on the electrification behavior are closely linked. Yet, our results point to the following behavior.
First, clearly, the droplets factors played an essential role. The three factors especially affecting droplet impacting leaf CE were (1) droplet diameter (2) droplet velocity and (3) ion concentration of droplet. The experimental results indicated that droplets with larger diameters and impact velocities had greater kinetic energy, resulting in an increase in the spreading area between the droplet and the leaf surface. This increase in spreading area led to higher signal peaks. Previous studies have obtained similar results where as the droplet size increased, the contact area and contact force between the droplet and the leaf surface also increased. This increase in contact area and contact force is typically correlated with higher leaf CE and associated signals [34,40]. Signals generated by droplets on plant leaves were affected by ion concentration. High concentration solutions typically led to a reduction in droplet leaf CE charge through screening effects. This result was consistent with those of previous studies about liquid–solid CE in which a salt solution was the liquid and the output of the electrical signal decreased with the increase in the salt concentration [17,41].
Next, to the droplet properties, also the hydrophobic properties of the leaf played an essential role in the droplet leaf CE. The experimental results of six types of leaves showed that the signal obtained from hydrophobic leaves was typically higher than that obtained from hydrophilic leaves. This phenomenon may be attributed to the superior self-cleaning and moisture removal abilities of the hydrophobic leaf surface. However, upon contact with the droplet, the liquid film may persist on the hydrophilic leaf, potentially affecting signal generation. This was the main reason for the low and wide signal produced by the hydrophilic leaf. Kim et al. found that the leaf surface nanostructure and its specific chemistry particularly affect a droplet leaf CE. This was very helpful for us to further study the influence of leaf physiological parameters on CE [42]. Therefore, the results clearly indicated the potential application of sustainable and eco-friendly detection methods for developing droplet biosensors.

5. Conclusions

Droplet–leaf interactions are amongst the most frequent interactions that natural leaves experience. In this study, we investigated the effects of various factors, including impact velocity, droplet diameters, droplet ion concentrations, and leaf surfaces, on the droplet–leaf CE current signal. A high-speed video system was employed to capture motion images of the droplets after impacting the leaves. The main conclusions drawn from this study include the following:
The experimental results indicate that when droplets are uncharged and of a low ion concentration, droplet–leaf CE causes the signals. The signal amplitude generated by the droplet impacting the hydrophobic leaf was generally higher than that on the hydrophilic leaf. This suggests that the physical and chemical properties of the leaf surface, including the microstructure of the wax layer, wax density, and other parameters, affected the surface charge density of the droplet-impacted leaves. Further detailed investigations were warranted.
The magnitude of the current amplitude for droplet–leaf CE increased with the rise in droplet volume. However, as the impact velocity increased, large droplets tended to break up into multiple satellites of small droplets, resulting in a decrease in the current magnitude. This study contributes to a systematic understanding of droplet–leaf CE. The results provide a base for further understanding the charge transfer process of charged droplets deposited on living leaves and inspiration for the manufacturing of pesticide detection biosensors.

Supplementary Materials

The following supporting information can be downloaded at https://www.mdpi.com/article/10.3390/agronomy14030573/s1: Figure S1. (a) Leaf surface contact angle measurement. (b) Leaf surface characterization. Figure S2. (a) BNC Input connector. (b) Measurement connections. Figure S3. Leaf thickness of measuring position. Figure S4. (a) Before the droplet came into contact with the wire. (b) Equivalent circuit of open circuit state. (c) After the droplet came into contact with the wire. (d) Equivalent circuit at the closed loop stage. Figure S5. Leaf capacitance of measuring points. Figure S6. Water contact angle of the six leaf species. Table S1. Leaf thickness of measuring position. Table S2. Leaf capacitance of measuring points. Table S3. Standard deviation of droplet data with different velocities.

Author Contributions

Conceptualization, W.H. and B.Q.; methodology, W.H. and B.Q.; software, W.H. and Z.G.; formal analysis, W.H. and J.C.; investigation, W.H., J.C. and Z.G.; resources, B.Q.; writing—original draft preparation, W.H.; writing—review and editing, B.Q.; visualization, X.D. and B.Q.; supervision, X.D. and B.Q.; project administration, B.Q.; funding acquisition, B.Q. All authors have read and agreed to the published version of the manuscript.

Funding

This work was made possible by the National Natural Science Foundation of China (No. 31971790) and the Priority Academic Program Development of Jiangsu Higher Education Institutions (No. PAPD-2018-87).

Data Availability Statement

The data presented in this study are available on request from the corresponding author.

Conflicts of Interest

The authors declare no conflict of interest.

References

  1. Gilet, T.; Bourouiba, L. Fluid fragmentation shapes rain-induced foliar disease transmission. J. R. Soc. Interface 2015, 12, 20141092. [Google Scholar] [CrossRef] [PubMed]
  2. Roth-Nebelsick, A.; Konrad, W.; Ebner, M.; Miranda, T.; Thielen, S.; Nebelsick, J.H. When rain collides with plants-patterns and forces of drop impact and how leaves respond to them. J. Exp. Bot. 2022, 73, 1155–1175. [Google Scholar] [CrossRef]
  3. Patel, M.K.; Sahoo, H.K.; Nayak, M.K.; Ghanshyam, C. Plausibility of variable coverage high range spraying: Experimental studies of an externally air-assisted electrostatic nozzle. Comput. Electron. Agric. 2016, 127, 641–651. [Google Scholar] [CrossRef]
  4. White, D.; Gurung, S.; Zhao, D.; Tabler, T.; McDaniel, C.; Styles, D.; McKenzie, S.; Farnell, Y.; Farnell, M. Foam or spray application of agricultural chemicals to clean and disinfect layer cages. J. Appl. Poult. Res. 2018, 27, 416–423. [Google Scholar] [CrossRef]
  5. Ranjan, R.; Das, A.K. A review on surface protective coating using cold spray cladding technique. Mater. Today Proc. 2022, 56, 768–773. [Google Scholar] [CrossRef]
  6. Deng, Q.; Wang, H.; Xie, Z.; Zhou, X.; Tian, Y.; Zhang, Q.; Zhu, X.; Chen, R.; Liao, Q. Behaviors of the water droplet impacting on subcooled superhydrophobic surfaces in the electrostatic field. Chem. Eng. Sci. 2023, 266, 118282. [Google Scholar] [CrossRef]
  7. Lin, J.; Ma, J.; Liu, K.; Huang, X.; Xiao, L.; Ahmed, S.; Dong, X.; Qiu, B. Development and test of an autonomous air-assisted sprayer based on single hanging track for solar greenhouse. Crop Prot. 2021, 142, 105502. [Google Scholar] [CrossRef]
  8. Lin, S.; Zhao, B.; Zou, S.; Guo, J.; Wei, Z.; Chen, L. Impact of viscous droplets on different wettable surfaces: Impact phenomena, the maximum spreading factor, spreading time and post-impact oscillation. J. Colloid Interface Sci. 2018, 516, 86–97. [Google Scholar] [CrossRef]
  9. Lauderbaugh, L.K.; Ginebra-Solanellas, R.M.; Holder, C.D.; Webb, R. A biomechanical model of leaf inclination angle oscillations after raindrop impact. Environ. Exp. Bot. 2021, 190, 104586. [Google Scholar] [CrossRef]
  10. Ma, J.; Liu, K.; Dong, X.; Huang, X.; Ahmad, F.; Qiu, B. Force and motion behaviour of crop leaves during spraying. Biosyst. Eng. 2023, 235, 83–99. [Google Scholar] [CrossRef]
  11. Zhang, W.; Shi, Y.; Li, Y.; Chen, X.; Shen, H. A Review: Contact Electrification on Special Interfaces. Front. Mater. 2022, 9, 909746. [Google Scholar] [CrossRef]
  12. Wu, H.; Chen, Z.; Xu, G.; Xu, J.; Wang, Z.; Zi, Y. Fully biodegradable water droplet energy harvester based on leaves of living plants. ACS Appl. Mater. Interfaces 2020, 12, 56060–56067. [Google Scholar] [CrossRef]
  13. Armiento, S.; Filippeschi, C.; Meder, F.; Mazzolai, B. Liquid-solid contact electrification when water droplets hit living plant leaves. Commun. Mater. 2022, 3, 79. [Google Scholar] [CrossRef]
  14. Nan, Y.; Shao, J.; Willatzen, M.; Wang, Z.L. Understanding Contact Electrification at Water/Polymer Interface. Research 2022, 2022, 9861463. [Google Scholar] [CrossRef]
  15. Zheng, H.; Wu, H.; Yi, Z.; Song, Y.; Xu, W.; Yan, X.; Zhou, X.; Wang, S.; Wang, Z. Remote-Controlled Droplet Chains-Based Electricity Generators. Adv. Energy Mater. 2023, 13, 2203825. [Google Scholar] [CrossRef]
  16. Lin, S.; Zheng, M.; Wang, Z.L. Detecting the Liquid–Solid Contact Electrification Charges in a Liquid Environment. J. Phys. Chem. C 2021, 125, 14098–14104. [Google Scholar] [CrossRef]
  17. Lin, S.; Xu, L.; Chi Wang, A.; Wang, Z.L. Quantifying electron-transfer in liquid-solid contact electrification and the formation of electric double-layer. Nat. Commun. 2020, 11, 399. [Google Scholar] [CrossRef] [PubMed]
  18. Lin, S.; Chen, X.; Wang, Z.L. Contact Electrification at the Liquid-Solid Interface. Chem. Rev. 2022, 122, 5209–5232. [Google Scholar] [CrossRef] [PubMed]
  19. Tang, Z.; Lin, S.; Wang, Z.L. Effect of Surface Pre-Charging and Electric Field on the Contact Electrification between Liquid and Solid. J. Phys. Chem. C 2022, 126, 8897–8905. [Google Scholar] [CrossRef]
  20. Tang, Z.; Lin, S.; Wang, Z.L. Quantifying Contact-Electrification Induced Charge Transfer on a Liquid Droplet after Contacting with a Liquid or Solid. Adv. Mater. 2021, 33, e2102886. [Google Scholar] [CrossRef]
  21. Sun, M.; Lu, Q.; Wang, Z.L.; Huang, B. Understanding contact electrification at liquid-solid interfaces from surface electronic structure. Nat. Commun. 2021, 12, 1752. [Google Scholar] [CrossRef] [PubMed]
  22. Nauruzbayeva, J.; Sun, Z.; Gallo, A., Jr.; Ibrahim, M.; Santamarina, J.C.; Mishra, H. Electrification at water-hydrophobe interfaces. Nat. Commun. 2020, 11, 5285. [Google Scholar] [CrossRef] [PubMed]
  23. Mats, L.; Bramwell, A.; Dupont, J.; Liu, G.; Oleschuk, R. Electrowetting on superhydrophobic natural (Colocasia) and synthetic surfaces based upon fluorinated silica nanoparticles. Microelectron. Eng. 2015, 148, 91–97. [Google Scholar] [CrossRef]
  24. Li, X.; Tian, H.; Shao, J.; Ding, Y.; Chen, X.; Wang, L.; Lu, B. Decreasing the Saturated Contact Angle in Electrowetting-on-Dielectrics by Controlling the Charge Trapping at Liquid-Solid Interfaces. Adv. Funct. Mater. 2016, 26, 2994–3002. [Google Scholar] [CrossRef]
  25. Law, S.E. Agricultural electrostatic spray application: A review of significant research and development during the 20th century. J. Electrost. 2001, 51, 25–42. [Google Scholar]
  26. Maski, D.; Durairaj, D. Effects of electrode voltage, liquid flow rate, and liquid properties on spray chargeability of an air-assisted electrostatic-induction spray-charging system. J. Electrost. 2010, 68, 152–158. [Google Scholar] [CrossRef]
  27. Salcedo, R.; Llop, J.; Campos, J.; Costas, M.; Gallart, M.; Ortega, P.; Gil, E. Evaluation of leaf deposit quality between electrostatic and conventional multi-row sprayers in a trellised vineyard. Crop Prot. 2020, 127, 104964. [Google Scholar] [CrossRef]
  28. Patel, M.K.; Praveen, B.; Sahoo, H.K.; Patel, B.; Kumar, A.; Singh, M.; Nayak, M.K.; Rajan, P. An advance air-induced air-assisted electrostatic nozzle with enhanced performance. Comput. Electron. Agric. 2017, 135, 280–288. [Google Scholar] [CrossRef]
  29. Xu, L.; Zhu, H.; Ozkan, H.E.; Thistle, H.W. Evaporation rate and development of wetted area of water droplets with and without surfactant at different locations on waxy leaf surfaces. Biosyst. Eng. 2010, 106, 58–67. [Google Scholar] [CrossRef]
  30. Armiento, S.; Meder, F.; Mazzolai, B. Device for Simultaneous Wind and Raindrop Energy Harvesting Operating on the Surface of Plant Leaves. IEEE Robot. Autom. Lett. 2023, 8, 2269–2276. [Google Scholar] [CrossRef]
  31. Yoo, D.; Kim, S.J.; Joung, Y.; Jang, S.; Choi, D.; Kim, D.S. Lotus leaf-inspired droplet-based electricity generator with low-adhesive superhydrophobicity for a wide operational droplet volume range and boosted electricity output. Nano Energy 2022, 99, 107361. [Google Scholar] [CrossRef]
  32. Yan, Z.; Xu, D.; Lin, Z.; Wang, P.; Cao, B.; Ren, H.; Song, F.; Wan, C.; Wang, L.; Zhou, J. Highly stretchable van der Waals thin films for adaptable and breathable electronic membranes. Science 2022, 375, 852–859. [Google Scholar] [CrossRef] [PubMed]
  33. Jie, Y.; Jia, X.; Zou, J.; Chen, Y.; Wang, N.; Wang, Z.L.; Cao, X. Natural Leaf Made Triboelectric Nanogenerator for Harvesting Environmental Mechanical Energy. Adv. Energy Mater. 2018, 8, 1703133. [Google Scholar] [CrossRef]
  34. Meder, F.; Must, I.; Sadeghi, A.; Mondini, A.; Filippeschi, C.; Beccai, L.; Mattoli, V.; Pingue, P.; Mazzolai, B. Energy Conversion at the Cuticle of Living Plants. Adv. Funct. Mater. 2018, 28, 1806689. [Google Scholar] [CrossRef]
  35. Xu, W.; Zheng, H.; Liu, Y.; Zhou, X.; Zhang, C.; Song, Y.; Deng, X.; Leung, M.; Yang, Z.; Xu, R.X.; et al. A droplet-based electricity generator with high instantaneous power density. Nature 2020, 578, 392–396. [Google Scholar] [CrossRef]
  36. Wu, H.; Mendel, N.; van Der Ham, S.; Shui, L.; Zhou, G.; Mugele, F. Charge Trapping-Based Electricity Generator (CTEG): An ultrarobust and high efficiency nanogenerator for energy harvesting from water droplets. Adv. Mater. 2020, 32, 2001699. [Google Scholar] [CrossRef] [PubMed]
  37. Wu, H.; Mendel, N.; van den Ende, D.; Zhou, G.; Mugele, F. Energy harvesting from drops impacting onto charged surfaces. Phys. Rev. Lett. 2020, 125, 078301. [Google Scholar] [CrossRef]
  38. Zhang, N.; Gu, H.; Lu, K.; Ye, S.; Xu, W.; Zheng, H.; Song, Y.; Liu, C.; Jiao, J.; Wang, Z. A universal single electrode droplet-based electricity generator (SE-DEG) for water kinetic energy harvesting. Nano Energy 2021, 82, 105735. [Google Scholar] [CrossRef]
  39. Gennes, P.-G.; Brochard-Wyart, F.; Quéré, D. Capillarity and Wetting Phenomena: Drops, Bubbles, Pearls, Waves; Springer: Berlin/Heidelberg, Germany, 2004. [Google Scholar]
  40. Vasandani, P.; Mao, Z.-H.; Jia, W.; Sun, M. Relationship between triboelectric charge and contact force for two triboelectric layers. J. Electrost. 2017, 90, 147–152. [Google Scholar] [CrossRef]
  41. Cao, S.; Zhang, H.; Cui, X.; Yuan, Z.; Ding, J.; Sang, S. Fully-Enclosed Metal Electrode-Free Triboelectric Nanogenerator for Scavenging Vibrational Energy and Alternatively Powering Personal Electronics. Adv. Eng. Mater. 2019, 21, 1800823. [Google Scholar] [CrossRef]
  42. Kim, D.W.; Kim, S.W.; Jeong, U. Lipids: Source of static electricity of regenerative natural substances and nondestructive energy harvesting. Adv. Mater. 2018, 30, 1804949. [Google Scholar] [CrossRef] [PubMed]
Figure 1. The schematic of the experimental system.
Agronomy 14 00573 g001
Figure 2. (a) Picture of C. frutescens leaf (inset is the surface morphology observed by digital microscope). (b) Schematic cross-section of C. frutescens leaf. (c) Cross-section of a leaf connected to an external circuit. (d) Equivalent circuit of open circuit state.
Agronomy 14 00573 g002
Figure 3. (a) Four stages of droplet impact on the leaf surface. (b) Schematic diagram of the mechanism of droplet–leaf CE.
Agronomy 14 00573 g003
Figure 4. Influence of droplet diameter on the electric signals.
Agronomy 14 00573 g004
Figure 5. Influence of droplet velocity on the electric signals.
Agronomy 14 00573 g005
Figure 6. Influence of droplet composition and ion content on current generation. (grey—tap water; red—DI water; bule—0.01 M NaCl solution; green—0.1 M NaCl solution; purple—0.01 M NaCl solution).
Agronomy 14 00573 g006
Figure 7. Comparison of electrical signals of different plant species. (a) Comparison with other plant species surfaces. (b) Comparison of N. nucifera and B. papyrifera. (grey—N. nucifera; red—N. oleadnder; bule—B. papyrifera; green—P. serrulata; purple—E. aureum; yellow—C. frutescens).
Agronomy 14 00573 g007
Disclaimer/Publisher’s Note: The statements, opinions and data contained in all publications are solely those of the individual author(s) and contributor(s) and not of MDPI and/or the editor(s). MDPI and/or the editor(s) disclaim responsibility for any injury to people or property resulting from any ideas, methods, instructions or products referred to in the content.

