Article

Genome-Wide Association Studies of Three-Dimensional (3D) Cassava Root Crowns and Agronomic Traits Using Partially Inbred Populations

by
Pongsakorn Sunvittayakul
1,
Passorn Wonnapinij
1,2,
Pornchanan Chanchay
1,
Pitchaporn Wannitikul
1,
Sukhita Sathitnaitham
1,
Phongnapha Phanthanong
3,
Kanokpoo Changwitchukarn
3,
Anongpat Suttangkakul
1,2,
Hernan Ceballos
4,
Leonardo D. Gomez
5,
Piya Kittipadakul
3,* and
Supachai Vuttipongchaikij
1,2,*
1
Department of Genetics, Faculty of Science, Kasetsart University, 50 Ngam Wong Wan Road, Chatuchak, Bangkok 10900, Thailand
2
Center of Advanced Studies for Tropical Natural Resources, Kasetsart University, 50 Ngam Wong Wan Road, Chatuchak, Bangkok 10900, Thailand
3
Department of Agronomy, Faculty of Agriculture, Kasetsart University, 50 Ngam Wong Wan Road, Chatuchak, Bangkok 10900, Thailand
4
International Center for Tropical Agriculture (CIAT), Palmira 6713, Colombia
5
Centre of Novel Agricultural Products (CNAP), Department of Biology, University of York, Heslington, York YO10 5DD, UK
*
Authors to whom correspondence should be addressed.
Agronomy 2024, 14(3), 591; https://doi.org/10.3390/agronomy14030591
Submission received: 17 February 2024 / Revised: 12 March 2024 / Accepted: 13 March 2024 / Published: 15 March 2024
(This article belongs to the Section Crop Breeding and Genetics)

Abstract

:
Cassava (Manihot esculenta Crantz) is a key industrial crop in Southeast Asia and a staple for food security in Africa, owing to its resilience and efficiency in starch production. This study aims to unravel the genetic determinants of specific cassava root crown traits, utilizing 3D modeling for yield-related attributes and root crown morphology. Phenotypic analysis of 130 partially inbred lines and their six parental lines from Thai commercial varieties revealed a range of root traits within populations showcasing robust correlations among various traits, particularly root size parameters and root weight. Genotyping-by-sequencing yielded a total of 29,361 SNP markers identified within the nuclear genome of cassava and shared across all genotypes. Genome-Wide Association Studies (GWAS) of these 136 genotypes identified 23 significant SNPs for six out of 11 root crown traits, including 3D root angle, 3D surface area, root number, 3D crown diameter, root weight, and 3D volume. We found one shared significant SNP between 3D crown diameter and root weight, and another shared SNP between root weight and 3D volume. Two closely linked SNPs were identified for 3D volume, root weight, and 3D surface area. Linkage disequilibrium (LD) analysis for each pair of SNP markers indicated the linkage decay point at approximately 60 kb. Based on LD decay and available transcriptome data, candidate gene identification highlighted 29 genes associated with five traits, providing an understanding of the genetic basis of cassava root crown traits. Our findings offer novel insights into cassava storage root traits as well as data for marker development and candidate gene identification.

1. Introduction

Cassava (Manihot esculenta Crantz) is an important industrial crop in tropical and subtropical regions, serving as a primary source of starch for various industries, including food, feed, and manufacturing sectors [1]. Is it also a fundamental food security staple for Africa [2]. Southeast Asia, in particular, relies heavily on cassava for industrial purposes due to its resilience under challenging environmental conditions, offering tolerance to drought and low fertility soils, thereby ensuring food security in the region [2]. Successful cassava production in this region stems from strategic breeding efforts that have resulted in varieties well-adapted to local soil and climate conditions, with high yields from the root crown system to enhance overall production efficiency [3]. Despite these advancements, cassava breeding remains largely reliant on traditional methods, involving inter-varietal crossing and phenotypic selection for clonal propagation, with limited use of genetic markers due to challenges posed by the heterozygous nature of progenitors [4].
Efforts to enhance cassava performance have traditionally focused on root yield, a quantitative trait involving the assessment of root weight, dry matter content, and occasionally the counting of roots per plant. However, the complexity of root yield, influenced by diverse genetic controls and non-additive effects, has made it challenging to pinpoint specific genes responsible for root size [4,5].
Our previous work on 3D modeling of the cassava root crown contributed to dissecting the root structure, offering insights into root size definition [6]. This work underlined the necessity to understand the genetic controls for storage root crown traits, including root volume, surface area, crown diameter, root number, root angle, and parameters related to soil area such as (cylinder) soil volume and compactness. By dissecting the combined root structure, this approach holds the key to identifying key genetic factors contributing to root yield and shape of root crowns, thus facilitating genetic improvement through breeding.
Genome-wide association studies (GWAS) have emerged as a transformative tool, enabling the exploration of the genetic diversity within cassava populations to identify associations between specific genomic regions and agronomic traits [7]. While agronomic traits such as root weight, dry matter content, and starch content have been studied in a number of populations across continents; studies focusing on specific root traits based on morphology have primarily relied on individual root measurements [8,9,10,11,12]. The parameters shaping root crown structure have been overlooked, mainly due to limited tools based on direct measurements and 2D photographic data. The 3D model phenotyping offers an opportunity to identify key genetics loci governing various root crown traits.
In this study, we aimed to identify the genetic loci associated with cassava root crown traits, focusing on yield and root crown morphology attributes. Utilizing 3D modeling, we quantified parameters related to root crown morphology and size. Our study focused on 136 lines including partially inbred populations at S1 and S2 generations and their six parental varieties. This panel was grown and the root crown data were collected using 3D modeling. We analyzed 11 yield-related traits and 3D modeling parameters using GWAS to identify association loci within the cassava genome and explored potential candidate genes. Our goal is to unravel the genetic architecture of cassava root crown traits, providing insights for cassava breeding.

2. Materials and Methods

2.1. Germplasm, Experimental Design and Cultivation Conditions

There were six S0 progenitors. Two were landraces: Rayong 1 and Hanatee (R1 and HNT, respectively), and the remaining four were the released cultivars Rayong 5, Rayong 90, Huay Bong 80, and Kasetsart 50 (R5, R90, HB80, and KU50, respectively) (Table 1). S1 and S2 partial-inbred lines were generated by controlled self-pollination, and the botanical seeds were germinated in soil contained in plastic bags for two months, and then transplanted in the experimental field. Seedlings that showed stunted growth or were small were discarded. The S1 and S2 lines were pre-selected from an earlier single-row yield trial, representing a spectrum of high, medium, and low root yields to be included in this study. There were 99 S1 and 31 S2 genotypes. At ten months of age, stems were harvested and cut into 20-cm cuttings for cloning and planting in the field. Planting followed a single-row trial with 1.5 × 1.5 m spacing (within and between rows). An augmented randomized complete block design (augmented RCBD) with nine blocks and non-replicated samples was employed. Each block contained six commercial varieties as checks. In each row, eight stem cuttings were planted, and the middle six plants were used for data collection and analysis. Border rows were used in the experimental field. The experiment was conducted in the Photharam District, Ratchaburi, Thailand (location coordinates: 13.653699 and 99.821265) from April 2019 to March 2020 without irrigation. The soil type is fine-sandy loam. Fertilizer was added 4 months after planting. The roots were hand-harvested 11 months after planting.

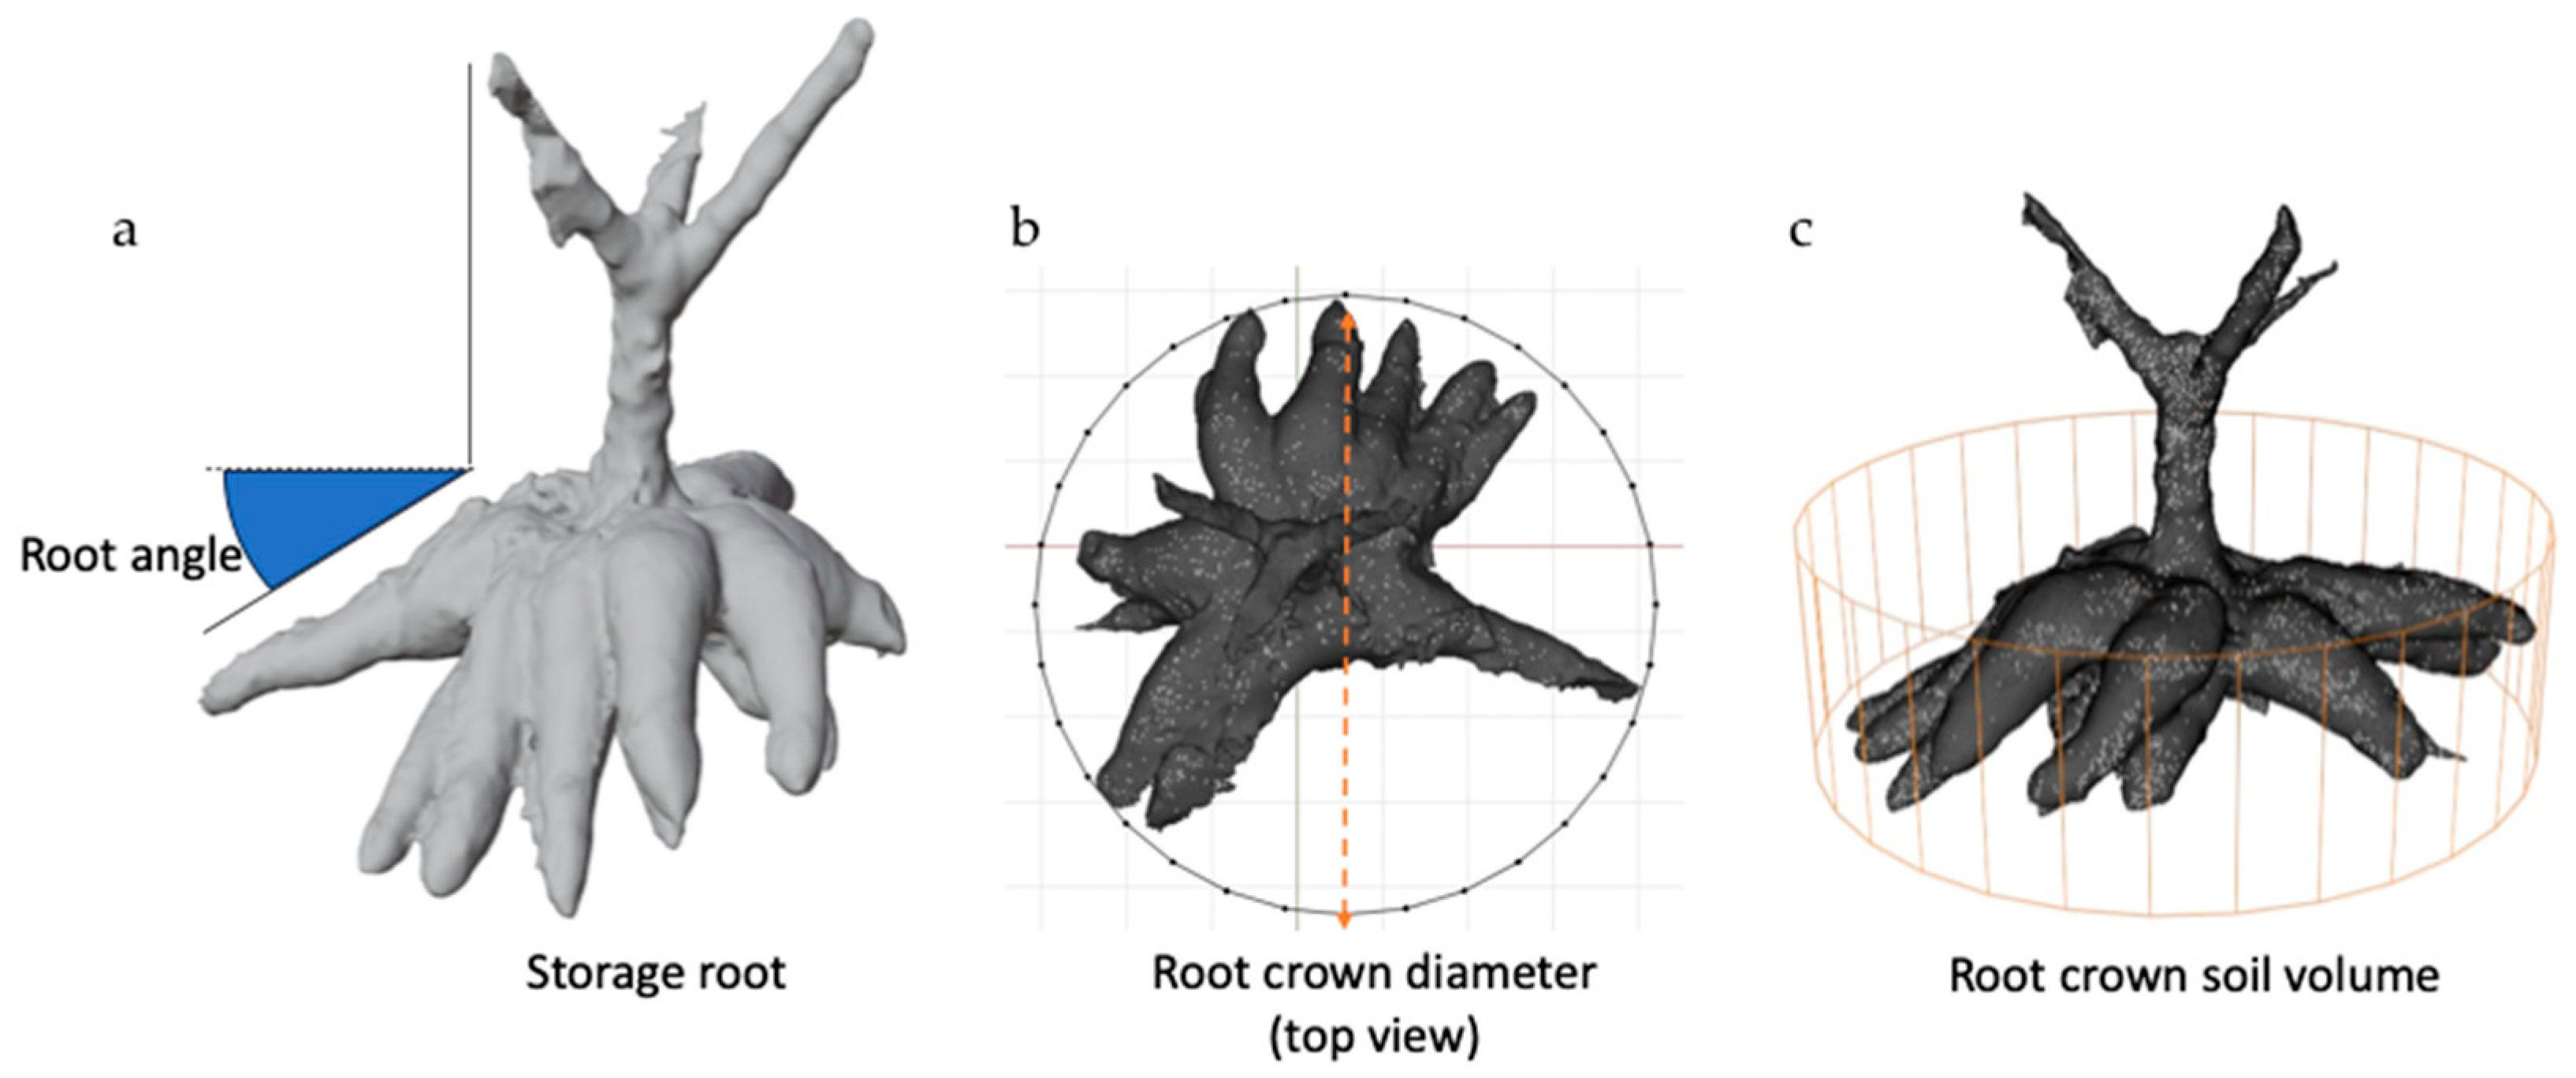
2.2. Data Collection and 3D Analysis

Cassava root crowns (CRCs) were manually extracted from the soil (using a leverage tool with an attached grip) and weighed on the field. The harvest index (HI), the ratio of CRC weight to the whole plant weight, was determined. Three-dimensional CRC analysis was performed as outlined in [6]. Briefly, CRCs were photographed on the field using a DSLR, a green background (120 × 120 cm), and a reference object (W × L × H: 12.5 × 12.5 × 34 cm). Approximately, 25–40 images per CRC were used for 3D image construction. Agisoft Metashape 1.6.5 standard edition with an educational license (Agisoft LLC., St. Petersburg, Russia) and Blender 2.90.1 [13] were used to construct and analyze 3D models, respectively. Prior to 3D analysis, models were rescaled using the reference object. Measurements of 3D surface area, 3D crown diameter, and 3D cylinder soil volume were obtained using the built-in analysis tools. Root angles were averaged from the three lowest angles within each CRC. Three-dimensional density was calculated using root weight and 3D volume. The 3D surface-to-volume ratio was calculated using 3D surface area and 3D volume. Additionally, 3D CRC compactness was calculated using 3D root crown volume and 3D cylinder soil volume.

2.3. DNA Isolation and Sequence Analysis

Cassava gDNA was isolated from young leaves using a modified CTAB method and FavorPrep™ Plant Genomic DNA Extraction Mini Kit (Favorgen Biotech Corp, Ping Tung, Taiwan). The quantity and purity of gDNA were verified by agarose gel electrophoresis and Nanodrop. Genotyping-by-sequencing was performed with pair-end reads on the Illumina® HiSeq/MiSeq platform (Illumina Inc., San Diego, CA, USA), with a read length of 31–144 bp at each end. The sequenced reads were assigned to accessions using unique barcode sequences and aligned to the reference genome (Manihot_esculenta_v8) through the BWA software 0.7.17. The BAM files were handled by SAMTools 1.10 [14], and variants were called using Freebayes [15]. The average read depth on the reference genome (639.6 Mb) is in the 2.03X to 3.06X range. A total of 2,078,599 bi-allelic SNPs were detected across 18 nuclear chromosomes, two organelle genomes, and 25 unplaced contigs. These variants were filtered for minor allele frequency (MAF) of 0.01 and SNPs missing rate of 0% by bcftools [16]. A total of 29,733 bi-allelic SNP markers (29,361, 260 and 112 SNPs in the nuclear genome, organelle genomes, and unplaced contigs, respectively) were found in 136 samples. Only the 29,361 SNPs distributed across the 18 cassava nuclear chromosomes were used for population structure, genomic kinship estimation, and GWAS analysis. The observed heterozygosity and polymorphic information criteria (PIC) were calculated for polymorphic sites.

2.4. Data Analysis

All data analysis was performed in the R 4.2.1 software package [17]. Analysis of different phenotypic values obtained from S0, S1, and S2 generations was performed using an augmented RCBD package [18]. Pearson’s correlation analysis was performed by using the PerformanceAnalytics package [19] using the correlation matrix chart function. Principal component analysis (PCA) was computed using the FactoMineR and factoextra R packages. Narrow sense heritability was calculated based on an additive relationship matrix following published methodologies [20,21,22]. For association studies, the population structure was evaluated based on the PCA using function prcomp of the stat package and plotted using functions in the ggfortify [23] and ggplot [24] packages. The kinship matrix was calculated using the function A.mat in the rrBLUP package [25]. GWAS was performed based on the mixed linear model (MLM), the fixed and random effects model for circulating probability unification (FarmCPU) and Bayesian-information and Linkage-disequilibrium Iteratively Nested Keyway (BLINK) models using the GAPIT package [26]. The linkage disequilibrium (LD) values (r2) and physical distance (bp) were calculated using PopLDdecay [27]. The r2 and physical distance (bp) were plotted, and the LOESS method was applied to summarize the relationship between these values using the ggplot package. The genomic region potentially linked to the statistically associated SNPs was identified using the GALLO package [28].

3. Results

3.1. Phenotypic Variability of Cassava Root Traits in Partially Inbred Populations

We analyzed a total of 136 cassava genotypes, comprising 99 S1 lines, 31 S2 lines, and 6 progenitors (elite Thai commercial varieties). Our phenotypic analysis involved on-field measurements and 3D cassava root crown (CRC) modeling. To evaluate root yield, we conducted a comprehensive yield trial, recording root weight and harvest index (HI) at the time of harvest. Furthermore, we employed 3D CRC modeling to collect the details of CRC traits (Figure 1). Table 2 provides a summary of the details of the 11 traits considered, and Figure S1 illustrates the data distributions of these traits within the population. The data show the variability of root traits in the population. Notably, the 3D root density and 3D root surface-to-volume ratio display relatively limited variation, while 3D cylinder soil volume and 3D CRC compactness showed skewed distributions towards lower values. Despite expectations of inbreeding depression, the preselection process from previous years likely mitigated the impact of inbreeding in yield.
To gain insights into the genetic effects on the variation observed in the 11 root traits, we examined the narrow-sense heritability (h2) of these traits (Table 2). Most of the h2 of the root traits were moderate ranging between 0.307 and 0.455, except HI and 3D density, which showed very low heritability. It is noteworthy that all these h2 values fall below the threshold of 0.5, indicating a significant impact of environmental factors on shaping the observed phenotypic variation. These data also suggested that the phenotypes may be influenced by non-additive genetic factors. This finding aligns with previous studies on cassava root yield, particularly emphasizing the role of non-additive genetic effects, such as dominance and epistasis, governing cassava root weight, while certain traits, like starch content, were suggested to be primarily influenced by additive genetic effects [4]. These results underline the intricate genetic basis of cassava root traits, where genetic and environmental factors determine the potential for root yield.

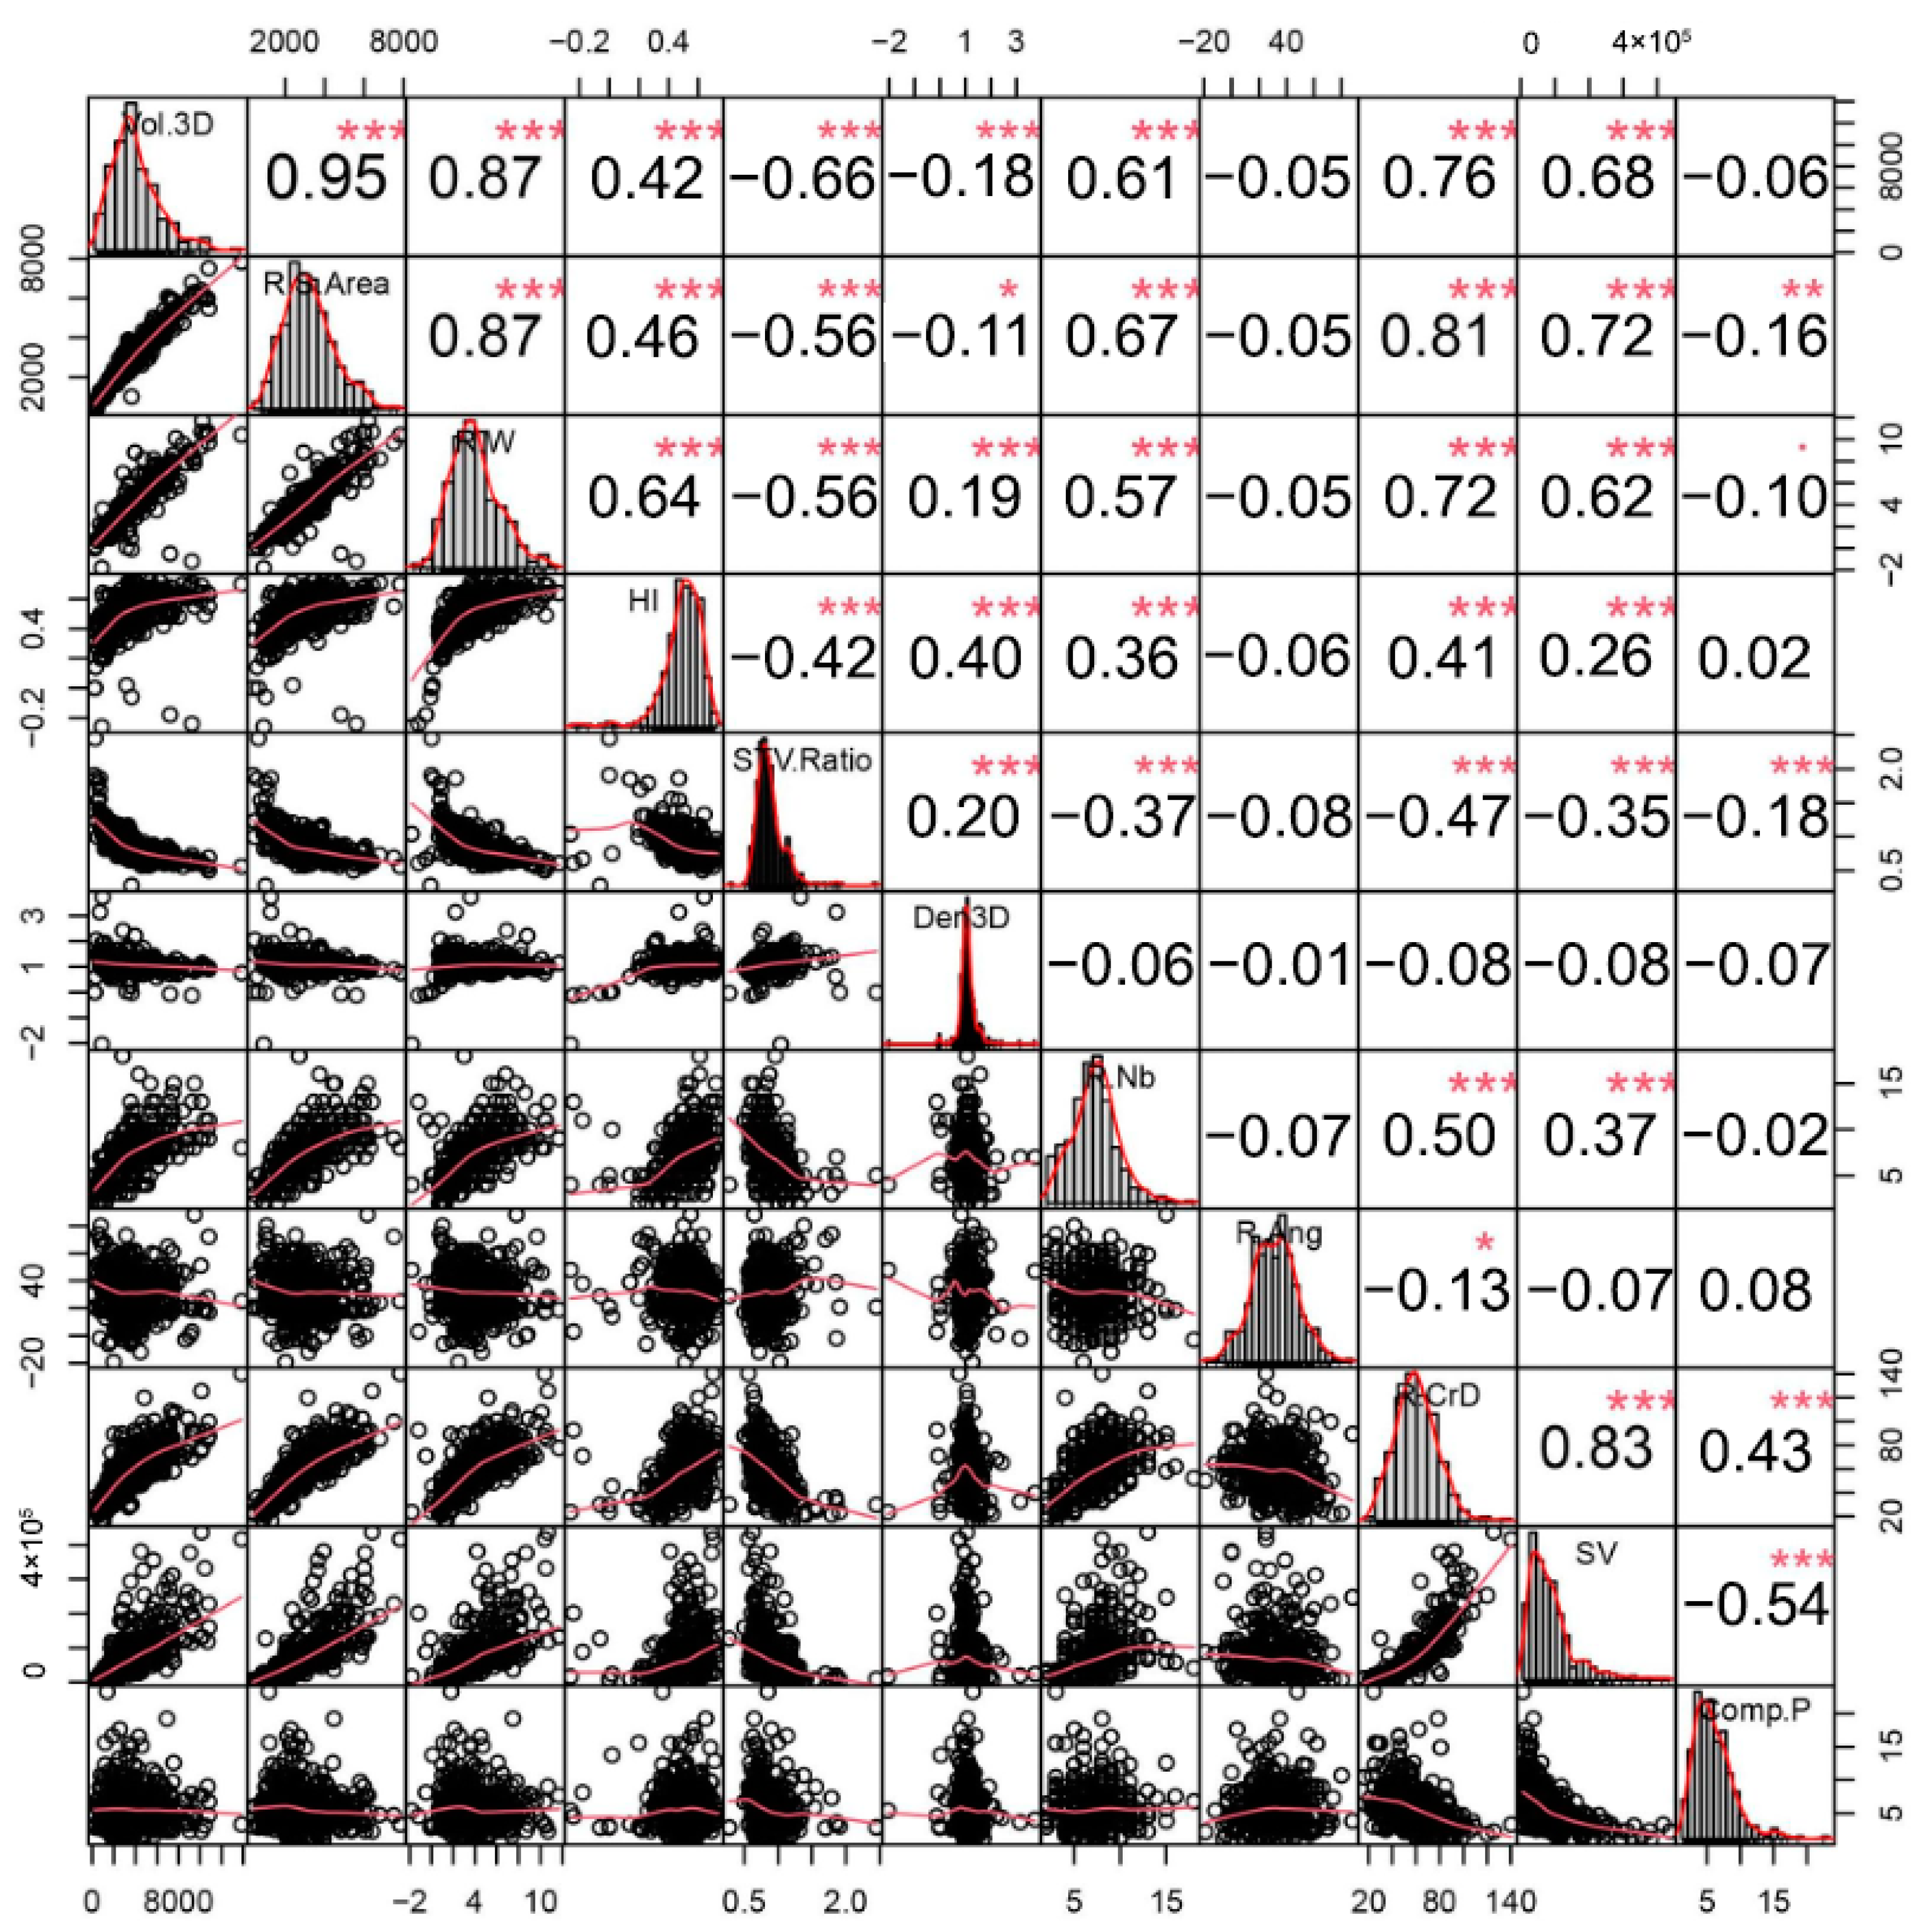
3.2. Correlation Analysis of the 11 Root Traits in Partially Inbred Populations

To explore potential correlations among these 11 traits, we conducted a Pearson’s Correlation analysis (Figure 2). The result revealed robust correlations (r2 ≥ 0.87) between root weight, 3D surface area, and 3D volume further confirming earlier findings [6]. These size-related parameters also showed correlations with HI, root number, 3D crown diameter, and 3D cylinder soil volume. The 3D surface-to-volume ratio, which is an indicator for root shape, displayed negative correlations with parameters relating to root sizes. Within this population, as root sizes increase (weight, 3D surface area, and 3D volume), the roots become thicker and proportionally shorter. Furthermore, root number demonstrated correlations with the 3D crown diameter and 3D soil volume. Notably, no correlation was observed between the root angle and the other parameters. This dataset highlights the phenotypic diversity within the partially inbred population derived from the six parental varieties, providing valuable materials for genetic studies. Moreover, the varied characteristics of cassava storage roots offer an approach to understanding root yield, beyond traditional weight-centric assessments, considering factors such as crown volume, shape, and size.

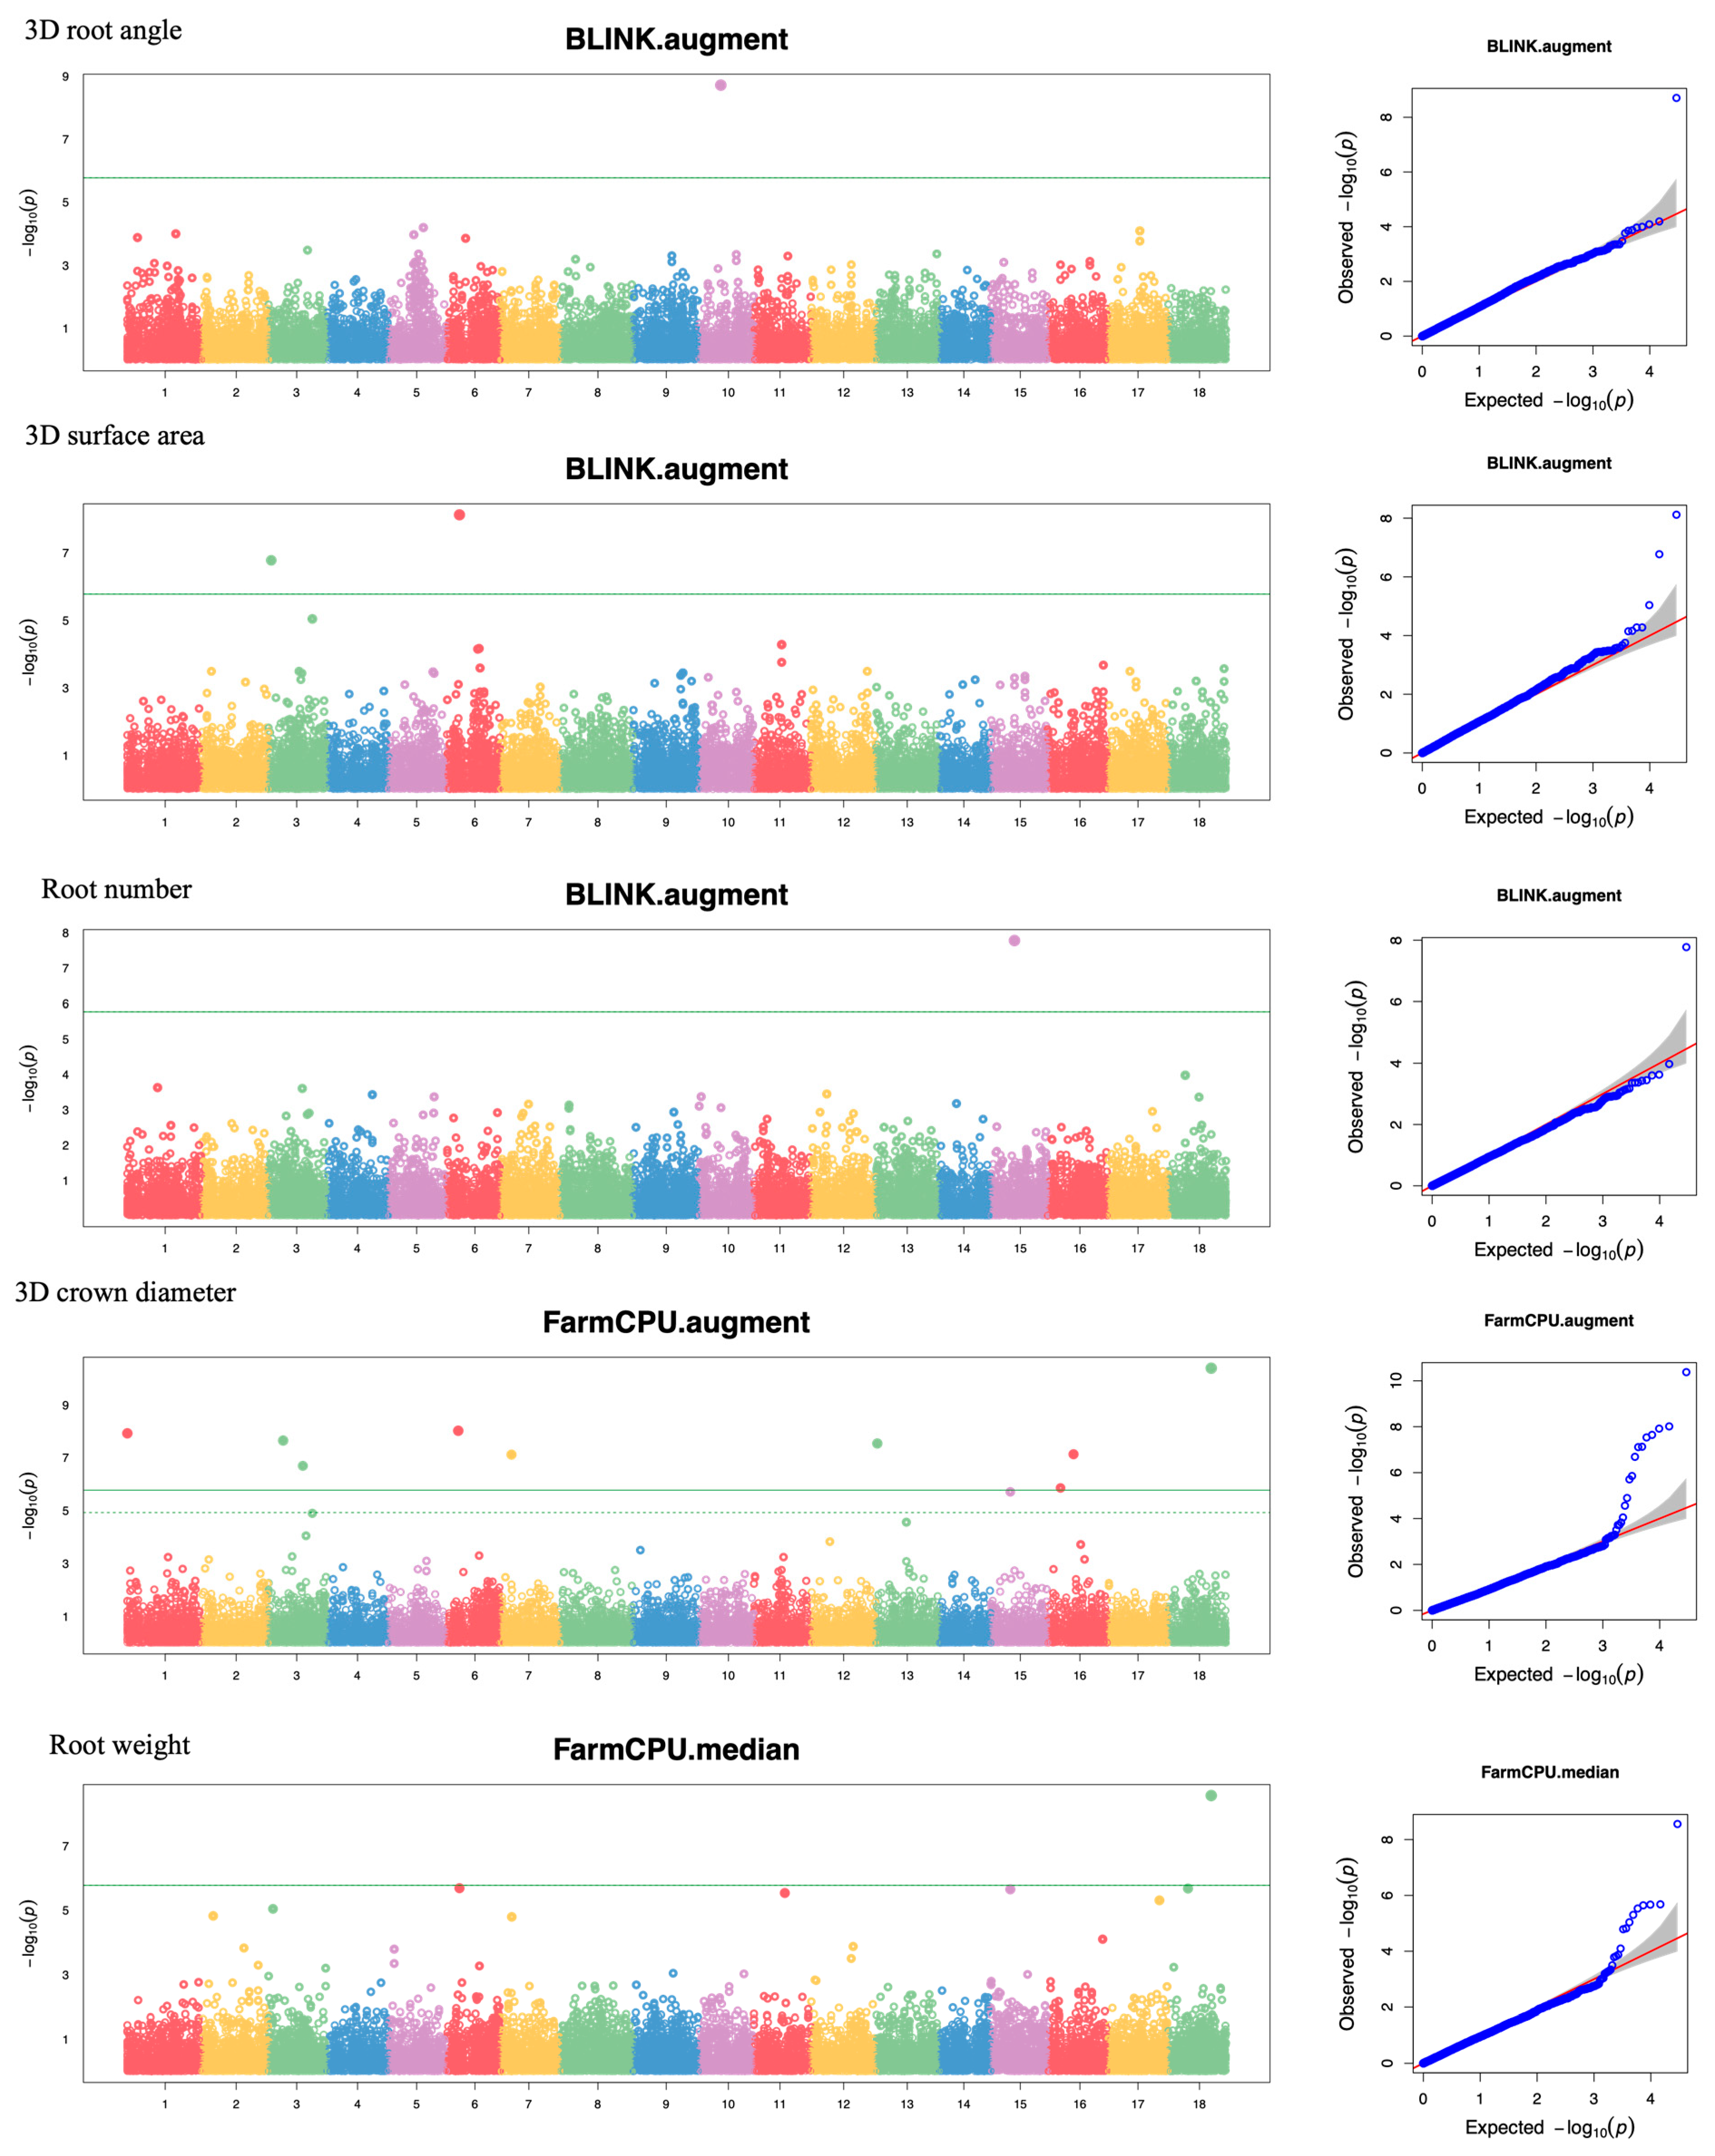
3.3. GWAS of Yield and 3D Root Crown Phenotypes

GWAS analysis relied on genotyping-by-sequencing on our set of 130 partially inbred genotypes and their six parental lines. After filtering, we identified a total of 29,361 SNP markers within the nuclear genome of cassava sequence v8.1. These SNPs were shared across all 136 genotypes with a zero-missing rate. The mean SNP density was 1 SNP per 21.91 kb across the 18 chromosomes (Figure 3). Chromosome 4 displayed the lowest, with 1257 SNPs, while chromosome 8 had the highest, with 2036 SNPs. The mean minor allele frequency was 0.21, ranging from 0 to 0.5. PIC values, indicating SNP diversity, ranged from 0.38 to 0.98, with an average of 0.66, indicating the reliability of our GWAS. Heterozygosity estimates, both observed and expected, span across the genome from 0 to 1 and 0.03 to 0.5, respectively. This is because we found no heterozygous genotypes for 6658 SNPs and only heterozygous genotypes for 2 SNPs. Linkage disequilibrium (LD) for each pair of SNP markers was assessed, and a midpoint r2 value of 0.04, corresponding to approximately 60 kb, was chosen as the linkage decay point. For population structure assessment, principal component analysis (PCA) did not reveal distinct subpopulations. Whereas hierarchical cluster analysis on the identity-by-descent values showed three main subgroups despite the population being generated by inbreeding.
Our GWAS analysis utilized three distinct methods: MLM, FarmCPU, and BLINK across 11 parameters. Three different datasets—mean, median, and augmented—were used for each parameter to reflect data collected based on the augmented RCBD design in the field trial. A total of 33 datasets were employed, resulting in significantly associated SNPs for 10 datasets of 6 parameters. Datasets with the highest number of significant SNPs for each parameter are presented in Figure 4. A detailed summary of SNPs is presented in Table 3. Significant SNPs were identified for 3D root angle (1 SNP), 3D surface area (3 SNPs), root number (2 SNPs), 3D crown diameter (9 SNPs), root weight (5 SNPs), and 3D volume (8 SNPs). For the other parameters, no significant SNPs could be identified, possibly due to the limitation of our sample sizes. These significant SNPs explained phenotypic variances ranging from below 1% to the highest at 38.99%, exhibiting either positive or negative effects on the traits. For root number, two closely linked SNPs (22,998 and 23,002; 18 bp distance) were identified from two datasets (mean and augmented). Notably, we identified two shared significant SNPs between 3D crown diameter and root weight (SNP_28919 on chromosome 18) and root weight and 3D volume (SNP_3559 on chromosome 3), both exhibiting negative effects. Additionally, two closely linked SNPs (3559 and 3560: 11 bp) were identified for 3D volume/root weight and 3D surface area, in agreement with what was observed in the correlation analysis. Other significant SNPs were found distributed across the genome.

3.4. Candidate Gene Identification

We examined the 60 kb upstream and downstream regions of the SNPs identified to explore genes associated with those SNPs. Detailed information on all associated gene loci, along with annotations, is provided in Supplementary File S1. While numerous gene loci were identified, establishing a direct link between these genes and the analyzed traits based on SNP positions posed a challenge. We cross-referenced our gene list with reports on cassava GWAS for yield and related traits but found no matching loci [8,9,10,29,30,31]. Given the traits’ specificity to the storage roots, we used transcriptome data [32] and single-cell transcriptome data [33] for cassava storage roots to refine our gene list, focusing on those functioning during root development. From an initial pool of 93 candidate genes, we identified 29 genes exhibiting a differential expression pattern or expression in the storage root (Table 4). Four genes have already been reported in cassava, though their functions were not directly related to storage root shapes or yield.
Notably, we did not find any candidate gene expressed in the roots for the root angle trait. For root number, we identified the Ras-related protein Rab7 (Manes15G164200), which is expressed in various storage root cells, including those in the meristem, vascular tissues, and cortical tissues. Although its role remains unexplored in cassava, Ras-related protein Rab7 is known to play a pivotal role in cellular processes. This includes endocytic trafficking, vesicle transport, and organelle dynamics, particularly in regulating endosomal maturation and trafficking events in plant roots. For root crown diameter, we found six candidates located on chromosomes 6, 13, and 16. Among these genes, we identified a putative 1-deoxy-D-xylulose-5-phosphate synthase 2, ER membrane protein complex subunit 10, calreticulin-3-like, acyl carrier protein 2, putative Galacturonosyltransferase 10, and an 18.1 kDa class I heat shock protein-like.
For the three traits reflecting fresh root yield, including root weight, 3D area, and 3D volume, we identified five candidate genes shared among these parameters on chromosome 3. Considering the expression data, Manes03G018100, Manes03G018400, Manes03G018600, Manes03G018800, and Manes03G018900 appeared to be expressed in the vascular tissue of cassava storage roots. Other candidate genes for each of these traits were also identified. For root weight, Manes15G139400 was highly expressed in storage roots, meristem, and vascular tissues, while other candidates were less likely involved in root weight, predominantly expressed in leaves and/or fibrous roots and cortical tissues. For 3D volume, Manes03G128000 and Manes10G051600 exhibited high expression in fibrous roots, and Manes03G127800 and Manes03G127100 were specifically expressed in the vascular tissue of storage roots. Although Manes16G075700 has high expression in storage roots, its function related to carotenoid synthesis makes it less likely to be associated with root volume. The SNPs and genes identified in this work hold promise for the development of selective markers and warrant further investigation into their functional roles in storage root development and yield in cassava.

4. Discussion

While studies have extensively explored agronomic traits such as root weight and dry matter content, those specifically focusing on root crown morphology have been limited. In this study, we unraveled the genetic determinants of specific cassava root crown traits, with a particular focus on yield-related attributes and root crown morphology. Using 3D modeling, we quantified parameters related to root crown sizes and soil space. Based on 136 genotypes including S1, S2, and their parental lines, we performed GWAS on 11 yield-related and 3D modeling parameters. This approach, centered around dissecting the composite root crown structure, offers promises for facilitating genetic improvement through more informed breeding selections. Understanding genetic controls for storage root crown traits, including root volume, surface area, crown diameter, root number, root angle, and parameters related to soil area, provides an opportunity to establish key genetic factors contributing to root yield.
Detailed collection of root crown data for cassava, especially within inbreeding populations of elite Thai varieties, has been unexplored. Our phenotypic analysis of 136 cassava genotypes showed a spectrum of root traits within inbreeding populations. Despite the anticipated impacts of inbreeding depression, the pre-selection process likely mitigated its direct influence on yield. The phenotypic data presented variability across different parameters; robust correlations were observed among various traits, including root weight, 3D surface area, 3D volume, harvest index, root number, root crown diameter, and cylinder soil volume. This phenotypic diversity within the partially inbred population provided valuable materials for genetic studies. So far, only a few studies have used this type of population including those focused on GWAS for provitamin A carotenoid content [34] and genomic selection [35].
The narrow-sense heritability of the 11 root traits indicated a significant impact of environmental factors on the observed phenotypic variation. The results also suggested the involvement of non-additive genetic effects in shaping cassava root traits, underscoring the importance of genetic interactions (dominance and epistasis) in governing cassava root yield [4]. Comparing h2 estimates for 3D traits with root weight to other reports showed a consistency which was supported by correlation analysis. The estimates of h2 of the root crown traits showed overall medium narrow-sense heritability, with the exception of HI and 3D density that had low heritabilities. These h2 estimates for 3D traits are in the same ranges as those for root weight. Our h2 estimates for root weight and root number are similar to other reports for broad-sense heritability [8,10,36]. While our 3D surface area had an h2 estimate of 0.438, previously Yonis et al. [10] reported a value of 0.21 for broad-sense heritability of root areas based on 2D measurement. However, our h2 estimate for HI was notably lower than in other reports [9,36].
Zhang et al. [8] performed GWAS for 11 agronomic traits using 158 accessions and 349,827 SNPs which identified 1 SNP for root weight and 3 SNPs for root number. Hu et al. [12] performed GWAS and genomic variation mapping of 388 accessions by genome re-sequencing and identified 52 loci for 23 agronomic traits showing allelic variation in heterozygosity. Among these, 2 SNPs were found for root number and root weight. Rabbi et al. [9] performed GWAS using 5130 clones and 100,000 SNP markers for biotic stress, quality (dry matter content and carotenoid content), plant agronomy (harvest index and plant types) and morphology (leaves, stem, root). This study identified 41 SNPs associated with those traits. Phumichai et al. [36] performed GWAS for yield-related traits including fresh root yield, starch content, harvest index and root number, and starch pasting properties using 276 accessions and 89,934 SNPs; one SNP was associated with root weight, nine SNPs for HI and 1 SNP for root number. Hohenfeld et al. [29] performed GWAS for root rot disease and productive traits using 148 genotypes; three genomic regions were identified for fresh root yield. Our GWAS, based on genotyping-by-sequencing, identified 42,521 SNP markers within the cassava genome, distributed across 18 chromosomes. We employed three distinct GWAS methods (MLM, FarmCPU, and BLINK) across 11 parameters. We identified significant SNPs for 6 out of 11 traits, including 3D root angle, surface area, root number, crown diameter, root weight, and 3D volume. These SNPs explained phenotypic variances with positive or negative effects on the traits. Our work provides a catalog of favorable alleles based on significant associated SNPs for each trait, offering the basis for marker development and candidate genes for functional validation.
To narrow down candidate genes associated with these traits, we examined regions 60 kb upstream and downstream of identified SNPs. Cross-referencing with existing transcriptome [32] and single-cell transcriptome [33] data for cassava storage roots allowed us to identify potential candidate genes. Out of 11 traits, we identified candidate genes for 5 traits, contributing to a total of 29 genes. While most of our identified candidates are associated with root weight and size traits, no matches were found with genes reported in previous GWAS studies on cassava yield [9,10,11,12,37]. Our findings introduce additional association candidate genes for these traits, and we identified five candidate genes that are shared among the major parameters dictating root sizes including root weight, 3D volume, and 3D surface area. The correlation among root weight, 3D root volume, and 3D surface area provides promising targets for further functional analysis of cassava storage root development. Nevertheless, the SNPs and candidate genes identified in this study require validation through additional approaches, such as gene functional analysis and assessment of markers in a larger population.
The integration of 3D modeling and GWAS offers novel insights into the genetic basis of cassava storage roots. The identification of significant SNPs and associated genes will drive the development of markers and candidate gene validation. This multifaceted approach to understanding root yield incorporating factors such as crown volume, shape, and size, offers new avenues for genetic improvement in cassava.

5. Conclusions

We conducted a comprehensive analysis of 11 cassava root yield and 3D root crown traits, utilizing a set of 136 genotypes, including S1 and S2 partial inbred lines, along with their six parental varieties. GWAS analysis identified 23 significantly associated SNPs for six key root traits, including 3D root angle, 3D surface area, root number, 3D crown diameter, root weight, and 3D volume. Based on LD decay, examination of 60 kb upstream and downstream genomic regions around SNPs identified 93 candidate genes. Cross-referencing with transcriptome data allowed the identification of 29 candidate genes with expression patterns related to storage root yield in cassava.

Supplementary Materials

The following supporting information can be downloaded at: https://www.mdpi.com/article/10.3390/agronomy14030591/s1, Figure S1: Distribution patterns of 11 traits in the study population consisting of 136 genotypes. The unit of each parameter is presented in Table 2. File S1: All associated SNPs and candidate genes.

Author Contributions

Conceptualization, S.V., P.W. (Passorn Wonnapinij) and P.K.; methodology, P.S., P.W. (Passorn Wonnapinij), P.C., P.W. (Pitchaporn Wannitikul), S.S., P.P., K.C., A.S., P.K. and S.V.; formal analysis, P.S., S.V., P.C., P.W. (Passorn Wonnapinij), P.W. (Pitchaporn Wannitikul), A.S., H.C. and P.K.; resources, P.K.; Figure preparation, P.S., S.V. and P.W. (Passorn Wonnapinij); writing, P.S., P.W. (Passorn Wonnapinij), H.C., L.D.G., P.K. and S.V. All authors have read and agreed to the published version of the manuscript.

Funding

This work was financially supported by NSTDA (P-18-52179); the Office of the Ministry of Higher Education, Science, Research and Innovation; and the Thailand Science Research and Innovation through the Kasetsart University Reinventing University Program 2021. PS was supported by The Royal Golden Jubilee (RGJ) Ph.D. Programme (Thailand): PHD/0164/2560; the Thailand Research Fund (TRF); and Department of Agriculture, Ministry of Agriculture and Cooperative (Thailand). SV was supported by the National Research Council of Thailand (NRCT): NRCT5-RSA63002-02. PK was supported by NSTDA (P-18-52170). PWo was supported by NRCT-N42A650286.

Data Availability Statement

The data that support the findings of this study are available from the corresponding author upon reasonable request.

Acknowledgments

We would like to express our thanks for support from the Kasetsart University Research and Development Institute (KURDI) and Center for Advanced Studies of Agriculture and Food (CASAF).

Conflicts of Interest

The authors declare no conflicts of interest.

References

  1. Li, S.; Cui, Y.; Zhou, Y.; Luo, Z.; Liu, J.; Zhao, M. The industrial applications of cassava: Current status, opportunities and prospects. J. Sci. Food Agric. 2017, 97, 2282–2290. [Google Scholar] [CrossRef]
  2. Parmar, A.; Sturm, B.; Hensel, O. Crops that feed the world: Production and improvement of cassava for food, feed, and industrial uses. Food Secur. 2017, 9, 907–927. [Google Scholar] [CrossRef]
  3. Malik, A.I.; Kongsil, P.; Nguyễn, V.A.; Ou, W.; Srean, P.; López-Lavalle, L.A.; Utsumi, Y.; Lu, C.; Kittipadakul, P.; Nguyễn, H.H.; et al. Cassava breeding and agronomy in Asia: 50 years of history and future directions. Breed. Sci. 2020, 70, 145–166. [Google Scholar] [CrossRef]
  4. Ceballos, H.; Kawuki, R.S.; Gracen, V.E.; Yencho, G.C.; Hershey, C.H. Conventional breeding, marker-assisted selection, genomic selection and inbreeding in clonally propagated crops: A case study for cassava. Theor. Appl. Genet. 2015, 128, 1647–1667. [Google Scholar] [CrossRef] [PubMed]
  5. Wolfe, M.D.; Kulakow, P.; Rabbi, I.Y.; Jannink, J.-L. Marker-Based Estimates Reveal Significant Nonadditive Effects in Clonally Propagated Cassava (Manihot esculenta): Implications for the Prediction of Total Genetic Value and the Selection of Varieties. G3 Genes Genomes Genet. 2016, 6, 3497–3506. [Google Scholar] [CrossRef] [PubMed]
  6. Sunvittayakul, P.; Kittipadakul, P.; Wonnapinij, P.; Chanchay, P.; Wannitikul, P.; Sathitnaitham, S.; Phanthanong, P.; Changwitchukarn, K.; Suttangkakul, A.; Ceballos, H.; et al. Cassava root crown phenotyping using three-dimension (3D) multi-view stereo reconstruction. Sci. Rep. 2022, 12, 10030. [Google Scholar] [CrossRef] [PubMed]
  7. Alseekh, S.; Kostova, D.; Bulut, M.; Fernie, A.R. Genome-wide association studies: Assessing trait characteristics in model and crop plants. Cell. Mol. Life Sci. 2021, 78, 5743–5754. [Google Scholar] [CrossRef] [PubMed]
  8. Zhang, S.; Chen, X.; Lu, C.; Ye, J.; Zou, M.; Lu, K.; Feng, S.; Pei, J.; Liu, C.; Zhou, X.; et al. Genome-wide association studies of 11 agronomic traits in cassava (Manihot esculenta Crantz). Front. Plant Sci. 2018, 9, 503. [Google Scholar] [CrossRef] [PubMed]
  9. Rabbi, I.Y.; Kayondo, S.I.; Bauchet, G.; Yusuf, M.; Aghogho, C.I.; Ogunpaimo, K.; Uwugiaren, R.; Smith, I.A.; Peteti, P.; Agbona, A.; et al. Genome-wide association analysis reveals new insights into the genetic architecture of defensive, agro-morphological and quality-related traits in cassava. Plant Mol. Biol. 2022, 109, 195–213. [Google Scholar] [CrossRef] [PubMed]
  10. Yonis, B.O.; del Carpio, D.P.; Wolfe, M.; Jannink, J.-L.; Kulakow, P.; Rabbi, I. Improving root characterisation for genomic prediction in cassava. Sci. Rep. 2020, 10, 8003. [Google Scholar] [CrossRef]
  11. dos Santos Silva, P.P.; Sousa, M.B.E.; de Oliveira, E.J.; Morgante, C.V.; de Oliveira, C.R.S.; Vieira, S.L.; Borel, J.C. Genome-wide association study of drought tolerance in cassava. Euphytica 2021, 217, 1–26. [Google Scholar] [CrossRef]
  12. Hu, W.; Ji, C.; Liang, Z.; Ye, J.; Ou, W.; Ding, Z.; Zhou, G.; Tie, W.; Yan, Y.; Yang, J.; et al. Resequencing of 388 cassava accessions identifies valuable loci and selection for variation in heterozygosity. Genome Biol. 2021, 22, 1–23. [Google Scholar] [CrossRef]
  13. Community, B.O. Blender—A 3D Modelling and Rendering Package; Blender Foundation, Stichting Blender Foundation: Amsterdam, The Netherlands, 2018. [Google Scholar]
  14. Li, H.; Handsaker, B.; Wysoker, A.; Fennell, T.; Ruan, J.; Homer, N.; Marth, G.; Abecasis, G.; Durbin, R.; 1000 Genome Project Data Processing Subgroup. The sequence alignment/map format and SAMtools. Bioinformatics 2009, 25, 2078–2079. [Google Scholar] [CrossRef] [PubMed]
  15. Li, H. A statistical framework for SNP calling, mutation discovery, association mapping and population genetical parameter estimation from sequencing data. Bioinformatics 2011, 27, 2987–2993. [Google Scholar] [CrossRef] [PubMed]
  16. Garrison, E.; Marth, G. Haplotype-based variant detection from short-read sequencing. arXiv 2012, arXiv:1207.3907. [Google Scholar]
  17. R Core Team R: A Language and Environment for Statistical Computing. R Foundation for Statistical Computing, Vienna, Austria. 2022. Available online: https://www.R-project.org/ (accessed on 11 August 2023).
  18. Aravind, J.; Mukesh Sankar, S.; Wankhede, D.P.; Kaur, V. augmentedRCBD: Analysis of Augmented Randomized Complete Block Designs. R package version 0.1.7.9000. 2020. Available online: https://aravind-j.github.io/augmentedRCBD/ (accessed on 11 August 2023).
  19. Peterson, B.G.; Carl, P.; Boudt, K.; Bennett, R.; Ulrich, J.; Zivot, E.; Cornilly, D.; Hung, E.; Lestel, M.; Balkissoon, K.; et al. Package ‘Performanceanalytics’. 2018. pp. 13–14. Available online: https://github.com/braverock/PerformanceAnalytics (accessed on 11 August 2023).
  20. Gilmour, A.R.; Thompson, R.; Cullis, B.R. Average Information REML: An Efficient Algorithm for Variance Parameter Estimation in Linear Mixed Models. Biometrics 1995, 51, 1440. [Google Scholar] [CrossRef]
  21. Kruijer, W.; Boer, M.P.; Malosetti, M.; Flood, P.J.; Engel, B.; Kooke, R.; Keurentjes, J.J.B.; van Eeuwijk, F.A. Marker-Based Estimation of Heritability in Immortal Populations. Genetics 2015, 199, 379–398. [Google Scholar] [CrossRef] [PubMed]
  22. Speed, D.; Hemani, G.; Johnson, M.R.; Balding, D.J. Improved Heritability Estimation from Genome-wide SNPs. Am. J. Hum. Genet. 2012, 91, 1011–1021. [Google Scholar] [CrossRef] [PubMed]
  23. Tang, Y.; Horikoshi, M.; Li, W. ggfortify: Unified Interface to Visualize Statistical Results of Popular R Packages. R J. 2016, 8, 474–485. [Google Scholar] [CrossRef]
  24. Wickham, H. ggplot2: Elegant Graphics for Data Analysis; Springer: New York, NY, USA, 2016; ISBN 978-3-319-24277-4. Available online: https://ggplot2.tidyverse.org (accessed on 11 August 2023).
  25. Endelman, J.B. Ridge Regression and Other Kernels for Genomic Selection with R Package rrBLUP. Plant Genome 2011, 4, 255–258. [Google Scholar] [CrossRef]
  26. Wang, J.; Zhang, Z. GAPIT Version 3: Boosting Power and Accuracy for Genomic Association and Prediction. Genom. Proteom. Bioinform. 2021, 19, 629–640. [Google Scholar] [CrossRef] [PubMed]
  27. Zhang, C.; Dong, S.-S.; Xu, J.-Y.; He, W.-M.; Yang, T.-L. PopLDdecay: A fast and effective tool for linkage disequilibrium decay analysis based on variant call format files. Bioinformatics 2019, 35, 1786–1788. [Google Scholar] [CrossRef] [PubMed]
  28. Fonseca, P.A.; Suarez-Vega, A.; Marras, G.; Cánovas, Á. GALLO: An R package for genomic annotation and integration of multiple data sources in livestock for positional candidate loci. GigaScience 2020, 9, giaa149. [Google Scholar] [CrossRef] [PubMed]
  29. Hohenfeld, C.S.; Passos, A.R.; de Carvalho, H.W.L.; de Oliveira, S.A.S.; de Oliveira, E.J. Genome-wide association study and selection for field resistance to cassava root rot disease and productive traits. PLoS ONE 2022, 17, e0270020. [Google Scholar] [CrossRef]
  30. Okeke, U.G.; Akdemir, D.; Rabbi, I.; Kulakow, P.; Jannink, J. Regional Heritability Mapping Provides Insights into Dry Matter Content in African White and Yellow Cassava Populations. Plant Genome 2018, 11, 170050. [Google Scholar] [CrossRef] [PubMed]
  31. Rabbi, I.Y.; Udoh, L.I.; Wolfe, M.; Parkes, E.Y.; Gedil, M.A.; Dixon, A.; Ramu, P.; Jannink, J.L.; Kulakow, P. Genome-wide association mapping of correlated traits in cassava: Dry matter and total carotenoid content. Plant Genome 2017, 10, 1–14. [Google Scholar] [CrossRef]
  32. Wilson, M.C.; Mutka, A.M.; Hummel, A.W.; Berry, J.; Chauhan, R.D.; Vijayaraghavan, A.; Taylor, N.J.; Voytas, D.F.; Chitwood, D.H.; Bart, R.S. Gene expression atlas for the food security crop cassava. New Phytol. 2017, 213, 1632–1641. [Google Scholar] [CrossRef]
  33. Zang, Y.; Pei, Y.; Cong, X.; Ran, F.; Liu, L.; Wang, C.; Wang, D.; Min, Y. Single-cell RNA-sequencing profiles reveal the developmental landscape of the Manihot esculenta Crantz leaves. Plant Physiol. 2024, 194, 456–474. [Google Scholar] [CrossRef]
  34. Esuma, W.; Herselman, L.; Labuschagne, M.T.; Ramu, P.; Lu, F.; Baguma, Y.; Buckler, E.S.; Kawuki, R.S. Genome-wide association mapping of provitamin A carotenoid content in cassava. Euphytica 2016, 212, 97–110. [Google Scholar] [CrossRef]
  35. Ozimati, A.; Kawuki, R.; Esuma, W.; Kayondo, S.I.; Pariyo, A.; Wolfe, M.; Jannink, J.-L. Genetic Variation and Trait Correlations in an East African Cassava Breeding Population for Genomic Selection. Crop Sci. 2019, 59, 460–473. [Google Scholar] [CrossRef]
  36. Phumichai, C.; Aiemnaka, P.; Nathaisong, P.; Hunsawattanakul, S.; Fungfoo, P.; Rojanaridpiched, C.; Vichukit, V.; Kongsil, P.; Kittipadakul, P.; Wannarat, W.; et al. Genome-wide association mapping and genomic prediction of yield-related traits and starch pasting properties in cassava. Theor. Appl. Genet. 2022, 135, 145–171. [Google Scholar] [CrossRef] [PubMed]
  37. Brito, A.C.; Oliveira, S.A.S.; Oliveira, E.J. Genome-wide association study for resistance to cassava root rot. J. Agric. Sci. 2017, 155, 1424–1441. [Google Scholar] [CrossRef]
Figure 1. Three-dimensional CRC modeling for root crown measurement. (a) 3D root crown model in Blender, illustrating measurement parameters associated with root crown sizes and angles. (b) Top-down perspective of the root crown, indicating the circled area designated for measuring root crown diameter. (c) Quantification of 3D cylinder soil volume achieved by establishing a cylindrical space extending from the top to the bottom of the root crown. Three-dimensional CRC compactness (CompP) was calculated as a percentage of a 3D volume in a 3D cylinder soil volume.
Agronomy 14 00591 g001
Figure 2. Pearson correlation analysis of 11 traits. Significant correlation levels are denoted by asterisks (*, **, *** for p < 0.05, p < 0.01, p < 0.001, respectively). The trait abbreviations are described in Table 2.
Agronomy 14 00591 g002
Figure 3. Genome-wide SNP analysis of 136 cassava genotypes. (a) Overview of SNP density across 18 chromosomes of the cassava association mapping panel. (b) The blue line shows a decay pattern of linkage disequilibrium between pairs of SNPs of all chromosomes. (c) Population structure of 136 genotypes including S0, S1, and S2 generations based on PCA. Color codes were assigned based on S0 parental lines. (d) Hierarchical cluster analysis on the identity-by-descent values of 136 genotypes.
Agronomy 14 00591 g003
Figure 4. Manhattan plots and QQplots of root traits. The threshold line (solid line) indicates the cutoff based on the Bonferroni correction at p < 0.05. The dashed lines represented the locus-specific threshold calculated for each chromosome. These lines are overlapped in most cases above, except for the 3D crown diameter.
Agronomy 14 00591 g004
Table 1. Parental varieties and sizes of the S1 and S2 families obtained from them.
ProgenitorRemarksS1 FamilyS2 Family
R1Landrace241
R5Released by RFCRC 13416
R90Released by RFCRC117
KU50Released by KU 2, DOA 3, and CIAT 4187
HB80Released by TTDI 5 and KU10-
HNTLandrace2-
Total 9931
1 RFCRC; Rayong Field Crops Research Center, Department of Agriculture, Ministry of Agriculture and Cooperatives, Thailand. 2 KU; Kasetsart University, Thailand. 3 DOA; Department of Agriculture, Ministry of Agriculture and Cooperatives, Thailand. 4 CIAT; Centro International de Agricultura Tropical, Colombia. 5 TTDI; Thai Tapioca Development Institute.
Table 2. Overview of 11 phenotypic traits with abbreviations, detailed trait descriptions, measurement units, data ranges, and narrow-sense heritability are presented.
TraitUnitS0 Data RangeS1 Data RangeS2 Data Rangeh2
1Root weight (RW)Kg0.87–12.100.067–12.450.10–7.500.325
23D volume (Vol3D)cm3779–12,573268–9678340–80500.434
33D density (Den3D)kg/L0.57–1.660.049–1.940.22–1.420.046
43D surface area (RS Area)cm2983–7333556–7122451–58880.438
53D surface-to-volume ratio (SV Ratio)non-unit index0.53–1.620.07–2.070.69–1.500.334
63D crown diameter (RCrD)cm27.79–105.1123.61–113.8919.30–88.740.303
7Root number (Nb)Root4.60–12.202.00–13.403–13.400.320
83D root angle (RAng)Degree0–49.000.20–45.801.6–480.307
9Harvest index (HI)non-unit index0.4–0.720.03–0.700.02–0.750.149
103D cylinder soil volume (SV)cm342,125–277,04312,796–288,61834,133–94,0250.392
113D CRC compactness (CompP)%2.33–12.351.69–13.244.45–7.010.455
Table 3. Summary of SNPs significantly associated with agronomic and root crown traits.
TraitSNP IDChrPositionMajor/MinorMAFMethodp ValuePhenotype Variance Explained
Root angle_aug155311013,042,872A/T0.177BLINK1.96 × 10−938.99
RS Area_aug356031,556,906A/G0.288BLINK1.70 × 10−711.05
RS Area_aug840167,187,383A/C0.333BLINK7.66 × 10−924.77
RS Area_mean411112,282,357G/A0.153BLINK2.18 × 10−737.91
Nb_aug230021513,707,725G/A0.304BLINK1.68 × 10−830.32
Nb_mean229981513,707,707A/G0.383BLINK4.47 × 10−836.48
RCrD_aug22178,953C/T0.038FarmCPU1.21 × 10−810.20
RCrD_aug4647319,714,017G/A0.441FarmCPU2.05 × 10−70.90
RCrD_aug386338,392,427G/A0.064FarmCPU2.27 × 10−89.98
RCrD_aug834366,490,768T/G0.076FarmCPU9.67 × 10−910.74
RCrD_aug975176,638,776C/T0.025FarmCPU7.73 × 10−87.07
RCrD_aug1933413918,716A/T0.462FarmCPU2.93 × 10−81.99
RCrD_aug244881614,895,032G/A0.267BLINK1.47 × 10−610.37
RCrD_aug244881614,895,032G/A0.267FarmCPU7.46 × 10−82.63
RCrD_aug24235167,411,599G/A0.220FarmCPU1.40 × 10−60.99
RCrD_aug289191824,956,060A/G0.208FarmCPU4.20 × 10−117.42
RCrD_aug289191824,956,060A/G0.208BLINK9.47 × 10−916.37
RW_mean355931,556,895C/T0.286BLINK1.59 × 10−69.93
RW_mean228401511,311,049G/A0.339BLINK1.63 × 10−1118.46
RW_median1674138,467,214T/A0.395BLINK1.06 × 10−69.87
RW_median228401511,311,049G/A0.339BLINK1.34 × 10−1118.46
RW_median289191824,956,060A/G0.198FarmCPU2.76 × 10−97.42
Vol3D_aug3425238,192,800G/C0.233BLINK1.38 × 10−118.98
Vol3D_aug355931,556,895C/T0.275BLINK1.31 × 10−79.93
Vol3D_aug15263105,847,582G/T0.237BLINK1.68 × 10−96.91
Vol3D_aug253011627,856,247C/T0.064BLINK4.71 × 10−815.24
Vol3D_mean4986325,180,853T/C0.314BLINK8.85 × 10−713.09
Vol3D_mean411112,282,357G/A0.153BLINK7.60 × 10−918.51
Vol3D_median411112,282,357G/A0.153BLINK8.94 × 10−88.61
Vol3D_median253011627,856,247C/T0.064BLINK4.86 × 10−924.55
Vol3D_median265101716,630,621G/A0.051BLINK8.48 × 10−716.78
Table 4. Cross-reference of GWAS candidate genes and transcriptome data of cassava storage root. Genes co-identified in different traits are in bold. Gene expression of candidate genes was identified based on two reports in specific organs including leaf (L), fibrous root (F), and storage root (S) and specific tissues in storage roots including vascular tissue (V), cortical tissue (C), and meristematic tissue (M).
TraitsLociDescriptionWilson et al. [32]Zang et al. [33]
Root numberManes_15G164200ras-related protein Rab7 V, C, M
3D crown diameterManes_06G028100probable 1-deoxy-D-xylulose-5-phosphate synthase 2, chloroplasticFV
Manes_13G003500ER membrane protein complex subunit 10 M
Manes_13G003400calreticulin-3-like V
Manes_13G003300acyl carrier protein 2, mitochondrial V, C, M
Manes_16G044600probable Galacturonosyltransferase 10 isoform X1 V
Manes_16G04870018.1 kDa class I heat shock protein-likeSV
3D areaManes_03G018100probable histone H2A variant 3 V
Manes_03G018400V-type proton ATPase subunit c″1 V, C, M
Manes_03G018600pleiotropic drug resistance 12F-
Manes_03G018800probable protein phosphatase 2C 22 V
Manes_03G018900Acetylesterase V, C
Root weightManes_01G214700monothiol glutaredoxin-S9-likeFC
Manes_01G215300Phototropic-responsive NPH3 family proteinF, L-
Manes_01G215100monothiol glutaredoxin-S1F-
Manes_01G215500peptide chain release factor APG3, chloroplasticF-
Manes_01G215600PREDICTED: CW-type C
Manes_01G214800Thioredoxin superfamily proteinL-
Manes_01G215800potassium transporter 5-like V
Manes_01G214400zinc finger protein CONSTANS-LIKE 13F-
Manes_01G215700nuclear factor Y, subunit B5L-
Manes_03G018100probable histone H2A variant 3 V
Manes_03G018400V-type proton ATPase subunit c″1 V, C, M
Manes_03G018600pleiotropic drug resistance 12F-
Manes_03G018800probable protein phosphatase 2C 22 V
Manes_03G018900Acetylesterase V, C
Manes_15G139400non-functional NADPH-dependent codeinone reductase 2-likeSV, M
Manes_15G139600transmembrane 9 superfamily member 2L-
3D volumeManes_03G018100probable histone H2A variant 3 V
Manes_03G018400V-type proton ATPase subunit c″1 V, C, M
Manes_03G018600pleiotropic drug resistance 12F-
Manes_03G018800probable protein phosphatase 2C 22 V
Manes_03G018900Acetylesterase V, C
Manes_03G128000early nodulin-like protein 9F-
Manes_03G127800glucose-6-phosphate/phosphate translocator 1, chloroplastic-likeLV
Manes_03G127100protein MOS2-like V
Manes_10G051600Protein of unknown function (DUF1635)F-
Manes_16G075000peptidyl-tRNA hydrolase 2, mitochondrial V
Manes_16G075700carotenoid cleavage dioxygenase 8S-
Disclaimer/Publisher’s Note: The statements, opinions and data contained in all publications are solely those of the individual author(s) and contributor(s) and not of MDPI and/or the editor(s). MDPI and/or the editor(s) disclaim responsibility for any injury to people or property resulting from any ideas, methods, instructions or products referred to in the content.

