Article

The Difference in Shoot Metabolite Profiles of a Wild and a Cultivated Barley Genotype in Response to Four Nitrogen Forms

1
Key Laboratory of Crop Germplasm Resource of Zhejiang Province, Department of Agronomy, Zhejiang University, Hangzhou 310058, China
2
Biotechnology Research Institute, Chinese Academy of Agricultural Sciences (CAAS), Beijing 100081, China
3
Shandong (Linyi) Institute of Modern Agriculture, Zhejiang University, Linyi 276000, China
*
Author to whom correspondence should be addressed.
Agronomy 2024, 14(3), 621; https://doi.org/10.3390/agronomy14030621
Submission received: 15 February 2024 / Revised: 9 March 2024 / Accepted: 12 March 2024 / Published: 19 March 2024

Abstract

:
Plants can utilize different N forms, including organic and inorganic N resources, and show great differences in the utilization efficiency of each N form among species and genotypes within a species. Previously, we found that the Tibetan wild barley genotype (XZ16) was better in the utilization of organic nitrogen in comparison with the cultivated barley genotype (Hua30). In this study, the metabolite profiles of the two barley genotypes were comprehensively compared in their response to four N forms, including nitrate (NO3), ammonium (NH4+), urea, and glycine. The macro and micro nutrient concentrations in shoots were mostly found to be higher in the nitrate and urea treatments than in ammonium and glycine in both the genotypes. XZ16 had higher concentrations of nutrient ions in the glycine treatment, but Hua30 accumulated more nutrients in the ammonium treatment. Among a total of 163 differentially regulated metabolites, the highest up-regulation and highest down-regulation values were found in XZ16 in the glycine and urea treatments, respectively. Some important metabolites, such as proline, glutamine, serine, asparagine, L-homoserine, aspartic acid, putrescine, ornithine, and 4-aminobutyrate, were up-regulated in the glycine treatment in both the genotypes with a higher fold change in XZ16 than that in Hua30. Similarly, fructose-6-PO4, aconitic acid, and isocitrate were only up-regulated in XZ16 in the glycine treatment. Here, we concluded that the genotype XZ16 exhibited a better response to the glycine treatment, while Hua30 showed a better response to the NH4+ treatment, which is attributed to the better utilization of glycine-N and NH4+-N, respectively.

1. Introduction

Nitrogen (N) is a constituent of amino acids, playing a crucial role in plant growth, organic matter accumulation and harvest outcome [1]. However, nitrogen fertilizer application increases crop yield, often at rates far greater than the rates at which crops can consume nitrogen, resulting in leftover N in soils [2]. The mis-management of N fertilizers not only compromises plants’ N use efficacy, but also exerts serious detrimental impacts on the ecosystem [3]. Therefore, to minimize the environmental impacts and to enhance plant yield, proper crop nitrogen status management is a pre-requisite [4].
Nitrogen is mainly available to plants in inorganic forms like nitrate (NO3) and ammonium (NH4+), but organic sources, such urea, free amino acids, and short peptides, are also acquired by plants. The acquisition of these nitrogen sources by plants depends mainly on plant habitat and time, soil heterogeneity, microbial community, and agronomic practices, as well as other environmental conditions [5]. NO3 is the dominant nitrogen source found mostly in aerated soils ranging from 1 to 5 mM in concentration, while NH4+ is found at relatively low concentrations, commonly ranging from 20 to 200 μM [6]. Free amino acids and urea are found at very low concentrations between 1 and 150 µM and <70 µM, respectively [6,7,8]. In agriculture, urea is the major N fertilizer applied to plants, and it is also an important N metabolite in plant metabolism [9]. The low manufacturing cost plus the high nitrogen content make this organic compound a common N fertilizer that is mostly used in arable soils [10]. Currently, in the terrestrial N cycle, plants’ organic N uptake is a critical element [11]. Previously, organic N was considered as the second option in the absence of more inorganic N, like under arctic or boreal ecological conditions [12,13,14]. Conversely, recent studies on agricultural [15,16] and sub-tropical plants [17] confirmed that organic nitrogen makes up a significant portion of the N budget of plants.
In plants, several physiological and metabolic processes, such as nutrient uptake, photosynthesis, enzyme activity, respiration rate, hydration equilibrium, and signaling pathways, can be seriously impacted by different N form uptake, consequently leading to an influence on plant growth and the yield of crops [18,19]. For ammonium-sensitive plants, ammonium as a sole N source exerts deleterious effects on plant growth. The impacts of NH4+ and NO3 on plants have been widely investigated, but the results are always inconsistent and species-dependent. Wheat, maize [20], sugar beet [21], beans [22], tobacco [23], and canola [24] prefer NO3, while rice [25], pine, and larch [26], grow better with NH4+ supplementation. A urea fertilizer containing 46% N increased nitrogen utilization as compared to the other fertilizer sources, and appeared to be the better source, yielding the highest dry matter compared to the other sources of nitrogen [27,28]. Other studies on Arabidopsis and pakchoi showed that glycine application could enhance biomass accumulation compared to that of the plants grown under nitrogen deficient conditions [29,30]. Wang et al. [31] also found that glycine as a nitrogen source impacts physiological and biochemical processes within plants, including a number of defense systems, redox homeostasis, amino acids metabolism, and protein synthesis.
Omics approaches have provided great help in understanding the adaptive mechanism of plants grown under nutrient-deficient conditions. Several nutrient-responsive genes and proteins have been characterized using genomic, transcriptomic, and proteomic techniques [32,33], but the wide variation in transcripts and protein levels divert researchers’ focus to metabolites, as these biomolecules are the direct indicators of plant growth and developmental status [34]. In several plant species, including maize, rice, wheat, barley, rapeseed, and tomato [35,36,37,38,39,40], metabolomics analysis has been performed to classify nitrogen-deficiency-responsive metabolites and their respective pathways. Previously, a metabolomics study performed with Arabidopsis leaf tissues found variations in plant phenotype and biomass, along with the regulation of enzymes and major metabolites under moderate N starvation [41]. Wang et al. [31] found a differential response in two cultivars regarding the up- and down-regulation of glycine specific responsive proteins under a glycine treatment as compared to that of the control.
The wild form of barley (Hordeum spontaneum) is considered as the ancestor of cultivated barley (Hordeum vulgare) and offers a great reservoir of genetic variations for barley enhancement [42]. Furthermore, the extensive genetic diversity and high-level resilience of wild barley to harsh environments, coupled with its wide range of adaptations, indicate its better utilization of various nitrogen sources in soil [38,43]. Organic N offers the advantage of providing less N coupled with a carbon source, which could potentially enhance the carbon budget and NUE within plants, thereby reducing the energy required for N reduction and assimilation processes [44,45]. In our previous findings, the wild genotype XZ16 showed comparatively better growth in a glycine treatment as compared to Hua30. We suggest that the wild genotype can absorb and utilize organic nitrogen (glycine) more efficiently as compared to the cultivated genotypes. Accordingly, this study was conducted to identify the specific metabolites responding to various N forms in the two barley genotypes.

2. Materials and Methods

2.1. Germination and Growth Conditions

Seeds of wild barley genotype XZ16 (low nitrogen tolerant) and cultivated barley genotype Hua30 (low nitrogen sensitive) were surface sterilized with 2% hydrogen per oxide for 20 min, and then thoroughly washed five times with distilled water. After sterilization, the seeds were soaked for five hours, and then put in sterilized sand for germination. At the two-leaf stage, uniform seedlings were transferred to 1 L pots with modified Hoagland solutions with KNO3 as a sole nitrogen source and were aerated with air pumps. The pH of solution was adjusted to 5.8 ± 1 on a daily basis after renewing it with fresh solution. The experiment was carried out in controlled growth conditions at a temperature of 22 °C for 14 h day/18 °C and for 10 h at night. At the three-leaf stage, four N treatments with the same concentration were started.

2.2. Treatment and Sampling

Barley seedlings were treated with four nitrogen forms (NO3, NH4+, urea, and glycine) at an N level of 2 mM based on Hoagland solution. NO3 and NH4+ forms of N were supplied as KNO3 and (NH4)2SO4, respectively, and K concentration in the other three N treatments without the addition of KNO3 was adjusted with KCl. The basic nutrient solution for barley was modified to make the nitrogen level same for all the treatments [46]. Shoot tissues were sampled in five replicates after 7 days of treatment. Liquid N was used for sample storage just after harvesting and kept at −80 °C until metabolite extraction.

2.3. Elemental Analysis

For element analysis, the shoots were collected after 7 days of treatment. The samples were washed with dH2O and blotted on filter paper. To attain a constant weight, the samples were kept for 72 h in an oven at 80 °C. Around 0.1 g dry samples was used for element analysis. Tissue digestion was carried out in 5 mL HNO3 at 120 °C using a microwave digester (MCA 3000, Anton Paar, Beijing, China), and the final volume was adjusted to 15 mL by adding dH2O to the tube. Finally, an Inductively Coupled Plasma Optical Emission Spectrometer (ICP-OES, Optima 8000DV, Perkin Elmer, Waltham, MA, USA) was used for the determination of mineral concentration.

2.4. Metabolites Extraction

Frozen shoot tissues weighing 10 ± 1 mg were placed in a 2 mL test tube. Pre-cooled extraction buffer containing a mixture of 500 μL buffer with methanol/dH2O (3:1 v/v) was used. Adonitol (0.5 mg/mL) stock was used as the internal control and 10 μL was added to the above solution. The samples were vortexed for 30 s. A ball mill was used for homogenization for 4 min at 45 Hz. The ultra-sonication of samples was performed in ice water for 5 min, followed by centrifugation at 12,000 rpm and at 4 °C for 15 min. A total of 200 μL supernatant was collected in fresh tubes. A total of 60 μL of each sample was taken out and combined together to prepare the QC (quality control) samples. The samples were evaporated in a vacuum concentrator. After vaporization, 80 μL of methoxyamine hydrochloride solution was added to 20 mg/mL of pyridine, and then incubated at 80 °C for 30 min. After incubation, it was again derivatized using 100 μL of BSTFA regent (1% TMCS, v/v) at 70 °C for one and half hours. The samples were cooled slowly to room temperature. Finally, 5 μL of FAMEs (in chloroform) was added to the cooled samples. A gas chromatograph system (Agilent, Santa Clara, CA, USA) coupled with a time-of-flight mass spectrometer (GC-TOF-MS) (Leco, St. Joseph, MI, USA) was used for analysis following metabolite extraction.

2.5. GC-TOF-MS Analysis

An Agilent 7890 gas chromatograph together with a time-of-flight mass spectrometer was used for GC-TOF-MS analysis. A DB-5MS capillary column was used. A total of 1 μL aliquot was injected in the capillary column in a splitless mode. Helium gas was used as the carrier. The gas flow rate and front inlet purge flow rate were kept at 1 mL min−1 and 3 mL min−1, respectively. The initial temperature was retained at 50 °C for 1 min, and then raised up to 310 °C gradually at a rate of 10 °C min−1. The temperature was kept at 310 °C for about 8 min. The temperatures for injection, transfer line, and the ion source were kept at 280 °C, 280 °C, and 250 °C, respectively, and 70 eV energy in electron impact mode was supplied. Finally, mass spectrometry information was attained using the full-scan method with a charge-to-mass ratio (m/z) range of 50–500 at a rate of 12.5 spectra per second after a solvent delay of 6.30 min.

2.6. Data Preprocessing and Annotation

The raw data were processed by using chrome TOF (V 4.3x, LECO) software. The processing of the data included peak extraction, the adjustment of the baseline, deconvolution, alignment, and integration analysis. Metabolite identification was performed by using LECO-Fiehn Rtx5 online database, where metabolite matching was carried out on the basis of the mass spectrum and time retention index. The samples with less than 50% QC samples or less than 30% RCD values were removed [47].

2.7. Data Analysis

The data were normalized using software, Simca-P (V14.1, Umetrics, Umeå, Sweden, http://www.umetrics.com/simca (accessed on 10 January 2024)). After normalization, a PLS-DA model was employed; metabolites with a p-value of less than 0.05 (t-test) and VIP (variable importance in the projection) values greater than 1 were considered as differentially changed, and metabolites were searched from commercial databases, such as NIST (http://www.nist.gov/index.html (accessed on 16 January 2024)) and KEGG (http://www.genome.jp/kegg/ (accessed on 16 January 2024)). A Venn diagram of differentially regulated metabolites was drawn using jvenn 1.7v (http://genoweb.toulouse.inra.fr:8091/app/index.html (accessed on 17 January 2024)). Principal component analysis (PCA), partial least square discriminate analysis (PLSDA), and heatmap analysis were conducted using metaboanalyst 6.0 (https://www.metaboanalyst.ca (accessed on 19 January 2024)). For element analysis, two-way analysis of variance was performed with a statistical software package (Statistix 8.1v). The significant difference between the treatments and genotypes was observed using Fisher’s least significant difference (LSD) test at 95% probability level.

3. Results

3.1. Elemental Concentrations

The effect of nitrogen forms is obvious on the element concentrations in the shoots of two genotypes (Table 1). The glycine and ammonium treatments caused significantly lower concentrations of macro and micro elements in the shoots, relative to the two other N treatments, but the two genotypes showed different responses to the N form treatments, with a lower K concentration for XZ16 in the ammonium treatment and for Hua30 in the glycine treatment. Similarly, the Mg concentration was much lower in the glycine treatment for Hua30, while XZ16 showed a smaller concentration of Mg under the ammonium treatment. For Ca, S, and P, XZ16 showed a non-significant difference between the ammonium and glycine treatments. For the micro elements, the same trend was found between the two genotypes. The urea treatment showed a non-significant difference with the NO3 treatment for most of the elements in both the genotypes, while XZ16 showed much higher concentrations than Hua30.

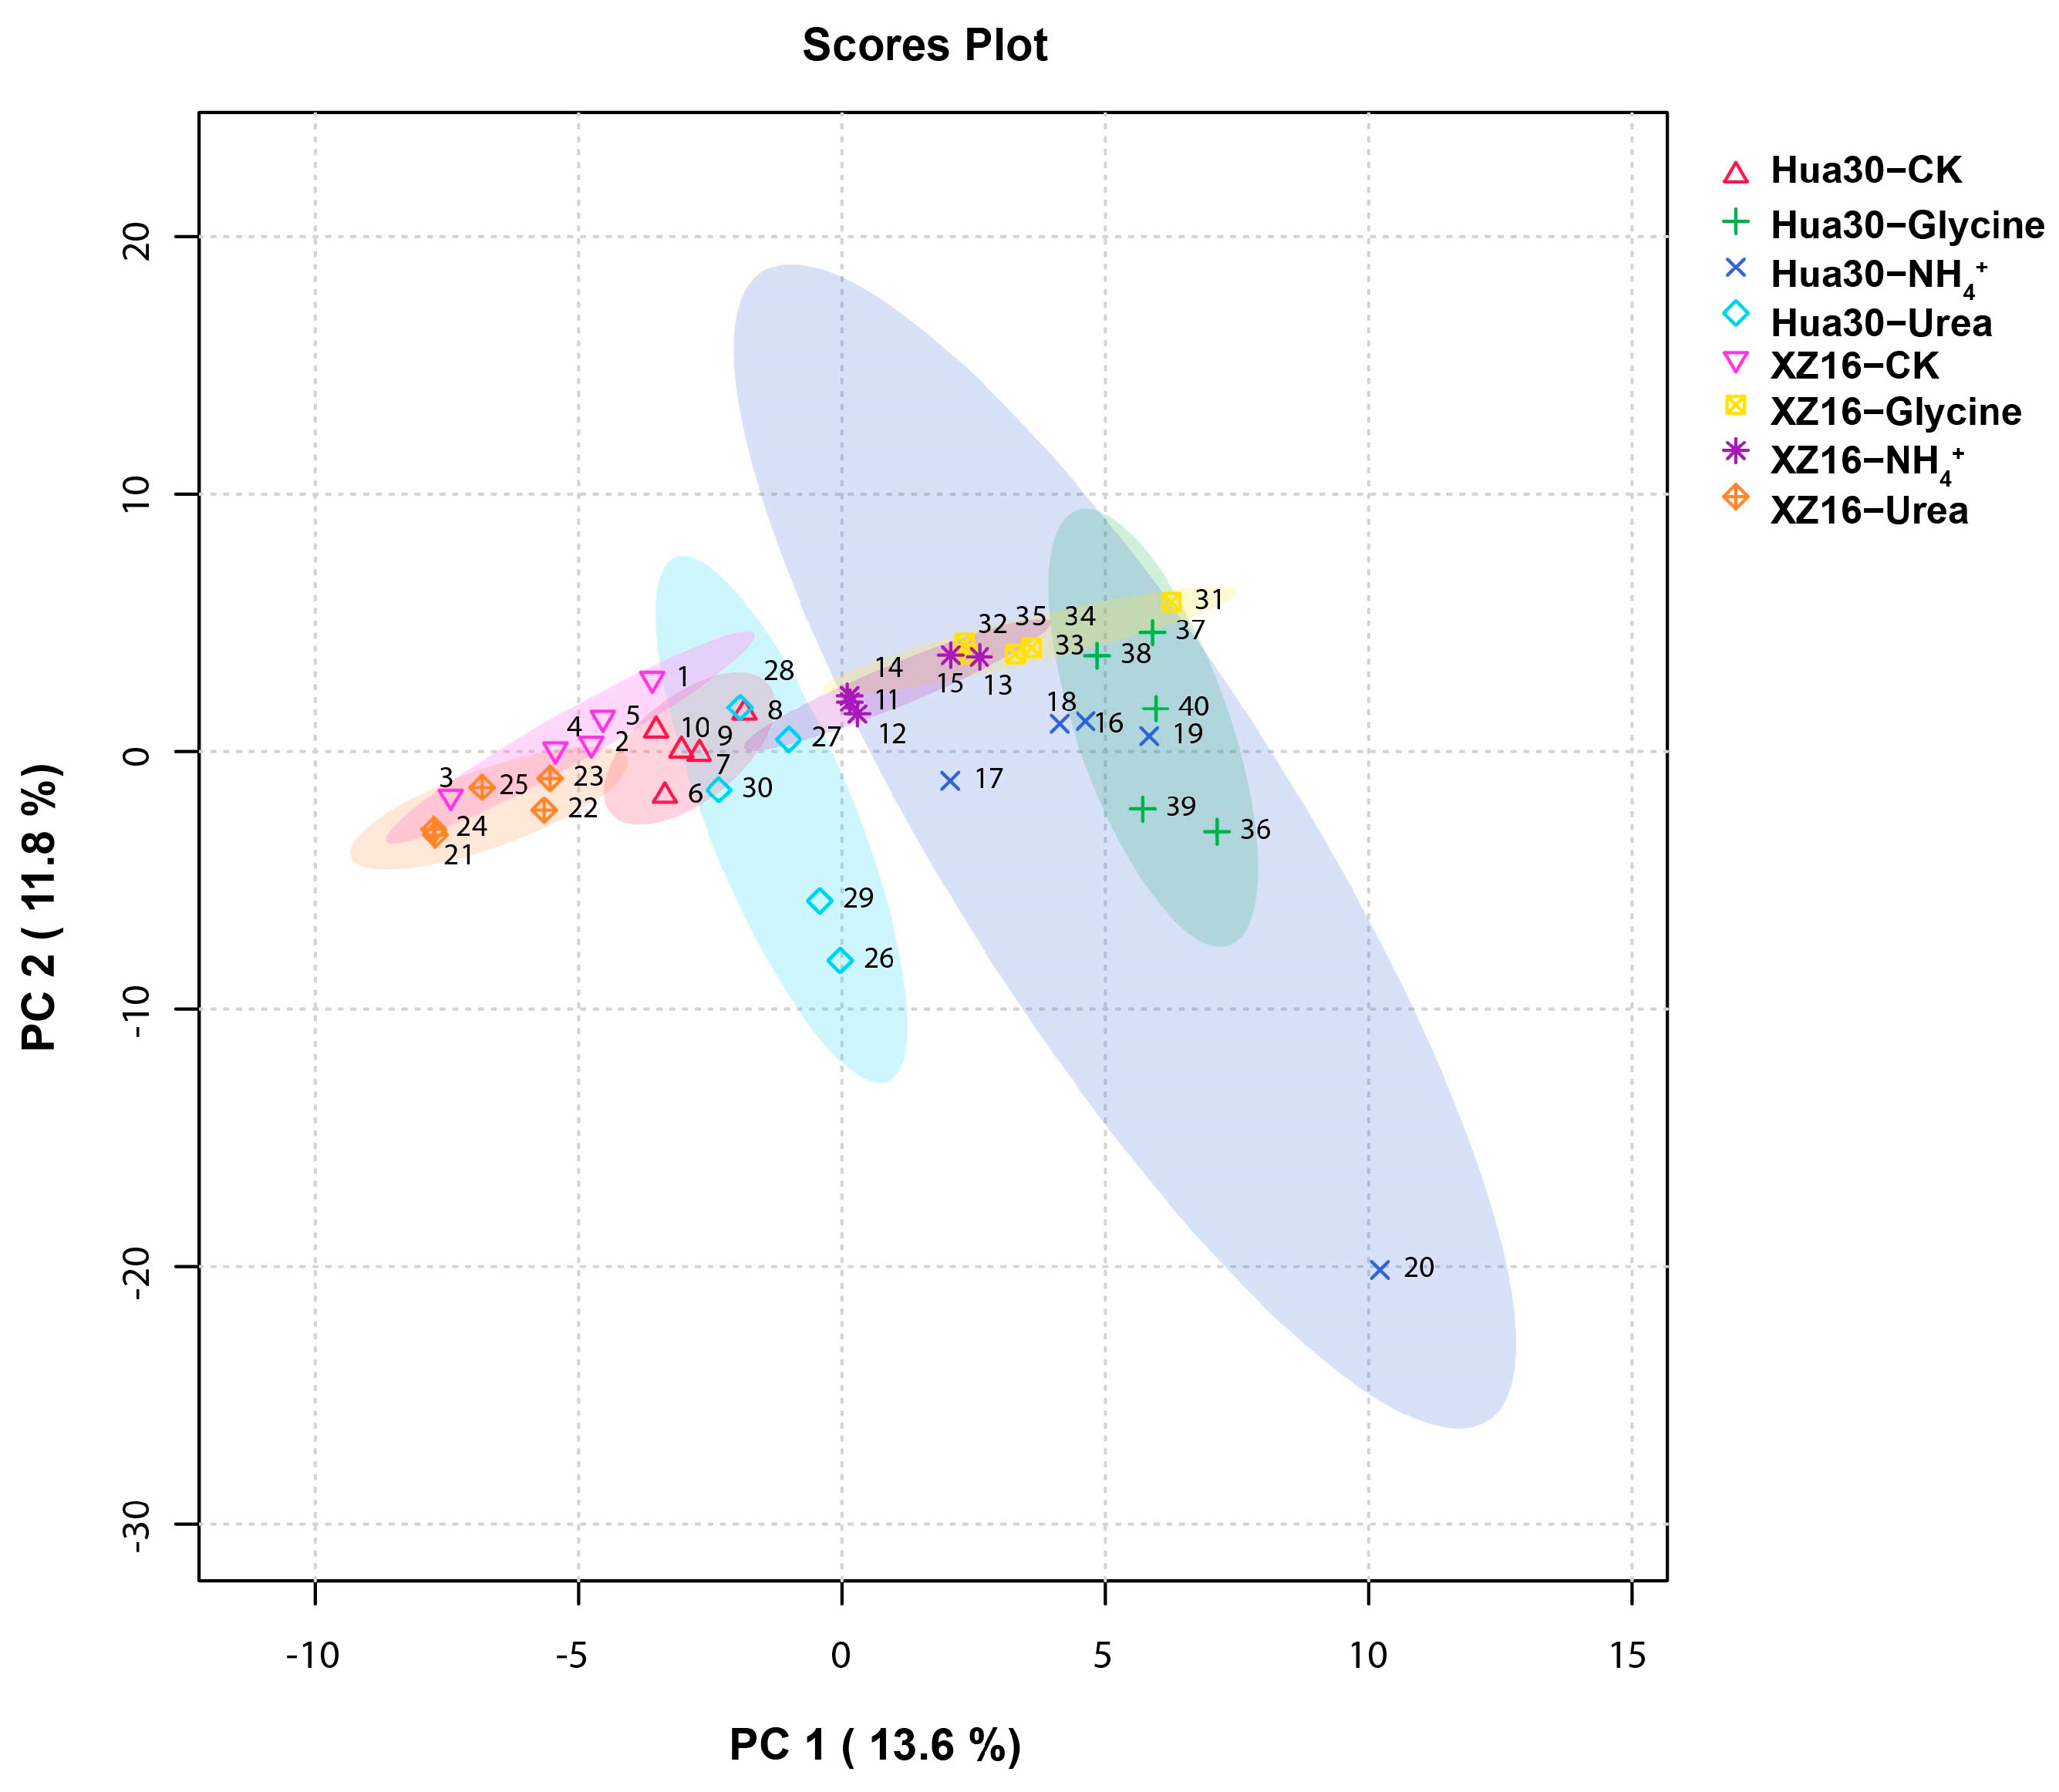
3.2. Metabolomics Profiles of XZ16 and Hua30

In total, 163 metabolites (Table S1) were differentially regulated in the shoots of XZ16 and Hua30 under the different nitrogen treatments. The up-regulated and down-regulated metabolites in each treatment are presented in Figure 1. The highest numbers of up-regulated metabolites were found in the glycine and ammonium treatments for XZ16 (47) and Hua30 (37), respectively (Figure 1A), while lowest number of up-regulated metabolites was observed in the urea treatment for XZ16 (18). Furthermore, there were 28 and 29 up-regulated metabolites in Hua30 in the urea and glycine treatments, respectively, while there were 33 up-regulated metabolites in XZ16 under the ammonium treatment. An opposite trend was observed in the down-regulated metabolites, where the most down-regulated metabolites were found in XZ16 (36) under the urea treatment (Figure 1B). In detail, the down-regulated metabolites under the ammonium (24 and 23) and glycine (28 and 23) treatments were found in XZ16 and Hua30, respectively.
To differentiate between the genotypes and treatments, PCA analysis was carried out (Figure 2). PC1 differentiated the nitrate (NO3) and urea samples from the ammonium- and glycine-treated samples, but PC1 and PC2 did not clearly differentiate the genotypes. Thus, partial least squares discriminant analysis (PLS-DA) was carried out. In the NO3 treatment, purine riboside, galactinol, and 13 others differentiated the two genotypes (Figure 3A), while in the ammonium treatment, d-fructose 1,6-bisphosphate, 3,6-anhydro-d-galactose, and 13 others differentiated the two genotypes (Figure 3B). Similarly, the dominated metabolites under the urea treatment were ornithine, linolenic acid, 8-Aminocaprylic acid, and 12 others (Figure 3C). In the glycine treatment, the dominating metabolites which contributed to genotype separation were glycine, allose, glucoheptonic acid, methyl phosphate, D-glyceric acid, and 10 others (Figure 3D). Among the top fifteen metabolites responsible for genotype separations, eight, nine, eleven, and eight were found to be unique in the nitrate, ammonium, urea, and glycine treatments, respectively. Methyl phosphate was common in the nitrate, ammonium, and glycine treatments, while d-fructose 1,6-bisphosphate, and glucoheptonic acid were found to be common under the ammonium and glycine treatments.

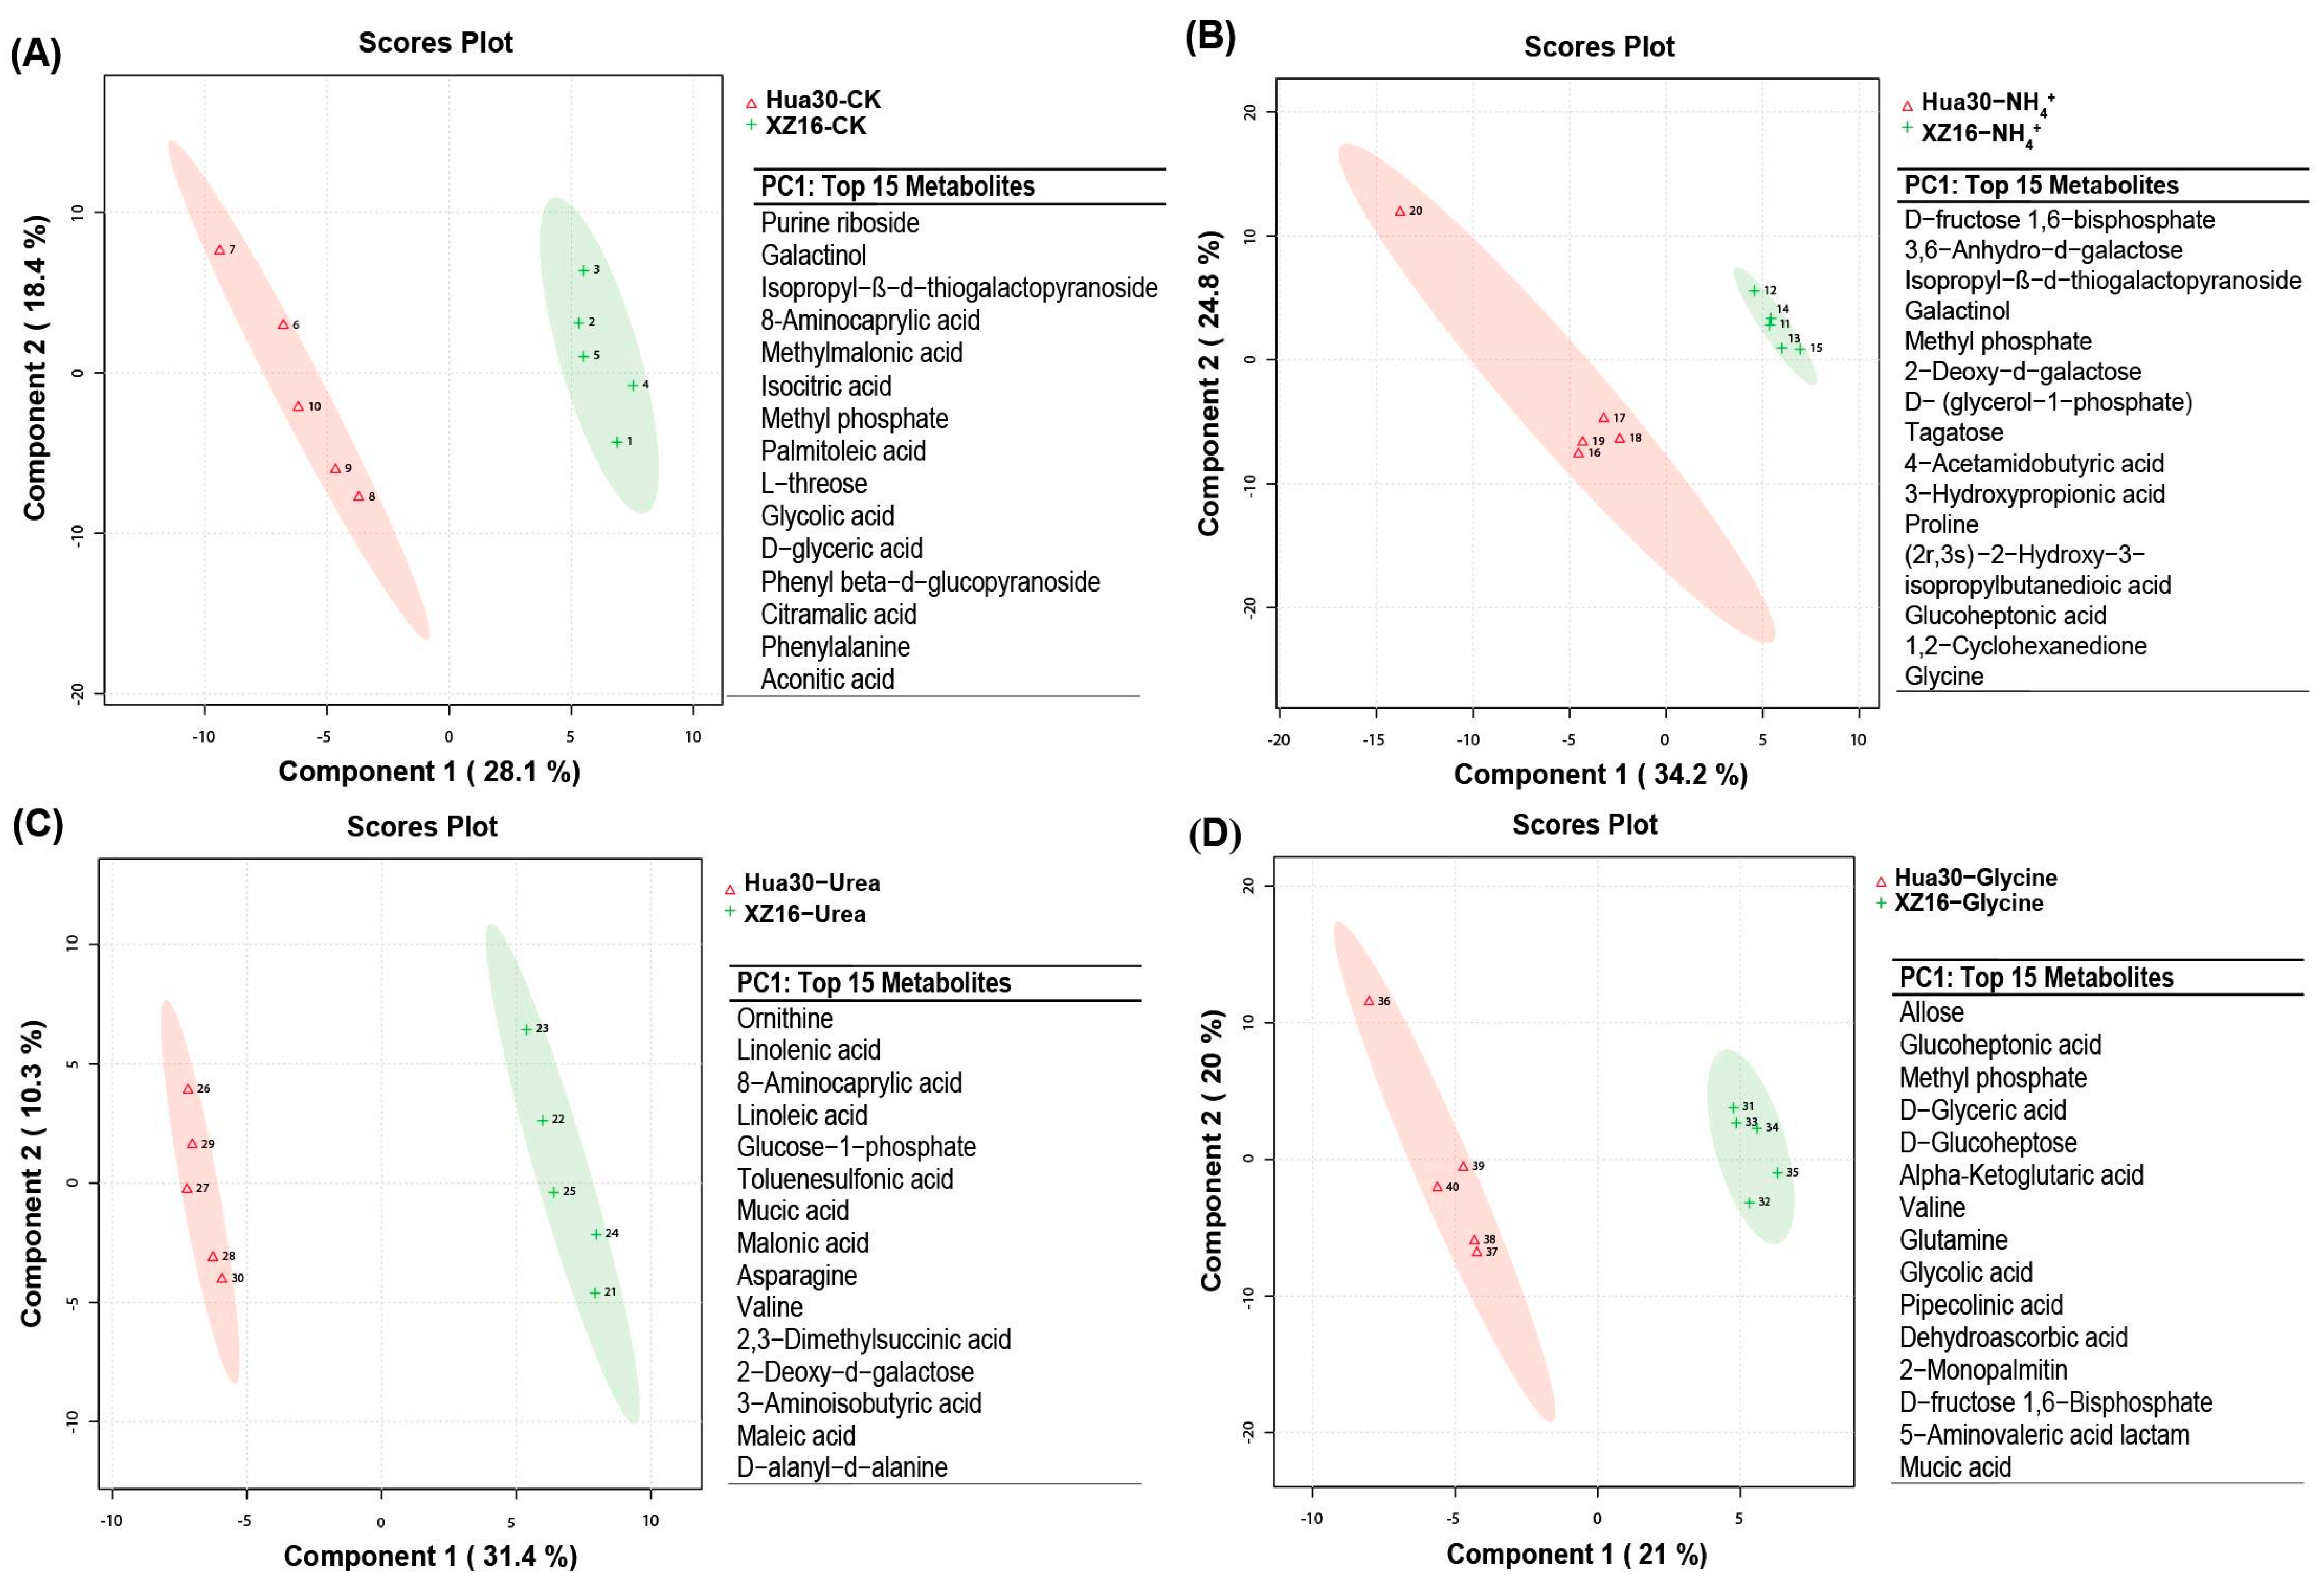
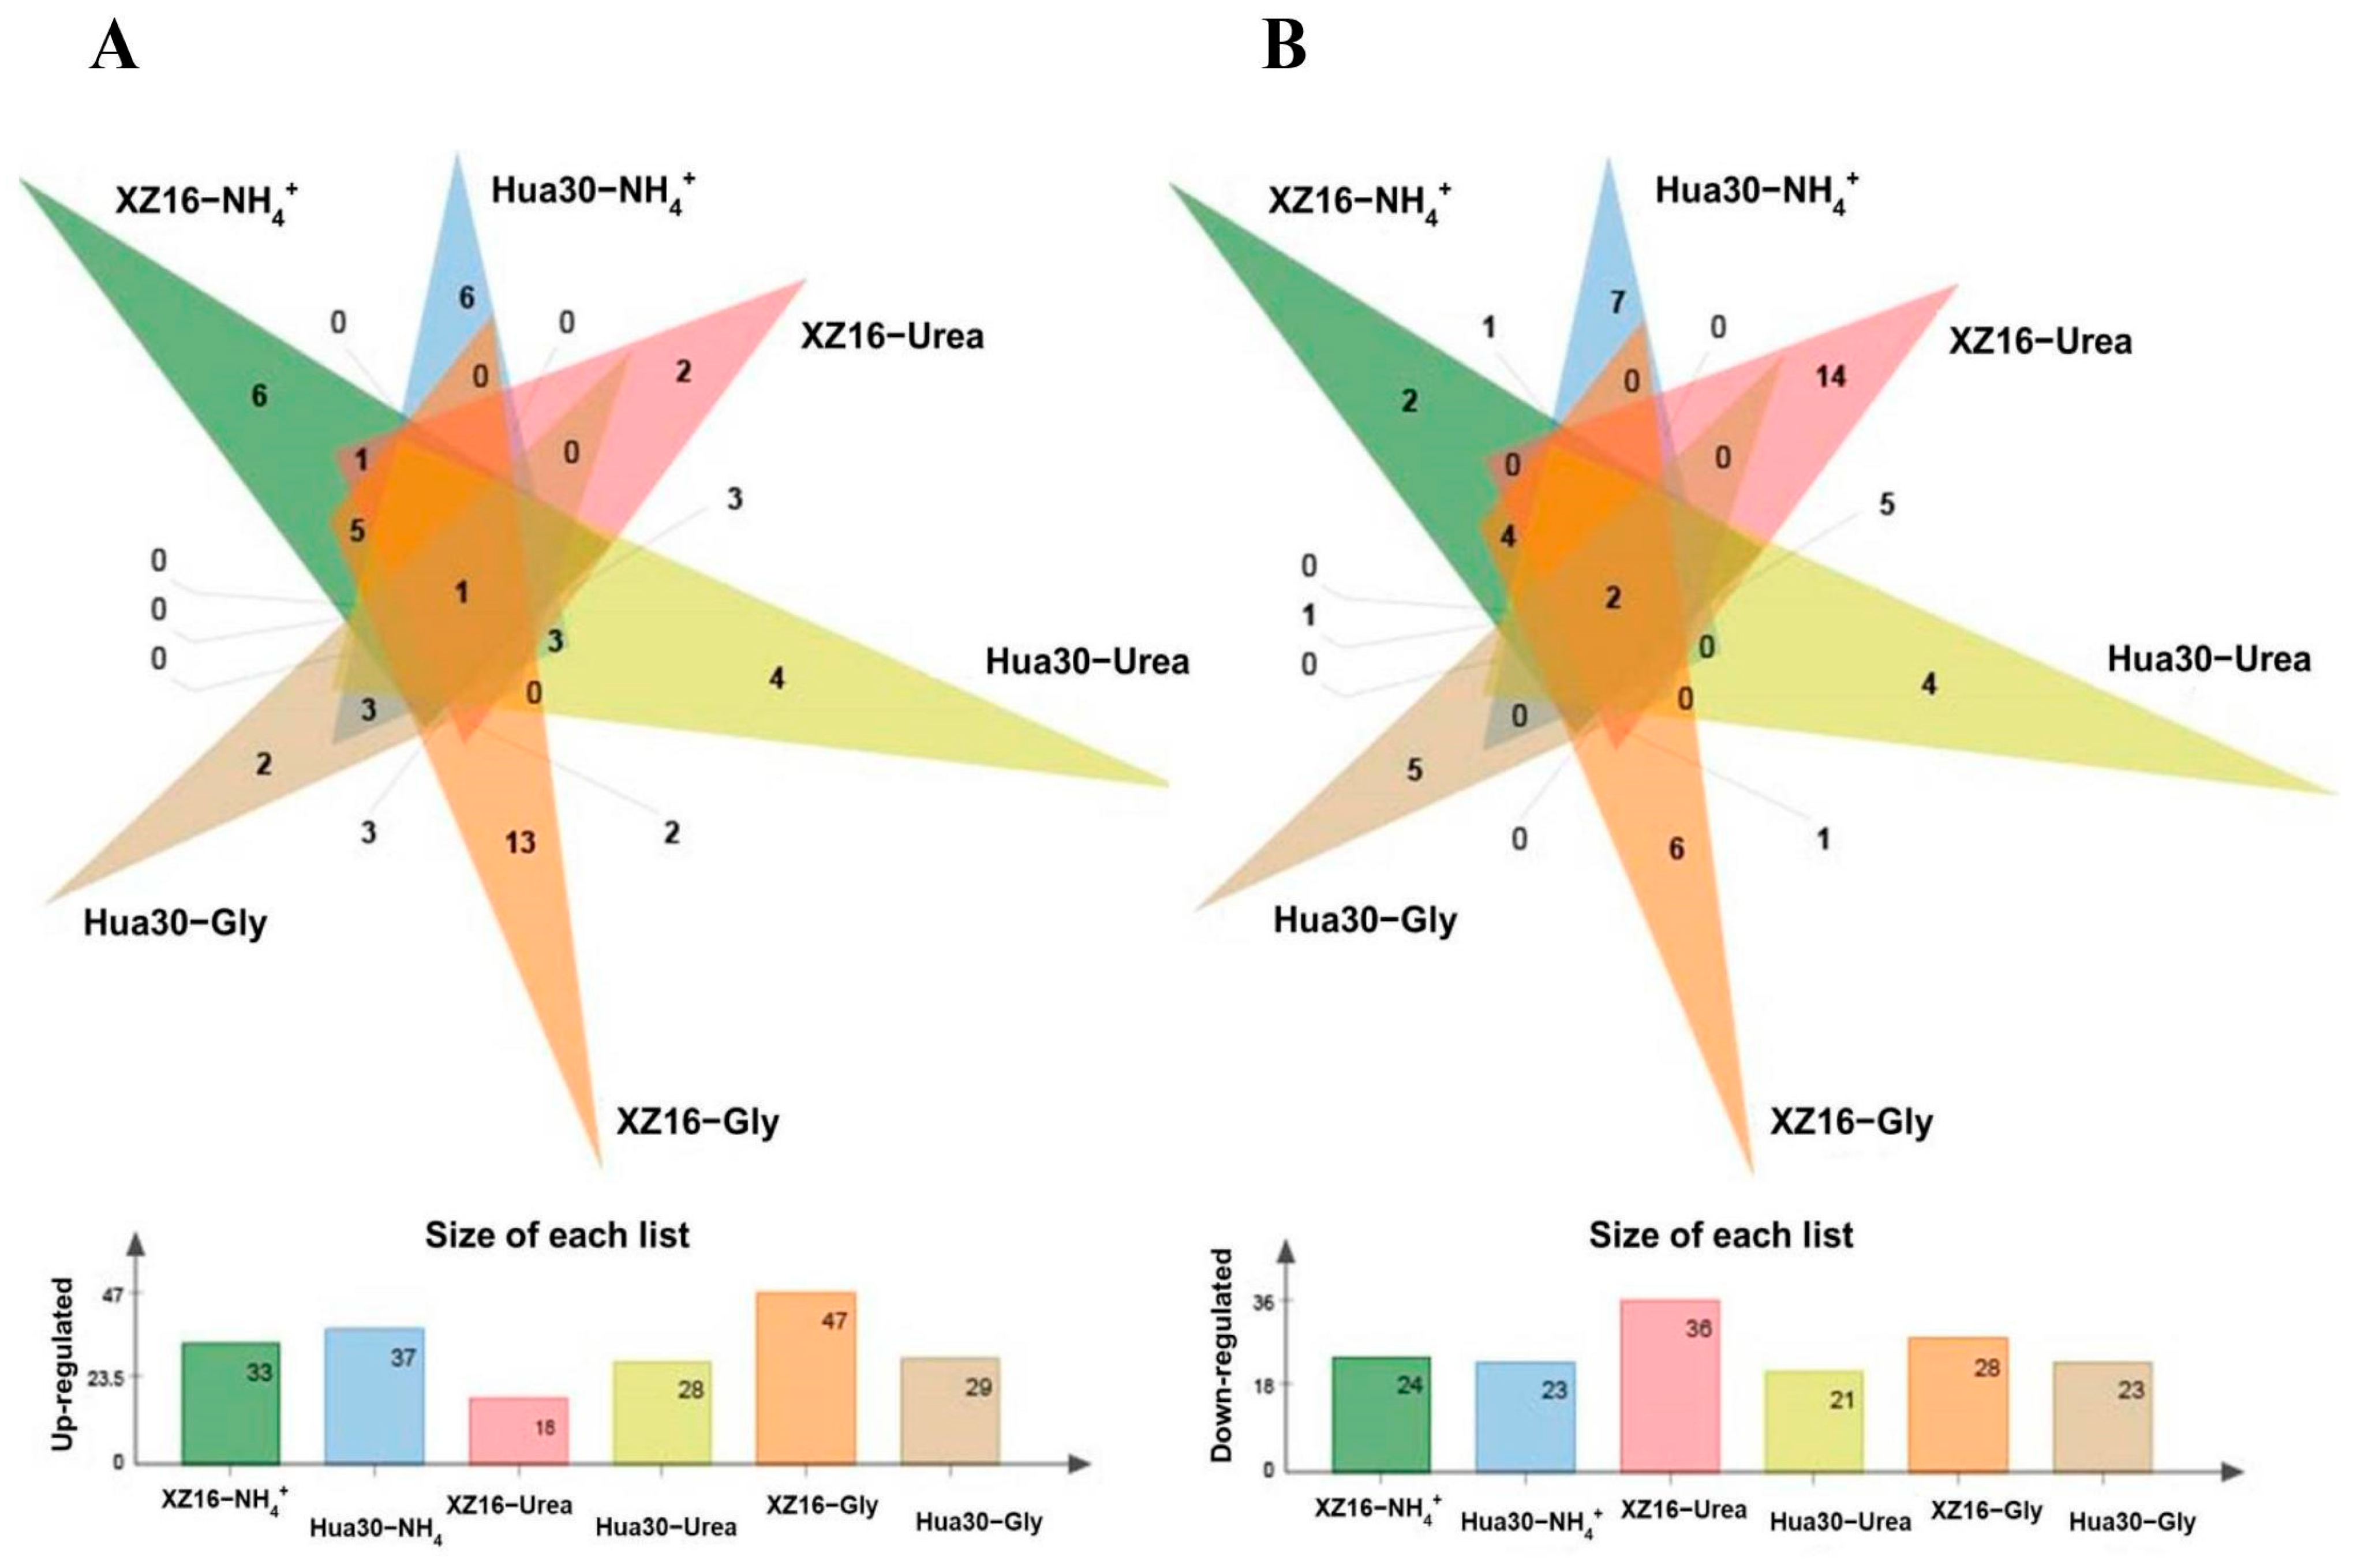
3.3. Genotype- and Treatment-Dependent Responses of Metabolites

Heatmap analysis (Figure 4) clearly showed that nitrate and urea had a similar trend in metabolite regulation, which can also be seen from the PCA analysis data; PC1 grouped these two together (Figure 2). Similarly, the metabolite contents in the ammonium- and glycine-treated plants were aligned together. However, there was distinct difference in each of the N treatments between the two genotypes. Hence, 3-hydroxypropionic, isopropyl-ß-d-thiogalacto-pyranoside, glutamine, D-(glycerol 1-phosphate), allose, and methyl phosphate were up-regulated in Hua30 and down-regulated in XZ16 under the ammonium treatment, while 4-acetamidobutyric acid, alpha-ketoglutaric acid, and mucic acid were up-regulated in XZ16 and down-regulated in Hua30. Mucic acid was also up-regulated under the urea, ammonium, and glycine treatments only in XZ16. Ornithine, 3-cyanoalanine, and asparagine were up-regulated in the ammonium and glycine treatments in both the genotypes, while these metabolites were down-regulated in the nitrate and urea treatments, except in Hua30, which showed a little up-regulation in the urea treatment. Similarly, glutamine was down-regulated in the nitrate and urea treatments, while it was up-regulated under the ammonium and glycine treatments, except XZ16, which showed the down-regulation of glutamine under the ammonium treatment. Some metabolites were found to be treatment-specific, such as putrescine, citric acid, and quinic acid, which were strongly down-regulated in the ammonium treatment for both the genotypes, and up-regulated or unchanged in the other treatments. Similarly, the quantities of lyxose and sulfuric acid were greatly reduced only in the glycine treatment for both the genotypes. On the other hand, some metabolites were genotype-specific, such as methyl phosphate, which was up-regulated in Hua30 under the nitrate, urea, and ammonium treatments. Similarly, mucic acid was up-regulated in XZ16 under the ammonium, urea, and glycine treatments (Figure 4).
In detail, we compared the whole metabolic profiles of the two genotypes under the ammonium, urea, and glycine treatments with respect to nitrate (as the control) by characterizing all the differentially regulated metabolites into major groups (Table S1). Also, we mapped the important metabolites to the common pathways of carbohydrate and amino acid metabolism (Figure 5). Mostly, the carbohydrates were up-regulated the under ammonium and urea treatments, but down-regulated under the glycine treatment in both the genotypes, but there were distinct variations between the wild and cultivated genotypes (Table S1). In the ammonium treatment, more carbohydrates were up-regulated in Hua30, but turanose, allose, D-(glycerol 1-phosphate), and 3,6-anhydro-D-galactose were commonly up-regulated in both the genotypes, with greater fold changes in Hua30 as compared to those of XZ16. In the urea treatment, sorbose, turanose, mannose, and digitoxose were also commonly up-regulated in both the genotypes, but there were greater changes in Hua30. Very few carbohydrates were up-regulated in the glycine treatment, but a number of amino acid and organic acids were up-regulated in the glycine treatment for both the genotypes, with greater number in XZ16 than Hua30. Some important amino acids, such as aspartic acid, serine, L-allothreonine, asparagine, glutamine, 3-cyanoalanine, L-homoserine, and ornithine were commonly up-regulated in both the genotypes, with a greater fold change in XZ16 (Table S1). Similarly, malonic acid, 4-aminobutyric acid, pyrrole-2-carboxylic acid, toluenesulfonic acid, guanidinosuccinic acid, dehydroascorbic acid, and 3-hydroxypropionic acid were up-regulated in both the genotypes, but with a significantly higher change in XZ16. Some fatty acids were significantly up-regulated only in XZ16 in the glycine treatment. A nitrogen-containing compound such as putrescine was also up-regulated in both the wild and cultivated genotypes, with a greater change in the wild genotype XZ16. Glycolysis and TCA cycle intermediates were strongly down-regulated in both the genotypes, with Hua30 showing more down-regulation as compared to that in XZ16. Also, fructose-6-phosphate, isocitric acid, and aconitic acid were only significantly up-regulated in XZ16 (Figure 5).
Except the carbohydrate metabolites, all the other metabolites, especially the amino acids and organic acids, were greatly reduced in the urea treatment, but there was a greater variation in the wild genotype as compared to that in the cultivated genotype, with XZ16 displaying more down-regulation as compared to Hua30.

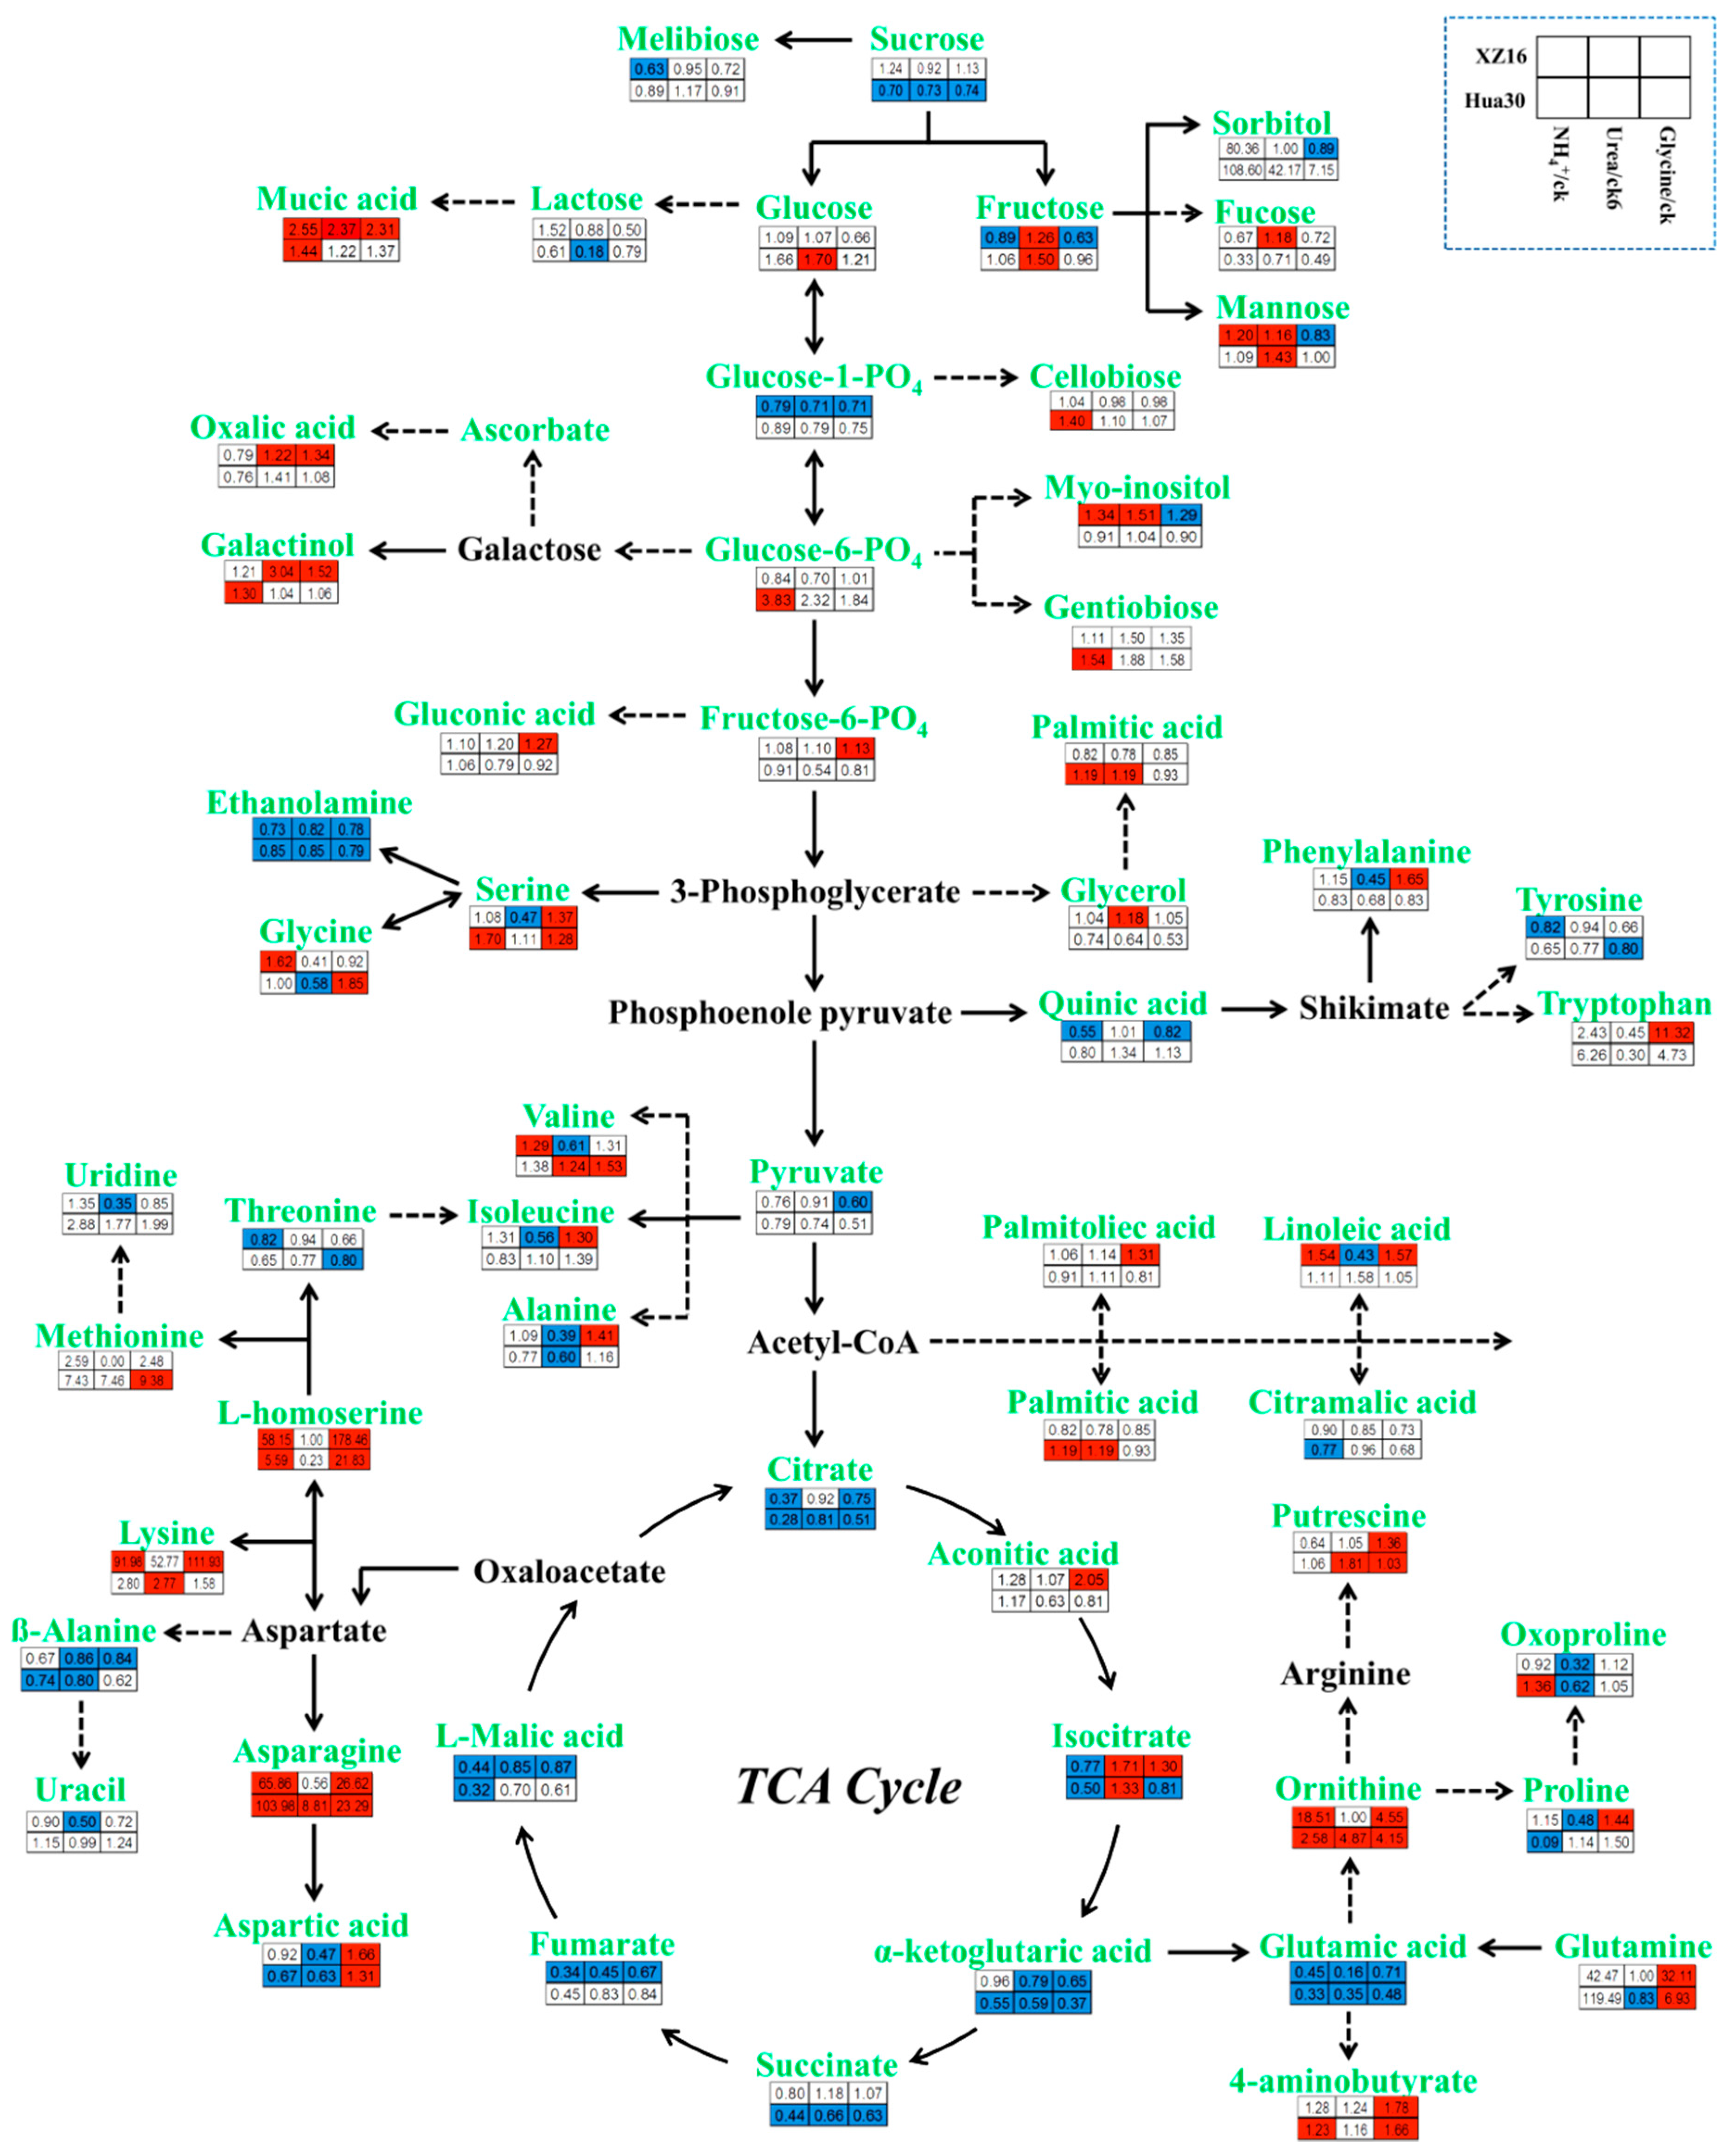
3.4. Pathway Analysis

The pathway analysis of all the metabolites was carried out by using online metaboanalyst 6.0. On the basis of KEGG and topology analysis, all the differentially regulated metabolites were analyzed. The most important pathways on the basis of p-value and the impact scores, were alanine, aspartate, and glutamate (0.597); glyoxylate and dicarboxylate (0.328); glycine, serine, and threonine (0.437); beta-alanine (0.325); pentose phosphate pathway (0.386); and the citrate cycle (TCA cycle) (0.279) (Table S2). Each treatment differently regulated the different pathways, as shown in the Supplementary Tables (Table S3–S6). In the glycine treatment, the glyoxylate and dicarboxylate and pentose phosphate pathways, which are important intermediates of 2-oxoglytarate, were less down-regulated in XZ16 as compared to those of Hua30 (Table S6), while in the ammonium treatment, glycine, serine, and threonine metabolism were enhanced in XZ16 (Table S4). The amino acid metabolism and TCA cycle were greatly affected by the four forms of nitrogen treatment (Table S1 and Figure 5). Aspartate and asparagine belonging to the alanine, aspartate, and glutamate pathways were more up-regulated under the ammonium and glycine treatments in XZ16 as compared to those of Hua30 (Table S1 and Figure 5).

4. Discussion

The leaf nutrient content as well as resorption mechanism play key roles in determining the plant nutrient utilization approaches [48]. Generally, a resource spending nutrient utilization approach is typically ideal for plant development as it is characterized by a high leaf nutrient concentration and less leaf nutrient resorption [49]. Still, a conservative consumption approach for nutrient utilization is found in plants that reflect a low leaf nutrient concentration and high-level leaf nutrient resorption [50]. Furthermore, the leaf nutrient concentration and its composition also indicate the status of plant nutrients, as well as their tolerance to nutrient deficiency [51,52]. In our study, we found more dramatic reductions in the concentrations of macro and micro nutrients under the glycine and ammonium treatments compared to those of the other two N form treatments. Still, a significant difference was observed between the two genotypes for nutrient concentrations in the specific N treatments. XZ16 had higher concentrations of nutrient ions in the glycine treatment as compared to those of Hua30, but Hua30 accumulated more nutrients in the ammonium treatment (Table 1), as reflected in our previous results [46], where some parameters, like the leaf surface area and tiller per plant, increased more in the ammonium treatment for the cultivated barley genotype as compared to those of the wild genotypes. Similarly, a higher biomass of wild genotypes was found under the urea treatment in our previous study, whereas, here, we found higher nutrient concentrations in both the genotypes under the urea treatment in comparison with the other two treatments, with XZ16 being higher than Hua30. Dubey et al. [53] found that ammonium nitrogen not only disturbed the nutrient balance, but also reduced calcium (Ca) uptake. In other studies, more ammonium uptake resulted in reduced Ca and Mg concentrations in the plants’ shoots and increased Mn and Al uptake [54,55]. Comparatively, a higher concentration of nutrient ions in XZ16 under the glycine treatment may demonstrate the better utilization of organic nitrogen in this wild barley genotype, and better NUE under organic fertilization will make the wild barley genotype a better option in harsh conditions and nitrogen-limited soil.
The activity of enzymes associated with leaf nitrogen metabolism can be significantly increased by better N fertilizer management [56], which promotes photosynthesis and enhances the biosynthesis of amino acids, organic acids, and proteins, along with other N-containing secondary metabolites in the plant tissues [57]. This study found altered patterns of sugars, amino acids, metabolites, and organic acids in the four nitrogen forms. In root metabolomics, we found the down-regulation of most sugars, metabolites, amino acids, and organic acids under the glycine treatment, but in shoot metabolomics, we found the opposite trend. The carbohydrate metabolism in the shoots was greatly improved under the ammonium and urea treatments in both the genotypes, with the plants treated with urea having a better carbohydrate metabolism than those under the ammonium treatment. But we can observe a difference between the two genotypes (Table S1). In the ammonium treatment, some commonly regulated sugar metabolites, such as turanose, allose, D-(glycerol 1-phosphate), and 3,6-anhydro-d-galactose, had greater fold changes in Hua30 (11.13, 3.23, 1.84, and 8.12) as compared to XZ16 (2.57, 1.68, 1.94, and 1.62), respectively (Table S1). Soluble sugar, being an osmolyte and signaling molecule, also has a role in the response of plants to environmental stresses [58]. Beta-mannosylglycerate is a potential protein thermostabilizer [59], and the significant up-regulation of this metabolite in Hua30 may increase leaves’ protein stability under ammonium treatment [60]. The accumulation of soluble sugar may confer higher abiotic stress resistance to Hua30 as compared to XZ16 under ammonium treatment. From Figure 5, it is clear that the glycolysis intermediate (fructose-6-P) was more up-regulated and pyruvate was less down-regulated in XZ16 as compared to those in Hua30, thus contributing to glycine utilization in XZ16. Similarly, the TCA cycle intermediates (aconitic acid and isocitrate) were more up-regulated, and citrate, alpha ketoglutarate, and fumarate were less down-regulated in XZ16 as compared to those in Hua30, which may also be the metabolites contributing to glycine uptake (Figure 5). Overall, glycine reduced the number of TCA intermediates in both the genotypes. Wang et al. [61] and Liu et al. [62] also found the same results, which elucidate the lower N use efficiency in plants exposed to a glycine treatment. Carbon metabolism have indirect impact on NUE, as nitrate signaling and N metabolism genes are partly regulated by sugar signaling [63], and the comparatively better carbon metabolism in XZ16 under a glycine treatment may help to improve its NUE.
Increased flexibility and variations have been found in the amino acid contents depending upon the species, cell type, and also the physiological conditions of plants [35,64,65]. Nutrient deficiency, low temperatures, and drought stresses might stimulate the synthesis of certain amino acids [57,66]. An amino acid content increase may be due to protein degradation into single amino acids, which can results in high energy production under stress conditions by providing a carbon skeleton to enhance the TCA cycle [67]. In this study, we found the accumulation of amino acids in the ammonium and glycine treatments in both the genotypes (Table S1), with Hua30 being more affected than XZ16 under the glycine treatment. Perchlik and Tegeder [68] also found higher nitrogen use efficiency under N-deficient conditions by supplying higher amino acid content to leaves, thereby enhancing the sink carbon content. Various researchers found that the amino acids contents and their relatives changes in shoots facilitate regulatory control over roots for nitrogen uptake [69,70,71]. Stress-responsive amino acids (proline, asparagine, and homoserine) are greatly boosted under ammonium and glycine treatments, but less responsive under a urea treatment. Moreover, the accumulation of asparagine was found in the above treatments, which is regarded as a plant adaptation and self-regulatory mechanism under organic nitrogen uptake [30,72]. The glycine treatment directed higher accumulations of L-ornithine and putrescine (intermediates of arginine and proline metabolism), as well as 4-aminobutanoic acid, which are responsible for plant stress reduction, as found in previous studies [73,74,75]. These findings suggest that glycine nutrition as a N source might enhance the stress resistance in barley, as reported in lettuce earlier [76]. Also, the associated changes may lead to an increase the antioxidant level and improve the tolerance against other abiotic stresses by suppling glycine supplements to plants [77].
Plants undergoing through vigorous growth stages have been observed to reduce some specific metabolites, like photosynthesis-related metabolites, metabolites of starch and sucrose metabolism, oxidative metabolism of the pentose phosphate pathway, TCA and glycolysis metabolites, along with nitrogen-containing metabolites, specially glutamine. This proposes that these metabolites provide the structural components for the biosynthesis of macromolecules, such proteins, which drive growth metabolism [78]. In the urea treatment, amino acid and the organic acids were more down-regulated in XZ16 as compared to Hua30. Urea is the best N fertilizer to aid barley growth, following nitrate [46]. Thus, for barley seedlings exposed to a urea treatment, it is not necessary for them to accumulate more amino acids or organic acids as a stress response. A possible reason for the reduced accumulation of amino acids may be the direct involvement of amino acids in protein synthesis. Furthermore, more down-regulation of these metabolites in XZ16 may be related to the increased biomass production in the urea treatment, as reported earlier [46].
The glyoxylate and dicarboxylate pathways, providing a metabolic balance to improve tolerance [79], were highly effected in the glycine treatment (Table S6 and Figure S1). Oxalic acid, isocitrate, and glutamine were significantly more up-regulated in XZ16 as compared to those in Hua30 under glycine in this pathway, which may be the reason for the increased utilization of glycine in XZ16. Similarly, in plants’ nitrogen metabolism, two important pathways are arginine and proline, which are crucial for nucleic acid and protein production. A precursor of polyamines, arginine has an essential role in proline biosynthesis in the absence of glutamate. In the ammonium treatment, this pathway was greatly affected (Table S4). The impact of ammonium treatment on this pathway is highly anticipated. Neto et al. [80] also found these pathways to be stress-responsive.

5. Conclusions

In total, 163 DRM (differentially regulated metabolites) were identified in the two barley genotypes exposed to four forms of N, among which the highest up-regulation values were observed in the glycine treatment, while highest down-regulation values were observed in the urea treatment in the wild genotype XZ16. The number of sugar metabolites, which provide a carbon skeleton for photosynthesis and other process, was greatly increased under the urea treatments as compared to the other treatments, while all the other metabolites, especially the amino acids, were greatly down-regulated in the urea treatment, which may be directly utilized for protein synthesis to produce more biomass. The up-regulation of amino acids and stress-responsive metabolites in the glycine treatment was observed. Furthermore, higher concentrations of macro and micro nutrients were found in urea and nitrate as compared to the ammonium and glycine treatments, but with a genotypic difference. Relatively, XZ16 had higher nutrient concentrations than Hua30 in the glycine treatment, while it was the opposite when the two genotypes were subjected to the ammonium treatment. More up-regulation of soluble sugar in Hua30 in the ammonium treatment may contribute to reduce ammonium toxicity. Similarly, the glycolysis and TCA intermediates were up-regulated only in XZ16 in the glycine treatment, along with stress-responsive metabolites, such as proline, asparagine, and putrescine. More up-regulation in XZ16 as compared to Hua30 may enable the wild genotypes to better utilize glycine. Using these results, we can conclude that nitrate and urea are the best nitrogen sources for barley, while for organic nitrogen utilization, the wild barley genotype is relatively better than the cultivated genotype. Furthermore, other integrated transcriptomic and proteomic approaches should be used to explore the better utilization mechanism of organic nitrogen in barley.

Supplementary Materials

The following supporting information can be downloaded at: https://www.mdpi.com/article/10.3390/agronomy14030621/s1, Figure S1: Variations in metabolites mapped to the glyoxylate and dicarboxylate metabolism in shoot tissues of XZ16 and Hua30; Table S1: The fold changes in metabolites in the shoot tissues of two genotypes (XZ16 and Hua30) under ammonium, urea, and glycine treatments; Table S2: Top 52 pathways under different nitrogen treatments in the shoot tissues of two genotypes (XZ16 and Hua30) through KEGG pathway analysis; Table S3: Pathways regulated under control treatment (NO3-) in the shoot tissues of two genotypes (XZ16, Hua30) through KEGG pathway analysis; Table S4: Pathways regulated under ammonium treatment (NH4+) in the shoot tissues of two genotypes (XZ16 and Hua30) through KEGG pathway analysis; Table S5: Pathways regulated under urea treatment in the shoot tissues of two genotypes (XZ16 and Hua30) through KEGG pathway analysis; Table S6: Pathways regulated under glycine treatment regulated in the shoot tissues of two genotypes (XZ16 and Hua30) through KEGG pathway analysis.

Author Contributions

Conceptualization, S.N. and G.Z.; sample preparation, S.N., F.K. and A.K.; formal analysis, S.N. and S.U.K.; investigation, S.N.; writing—original draft preparation, S.N. and S.U.K.; writing, review and editing, S.U.K. and G.Z.; project administration, G.Z.; funding acquisition, G.Z. All authors have read and agreed to the published version of the manuscript.

Funding

This work was supported by the Key Research Foundation of Science and Technology Department of Zhejiang Province of China (2021C02064-3) and Jiangsu Collaborative Innovation Center for Modern Crop Production.

Institutional Review Board Statement

Not applicable.

Informed Consent Statement

Not applicable.

Data Availability Statement

The data sets supporting the conclusions of this article are included within the article and its additional files.

Acknowledgments

We give thanks to the Science and Technology Department of Zhejiang Province of China and the Education Department of Jiangsu Province of China for their financial support for this research.

Conflicts of Interest

The authors declare no conflicts of interest.

References

  1. Lemaire, G.; Sinclair, T.; Sadras, V.; Bélanger, G. Allometric Approach to Crop Nutrition and Implications for Crop Diagnosis and Phenotyping: A Review. Agron. Sustain. Dev. 2019, 39, 27. [Google Scholar] [CrossRef]
  2. Dong, N.Q.; Lin, H.X. Higher Yield with Less Nitrogen Fertilizer. Nat. Plants 2020, 6, 1078–1079. [Google Scholar] [CrossRef] [PubMed]
  3. Zhao, B.; Ata-Ul-Karim, S.T.; Duan, A.; Liu, Z.; Wang, X.; Xiao, J.; Liu, Z.; Qin, A.; Ning, D.; Zhang, W.; et al. Determination of Critical Nitrogen Concentration and Dilution Curve Based on Leaf Area Index for Summer Maize. Field Crops Res. 2018, 228, 195–203. [Google Scholar] [CrossRef]
  4. Ge, J.; Tang, H.; Yang, N.; Hu, Y. Rapid Identification of Damaged Buildings Using Incremental Learning with Transferred Data from Historical Natural Disaster Cases. ISPRS J. Photogramm. Remote Sens. 2023, 195, 105–128. [Google Scholar] [CrossRef]
  5. Bloom, A.J. The Increasing Importance of Distinguishing among Plant Nitrogen Sources. Curr. Opin. Plant Biol. 2015, 25, 10–16. [Google Scholar] [CrossRef]
  6. Owen, A.G.; Jones, D.L. Competition for Amino Acids between Wheat Roots and Rhizosphere Microorganisms and the Role of Amino Acids in Plant N Acquisition. Soil Biol. Biochem. 2001, 33, 651–657. [Google Scholar] [CrossRef]
  7. Becker-Ritt, A.B.; Martinelli, A.H.S.; Mitidieri, S.; Feder, V.; Wassermann, G.E.; Santi, L.; Vainstein, M.H.; Oliveira, J.T.A.; Fiuza, L.M.; Pasquali, G. Antifungal Activity of Plant and Bacterial Ureases. Toxicon 2007, 50, 971–983. [Google Scholar] [CrossRef]
  8. Perchlik, M.; Foster, J.; Tegeder, M. Different and Overlapping Functions of Arabidopsis LHT6 and AAP1 Transporters in Root Amino Acid Uptake. J. Exp. Bot. 2014, 65, 5193–5204. [Google Scholar] [CrossRef]
  9. Mérigout, P.; Lelandais, M.; Bitton, F.; Renou, J.-P.; Briand, X.; Meyer, C.; Daniel-Vedele, F. Physiological and Transcriptomic Aspects of Urea Uptake and Assimilation in Arabidopsis Plants. Plant Physiol. 2008, 147, 1225–1238. [Google Scholar] [CrossRef]
  10. Pinton, R.; Tomasi, N.; Zanin, L. Molecular and Physiological Interactions of Urea and Nitrate Uptake in Plants. Plant Signal. Behav. 2016, 11, e1076603. [Google Scholar] [CrossRef]
  11. Tian, Y.; Yu, M.; Xu, F.; Ouyang, S.; Xu, X.; Gao, Q.; Li, X. Uptake of Amino Acids and Inorganic Nitrogen by Two Dominant Temperate Grasses. Rhizosphere 2020, 14, 100199. [Google Scholar] [CrossRef]
  12. Näsholm, T.; Ekblad, A.; Nordin, A.; Giesler, R.; Högberg, M.; Högberg, P. Boreal Forest Plants Take up Organic Nitrogen. Nature 1998, 392, 914–916. [Google Scholar] [CrossRef]
  13. Henry, H.A.L.; Jefferies, R.L. Interactions in the Uptake of Amino Acids, Ammonium and Nitrate Ions in the Arctic Salt-marsh Grass, Puccinellia Phryganodes. Plant Cell Environ. 2003, 26, 419–428. [Google Scholar] [CrossRef]
  14. Hu, B.; Zhou, M.; Bilela, S.; Simon, J.; Dannenmann, M.; Liu, X.; Alfarraj, S.; Hou, L.; Chen, H.; Zhang, S.; et al. Nitrogen Nutrition of Native and Introduced Forest Tree Species in N-Limited Ecosystems of the Qinling Mountains, China. Trees 2017, 31, 1189–1202. [Google Scholar] [CrossRef]
  15. Brackin, R.; Näsholm, T.; Robinson, N.; Guillou, S.; Vinall, K.; Lakshmanan, P.; Schmidt, S.; Inselsbacher, E. Nitrogen Fluxes at the Root-Soil Interface Show a Mismatch of Nitrogen Fertilizer Supply and Sugarcane Root Uptake Capacity. Sci. Rep. 2015, 5, 15727. [Google Scholar] [CrossRef]
  16. Gioseffi, E.; de Neergaard, A.; Schjørring, J.K. Interactions between Uptake of Amino Acids and Inorganic Nitrogen in Wheat Plants. Biogeosciences 2012, 9, 1509–1518. [Google Scholar] [CrossRef]
  17. Wei, L.; Chen, C.; Yu, S. Uptake of Organic Nitrogen and Preference for Inorganic Nitrogen by Two Australian Native Araucariaceae Species. Plant Ecol. Divers. 2015, 8, 259–264. [Google Scholar] [CrossRef]
  18. Guo, S.; Zhou, Y.; Shen, Q.; Zhang, F. Effect of Ammonium and Nitrate Nutrition On Some Physiological Processes in Higher Plants-Growth, Photosynthesis, Photorespiration, and Water Relations. Plant Biol. 2007, 9, 21–29. [Google Scholar] [CrossRef]
  19. Ding, L.; Gao, C.; Li, Y.; Li, Y.; Zhu, Y.; Xu, G.; Shen, Q.; Kaldenhoff, R.; Kai, L.; Guo, S. The Enhanced Drought Tolerance of Rice Plants under Ammonium Is Related to Aquaporin (AQP). Plant Sci. 2015, 234, 14–21. [Google Scholar] [CrossRef]
  20. Cramer, M.D.; Lewis, O.A.M. The Influence of Nitrate and Ammonium Nutrition on the Growth of Wheat (Triticum Aestivum) and Maize (Zea mays) Plants. Ann. Bot. 1993, 72, 359–365. [Google Scholar] [CrossRef]
  21. Raab, T.K.; Terry, N. Nitrogen Source Regulation of Growth and Photosynthesis in Beta vulgaris L. Plant Physiol. 1994, 105, 1159–1166. [Google Scholar] [CrossRef] [PubMed]
  22. Guo, S.; Kaldenhoff, R.; Uehlein, N.; Sattelmacher, B.; Brueck, H. Relationship between Water and Nitrogen Uptake in Nitrate- and Ammonium-Supplied Phaseolus vulgaris L. Plants. J. Plant Nutr. Soil Sci. 2007, 170, 73–80. [Google Scholar] [CrossRef]
  23. Lu, Y.X.; Li, C.J.; Zhang, F.S. Transpiration, Potassium Uptake and Flow in Tobacco as Affected by Nitrogen Forms and Nutrient Levels. Ann. Bot. 2005, 95, 991–998. [Google Scholar] [CrossRef] [PubMed]
  24. Gao, L.; Liu, M.; Wang, M.; Shen, Q.; Guo, S. Enhanced Salt Tolerance under Nitrate Nutrition Is Associated with Apoplast Na+ Content in Canola (Brassica. napus L.) and Rice (Oryza sativa L.) Plants. Plant Cell Physiol. 2016, 57, 2323–2333. [Google Scholar] [CrossRef] [PubMed]
  25. Li, Y.; Gao, Y.; Ding, L.; Shen, Q.; Guo, S. Ammonium Enhances the Tolerance of Rice Seedlings (Oryza sativa L.) to Drought Condition. Agric. Water Manag. 2009, 96, 1746–1750. [Google Scholar] [CrossRef]
  26. Malagoli, M.; Dal Canal, A.; Quaggiotti, S.; Pegoraro, P.; Bottacin, A. Differences in Nitrate and Ammonium Uptake between Scots Pine and European Larch. Plant Soil 2000, 221, 1–3. [Google Scholar] [CrossRef]
  27. Nasir, C.; Malik, M.; Qadir, G.; Rafique, M.; Nawaz, N. Influence of Temperature and Osmotic Stress on Germination Induction of Different Castor Bean Cultivars. Pak. J. Bot. 2010, 42, 4035–4041. [Google Scholar]
  28. Khalilzadeh, R.; Tajbakhsh, M.; Jalilian, J. Growth Characteristics of Mung Bean (Vigna radiata L.) Affected by Foliar Application of Urea and Bio-Organic Fertilizers. Int. J. Agric. Crop Sci. 2012, 4, 637–642. [Google Scholar]
  29. Wang, X.L.; Yang, D.N.; Huang, D.F. Effects of different applied nitrogen forms on pakchoi (Brassica chinensis) growth and its carbon and nitrogen accumulation. Ying Yong Sheng Tai Xue Bao = J. Appl. Ecol. 2012, 23, 1042–1048. [Google Scholar]
  30. Forsum, O.; Svennerstam, H.; Ganeteg, U.; Näsholm, T. Capacities and Constraints of Amino Acid Utilization in Arabidopsis. New Phytol. 2008, 179, 1058–1069. [Google Scholar] [CrossRef]
  31. Wang, X.; Tang, D.; Huang, D. Proteomic Analysis of Pakchoi Leaves and Roots under Glycine–Nitrogen Conditions. Plant Physiol. Biochem. 2014, 75, 96–104. [Google Scholar] [CrossRef] [PubMed]
  32. Liang, C.; Tian, J.; Liao, H. Proteomics Dissection of Plant Responses to Mineral Nutrient Deficiency. Proteomics 2013, 13, 624–636. [Google Scholar] [CrossRef] [PubMed]
  33. Zhou, M.; Zhu, S.; Mo, X.; Guo, Q.; Li, Y.; Tian, J.; Liang, C. Proteomic Analysis Dissects Molecular Mechanisms Underlying Plant Responses to Phosphorus Deficiency. Cells 2022, 11, 651. [Google Scholar] [CrossRef] [PubMed]
  34. Luo, J. Metabolite-Based Genome-Wide Association Studies in Plants. Curr. Opin. Plant Biol. 2015, 24, 31–38. [Google Scholar] [CrossRef] [PubMed]
  35. Schlüter, U.; Mascher, M.; Colmsee, C.; Scholz, U.; Bräutigam, A.; Fahnenstich, H.; Sonnewald, U. Maize Source Leaf Adaptation to Nitrogen Deficiency Affects Not Only Nitrogen and Carbon Metabolism but Also Control of Phosphate Homeostasis. Plant Physiol. 2012, 160, 1384–1406. [Google Scholar] [CrossRef] [PubMed]
  36. Xin, W.; Zhang, L.; Zhang, W.; Gao, J.; Yi, J.; Zhen, X.; Li, Z.; Zhao, Y.; Peng, C.; Zhao, C. An Integrated Analysis of the Rice Transcriptome and Metabolome Reveals Differential Regulation of Carbon and Nitrogen Metabolism in Response to Nitrogen Availability. Int. J. Mol. Sci. 2019, 20, 2349. [Google Scholar] [CrossRef] [PubMed]
  37. Wang, Y.; Wang, D.; Tao, Z.; Yang, Y.; Gao, Z.; Zhao, G.; Chang, X. Impacts of Nitrogen Deficiency on Wheat (Triticum aestivum L.) Grain During the Medium Filling Stage: Transcriptomic and Metabolomic Comparisons. Front. Plant Sci. 2021, 12, 674433. [Google Scholar] [CrossRef]
  38. Quan, X.; Qian, Q.; Ye, Z.; Zeng, J.; Han, Z.; Zhang, G. Metabolic Analysis of Two Contrasting Wild Barley Genotypes Grown Hydroponically Reveals Adaptive Strategies in Response to Low Nitrogen Stress. J. plant physiol. 2016, 206, 59–67. [Google Scholar] [CrossRef]
  39. Shen, X.; Yang, L.; Han, P.; Gu, C.; Li, Y.; Liao, X.; Qin, L. Metabolic Profiles Reveal Changes in the Leaves and Roots of Rapeseed (Brassica napus L.) Seedlings under Nitrogen Deficiency. Int. J. Mol. Sci. 2022, 23, 5784. [Google Scholar] [CrossRef]
  40. Sung, J.; Lee, S.; Lee, Y.; Ha, S.; Song, B.; Kim, T.; Waters, B.M.; Krishnan, H.B. Metabolomic Profiling from Leaves and Roots of Tomato (Solanum lycopersicum L.) Plants Grown under Nitrogen, Phosphorus or Potassium-Deficient Condition. Plant Sci. 2015, 241, 55–64. [Google Scholar] [CrossRef]
  41. Tschoep, H.; Gibon, Y.; Carillo, P.; Armengaud, P.; Szecowka, M.; Nunes-Nesi, A.; Fernie, A.R.; Koehl, K.; Stitt, M. Adjustment of Growth and Central Metabolism to a Mild but Sustained Nitrogen-Limitation in Arabidopsis. Plant Cell Environ. 2009, 32, 300–318. [Google Scholar] [CrossRef] [PubMed]
  42. Schlüter, U.; Colmsee, C.; Scholz, U.; Bräutigam, A.; Weber, A.P.M.; Zellerhoff, N.; Bucher, M.; Fahnenstich, H.; Sonnewald, U. Adaptation of Maize Source Leaf Metabolism to Stress Related Disturbances in Carbon, Nitrogen and Phosphorus Balance. BMC Genom. 2013, 14, 1–25. [Google Scholar] [CrossRef] [PubMed]
  43. Wang, C.; Li, Y.; Bai, W.; Yang, X.; Wu, H.; Lei, K.; Huang, R.; Zhang, S.; Huang, Q.; Lin, Q. Comparative Transcriptome Analysis Reveals Different Low-Nitrogen-Responsive Genes in Pepper Cultivars. Horticulturae 2021, 7, 110. [Google Scholar] [CrossRef]
  44. Franklin, O.; Cambui, C.A.; Gruffman, L.; Palmroth, S.; Oren, R.; Näsholm, T. The Carbon Bonus of Organic Nitrogen Enhances Nitrogen Use Efficiency of Plants. Plant Cell Environ. 2017, 40, 25–35. [Google Scholar] [CrossRef] [PubMed]
  45. Ganeteg, U.; Ahmad, I.; Jämtgård, S.; Aguetoni-Cambui, C.; Inselsbacher, E.; Svennerstam, H.; Schmidt, S.; Näsholm, T. Amino Acid Transporter Mutants of Arabidopsis Provides Evidence That a Non-mycorrhizal Plant Acquires Organic Nitrogen from Agricultural Soil. Plant Cell Environ. 2017, 40, 413–423. [Google Scholar] [CrossRef] [PubMed]
  46. Naz, S.; Shen, Q.; Wa Lwalaba, J.L.; Zhang, G. Genotypic Difference in the Responses to Nitrogen Fertilizer Form in Tibetan Wild and Cultivated Barley. Plants 2021, 10, 595. [Google Scholar] [CrossRef]
  47. Tsugawa, H.; Tsujimoto, Y.; Arita, M.; Bamba, T.; Fukusaki, E. GC/MS Based Metabolomics: Development of a Data Mining System for Metabolite Identification by Using Soft Independent Modeling of Class Analogy (SIMCA). BMC Bioinform. 2011, 12, 131. [Google Scholar] [CrossRef]
  48. See, C.R.; Yanai, R.D.; Fisk, M.C.; Vadeboncoeur, M.A.; Quintero, B.A.; Fahey, T.J. Soil Nitrogen Affects Phosphorus Recycling: Foliar Resorption and Plant–Soil Feedbacks in a Northern Hardwood Forest. Ecology 2015, 96, 2488–2498. [Google Scholar] [CrossRef]
  49. Kobe, R.K.; Lepczyk, C.A.; Iyer, M. Resorption Efficiency Decreases With Increasing Green Leaf Nutrients in A Global Data Set. Ecology 2005, 86, 2780–2792. [Google Scholar] [CrossRef]
  50. Lü, X.T.; Reed, S.C.; Yu, Q.; Han, X.G. Nutrient Resorption Helps Drive Intra-Specific Coupling of Foliar Nitrogen and Phosphorus under Nutrient-Enriched Conditions. Plant Soil 2016, 398, 111–120. [Google Scholar] [CrossRef]
  51. Grime, J.P. Benefits of Plant Diversity to Ecosystems: Immediate, Filter and Founder Effects. J. Ecol. 1998, 86, 902–910. [Google Scholar] [CrossRef]
  52. Güsewell, S. Nutrient Resorption of Wetland Graminoids Is Related to the Type of Nutrient Limitation. Funct. Ecol. 2005, 19, 344–354. [Google Scholar] [CrossRef]
  53. Dubey, R.S.; Srivastava, R.K.; Pessarakli, M. Physiological mechanisms of nitrogen absorption and assimilation in plants under stressful conditions. In Handbook of Plant and Crop Physiology; CRC Press: Boca Raton, FL, USA, 2021; pp. 579–616. [Google Scholar]
  54. Bowman, W.D.; Cleveland, C.C.; Halada, Ĺ.; Hreško, J.; Baron, J.S. Negative Impact of Nitrogen Deposition on Soil Buffering Capacity. Nat. Geosci. 2008, 1, 767–770. [Google Scholar] [CrossRef]
  55. Tian, D.; Niu, S. A Global Analysis of Soil Acidification Caused by Nitrogen Addition. Environ. Res. Lett. 2015, 10, 24019. [Google Scholar] [CrossRef]
  56. Wang, J.; Fu, Z.; Chen, G.; Zou, G.; Song, X.; Liu, F. Runoff Nitrogen (N) Losses and Related Metabolism Enzyme Activities in Paddy Field under Different Nitrogen Fertilizer Levels. Environ. Sci. Pollut. Res. Int. 2018, 25, 27583–27593. [Google Scholar] [CrossRef]
  57. Cao, Y.; Qu, R.; Tang, X.; Sun, L.; Chen, Q.; Miao, Y. UPLC-Triple TOF-MS/MS Based Metabolomics Approach to Reveal the Influence of Nitrogen Levels on Isatis Indigotica Seedling Leaf. Sci. Hortic. 2020, 266, 109280. [Google Scholar] [CrossRef]
  58. Wang, H.; Gong, M.; Xin, H.; Tang, L.; Dai, D.; Gao, Y.; Liu, C. Effects of Chilling Stress on the Accumulation of Soluble Sugars and Their Key Enzymes in Jatropha Curcas Seedlings. Physiol. Mol. Biol. Plants 2018, 24, 857–865. [Google Scholar] [CrossRef]
  59. Ramos, A.; Raven, N.; Sharp, R.J.; Bartolucci, S.; Rossi, M.; Cannio, R.; Lebbink, J.; Van Der Oost, J.; De Vos, W.M.; Santos, H. Stabilization of Enzymes against Thermal Stress and Freeze-Drying by Mannosylglycerate. Appl. Environ. Microbiol. 1997, 63, 4020–4025. [Google Scholar] [CrossRef]
  60. Lin, Z.H.; Chen, C.S.; Zhong, Q.S.; Ruan, Q.C.; Chen, Z.H.; You, X.M.; Shan, R.Y.; Li, X.L. The GC-TOF/MS-Based Metabolomic Analysis Reveals Altered Metabolic Profiles in Nitrogen-Deficient Leaves and Roots of Tea Plants (Camellia sinensis). BMC Plant Biol. 2021, 21, 506. [Google Scholar] [CrossRef]
  61. Wang, X.; Yu, W.; Zhou, Q.; Han, R.; Huang, D. Metabolic Response of Pakchoi Leaves to Amino Acid Nitrogen. J. Integr. Agric. 2014, 13, 778–788. [Google Scholar] [CrossRef]
  62. Liu, X.; Yang, X.; Wang, L.; Duan, Q.; Huang, D. Comparative Analysis of Metabolites Profile in Spinach (Spinacia oleracea L.) Affected by Different Concentrations of Gly and Nitrate. Sci. Hortic. 2016, 204, 8–15. [Google Scholar] [CrossRef]
  63. Yang, X.; Nian, J.; Xie, Q.; Feng, J.; Zhang, F.; Jing, H.; Zhang, J.; Dong, G.; Liang, Y.; Peng, J. Rice Ferredoxin-Dependent Glutamate Synthase Regulates Nitrogen–Carbon Metabolomes and Is Genetically Differentiated between Japonica and Indica Subspecies. Mol. Plant 2016, 9, 1520–1534. [Google Scholar] [CrossRef] [PubMed]
  64. Kumar, V.; Sharma, A.; Kaur, R.; Thukral, A.K.; Bhardwaj, R.; Ahmad, P. Differential Distribution of Amino Acids in Plants. Amino Acids 2017, 49, 821–869. [Google Scholar] [CrossRef] [PubMed]
  65. Tessari, P.; Lante, A.; Mosca, G. Essential Amino Acids: Master Regulators of Nutrition and Environmental Footprint? Sci. Rep. 2016, 6, 26074. [Google Scholar] [CrossRef] [PubMed]
  66. Deng, Y.; Lu, S. Biosynthesis and Regulation of Phenylpropanoids in Plants. Crit. Rev. Plant Sci. 2017, 36, 257–290. [Google Scholar] [CrossRef]
  67. Anzano, A.; Bonanomi, G.; Mazzoleni, S.; Lanzotti, V. Plant Metabolomics in Biotic and Abiotic Stress: A Critical Overview. Phytochem. Rev. 2022, 21, 503–524. [Google Scholar] [CrossRef]
  68. Perchlik, M.; Tegeder, M. Leaf Amino Acid Supply Affects Photosynthetic and Plant Nitrogen Use Efficiency under Nitrogen Stress. Plant Physiol. 2018, 178, 174–188. [Google Scholar] [CrossRef] [PubMed]
  69. Perchlik, M.; Tegeder, M. Improving Plant Nitrogen Use Efficiency through Alteration of Amino Acid Transport Processes. Plant Physiol. 2017, 175, 235–247. [Google Scholar] [CrossRef]
  70. Santiago, J.P.; Tegeder, M. Connecting Source with Sink: The Role of Arabidopsis AAP8 in Phloem Loading of Amino Acids. Plant Physiol. 2016, 171, 508–521. [Google Scholar] [CrossRef]
  71. Zhang, L.; Garneau, M.G.; Majumdar, R.; Grant, J.; Tegeder, M. Improvement of Pea Biomass and Seed Productivity by Simultaneous Increase of Phloem and Embryo Loading with Amino Acids. The Plant J. 2015, 81, 134–146. [Google Scholar] [CrossRef]
  72. Oliveira, I.C.; Brenner, E.; Chiu, J.; Hsieh, M.H.; Kouranov, A.; Lam, H.M.; Shin, M.J.; Coruzzi, G. Metabolite and Light Regulation of Metabolism in Plants: Lessons from the Study of a Single Biochemical Pathway. Braz. J. Med. Biol. Res. 2001, 34, 567–575. [Google Scholar] [CrossRef] [PubMed]
  73. Kinnersley, A.M.; Turano, F.J. Gamma Aminobutyric Acid (GABA) and Plant Responses to Stress. Crit. Rev. Plant Sci. 2000, 19, 479–509. [Google Scholar] [CrossRef]
  74. Bown, A.W.; Shelp, B.J. Plant GABA: Not Just a Metabolite. Trends Plant Sci. 2016, 21, 811–813. [Google Scholar] [CrossRef] [PubMed]
  75. Alcázar, R.; Planas, J.; Saxena, T.; Zarza, X.; Bortolotti, C.; Cuevas, J.; Bitrián, M.; Tiburcio, A.F.; Altabella, T. Putrescine Accumulation Confers Drought Tolerance in Transgenic Arabidopsis Plants Over-Expressing the Homologous Arginine Decarboxylase 2 Gene. Plant Physiol. Biochem. 2010, 48, 547–552. [Google Scholar] [CrossRef]
  76. Yang, X.; Feng, L.; Zhao, L.; Liu, X.; Hassani, D.; Huang, D. Effect of Glycine Nitrogen on Lettuce Growth under Soilless Culture: A Metabolomics Approach to Identify the Main Changes Occurred in Plant Primary and Secondary Metabolism. J. Sci. Food Agric. 2018, 98, 467–477. [Google Scholar] [CrossRef] [PubMed]
  77. Luna, M.C.; Tudela, J.A.; Tomás-Barberán, F.A.; Gil, M.I. Modified Atmosphere (MA) Prevents Browning of Fresh-Cut Romaine Lettuce through Multi-Target Effects Related to Phenolic Metabolism. Postharvest Biol. Technol. 2016, 119, 84–93. [Google Scholar] [CrossRef]
  78. Beatty, P.H.; Klein, M.S.; Fischer, J.J.; Lewis, I.A.; Muench, D.G.; Good, A.G. Understanding Plant Nitrogen Metabolism through Metabolomics and Computational Approaches. Plants 2016, 5, 39. [Google Scholar] [CrossRef]
  79. Xu, Y.; Zeng, X.; Wu, J.; Zhang, F.; Li, C.; Jiang, J.; Wang, Y.; Sun, W. ITRAQ-Based Quantitative Proteome Revealed Metabolic Changes in Winter Turnip Rape (Brassica rapa L.) under Cold Stress. Int. J. Mol. Sci. 2018, 19, 3346. [Google Scholar] [CrossRef]
  80. Neto, J.C.R.; Vieira, L.R.; de Aquino Ribeiro, J.A.; de Sousa, C.A.F.; Júnior, M.T.S.; Abdelnur, P.V. Metabolic Effect of Drought Stress on the Leaves of Young Oil Palm (Elaeis guineensis) Plants Using UHPLC–MS and Multivariate Analysis. Sci. Rep. 2021, 11, 18271. [Google Scholar] [CrossRef]
Figure 1. Venn diagram of differentially regulated metabolites in the shoot tissues of two barley genotypes (XZ16 and Hua30). (A) Up-regulated metabolites and (B) down-regulated metabolites.
Agronomy 14 00621 g001
Figure 2. Principal component analysis (PCA) of metabolites in XZ16 and Hua30 under four different nitrogen fertilizer treatments. PC1: 1st principal component; PC2: 2nd principal component.
Agronomy 14 00621 g002
Figure 3. Partial least square discriminate analysis (PLSDA) of metabolites in shoot tissues under control (A). Ammonium (B), urea (C), and glycine (D) along with VIP score contributing to the classification of genotypes.
Agronomy 14 00621 g003
Figure 4. Hierarchical clustering analysis of significant differentially regulated metabolites (DRMs) and the metabolomics map of the significant metabolic pathways of the shoot tissues of XZ16 and Hua30 under different treatments with nitrogen fertilizers. Relative metabolites levels are shown based on color scale. Red indicates up-regulation, and blue represents down-regulation.
Agronomy 14 00621 g004
Figure 5. Variations in the metabolites mapped on the metabolic pathways in the shoot tissues of XZ16 and Hua30. Metabolites in green are the identified metabolites in this study. Fold changes in metabolites in red show significant up-regulation (p ≤ 0.05 and fold change > 1), and those in blue indicate significant down-regulation (p ≤ 0.05; fold change < 1) in comparison with the normalized metabolites level under different forms of nitrogen treatment and control; those shown in white indicate non-significant changes. KEGG database (http://www.genome.jp/kegg/ (accessed on 16 January 2024)) was used for the construction of metabolic pathways.
Agronomy 14 00621 g005
Table 1. Analysis of element contents in the shoot tissues of wild and cultivated barley genotypes with different N fertilizers.
GenotypeTreatmentsKCaMgPSZnMnFeCu
mg g−1 DWmg kg−1 DW
XZ16NO355.75 b7.98 ab13.46 a13.10 a7.35 a2.30 a0.63 b2.84 a0.110 a
NH4+46.82 d6.19 d10.18 de9.94 c6.09 cd1.79 bc0.42 de2.03 de0.087 b
Urea58.48 a8.27 a12.51 b13.20 a7.11 ab2.03 ab0.73 a2.51 b0.093 ab
Gly50.27 c6.42 cd11.03 c9.54 c6.55 bc2.16 ab0.53 c2.32 bc0.087 b
Hua30NO346.27 de7.15 bc10.62 cd10.88 b6.51 bcd1.33 cd0.43 de2.20 cd0.087 b
NH4+40.68 f6.08 d8.44 f7.33 d5.87 d1.21 d0.34 ef1.83 ef0.073 bc
Urea44.03 e6.58 cd9.47 e11.08 b6.77 ab1.46 cd0.46 cd1.84 ef0.083 bc
Gly34.28 g4.55 e7.39 g5.48 e5.03 e1.17 d0.25 f1.57 f0.063 c
Interaction (N × G)********ns**ns
LSD(0.05) values2.65900.83770.78250.82290.66830.46760.0950.28220.0223
Different letters within a column show significant difference (p < 0.05). * (0.05), ** (0.01), and *** (0.001), ns: non-significant.
Disclaimer/Publisher’s Note: The statements, opinions and data contained in all publications are solely those of the individual author(s) and contributor(s) and not of MDPI and/or the editor(s). MDPI and/or the editor(s) disclaim responsibility for any injury to people or property resulting from any ideas, methods, instructions or products referred to in the content.

