
A Greener Approach to Spinach Farming: Drip Nutrigation with Biogas Slurry Digestate

 , ,
, ,
Abstract
:1. Introduction
2. Materials and Methods
2.1. Experiment Location
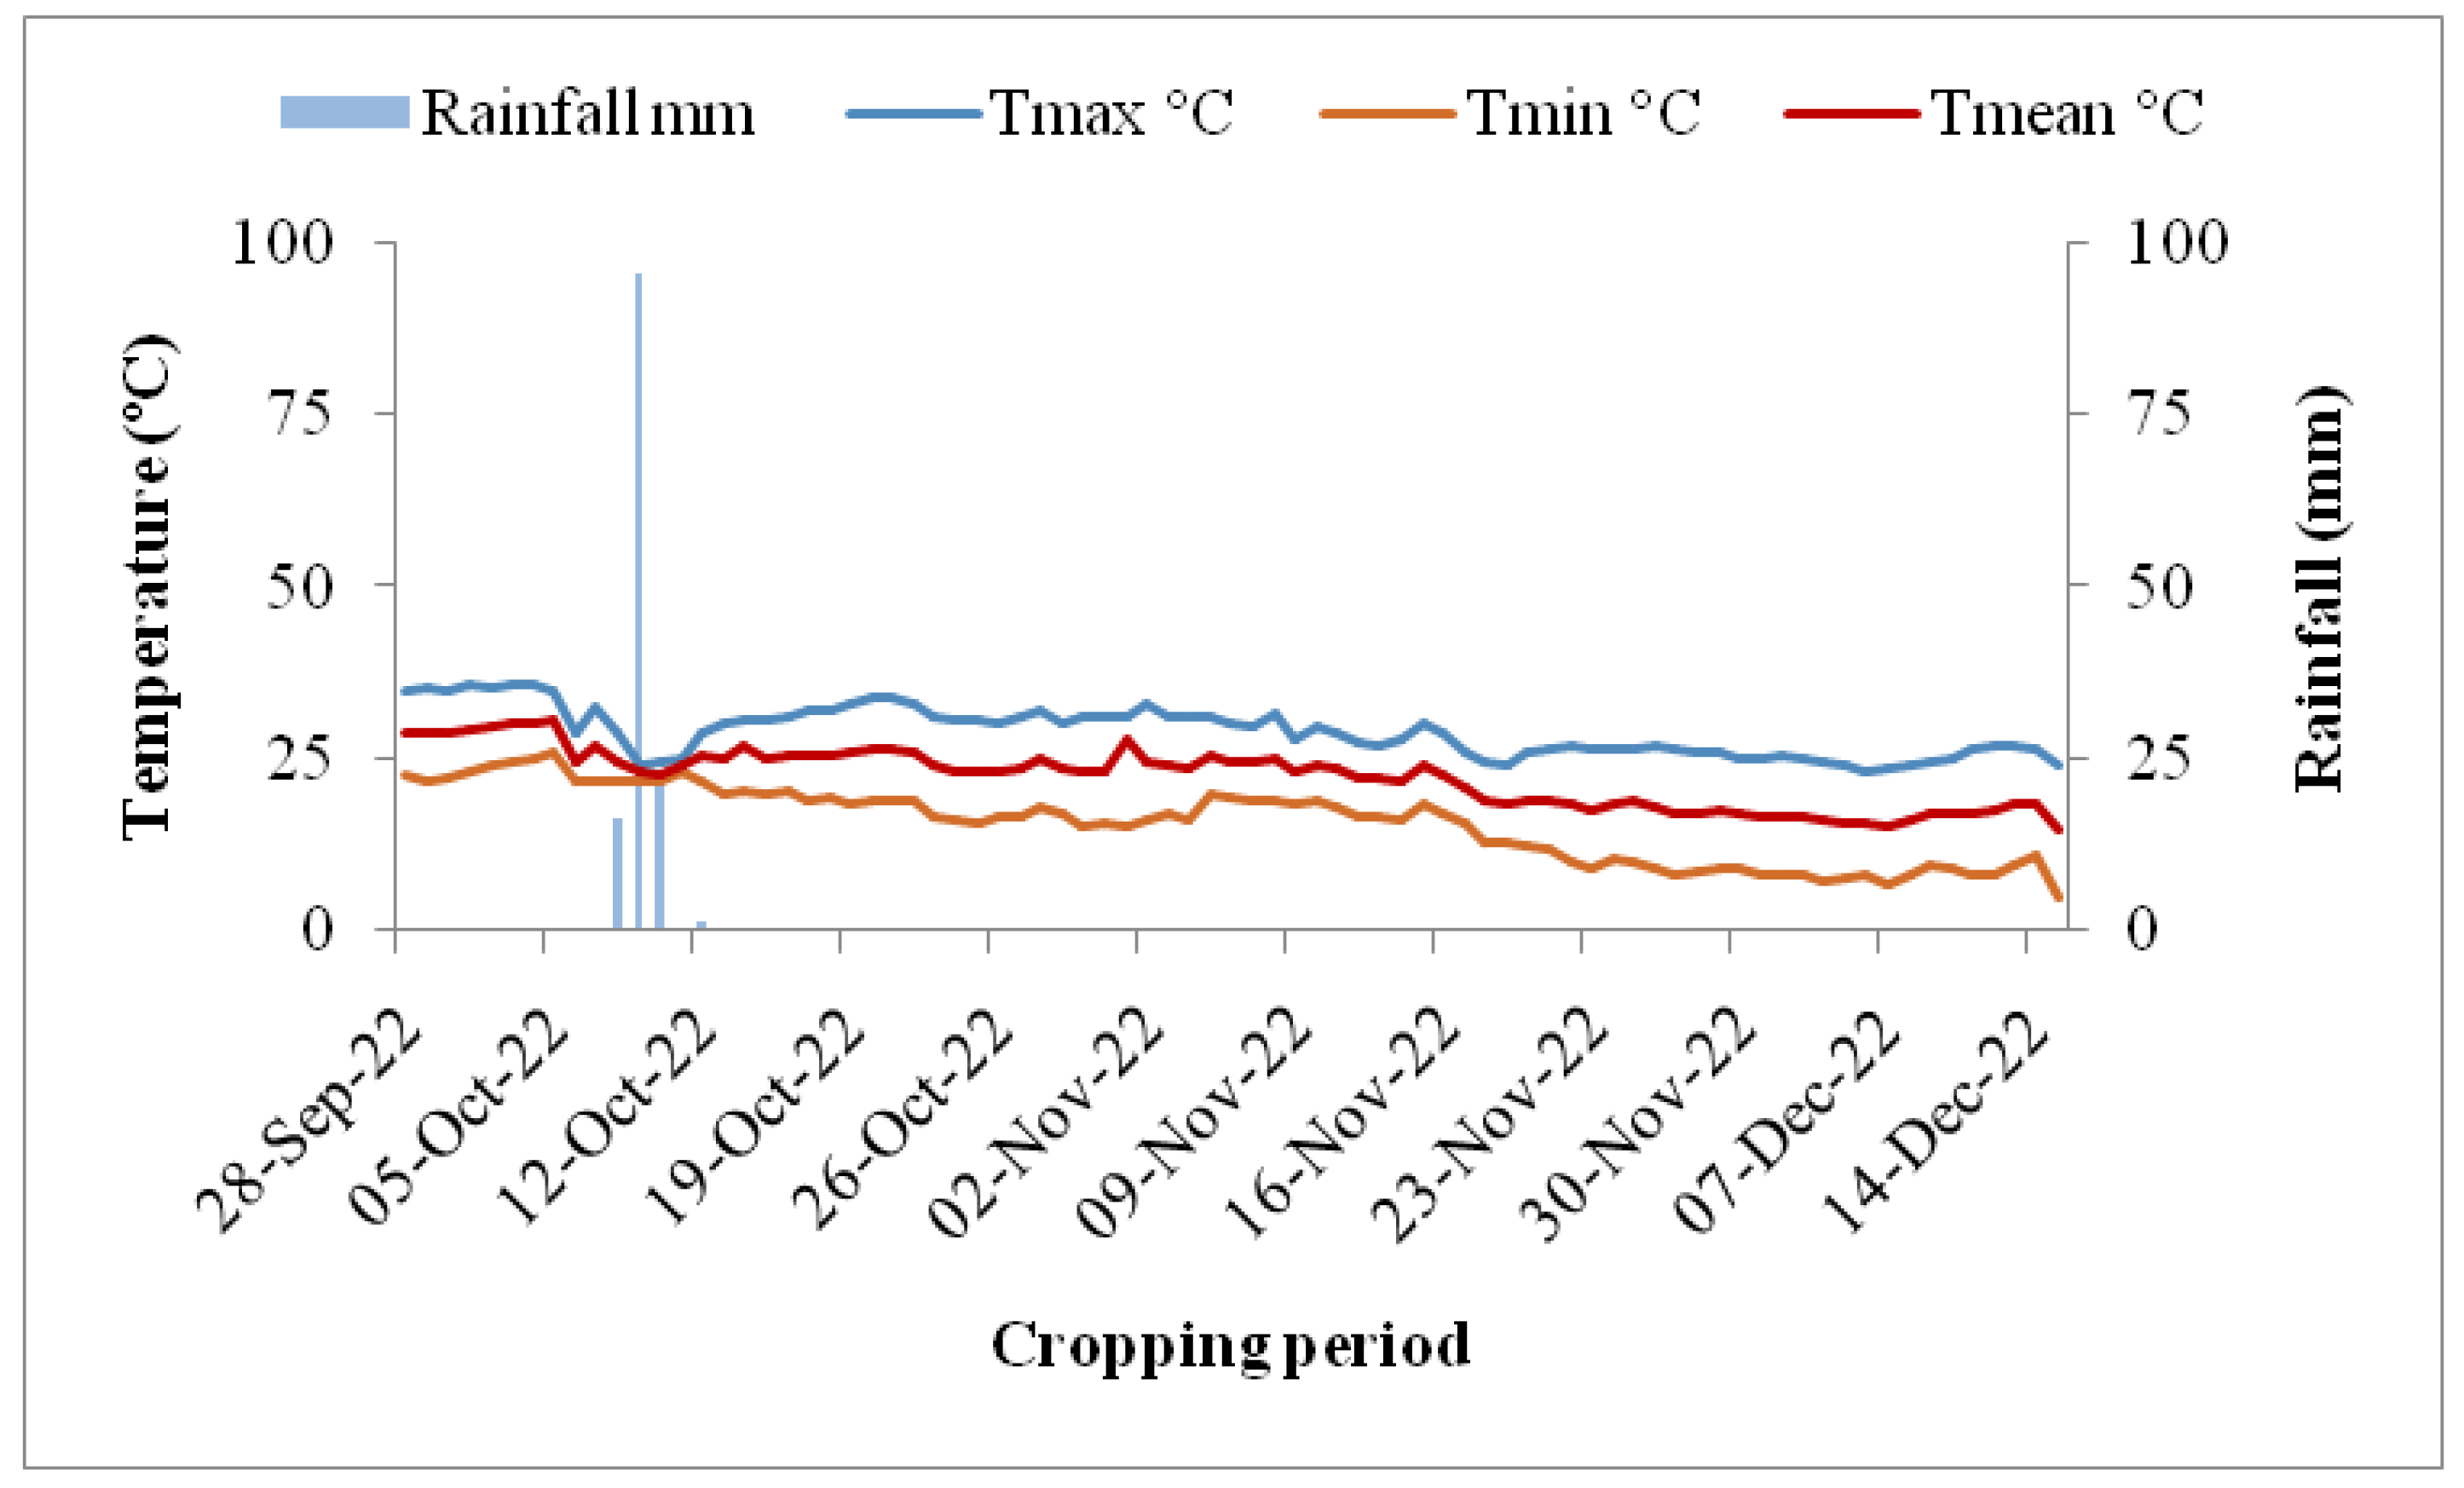
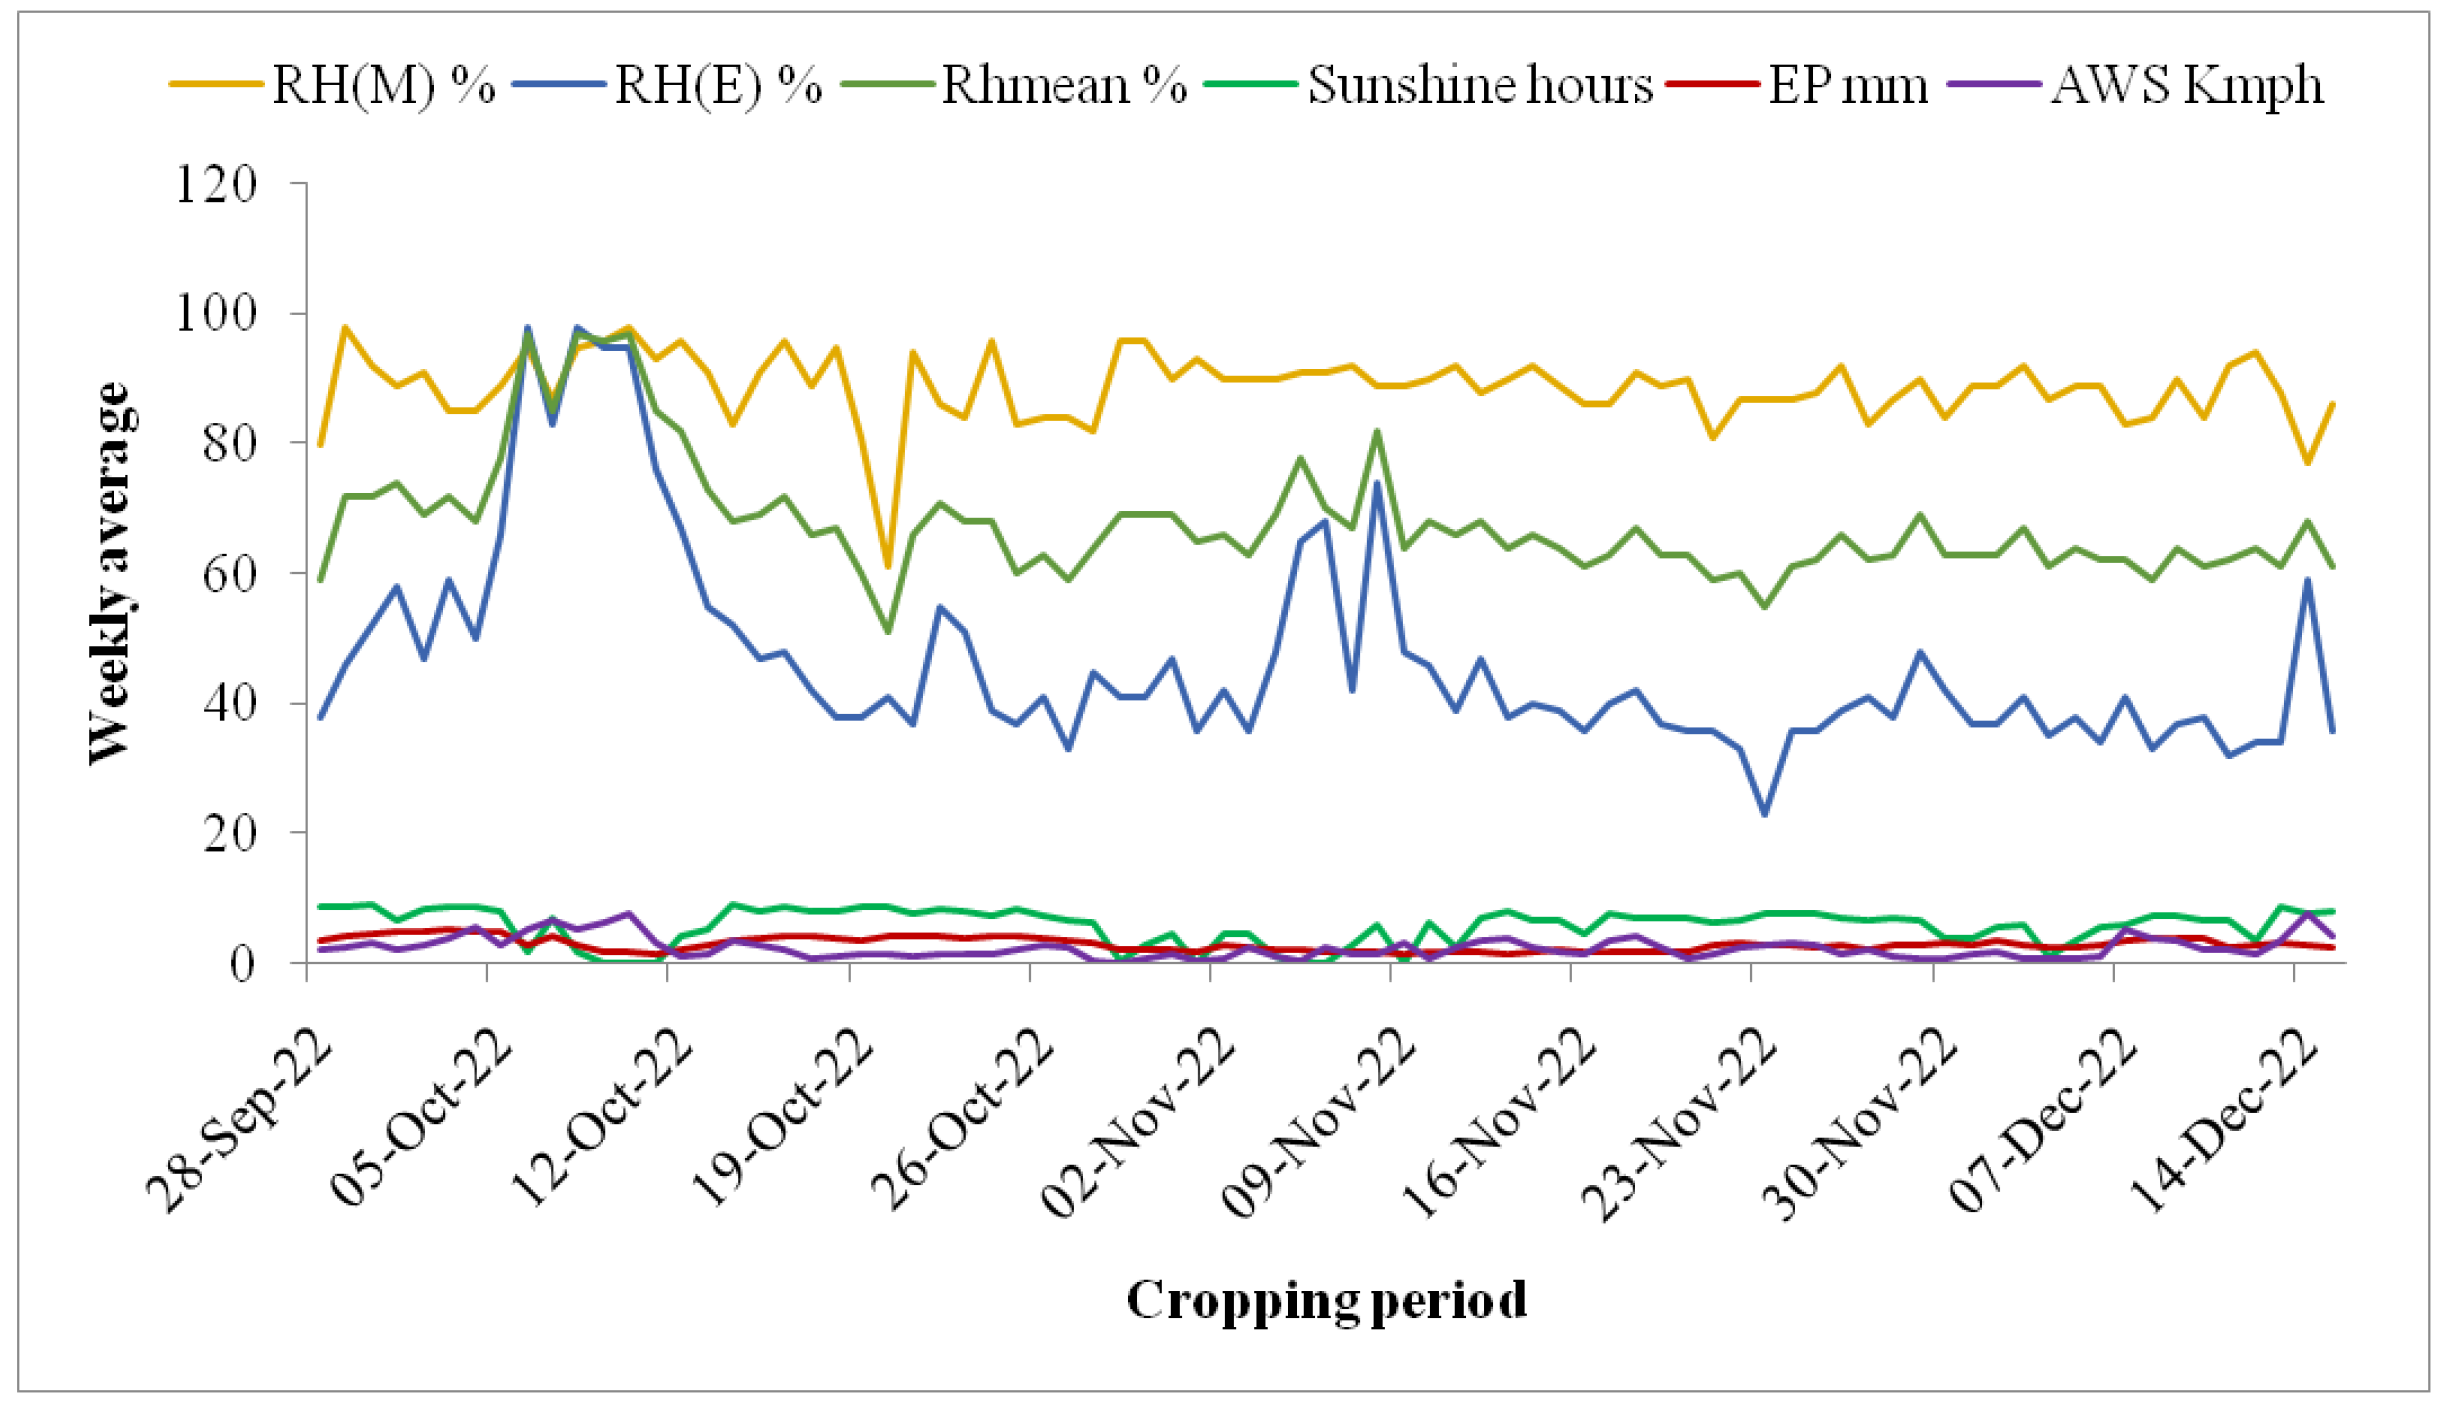
2.2. Weather Conditions
2.3. Experimental Design
2.4. Sampling and Analysis
2.5. Agronomical Analysis
2.6. Microbiological Analysis
2.7. Statistical Analysis
3. Results
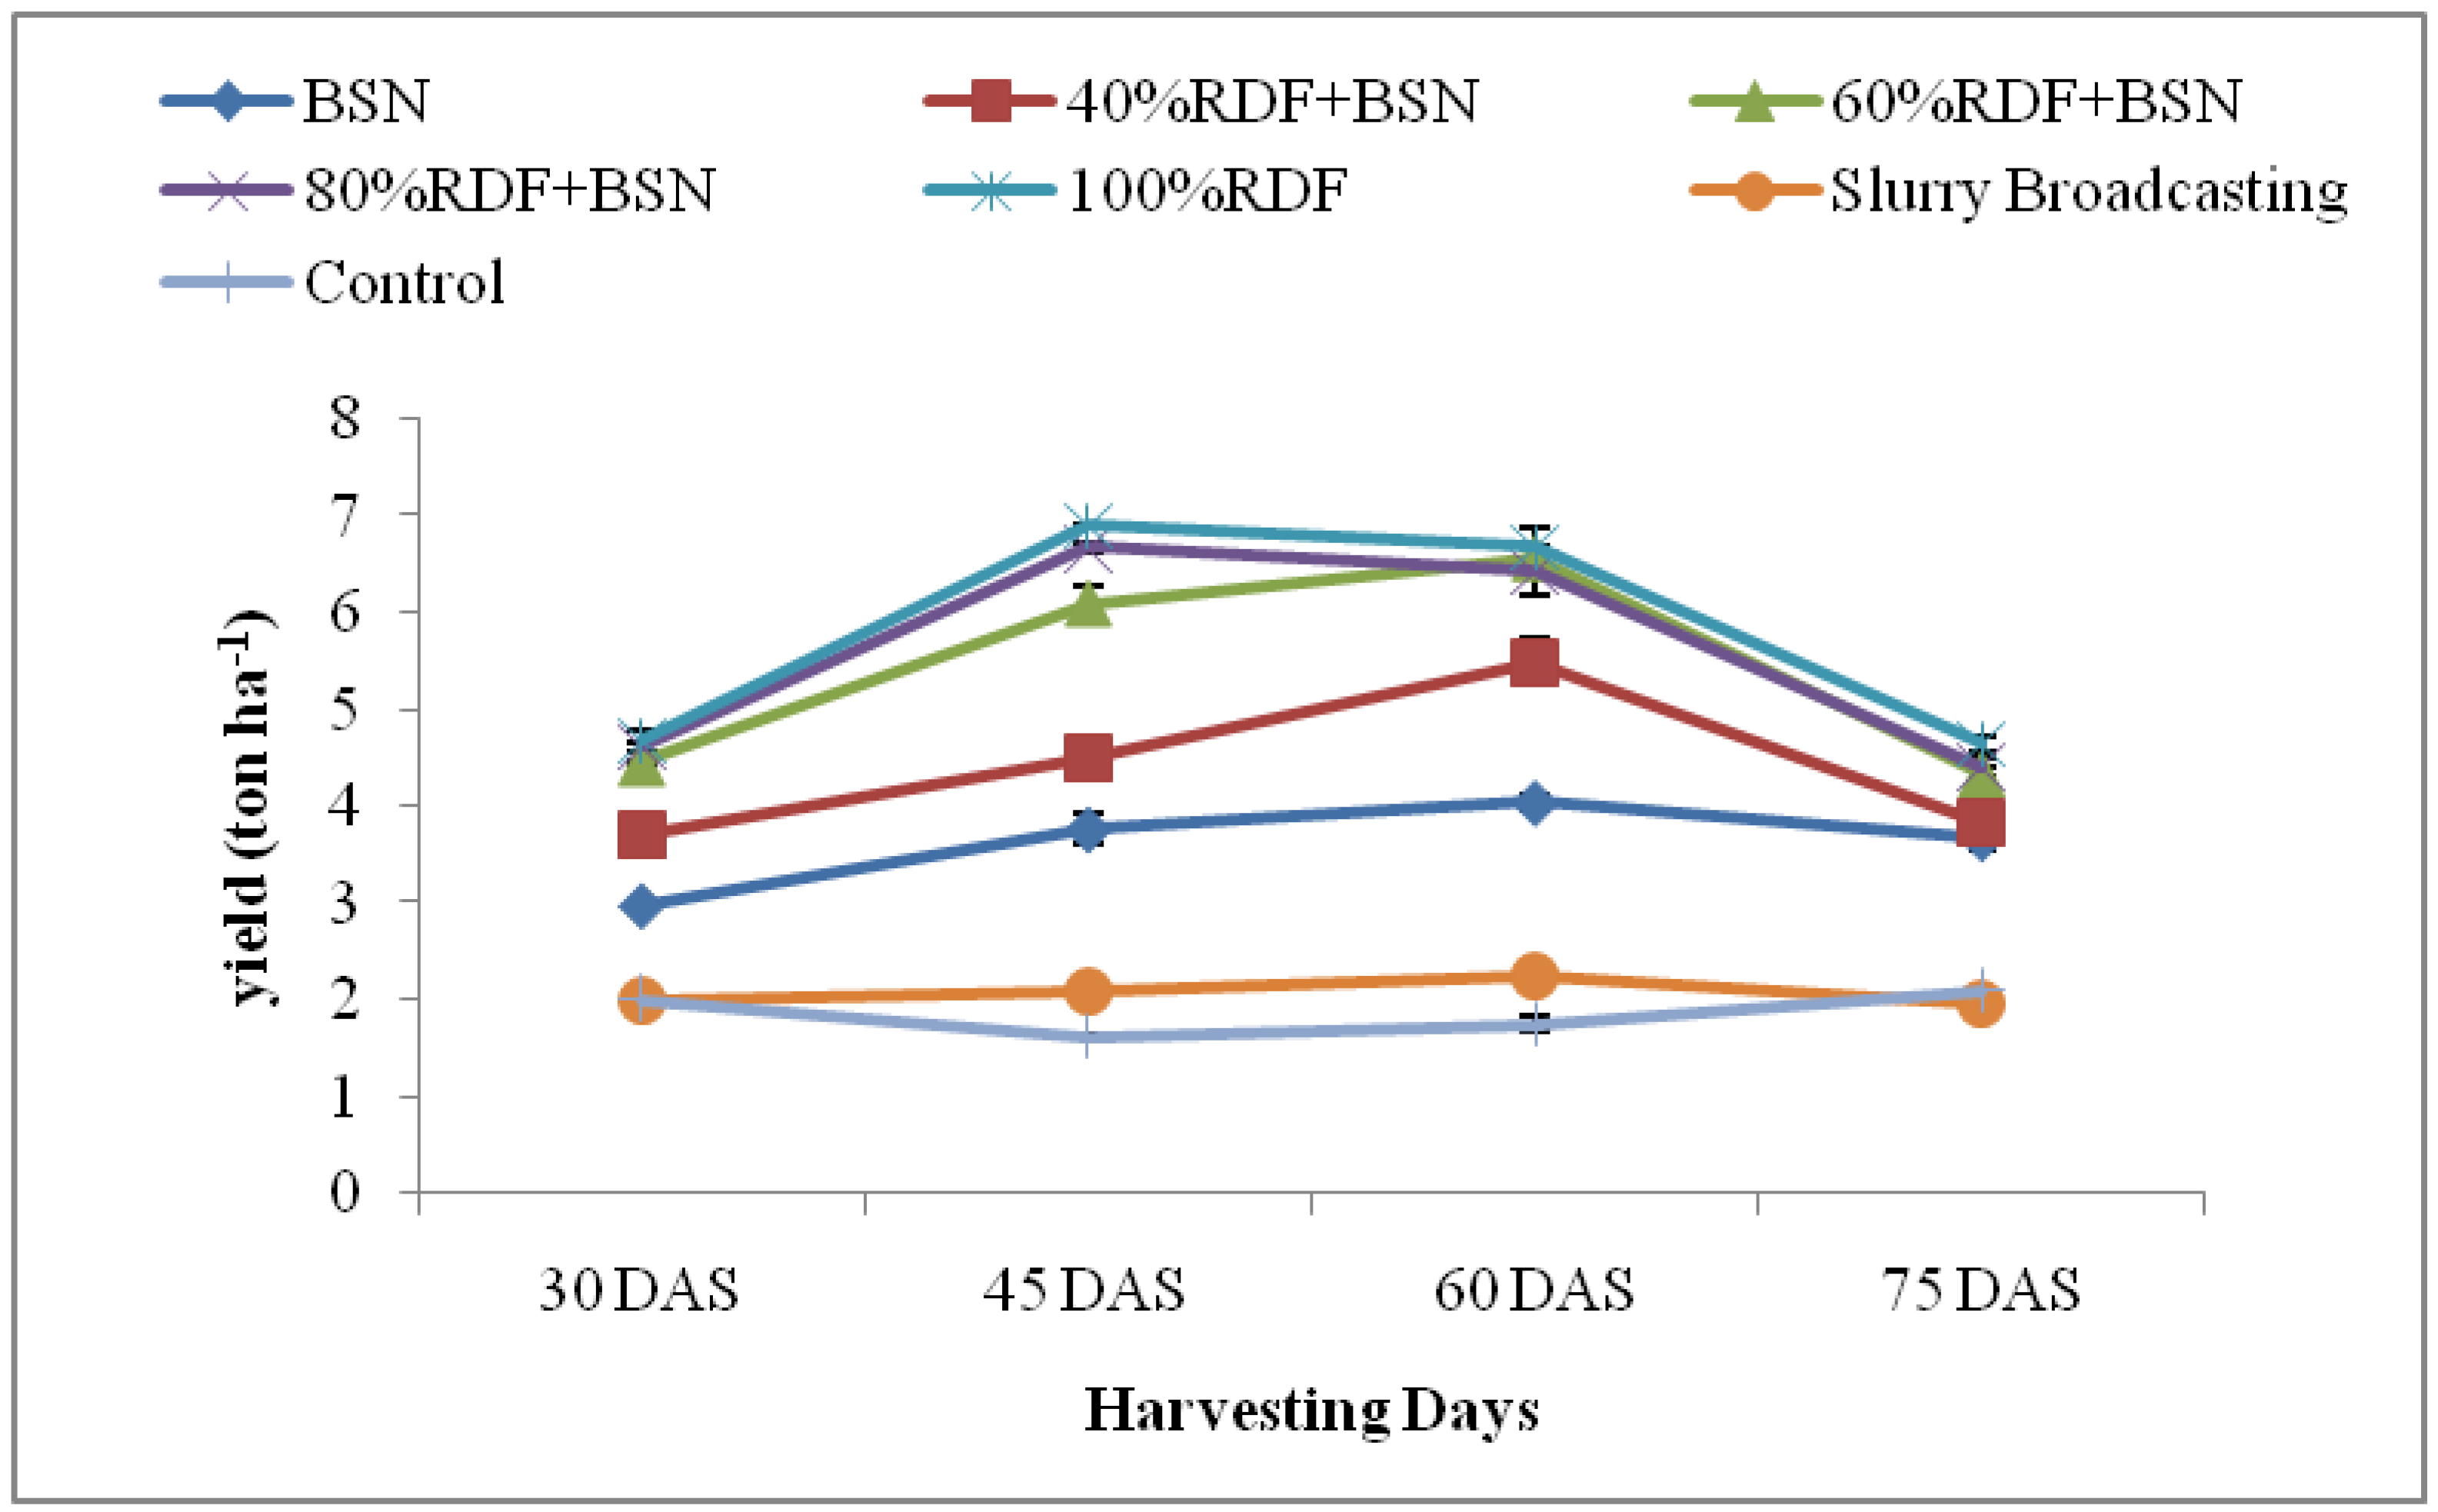
3.1. Spinach Growth
3.1.1. Plant Height
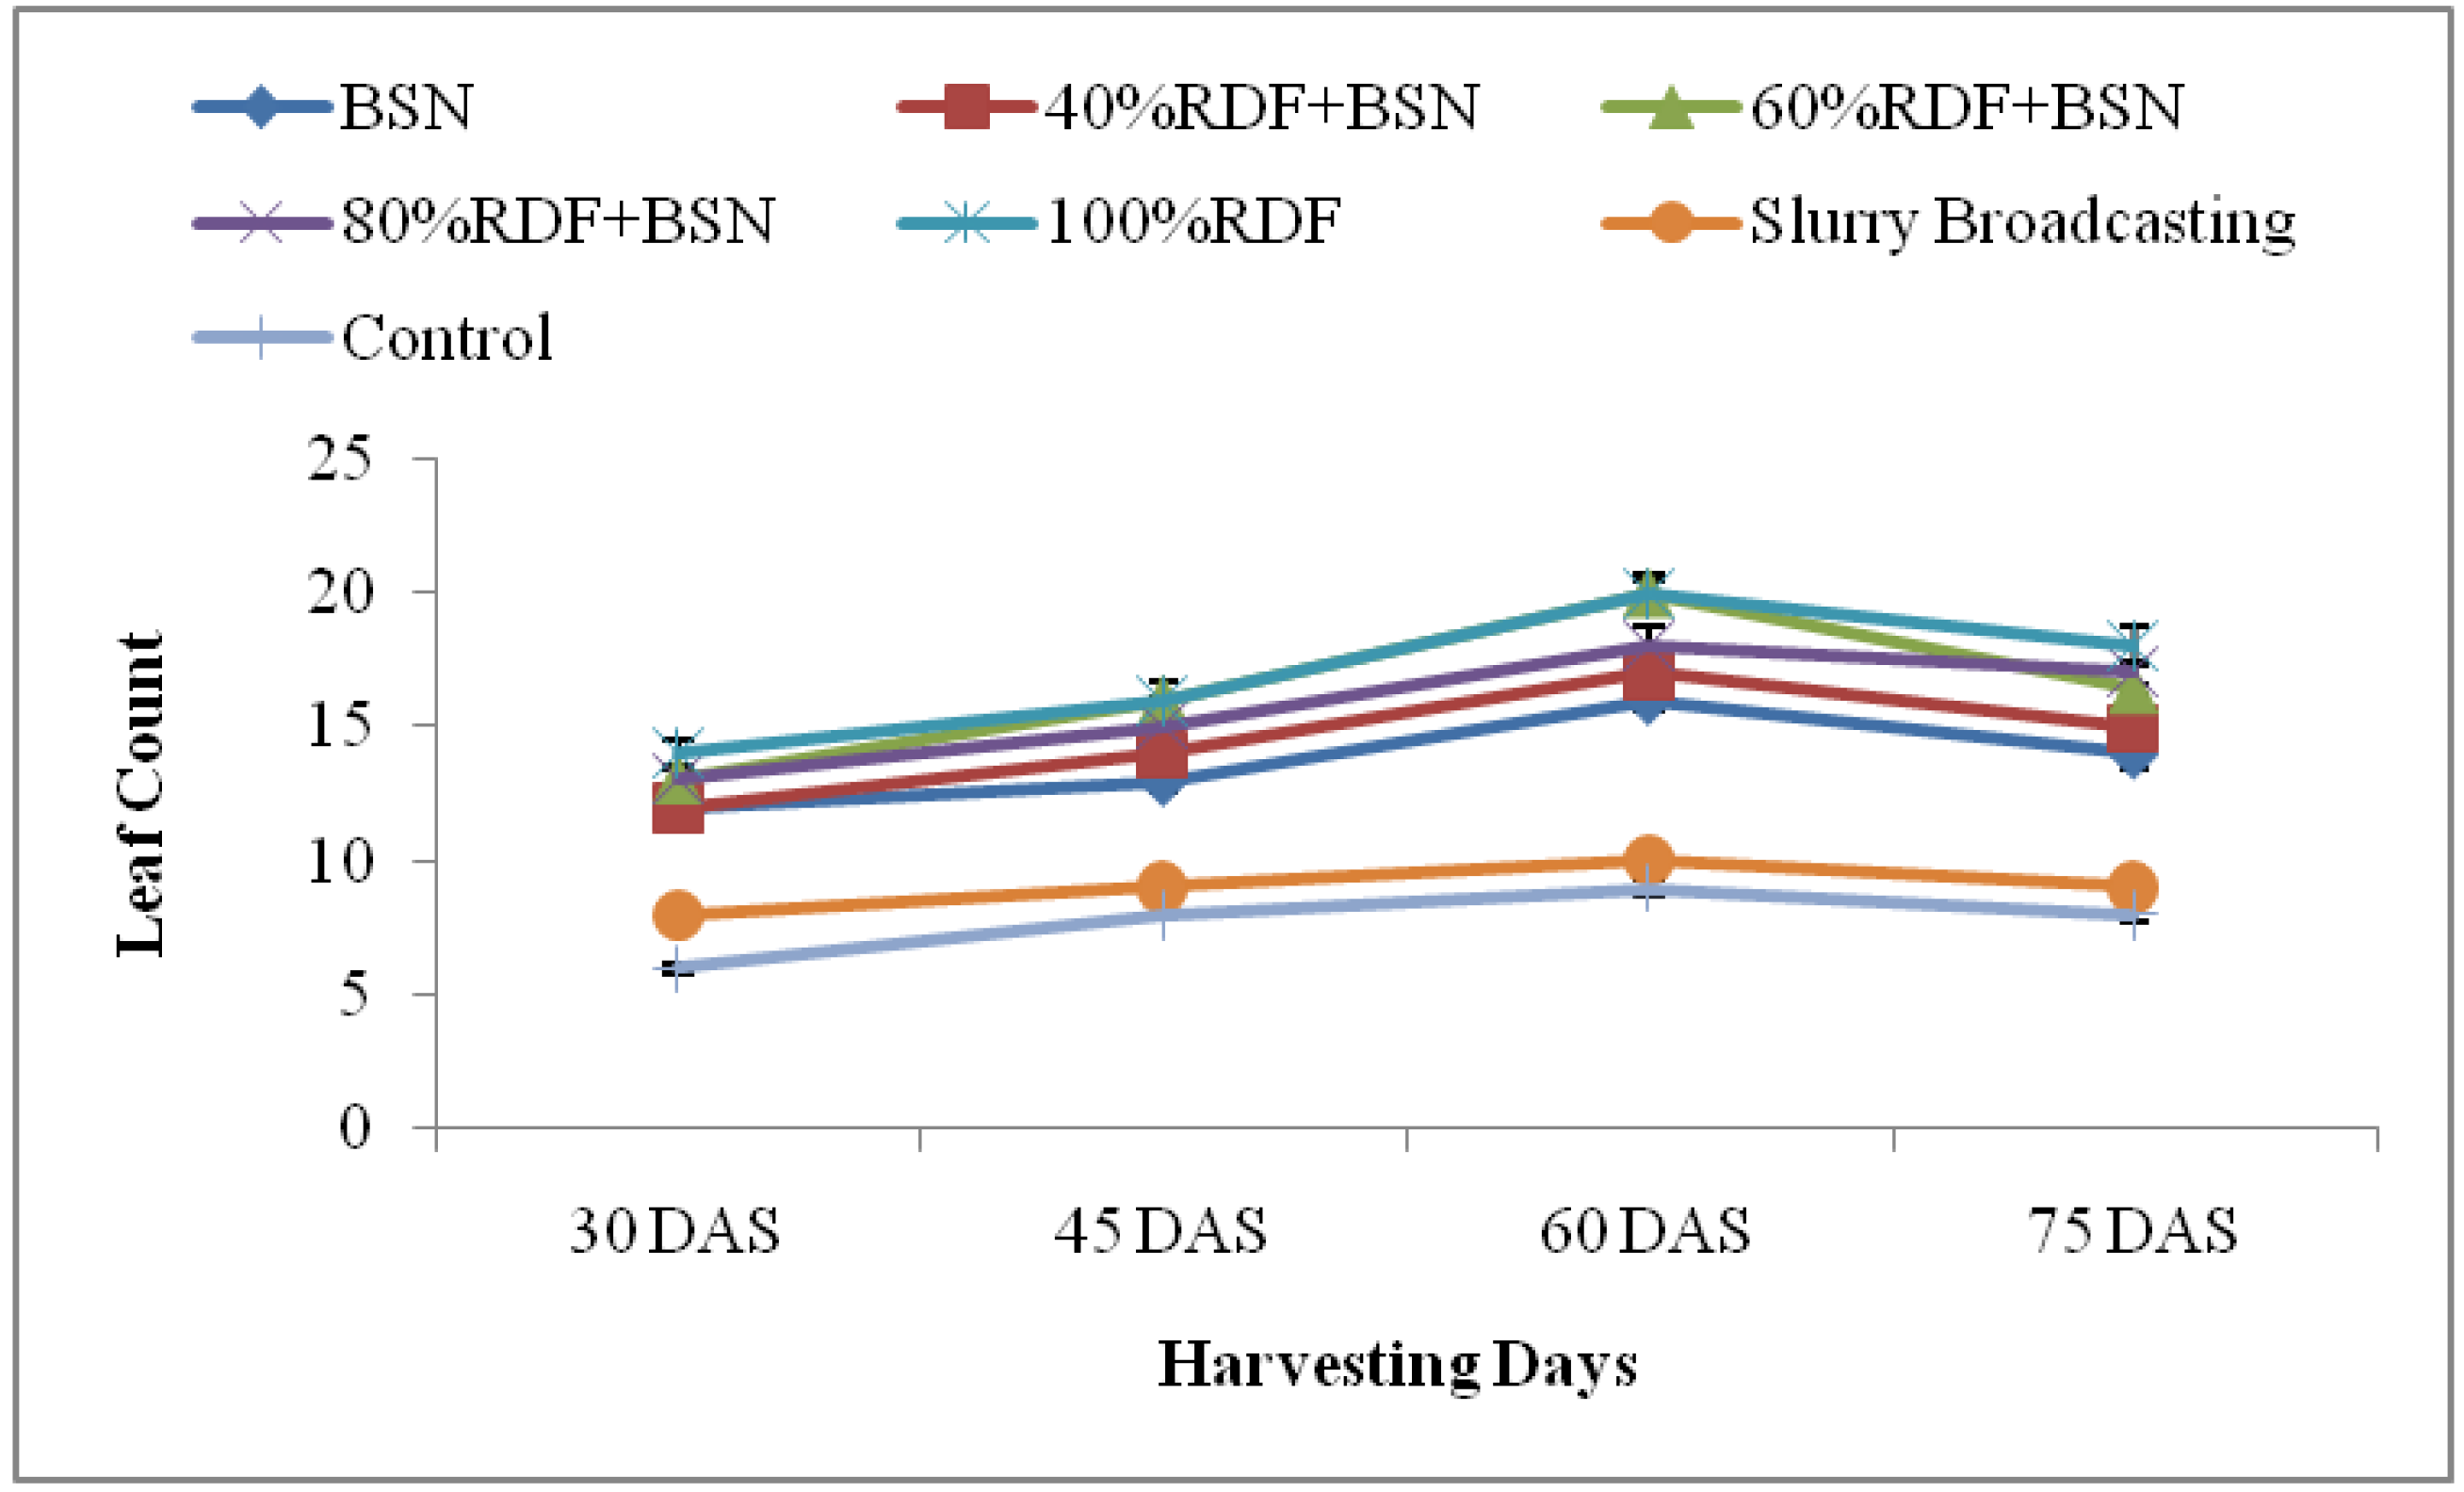
3.1.2. Leaf Count
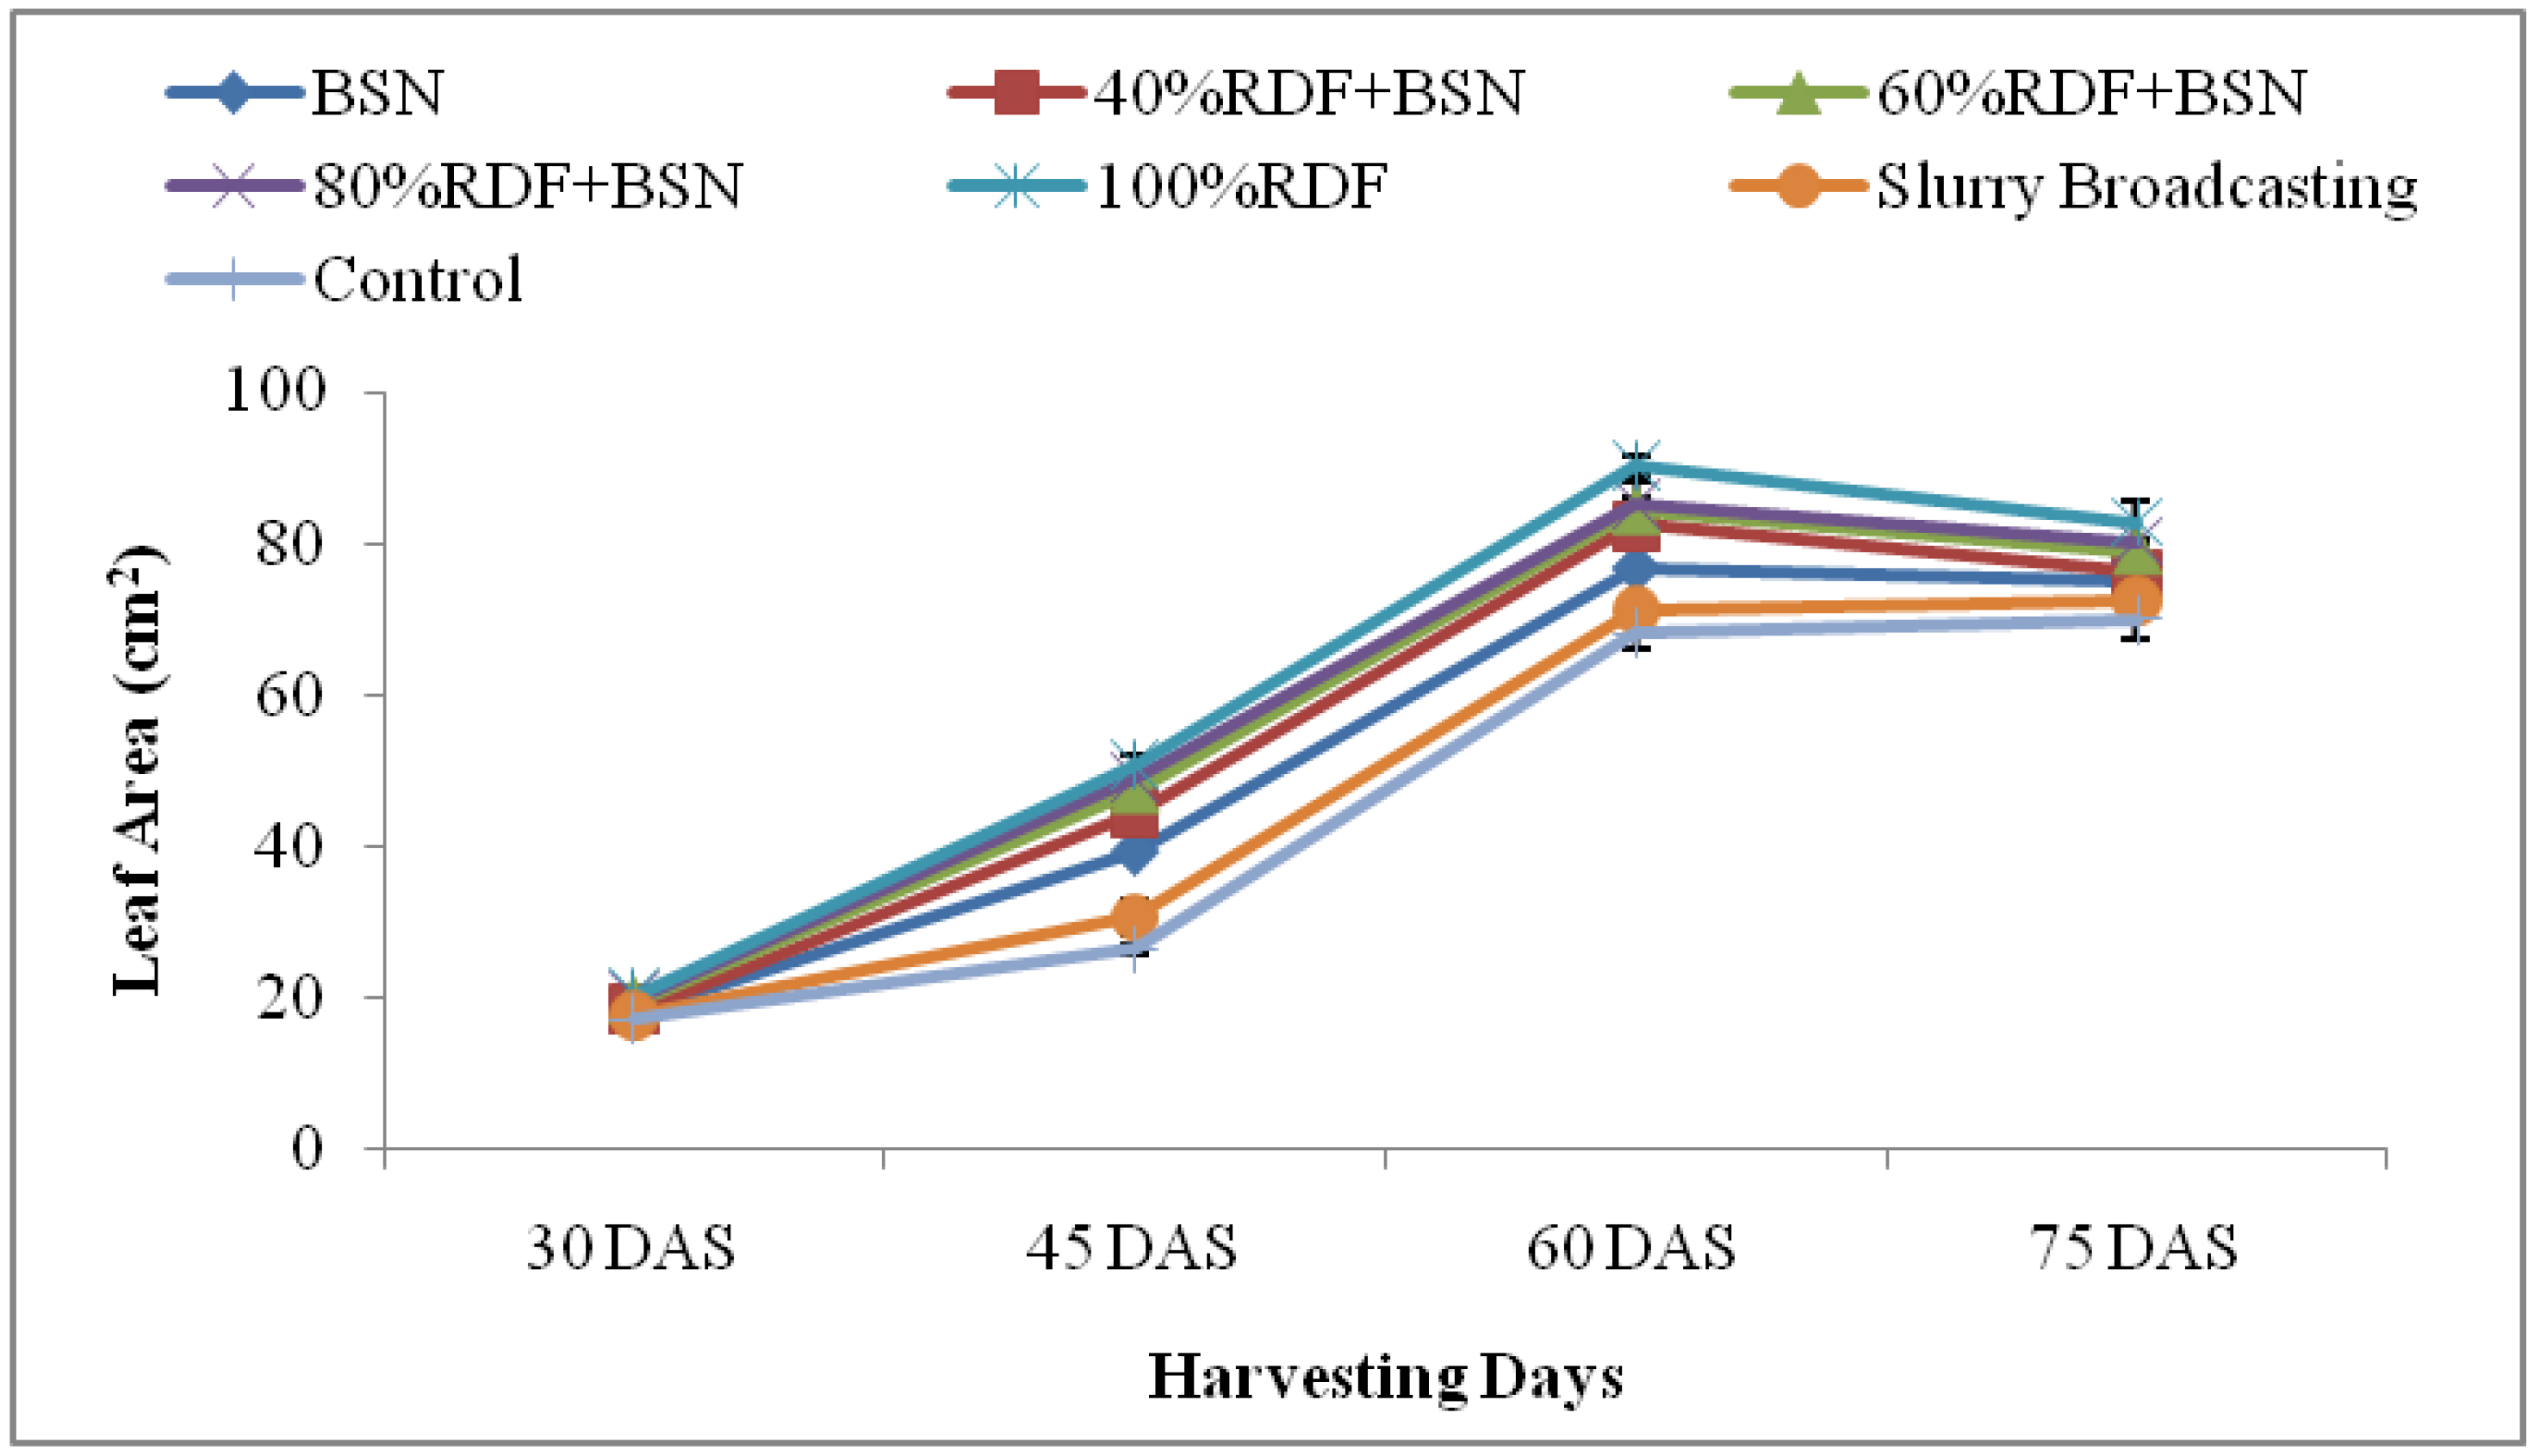
3.1.3. Leaf Area
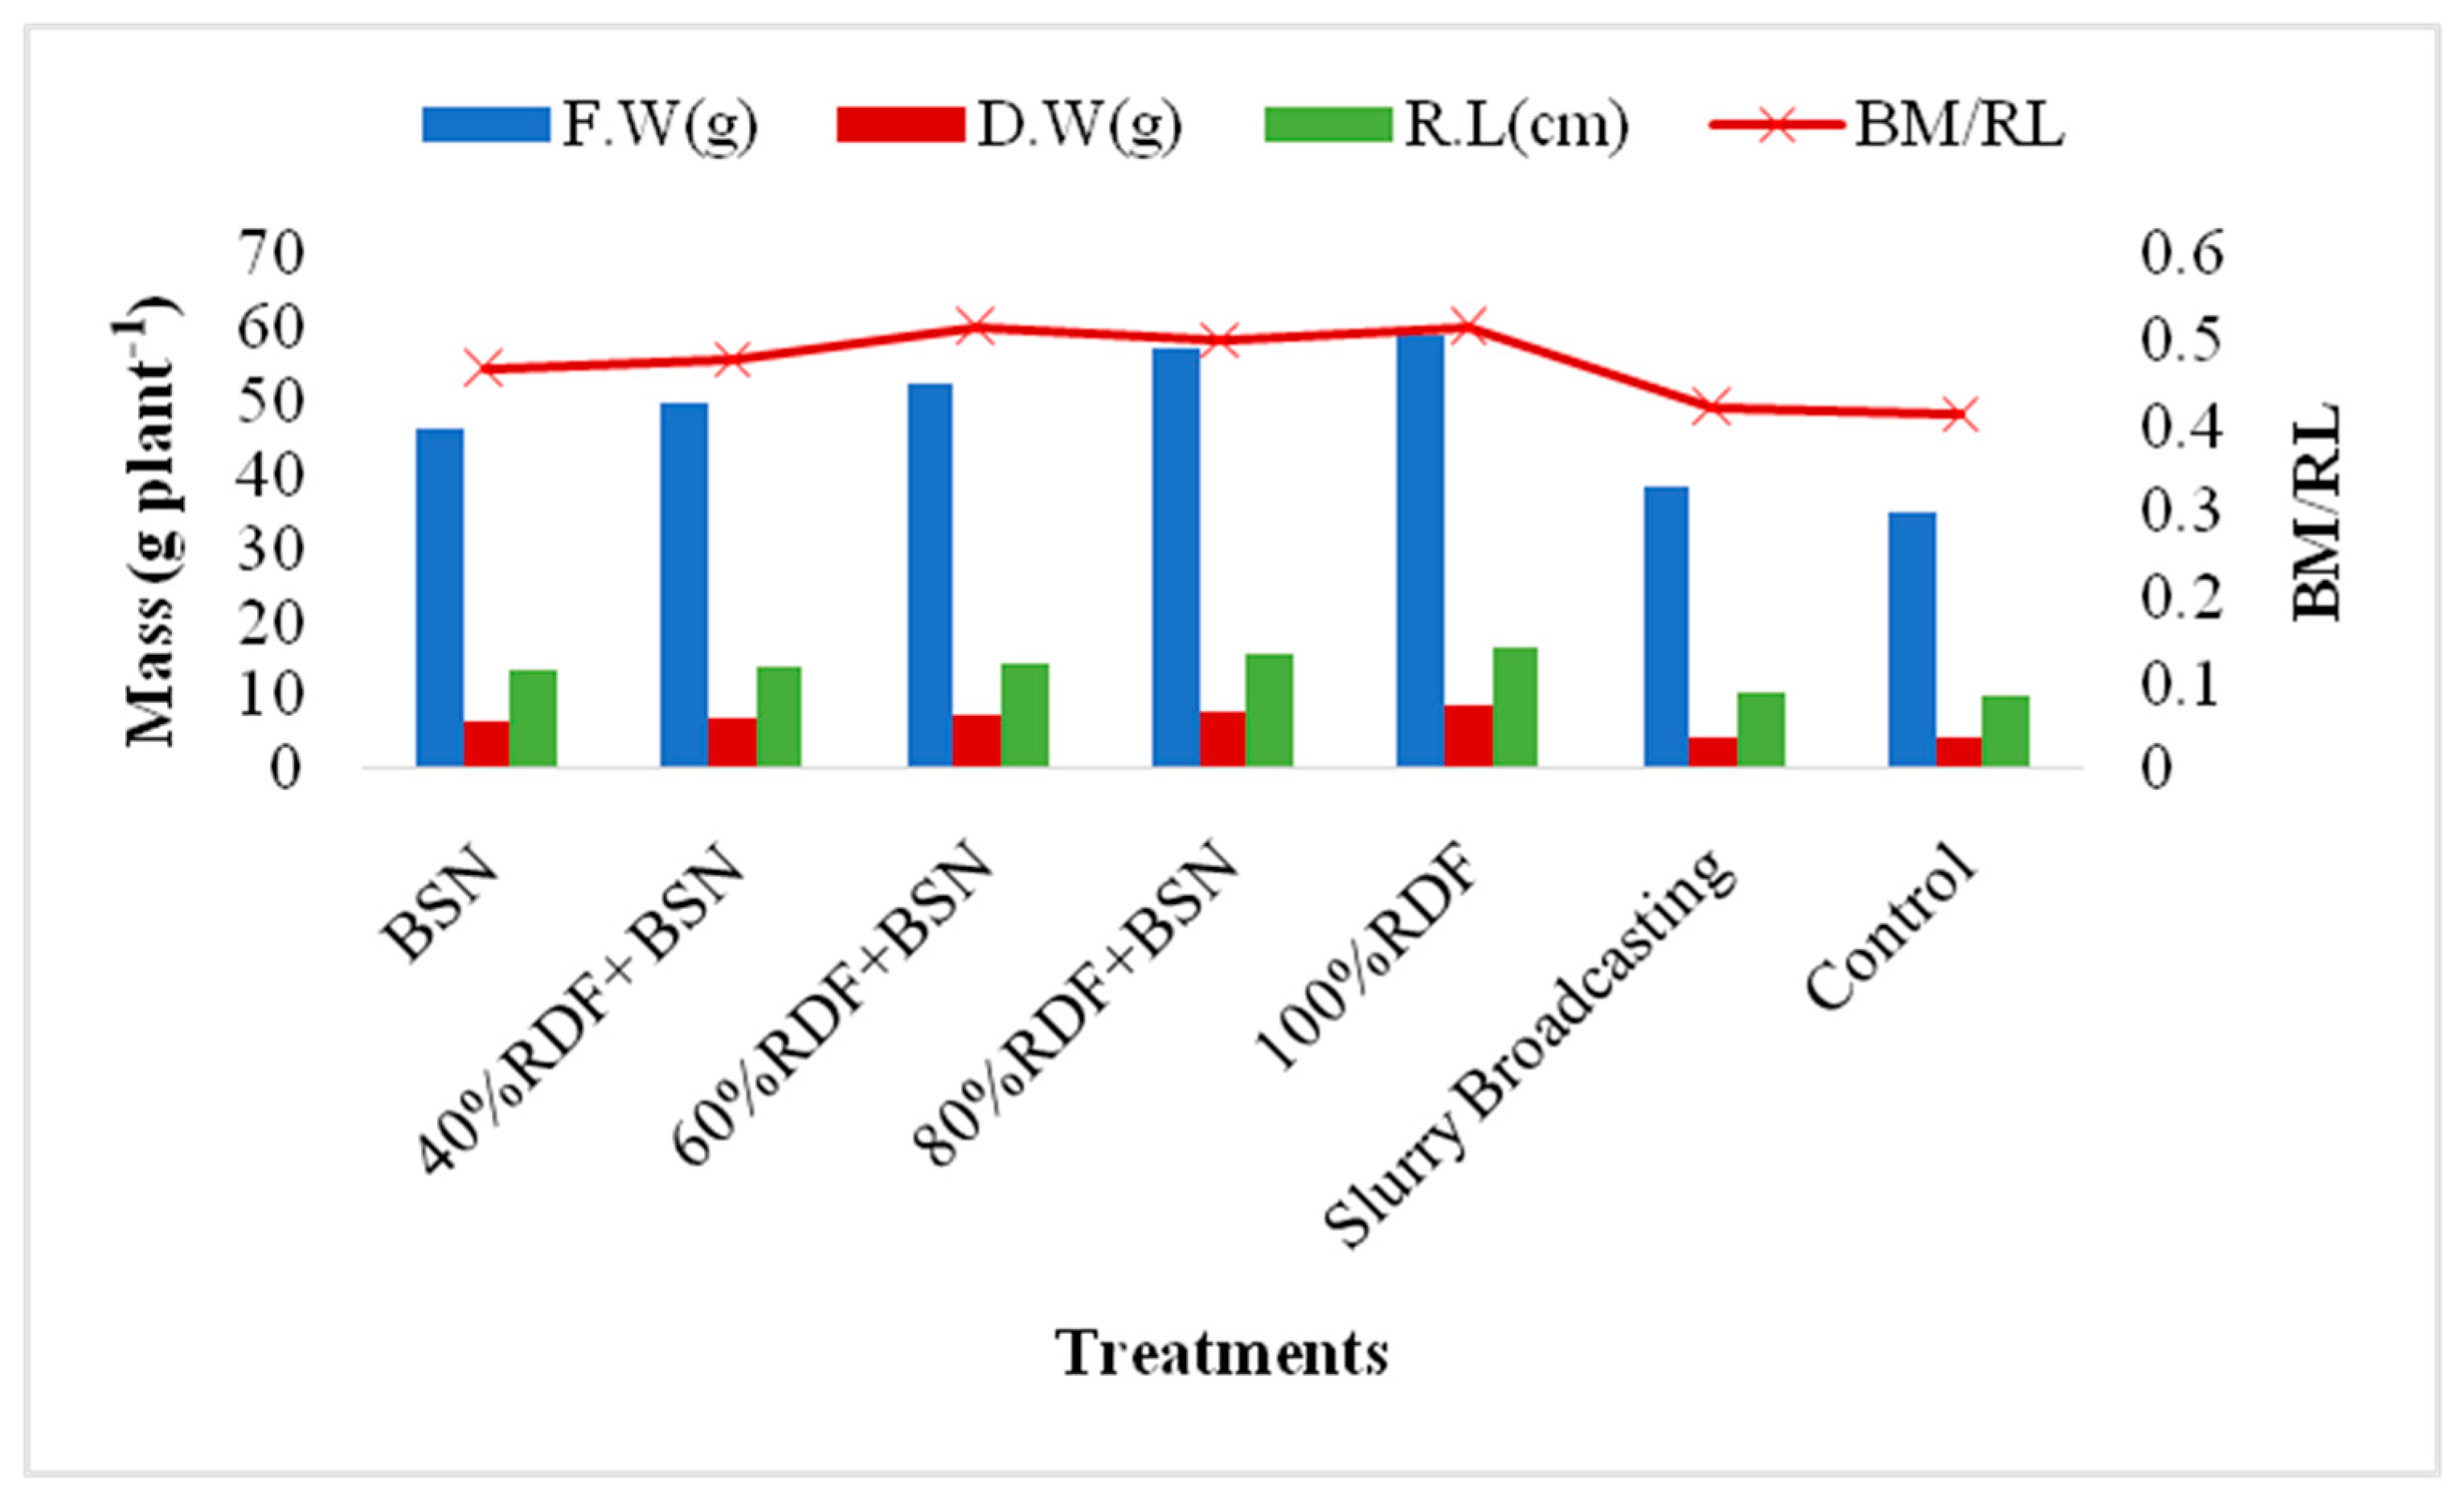
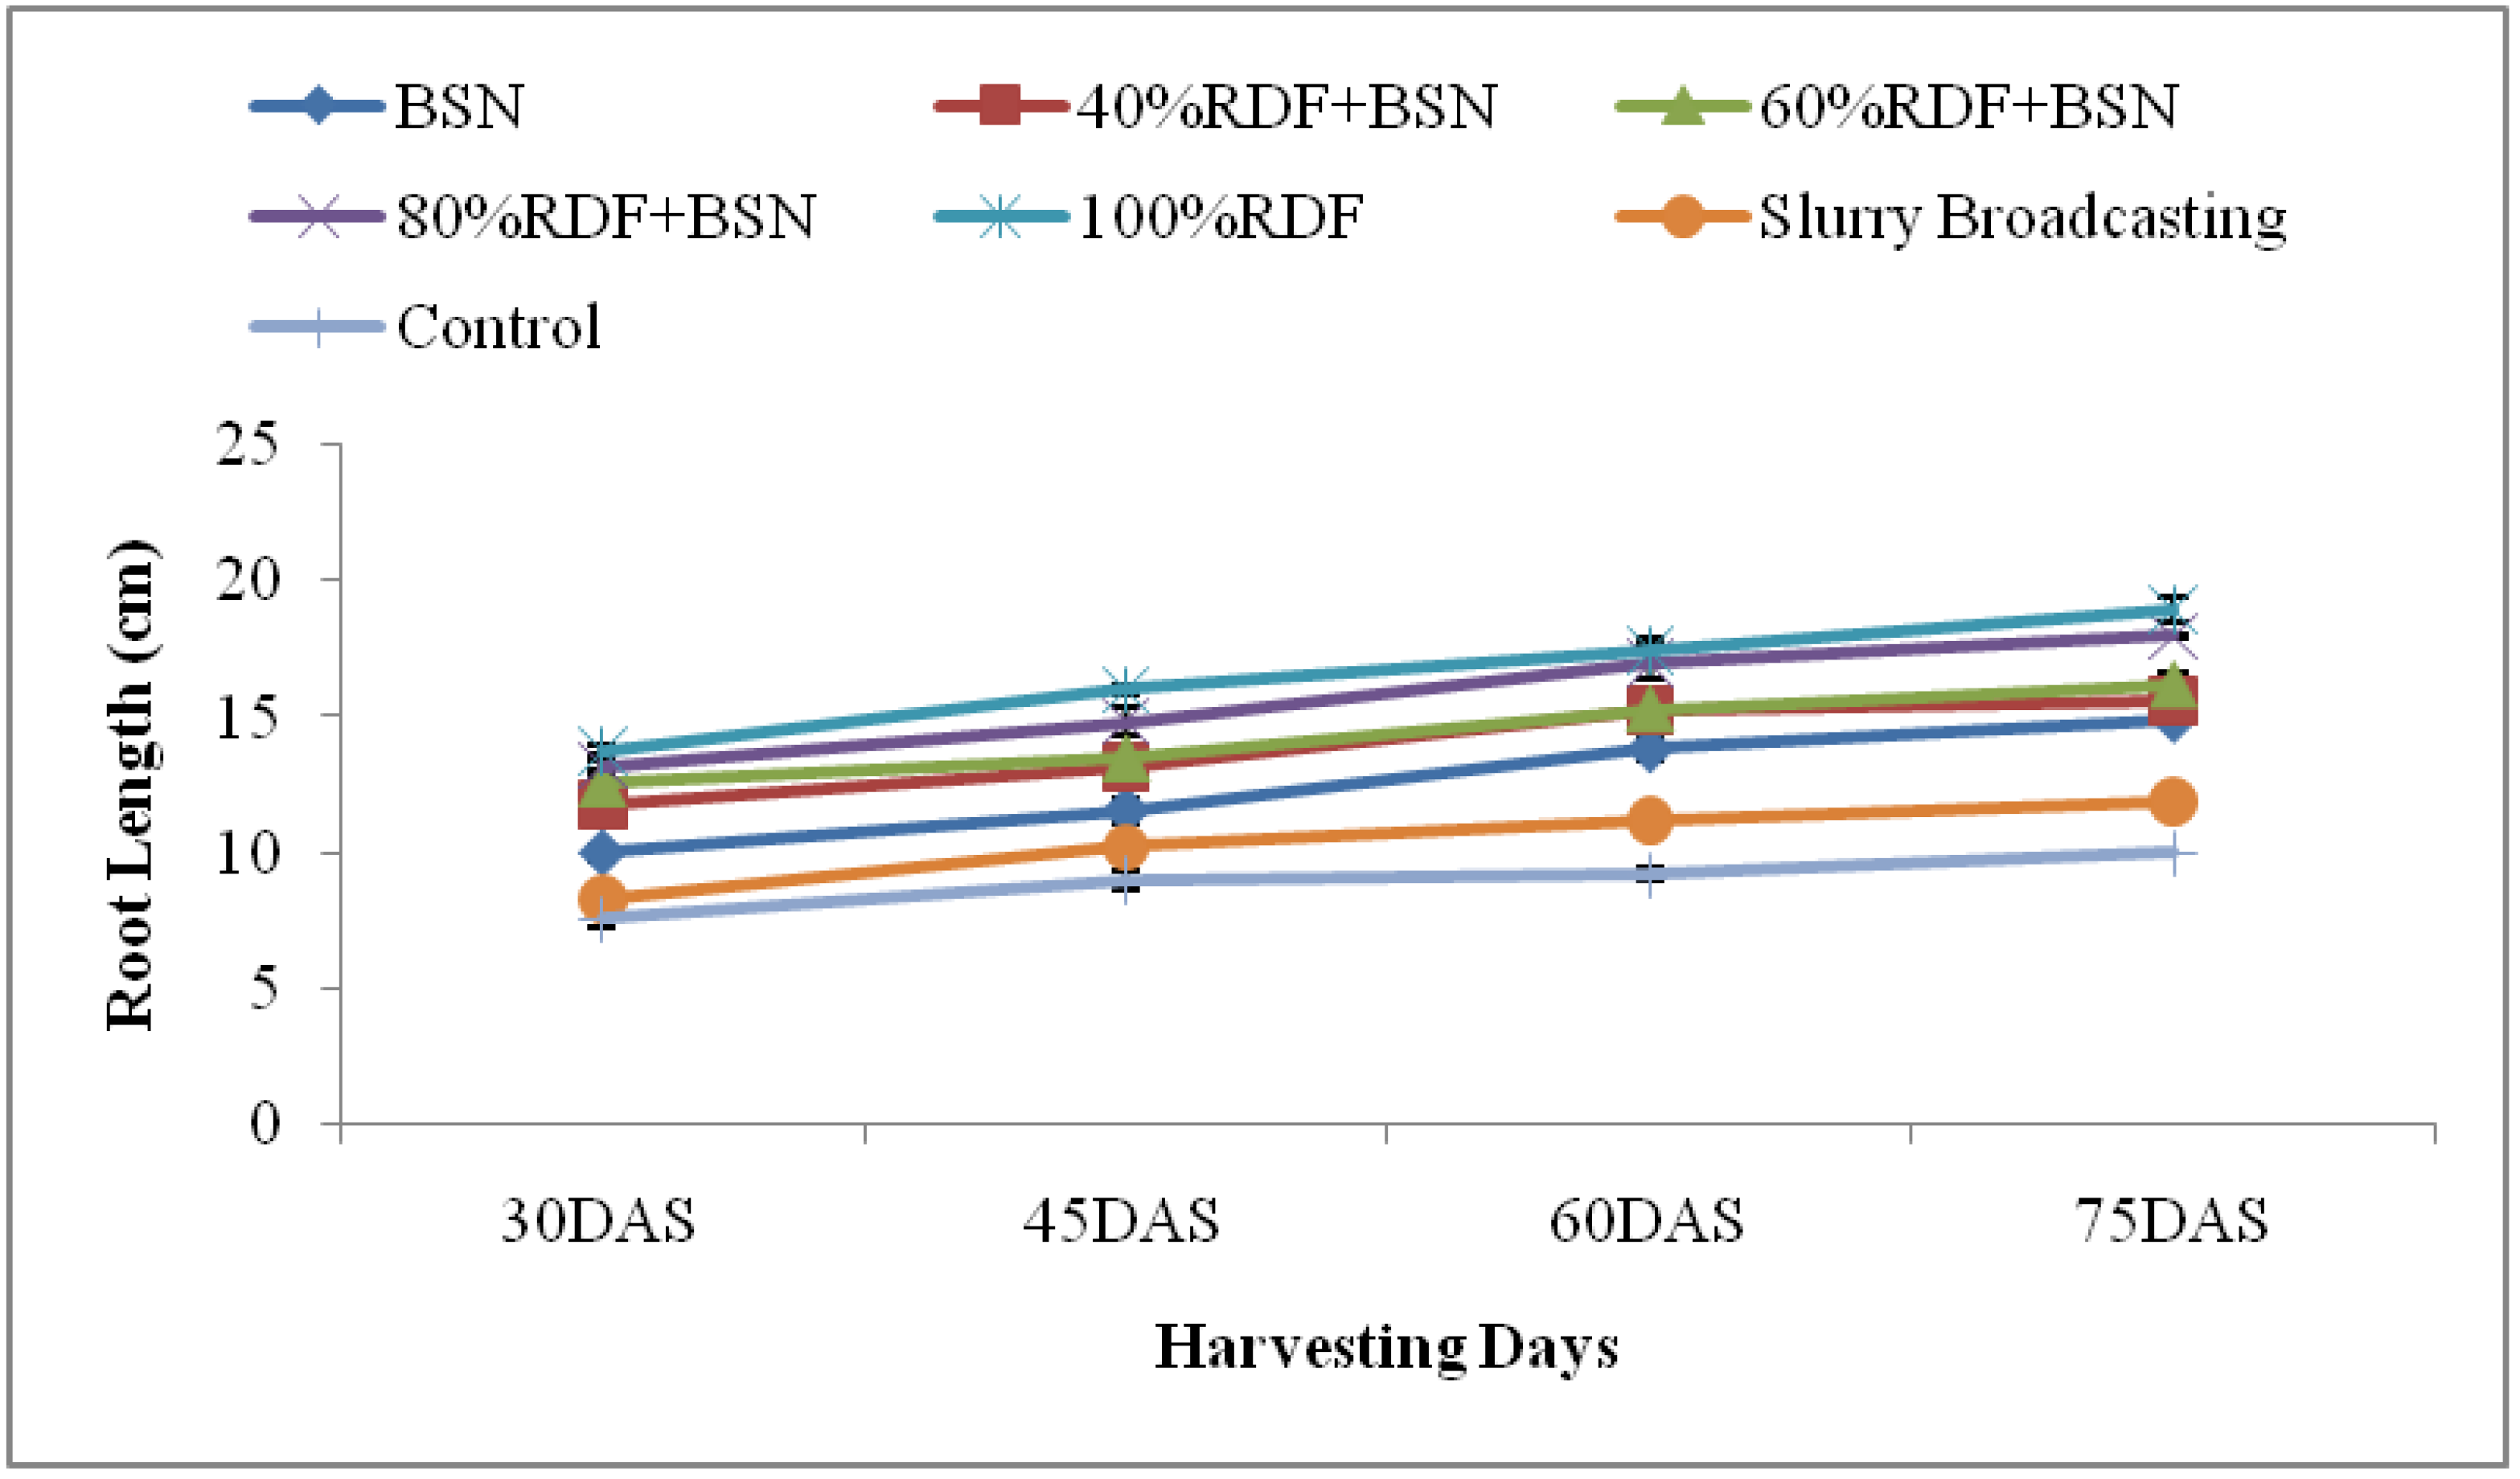
3.1.4. Root Length and Biomass
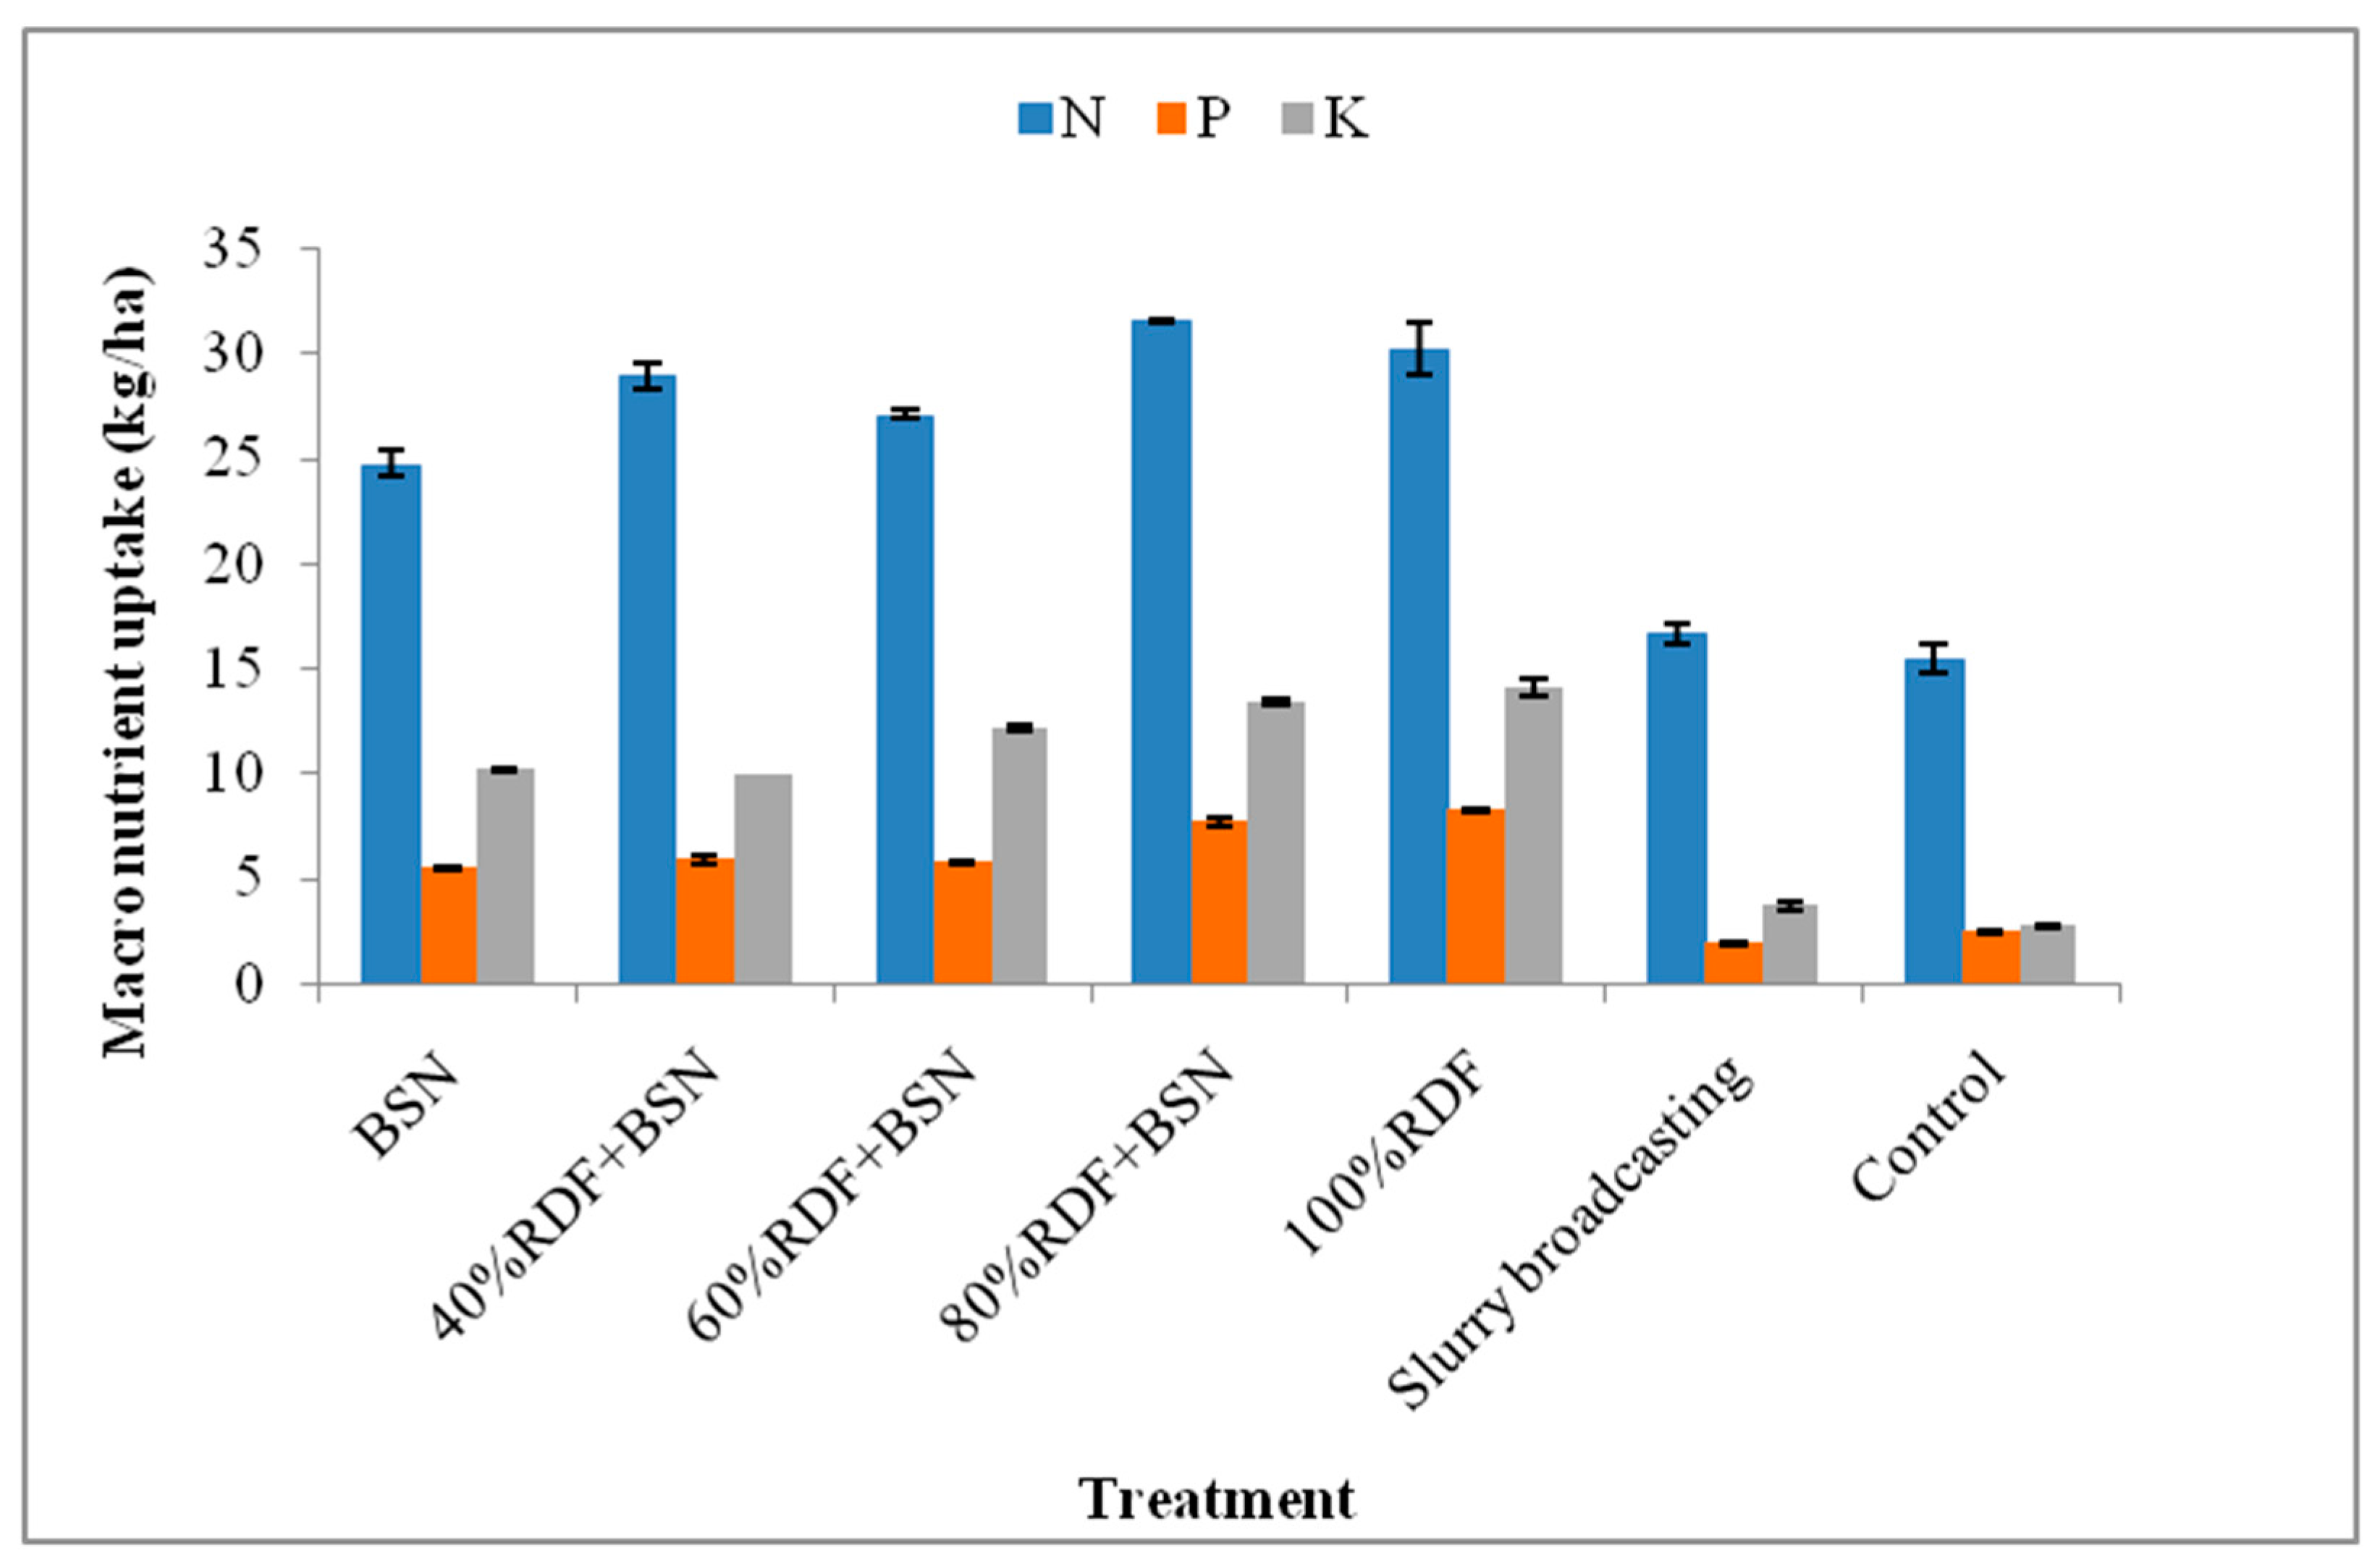
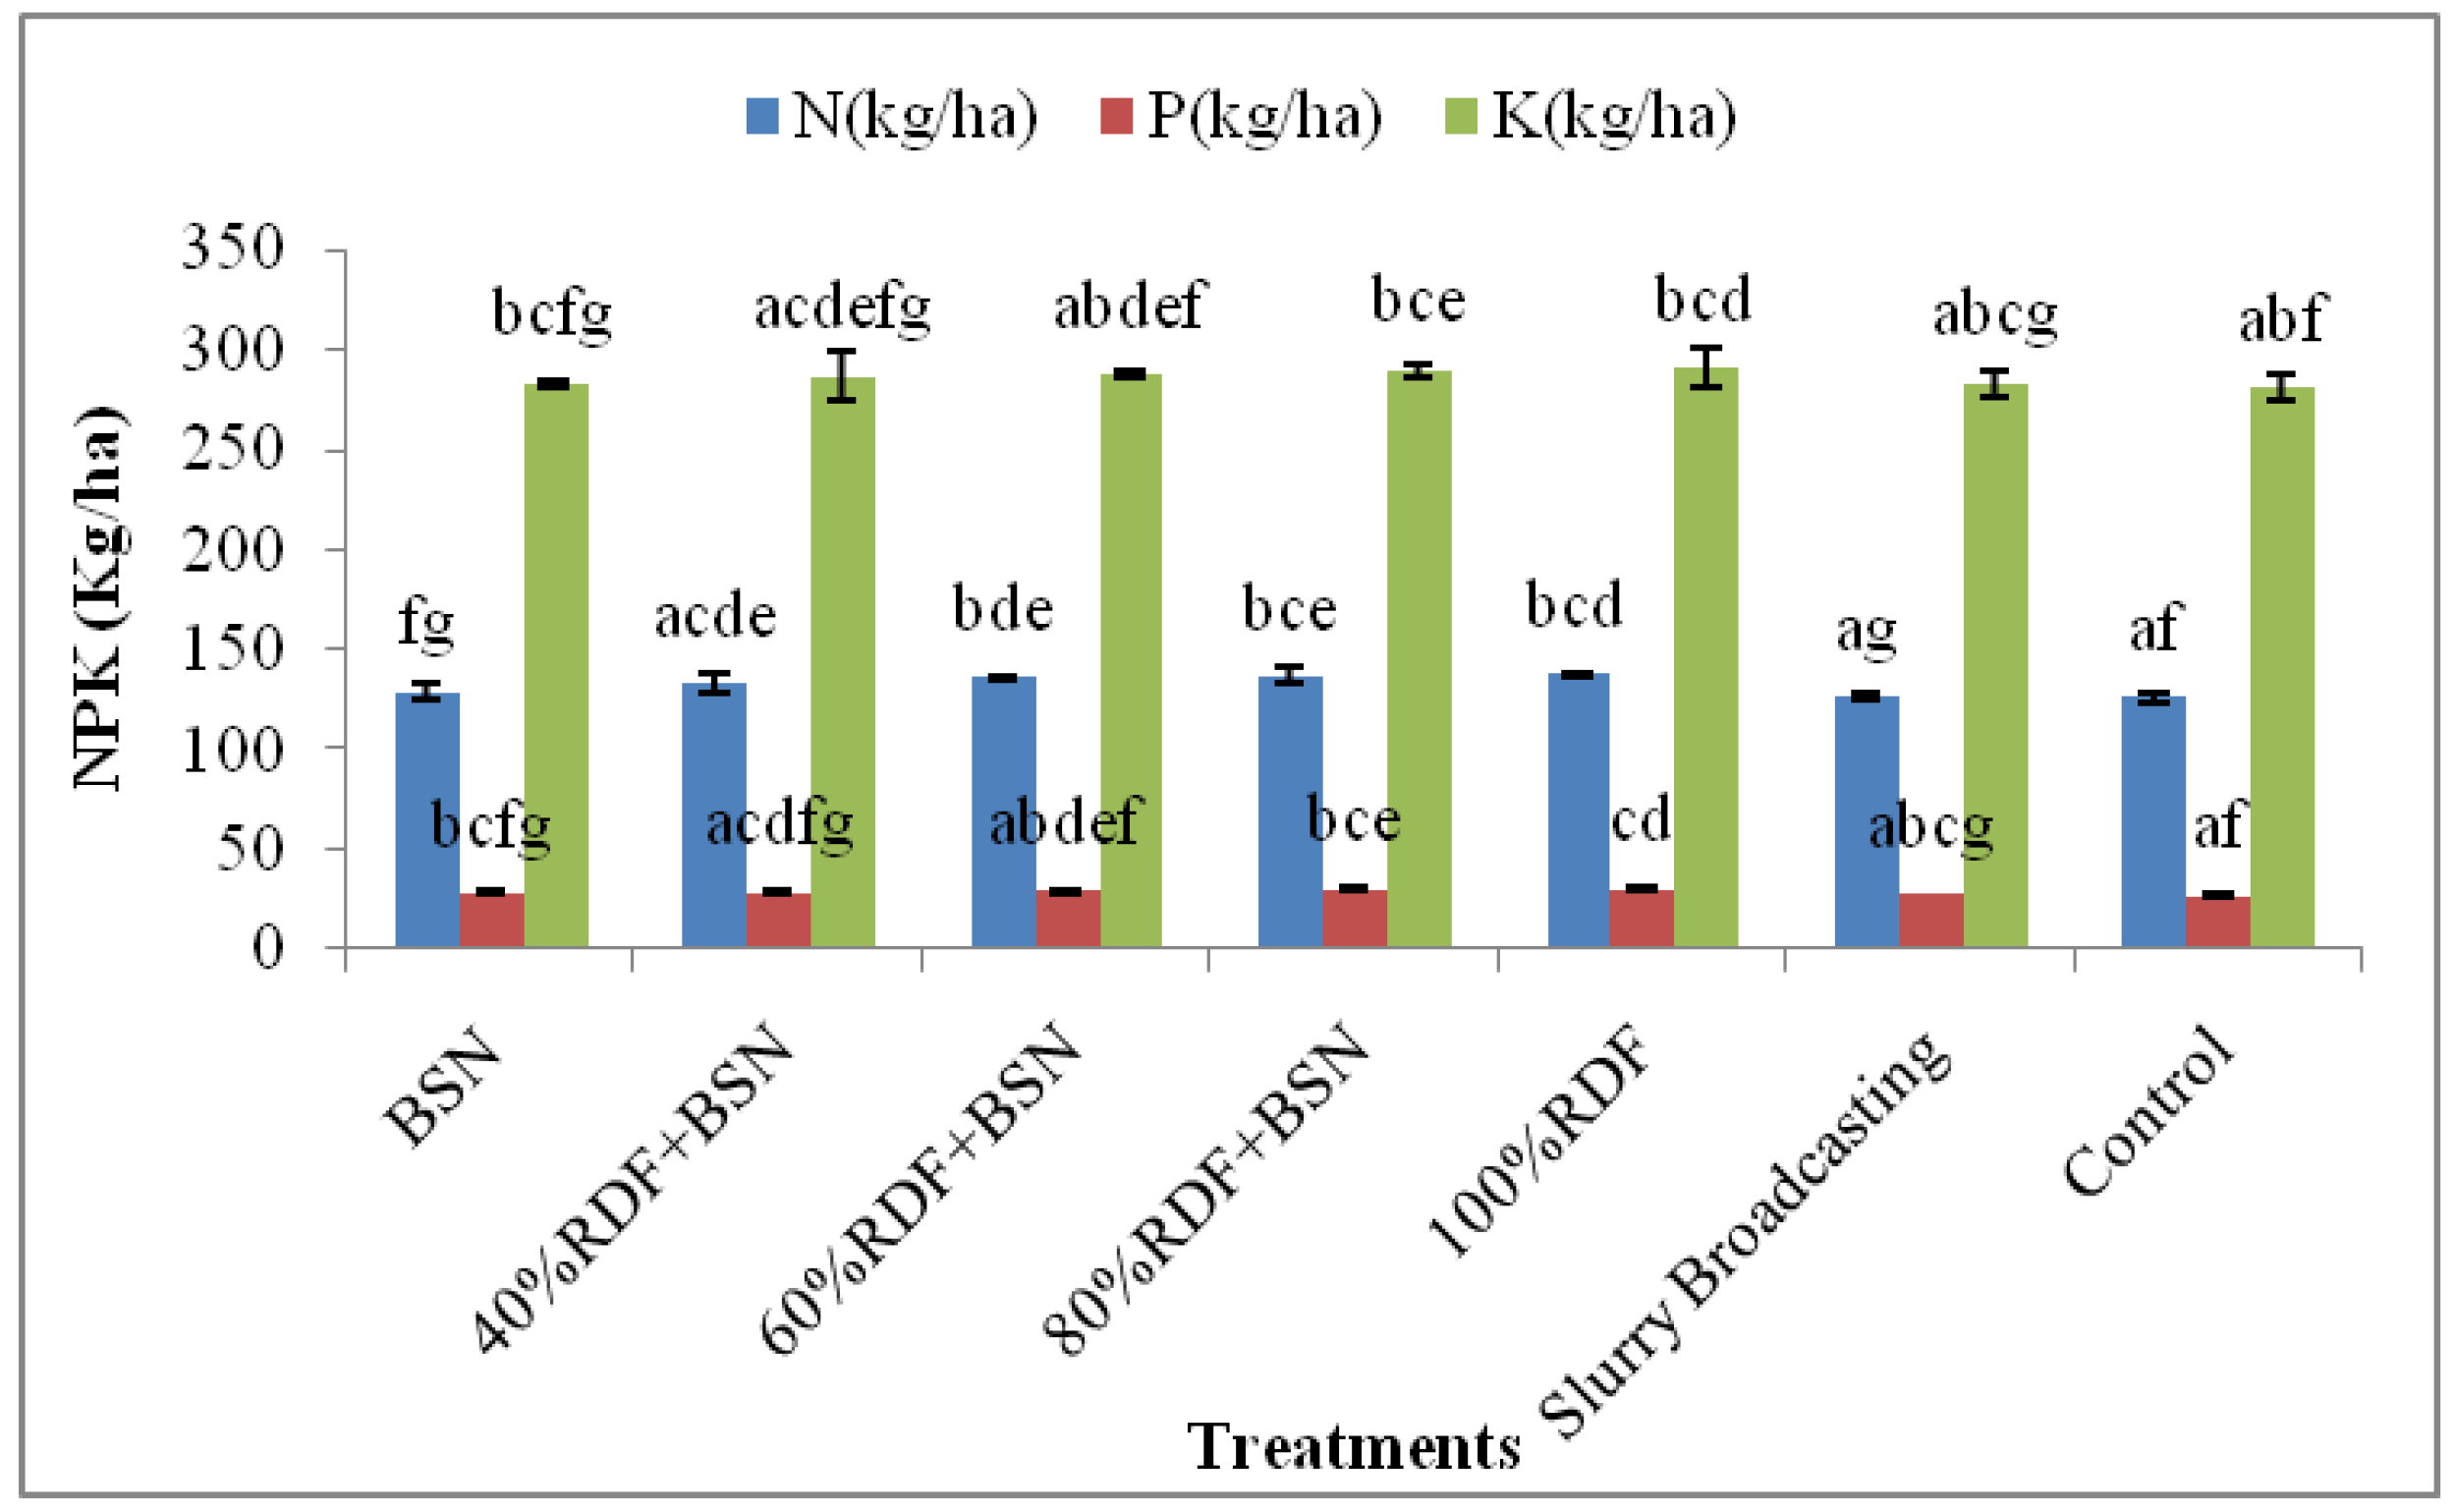
3.2. Spinach Nutrient Uptake
3.3. Effect on Soil
3.4. Microbiological Parameters
4. Discussion
5. Conclusions
Author Contributions
Funding
Data Availability Statement
Acknowledgments
Conflicts of Interest
References
- Tiang, J.; Bryks, B.C.; Yada, R.Y. Feeding the world into the future–food and nutrition security: The role of food science and technology. Front. Life Sci. 2016, 9, 155–166. [Google Scholar] [CrossRef]
- BP Energy Outlook. BP Energy Economics. Available online: https://www.bp.com/energyoutlook.2018 (accessed on 1 June 2023).
- Moller, K.; Muller, T. Effects of anaerobic digestion on digestate nutrient availability and crop growth: A review. Eng. Life Sci. 2012, 12, 242–257. [Google Scholar] [CrossRef]
- Sharpley, A.; Moyer, B. Phosphorus forms in manure and compost and their release during simulated rainfall. J. Environ. Qual. 2000, 29, 1462–1469. [Google Scholar] [CrossRef]
- Martínez-Suller, L.; Provolo, G.; Brennan, D.; Howlin, T.; Carton, O.T.; Lalor, S.T.J.; Richards, K.G. A note on the estimation of nutrient value of cattle slurry using easily determined physical and chemical parameters. Ir. J. Agric. Food Res. 2010, 49, 93–97. [Google Scholar]
- Zhang, G.Q. Biogas Technology and Application; Chemical Industry Press: Beijing, China, 2008. [Google Scholar]
- Saunders, O.E.; Fortuna, A.M.; Harrison, J.H.; Whitefield, E.; Cogger, C.G.; Kennedy, A.C.; Bary, A.I. Comparison of raw dairy manure slurry and an aerobically digested slurry as N sources for grass forage production. Int. J. Agron. 2012, 2012, 101074. [Google Scholar] [CrossRef]
- Valencia-Gica, R.B.; Yost, R.S.; Porter, G. Biomass production and nutrient removal by tropical grasses subsurface drip-irrigated with dairy effluent. Grass Forage Sci. 2012, 67, 337–349. [Google Scholar] [CrossRef]
- Maucieri, C.; Barbera, A.C.; Borin, M. Effect of injection depth of digestate liquid fraction on soil carbon dioxide emission and maize biomass production. Ital. J. Agron. 2016, 11, 6–11. [Google Scholar] [CrossRef]
- Garg, R.N.; Pathak, H.; Das, D.K.; Tomar, R.K. Use of flyash and biogas slurry for improving wheat yield and physical properties of soil. J. Environ. Monit. Assess. 2005, 107, 1–9. [Google Scholar] [CrossRef]
- UNECE United Nations Economic Commission for Europe Framework Code for Good Agricultural Practice for Reducing Ammonia Emissions. 2020. Available online: http://www.unece.org/environmental-policy/ (accessed on 1 June 2023).
- Bolzonella, D.; Fatone, F.; Gottardo, M.; Frison, N. Nutrients recovery from anaerobic digestate of agro-waste: Techno-economic assessment of full scale applications. J. Environ. Manag. 2018, 216, 111–119. [Google Scholar] [CrossRef]
- Weil, R.R.; Weismiller, R.A.; Turner, R.S. Nitrate contamination of groundwater under irrigated coastal plain soils. J. Environ. Qual. 1990, 441–448. [Google Scholar] [CrossRef]
- Bortolini, L. A Low Environmental Impact System for Fertigation of Maize with Cattle Slurry. Contemp. Eng. Sci. 2016, 9, 201–213. [Google Scholar] [CrossRef]
- Baral, K.R.; Labouriau, R.; Olesen, J.E.; Petersen, S.O. Nitrous oxide emissions and nitrogen use efficiency of manure and digestate applied to spring barley. Agric. Ecosyst. Environ. 2017, 239, 188–198. [Google Scholar] [CrossRef]
- Guido, V.; Finzi, A.; Ferrari, O.; Riva, E.; Quílez, D.; Herrero, E.; Provolo, G. Fertigation of Maize with Digestate Using Drip Irrigation and Pivot Systems. Agronomy 2020, 10, 1453. [Google Scholar] [CrossRef]
- Mikkelsen, R.; Hartz, T.K.; Rusan, M.J.M. Challenges of increasing water and nutrient efficiency in irrigated agriculture. In Managing Water and Fertilizer for Sustainable Agricultural Intensification, 1st ed.; Drechsel, P., Heffer, P., Magen, H., Mikkelsen, R., Wichelns, D., Eds.; International Fertilizer Industry Association (IFA), International Water Management Institute (IWMI), International Plant Nutrition Institute (IPNI) and International Potash Institute (IPI): Paris, France, 2015; Chapter 8; pp. 168–186. ISBN 979-10-92366-02-0. [Google Scholar]
- Qiu, X.; Wang, J.; Wang, H.; Wang, C.; Sun, Y.; Li, G. Elimination of Clogging of a Biogas Slurry Drip Irrigation System Using the Optimal Acid and Chlorine Addition Mode. Agriculture 2022, 12, 777. [Google Scholar] [CrossRef]
- Reetz, H.F., Jr.; Heffer, P.; Bruulsema, T.W. 4R nutrient stewardship: A global framework for sustainable fertilizer management. In Managing Water and Fertilizer for Sustainable Agricultural Intensification; Drechsel, P., Heffer, P., Magen, H., Mikkelsen, R., Wichelns, D., Eds.; International Fertilizer Industry Association (IFA), International Water Management Institute (IWMI), International Plant Nutrition Institute (IPNI), and International Potash Institute (IPI): Paris, France, 2015; Chapter 4; pp. 65–86. ISBN 979-10-92366-02-0. [Google Scholar]
- Camp, C.R. Subsurface drip irrigation: A review. Trans. ASAE 1998, 41, 1353–1367. [Google Scholar] [CrossRef]
- APHA. Standard Methods for the Examination of Water and Wastewater. In American Public Health Association, 20th ed.; American Water Works Association and Water Environmental Federation: Washington, DC, USA, 1998. [Google Scholar]
- Jackson, M.L. Soil Chemical Analysis; Prentice Hall of India Pvt., Ltd.: New Delhi, India, 1973. [Google Scholar]
- Dass, A.; Lenka, N.K.; Patnaik, U.S.; Sudhishri, S. Integrated Nutrient Management for Production, Economics, and Soil Improvement in Winter Vegetables. Int. J. Veg. Sci. 2008, 14, 104–120. [Google Scholar] [CrossRef]
- Tabatabai, M.A. Soil Enzymes. In Methods of Soil Analysis: Part 2 Microbiological and Biochemical Properties; Page, A.L., Ed.; The American Society of Agronomy: Madison, WI, USA, 1994; pp. 775–833. [Google Scholar] [CrossRef]
- Casida, L.E., Jr.; Klein, D.A.; Santoro, T. Soil dehydrogenase activity. Soil Sci. 1964, 98, 371–376. [Google Scholar] [CrossRef]
- Vance, E.D.; Brookes, P.C.; Jenkinson, D.S. An extraction method for measuring soil microbial biomass C. Soil Biol. Biochem. 1987, 19, 703–707. [Google Scholar] [CrossRef]
- Rana, K.S.; Choudhary, A.K.; Sepat, S.; Bana, R.S.; Dass, A. Methodological and Analytical Agronomy; Post Graduate School, Indian Agricultural Research Institute: New Delhi, India, 2014; p. 276. [Google Scholar]
- United Nations. Transforming Our World, The 2030 Agenda for Sustainable Development; United Nations: New York, NY, USA, 2015. [Google Scholar]
- Głowacka, A.; Szostak, B.; Klebaniuk, R. Effect of Biogas digestate and mineral fertilisation on the soil properties and yield and nutritional value of switchgrass forage. Agron. J. 2020, 10, 490. [Google Scholar] [CrossRef]
- Sarker, M.Y.; Azad, A.K.; Hasan, M.K.; Nasreen, A.; Naher, Q.; Baset, M.A. Effect of Plant Spacing and Sources of Nutrients on the Growth and Yield of Cabbage. Pak. J. Biol. Sci. 2002, 5, 636–639. [Google Scholar] [CrossRef]
- Jingyu, F. Effects of Different Harvest Start Times on Leafy Vegetables (Lettuce, Pak Choi and Rocket) in a Reaping and Regrowth System. Ph.D. Thesis, Lincoln University, Lincoln, UK, 2008. [Google Scholar]
- Tehlan, S.K.; Thakral, K.K. Effect of different levels of nitrogen and leaf cutting on leaf and seed yield of coriander (Coriandrum sativum). J. Spices. Aromat. Crops 2008, 17, 180–182. [Google Scholar]
- Purbajanti, E.D.; Slamet, W.; Fuskhah, E.; Rosiyda. Effects of organic and inorganic fertilizers on growth, activity of nitrate reductase and chlorophyll contents of peanuts (Arachis hypogaea L.). In IOP Conference Series: Earth and Environmental Science; IOP Publishing: Bristol, UK, 2019; Volume 250, p. 12048. [Google Scholar] [CrossRef]
- Jha, M.K.; Jana, J.C. Evaluation of vermicompost and farmyard manure in nutrient management of spinach (Beta vulgaris var. bengalensis). Indian J. Agric. Sci. 2009, 79, 538–541. [Google Scholar]
- Bharad, S.G.; Korde, S.D.; Pravina, S.; Baviskar, M.N. Effect of organic manure and number of cutting on growth, yield and quality of Indian spinach. Asian J. Hort. 2013, 8, 60–64. [Google Scholar]
- Norman, Q.A.; Edwardsa, C.A.; Biermanb, P.; Metzgerc, J.D.; Lucht, C. Effects of vermicomposts produced from cattle manure, food waste and paper waste on the growth and yield of peppers in the field. Pedobiologia 2005, 49, 297–306. [Google Scholar] [CrossRef]
- Sharma, J.; Agarwal, S. Impact of organic fertilizers on growth, yield and quality of spinach beet. Indian J. Plant Sci. 2014, 3, 37–43. [Google Scholar]
- Tshikalange, B.; Ololade, O.; Jonas, C.; Bello, Z.A. Effectiveness of cattle dung biogas digestate on spinach growth and nutrient uptake. Heliyon 2022, 8, 2405–8440. [Google Scholar] [CrossRef]
- Blaha, L. The importance of root -shoot ratio for crops production. HSOA J. Agron. Agric. Sci. 2019, 2, 012. [Google Scholar] [CrossRef]
- Seo, D.H.; Seomun, S.; Choi, Y.D.; Jang, G. Root development and stress tolerance in rice: The key to improving stress tolerance without yield penalties. Int. J. Mol. Sci. 2020, 21, 1807. [Google Scholar] [CrossRef]
- Preetha, D. Biotic Enrichment of Organic Wastes from Ayurveda Prepareation. Master’s Thesis, Kerla Agriculture University, Thrissur, India, 2003. [Google Scholar]
- Bhattacharjee, M.; Gautam, B.; Sarma, P.K.; Hazarika, M.; Goswami, R.K.; Kakati, N. Effect of organic sources of nutrients on growth yield and quality of spinach beet (Beeta vulgaris var bengalensis Hort.) cv All Green. Trends Biosci. 2017, 10, 1490–1496. [Google Scholar]
- Barbosa, D.B.P.; Nabel, M.; Jablonowski, N.D. Biogas-digestate as nutrient source for biomass production of Sidahermaphrodita, Zea mays L. and Medicago sativa L. J. Energy Proc. 2014, 59, 120–126. [Google Scholar] [CrossRef]
- Svoboda, N.; Taube, F.; Wienforth, B.; Kluß, C.; Kage, H.; Herrmann, A. Nitrogen leaching losses after biogas residue application to maize. Soil Tillage Res. 2013, 130, 69–80. [Google Scholar] [CrossRef]
- Han, S.H.; An, Y.J.; Hwang, J.; Kim, S.B.; Park, B. The effects of organic manure and chemical fertiliser concentrations of yellow poplar (Liriodendron tulipifera Lin.) in a nursery system. J. For. Sci. Technol. 2016, 12, 137–143. [Google Scholar] [CrossRef]


| Parameters | Before Filtration | After Filtration |
|---|---|---|
| EC (ds/cm) | 1.84 | 1.46 |
| pH | 8.52 | 7.62 |
| Turbidity (NTU) | 639 | 199 |
| Total Nitrogen (mg/L) | 22,303 | 78.25 |
| Total Phosphorous (mg/L) | 9834 | 45.23 |
| Total Potassium (mg/L) | 2899 | 39.65 |
| Soil Parameters | Values |
|---|---|
| Physical properties | |
| Particle size distribution | |
| Sand (%) | 71 |
| Silt (%) | 14 |
| Clay (%) | 15 |
| Textural class | Sandy Loam |
| Bulk density (g/cc) | 1.52 |
| Mean Weight Diameter | 0.98 |
| Geometric Weight Diameter | 0.54 |
| Chemical properties | |
| Macro nutrients | |
| Available Nitrogen (kg/ha) | 125.7 |
| Available Phosphorous (kg/ha) | 26.5 |
| Available Potassium (kg/ha) | 281.4 |
| Organic Carbon (%) | 0.43 |
| pH | 7.21 |
| EC | 0.29 |
| Treatment | Plant Height (cm) | Leaf Count | Leaf Area (cm2) |
|---|---|---|---|
| BSN | 22.68 | 13.75 | 46.00 |
| 40% RDF + BSN | 24.13 | 14.50 | 48.47 |
| 60% RDF + BSN | 24.74 | 16.35 | 50.91 |
| 80 RDF + BSN | 25.43 | 15.75 | 45.10 |
| 100% RDF | 26.06 | 17.00 | 54.84 |
| Slurry Broadcasting | 20.60 | 9.00 | 34.82 |
| Control | 19.36 | 7.75 | 35.72 |
| C.D. (p = 0.05) | 1.344 | 0.613 | 1.885 |
| S.E (m) ± | 1.017 | 0.197 | 0.605 |
| Harvesting days | |||
| 30 DAS | 20.89 | 11.14 | 18.64 |
| 45 DAS | 23.40 | 13.00 | 35.02 |
| 60 DAS | 24.32 | 15.71 | 79.70 |
| 75 DAS | 23.95 | 13.90 | 47.13 |
| C.D. (p = 0.05) | 1.383 | 0.307 | 2.504 |
| S.E (m) ± | 0.392 | 0.087 | 0.428 |
| Treatment | Mean Dehydrogenase (μg TPF Formed g −1 Soil h−1) | Mean Alkaline Phosphatase (μg PNP Formed g−1 Soil h−1) | Mean Acid Phosphatase (μg PNP Formed g−1 Soil h−1) |
|---|---|---|---|
| T1 (BSN) | 0.780 | 68.53 | 86.45 |
| T2 (40% RDF + BSN) | 0.760 | 58.68 | 79.85 |
| T3(60% RDF + BSN) | 0.798 | 60.18 | 77.35 |
| T4(80% RDF + BSN) | 0.807 | 57.87 | 79.69 |
| T5(100% RDF) | 0.610 | 57.22 | 78.71 |
| T6 (Slurry Broadcasting) | 0.747 | 52.73 | 70.61 |
| T7 (Control) | 0.712 | 44.38 | 62.73 |
| C. D (p = 0.05) | 0.034 | 2.736 | 4.229 |
| S.E (m)± | 0.011 | 0.878 | 1.357 |
Disclaimer/Publisher’s Note: The statements, opinions and data contained in all publications are solely those of the individual author(s) and contributor(s) and not of MDPI and/or the editor(s). MDPI and/or the editor(s) disclaim responsibility for any injury to people or property resulting from any ideas, methods, instructions or products referred to in the content. |
© 2024 by the authors. Licensee MDPI, Basel, Switzerland. This article is an open access article distributed under the terms and conditions of the Creative Commons Attribution (CC BY) license (https://creativecommons.org/licenses/by/4.0/).
Share and Cite
Yadav, R.; Sudhishri, S.; Khanna, M.; Lal, K.; Dass, A.; Kushwaha, H.L.; Bandyopadhyay, K.; Suman, A.; Singh, A.; Singh, R.K.; et al. A Greener Approach to Spinach Farming: Drip Nutrigation with Biogas Slurry Digestate. Agronomy 2024, 14, 681. https://doi.org/10.3390/agronomy14040681
Yadav R, Sudhishri S, Khanna M, Lal K, Dass A, Kushwaha HL, Bandyopadhyay K, Suman A, Singh A, Singh RK, et al. A Greener Approach to Spinach Farming: Drip Nutrigation with Biogas Slurry Digestate. Agronomy. 2024; 14(4):681. https://doi.org/10.3390/agronomy14040681
Chicago/Turabian StyleYadav, Rashmi, Susama Sudhishri, Manoj Khanna, Khajanchi Lal, Anchal Dass, Hari Lal Kushwaha, Kalikinkar Bandyopadhyay, Archna Suman, Anupama Singh, Rajiv Kumar Singh, and et al. 2024. "A Greener Approach to Spinach Farming: Drip Nutrigation with Biogas Slurry Digestate" Agronomy 14, no. 4: 681. https://doi.org/10.3390/agronomy14040681
APA StyleYadav, R., Sudhishri, S., Khanna, M., Lal, K., Dass, A., Kushwaha, H. L., Bandyopadhyay, K., Suman, A., Singh, A., Singh, R. K., & Singh, R. (2024). A Greener Approach to Spinach Farming: Drip Nutrigation with Biogas Slurry Digestate. Agronomy, 14(4), 681. https://doi.org/10.3390/agronomy14040681