Article

Optimizing Straw Mulching Methods to Control Soil and Water Losses on Loess Sloped Farmland

1
State Key Laboratory of Eco-Hydraulics in Northwest Arid Region, Xi’an University of Technology, Xi’an 710048, China
2
Beijing Water Conservancy Engineering Management Center, Beijing 100102, China
3
Xifeng Experiment Station of Soil and Water Conservation, Yellow River Conservancy Committee, Qingyang 745000, China
*
Author to whom correspondence should be addressed.
Agronomy 2024, 14(4), 696; https://doi.org/10.3390/agronomy14040696
Submission received: 25 February 2024 / Revised: 17 March 2024 / Accepted: 25 March 2024 / Published: 28 March 2024
(This article belongs to the Section Farming Sustainability)

Abstract

:
Straw mulching is a key method for controlling soil and water losses. Mulching costs may be reduced by applying it in strips rather than over entire areas. However, the effect of different straw mulching methods on the effectiveness of reducing soil erosion is unclear. In this study, the effects of straw mulching strip length (covering 1/4, 1/2, 3/4, and 4/4 of the slope length) and coverage rate (0.2, 0.5, and 0.8 kg m−2) on interception, infiltration, runoff, and soil erosion were investigated at the plot scale using rainfall simulation experiments. The further complex correlations between these variables were analyzed using structural equation modeling (SEM). Bare slopes were used as a control group. The rainfall intensity was chosen to be 60 mm h−1. The results showed that (1) the modified Merriam interception model can describe the change in interception with time under straw mulching conditions well (R2 > 0.91, NSE > 0.75). (2) A total of 35.39–78.79% of the rainwater is converted into infiltration on straw-covered slopes, while this proportion is 36.75% on bare slopes. The proportion of rainwater converted to infiltration was greatest (78.79%) when the straw covered 3/4 of the slope length at a coverage rate of 0.5 kg m−2, which was the most conducive to rainwater harvesting on the slope. (3) Straw mulching protects the topsoil from the impact of raindrops and directly affects the sediment yield (direct effect = −0.44). Straw mulching can also indirectly affect sediment yield by increasing interception, reducing runoff, and decreasing the sediment carrying capacity of runoff (indirect effect = −0.83). Compared with bare slopes, straw covering at least 1/2 of the slope length can significantly reduce runoff yield, but straw covering only 1/4 of the slope length can significantly reduce sediment yield. Moreover, once the straw mulch slope length reaches 3/4 and the coverage rate reaches 0.5 kg m−2, further increases in mulch slope length and coverage rate will not significantly reduce the runoff and sediment yields. These results assessed the effectiveness of different straw mulching methods in controlling soil and water losses on sloping farmland.

1. Introduction

Sustainable practices to control and mitigate soil erosion are essential worldwide, especially in environments that are more prone to erosion risks [1,2,3]. Many studies worldwide have shown that mulching is a key method for controlling runoff and soil erosion [4,5]. Long-term studies have shown that mulching can improve water use efficiency by increasing soil infiltration, reducing evaporation [6], and reducing soil nutrient loss [7]. Mulching can also reduce soil temperature changes, control weed infestation [8], and increase crop yields [9]. Agricultural straw is one of the most widely used mulching materials to mitigate erosion because straw is generally considered cheap, easy to use, and effective [10].
In rain-fed agricultural areas, promoting rainwater infiltration through water collection techniques is crucial [11]. Therefore, assessing the proportion of rainwater converted into infiltration, runoff, and interception will help us to understand the contribution of different straw mulching methods to water and soil conservation and agricultural water availability in arid areas [12]. However, quantifying rainfall conversion proportions is difficult. Firstly, mulch interception is often considered a small fraction of total rainfall and is often ignored [13,14]. In fact, mulch interception is an essential factor in water balance and plays an important role in reducing water and soil loss [15]. Mulch interception can delay runoff generation and also reduce the slope flow velocity to increase rainwater infiltration time [16]. Bulcock and Jewitt [17] consider mulch interception one of the first processes considered in hydrological modeling before dealing with continuous processes such as infiltration and runoff. Evidently, it is necessary to explore the change in the interception storage capacity of the mulch with the rainfall duration and build the interception model to describe the interception process of the mulch. In summary, mulch interception should not be ignored when exploring the role of mulch in controlling soil and water losses [18]. Next, accurately measuring the interception capacity of mulch is also difficult. The present study uses the immersion method to measure the interception capacity of the mulch [19]. However, natural rainfall cannot create sufficient water supply conditions like immersion in water. The interception capacity of straw is affected by the rainfall intensity. Xia et al. [18] found that the interception capacity of mulch at 60 mm h−1 rainfall intensity was greater than 30 mm h−1 rainfall intensity. Putuhena and Cordery [20] found that rainfall intensities greater than 90 mm h−1 were required to provide an adequate water supply and for the interception capacity of the cover to be unaffected by rainfall intensity. Therefore, using the immersion method to measure the interception capacity of mulch is not accurate when rainfall intensity is low. Moreover, there have also been studies where mulch was placed in horizontal trays to measure the interception process through simulated rainfall [21,22]. However, it is a fact that the interception process of the mulch is also affected by the slope. Du et al. [23] suggest that actual topographic conditions should be considered when measuring mulch interception processes.
Furthermore, in many areas of severe soil erosion, there is a need to restore soil quality and associated soil functions [24]. Keesstra et al. [25] summarize two types of nature-based solutions: soil and landscape solutions. Straw mulching can be considered a soil solution [26]. The existing research has solved the effectiveness of the runoff and sediment reduction in the following types of mulch: rice straw, wheat straw, soybean straw, corn straw, barley straw, eucalyptus bark, wood chips, shrub–grass, ferns, and pine needles [27,28,29,30,31,32,33,34,35,36,37,38,39]. However, these experiments all tested the effectiveness of the mulch in covering the entire slope surface. Covering only a part of the slope instead of the whole slope is a way to reduce the cost of coverage [40,41]. Wheat straw has many uses; for example, it can be converted into biological fertilizer, feed, raw materials, fuel, and basic materials [42]. Therefore, research to reduce the cost of straw mulching is very important [41]. Many studies have found that covering entire plots has lower runoff and sediment yields than covering partial plots, but there were no significant differences [43]. Are et al. [44] even observed that covering a single strip was more effective at capturing sediment and associated nutrients than covering the whole patch, although the difference was slight. Therefore, it is necessary to explore the effectiveness of runoff and sediment reduction when straw covers only part of the bottom of the slope.
The Loess Plateau in China has long been considered an exceptionally fragile ecological region facing severe drought and water scarcity and is one of the most severely eroded areas in the world [45,46]. The main local crop is wheat. However, after the wheat harvest, local people remove the wheat straw and use it as fuel for burning or convert it into fodder. These activities expose fallow land, increase runoff yield, and reduce soil moisture. In addition, most of the annual rainfall on the Loess Plateau is concentrated in the summer months between July and September [47], which greatly increases the risk of extreme erosion due to the parallel period with the bare slope [48]. We hypothesize that mulching the bottom of the slope with wheat straw will reduce the cost of mulching while still effectively controlling soil and water losses on sloping farmland. In order to verify this hypothesis, the study used simulated rainfall to investigate the effects of different straw mulching methods on rainwater collection and soil erosion on loess sloped farmland.
The objectives of this study were (1) to investigate the process of straw mulch interception under rainfall conditions and to improve the Merriam interception model to simulate the variation in interception with rainfall duration and (2) to investigate the effects of different straw coverage rates and mulch slope lengths on runoff and soil erosion to determine the optimal mulching method.

2. Materials and Methods
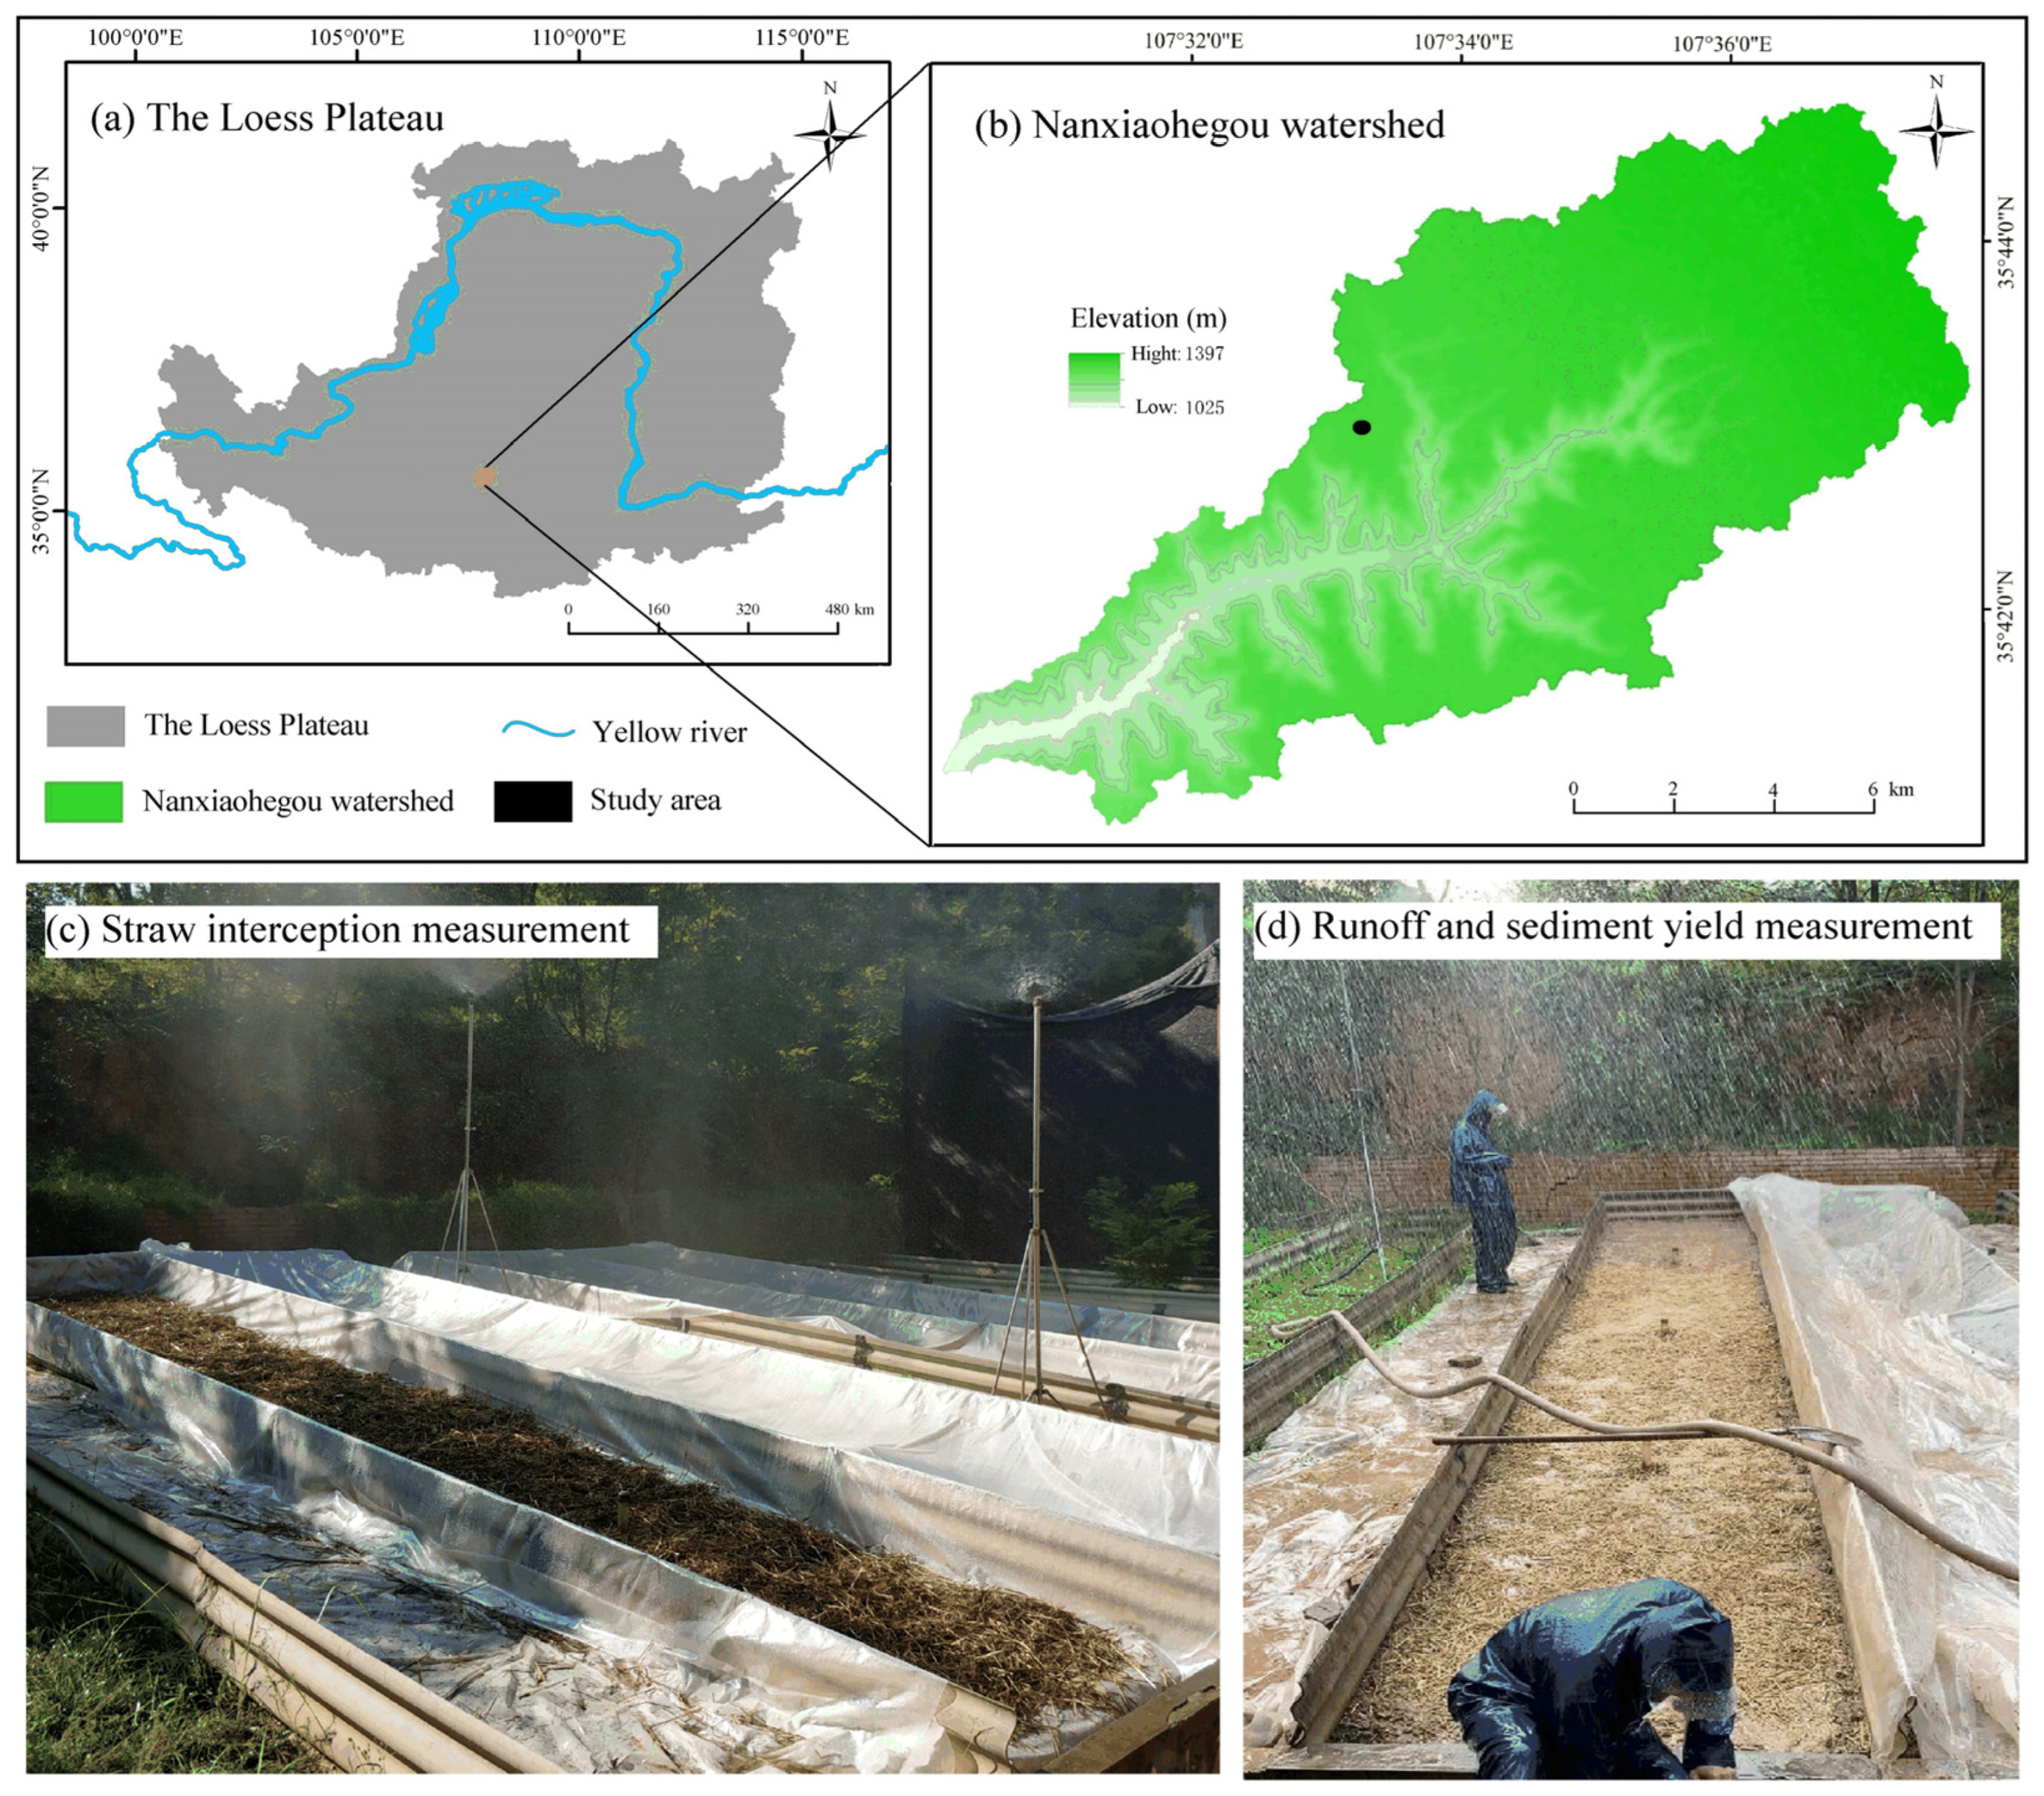
2.1. Study Area

The experiment was performed in the Gansu Province of China at the Xifeng Soil and Water Conservation Test Station, which falls under the Nanxiaohegou Watershed (35°41′–35°44′ N, 107°30′–107°37′ E) from June to November 2021 (Figure 1a,b). This field test station is located in the Loess Plateau gully, established in 1951 by the Xifeng Water Control Station of the Yellow River Water Conservancy Commission. The area of the Nanxiaohegou Watershed is 36.5 km2. According to observation statistics from the Xifeng meteorological station, the average annual rainfall in the area is 545.8 mm, mainly concentrated between June and September, and mostly in the form of heavy rainfall. The watershed is almost entirely covered by Quaternary loess, which is poorly resistant to erosion, and the average annual soil erosion rate in the watershed is estimated to be 4350 t·km−2·yr−1 [49]. In the Loess Plateau region of China, soil erosion on sloped farmland is a serious environmental problem and is a major source of sediment for the Yellow River [11]. Currently, the main crop grown on agricultural land in the area is wheat.

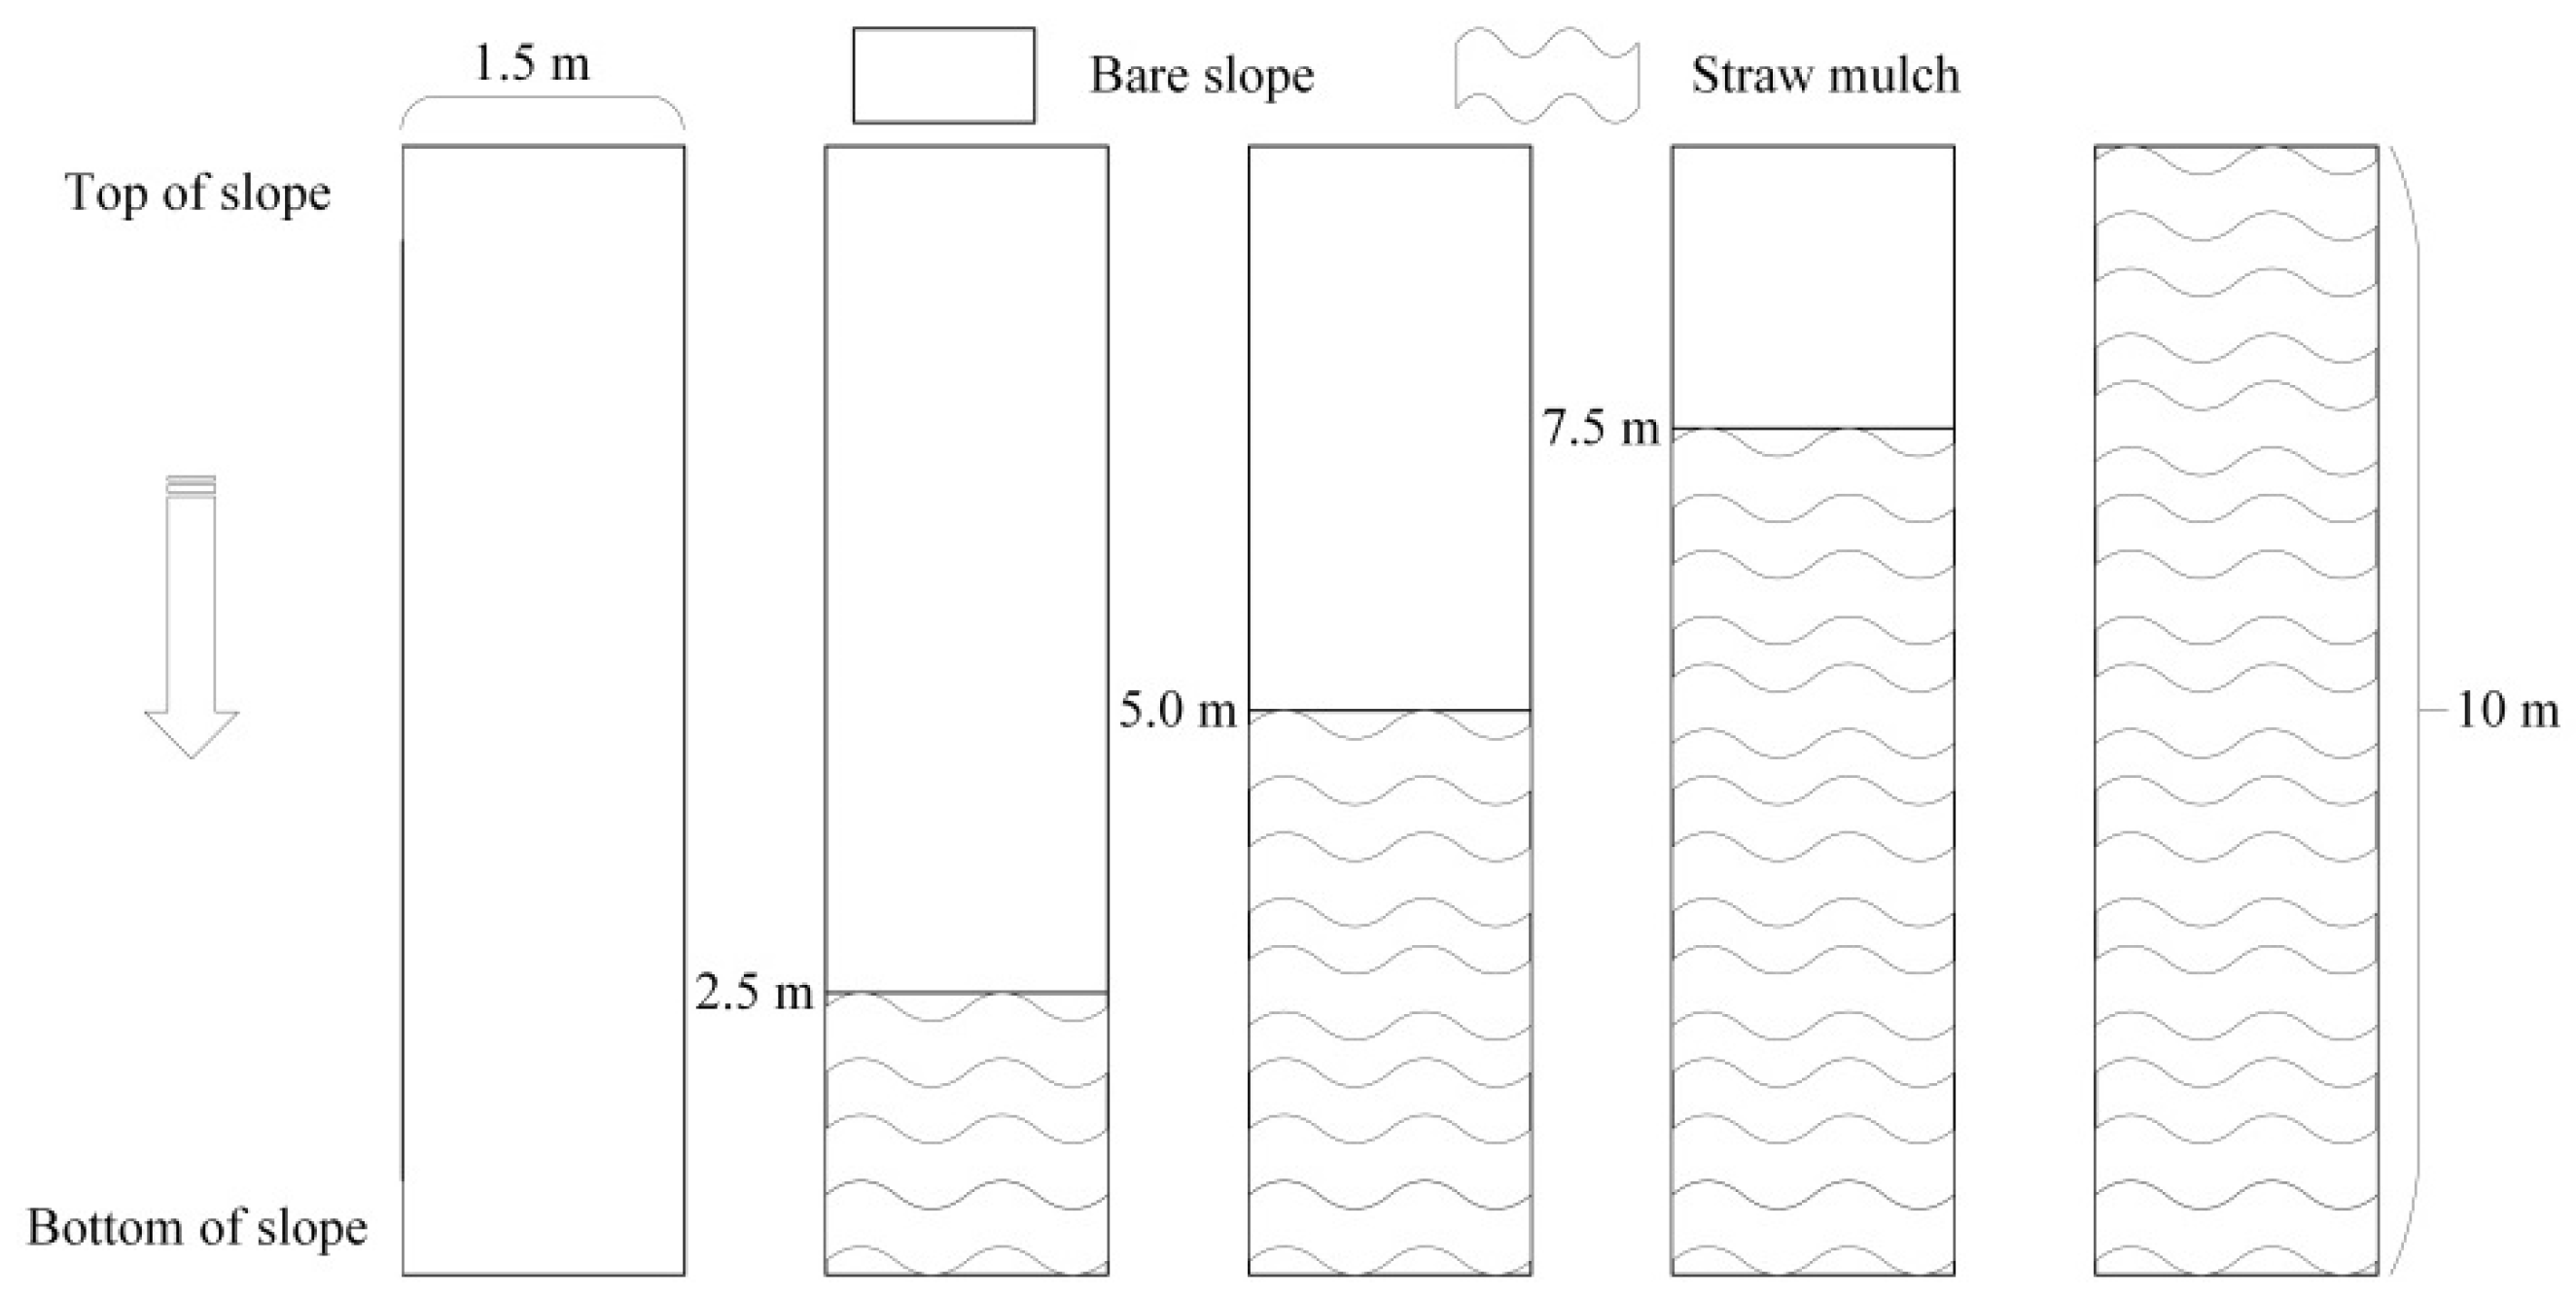
2.2. Straw Mulch Treatment

The test straw was naturally sun-dried wheat straw from the current year, harvested by hand at the end of May 2021. In addition to the bare slope control treatment, 12 straw mulching treatments were tested. These 12 treatments combined four mulch application options and three coverage rates. The three coverage rates included 0.2, 0.5, and 0.8 kg m−2 [4]. The four mulch application options included covering 1/4, 1/2, 3/4, and 4/4 of the slope length (Figure 2). The experimental design was created as 3 (coverage rates) × 4 (straw mulching strip length options) and a control test (bare ground). Each group of the test was set with three repetitions. A total of 39 simulated rainfall experiments were conducted. Weeds and debris were removed before straw was applied to the runoff plots. Shovels were then applied to level the surface soil of the runoff plots to ensure consistent initial conditions in the runoff plots prior to each test. At a height of 30 cm from the plot’s surface, the straw was lifted with both hands and let fall naturally onto the bed. A staggered vertical and horizontal random position was maintained within the straw mulch. After spreading, the straw was manually adjusted at different positions to make it evenly distributed on the surface of the runoff plot and form a uniform cover thickness.

2.3. Rainfall Simulation and Plot Establishment

A portable rainfall simulator designed and manufactured by Northwest Agriculture and Forestry University was used in this study [18,50]. Field trials were conducted using two rainfall simulator towers (Figure 1c). The simulator generated rainfall from a height of 3.5 m with a uniformity of 90% [50]. The rainfall intensity was controlled by adjusting the pressure gauge, and eight plastic basins were evenly placed in the test area for rainfall intensity calibration. Rainfall intensities of 60 mm h−1 were selected according to the characteristics of erosive rainfall in the Loess Plateau [50,51]. The rainfall duration was set at 40 min [18,50]. Based on 24 years of rainfall data at the test station, the maximum 30 min rainfall intensity of 60 mm h−1 represents a return period of approximately ten years [50].
In July 2020, a total of 16 field plots with similar dimensions and terrain conditions were established at the study site. The plots were 10 m long and 1.5 m wide. On the Loess Plateau, slopes greater than 5° are the main source of soil erosion [52]. According to the agricultural land classification of the Loess Plateau, farmland with a 5° slope represents typical slightly sloped farmland in the field [11]. For this experiment, the slope of the runoff plots was set at 5°. The grain size characteristics of the surface soil of the plots are listed in Table 1. Three time-domain reflectometry access tubes were installed in each plot to monitor soil moisture and ensure the consistency of the initial soil moisture conditions (i.e., the average volumetric soil moisture should be close to 15% at depths between 20 cm and 40 cm). Before the formal test, two plots were selected for simulation tests to test the impact of soil erosion on the change in soil surface characteristics [18]. The pre-test shows that gully erosion is weak, the soil surface can recover to its pre-existing state after the test, and the results will not be affected by the continuous test on the same plot. Before each test, the topsoil of each plot was leveled to create similar surface conditions. Before the simulated rainfall, the plot rested for about 15 days to allow for soil consolidation.

2.4. Field Measurement

Two types of field tests were carried out. The first type was to measure the interception storage capacity of wheat straw by placing plastic film under the wheat straw to cover the soil surface (Figure 1c). The mulch interception storage capacity consists of the amount of water retained in the mulch layer when the rainfall stops (denoted as C) and the amount of water retained in the mulch layer at the cessation of free drainage after rainfall (denoted as Cmin) [53]. As the effect of the free drainage of straw on soil erosion was not significant, this study focused on determining the effect of C on the hydrological response. Clearly, the effect of surface runoff should be taken into account when measuring C. Considering this problem, Xia et al. [18] measured the interception process of litter under different simulated rainfall intensities by covering the soil surface with the impermeable plastic film under the litter. Therefore, we also chose the same method to measure the interception capacity of straw. Straw interception storage is calculated as the difference between rainfall input and runoff output.
The second type of field test was conducted without plastic film to analyze the runoff and sediment production process on the natural soil surface (Figure 1d). Except for the underlying surface conditions, all test conditions for the two field tests are the same. During each simulated rainfall event, a 500 mL measuring cylinder collects runoff containing sediment. After runoff was generated, the runoff was measured every 2 min in the first 10 min and then every 3 min. The sediment was then transferred to a beaker, placed in a ventilated oven at 105 °C for 12 h, and weighed to determine the sediment yield. The infiltration rate was calculated by subtracting the runoff rate from the measured rainfall intensity [12]. The soil loss rate was calculated based on sediment produced per unit area per period.

2.5. Research Methods and Data Analysis

2.5.1. Improved Merriam Interception Model

Although the canopy interception process is often considered in hydrological models, few models are used to characterize the interception process of surface cover. Considering the similarity between ground cover interception and canopy interception, previous canopy interception models can guide ground cover interception well. The Merriam interception model used to simulate canopy interception can be described as follows [54]:
E c i = C θ 1 e c P + k P
where Eci is the canopy interception (mm), C is the interception (mm), θ is the initial moisture content of the mulch (mm), c is the effective interception coefficient, k is the evapotranspiration, and P is the storm precipitation (mm).
Since the straw sample was dried before the test, evaporation can be ignored during the 40 min rainfall process; so, the straw’s initial moisture content and evaporation are set at 0 mm. According to the experimental data, the model described in the above formula is modified to simulate the interception process of straw mulching with time. The corrected model is:
C t = C θ 1 e I t c C θ + k P
where Ct is the cumulative interception at time t and I is the rainfall intensity.
The Nash–Sutcliffe efficiency coefficient (NSE) and determination coefficient (R2) were used to evaluate the performance of the model. R2 can be obtained through a regression analysis using SPSS (IBM, Armonk, NY, USA) software. The NSE calculation method is as follows [50]:
N S E = 1 i = 1 n ( O i S i ) 2 i = 1 n ( O i O ) 2
where Oi and Si are the observed and simulated values of the ith pair, respectively; n is the total number of paired values; and O is the average of the observed values. Note that the NSE can vary between −∞ and 1, and the closer the NSE is to 1, the more accurate the model is.

2.5.2. Analysis of the Benefits of Water and Sand Reduction

The runoff and sediment reduction benefits under different mulching methods are determined using the following equation [11]:
R R B = R 0 R i R 0 × 100 %
S R B = S 0 S i S 0 × 100 %
where RRB is the runoff reduction benefit (%), SRB is the sediment reduction benefit (%), R0 is the runoff yield for the bare slope(mm), Ri is the runoff yield (mm) for different mulching methods, S0 is sediment yield for the bare slope (g m−2), and Si is the sediment yield (g m−2) for different mulching methods.

2.5.3. Data Analysis

Duncan’s tests were conducted using SPSS 22.0 (IBM, Armonk, NY, USA) to compare the differences in initial runoff time, runoff yield, and sediment yield between mulching methods at the 0.05 significance level. The relationship between slope runoff yield and sediment yield under different mulching conditions was explored using regression analysis. Moreover, a structural equation model (SEM) was established using Amos 21.0 to explore the direct and indirect relationship between straw mulching variables and sediment yield. After the completion of the model construction, the fitting test is carried out. χ2/df < 2, p > 0.05, RMSEA < 0.05, and GFI > 0.95 are considered to indicate a good fit [55]. The illustrations were designed using Origin 9.0 (Originlab, Northampton, MA, USA) and ArcGIS 10.2 (ESRI, Redlands, CA, USA).

3. Results

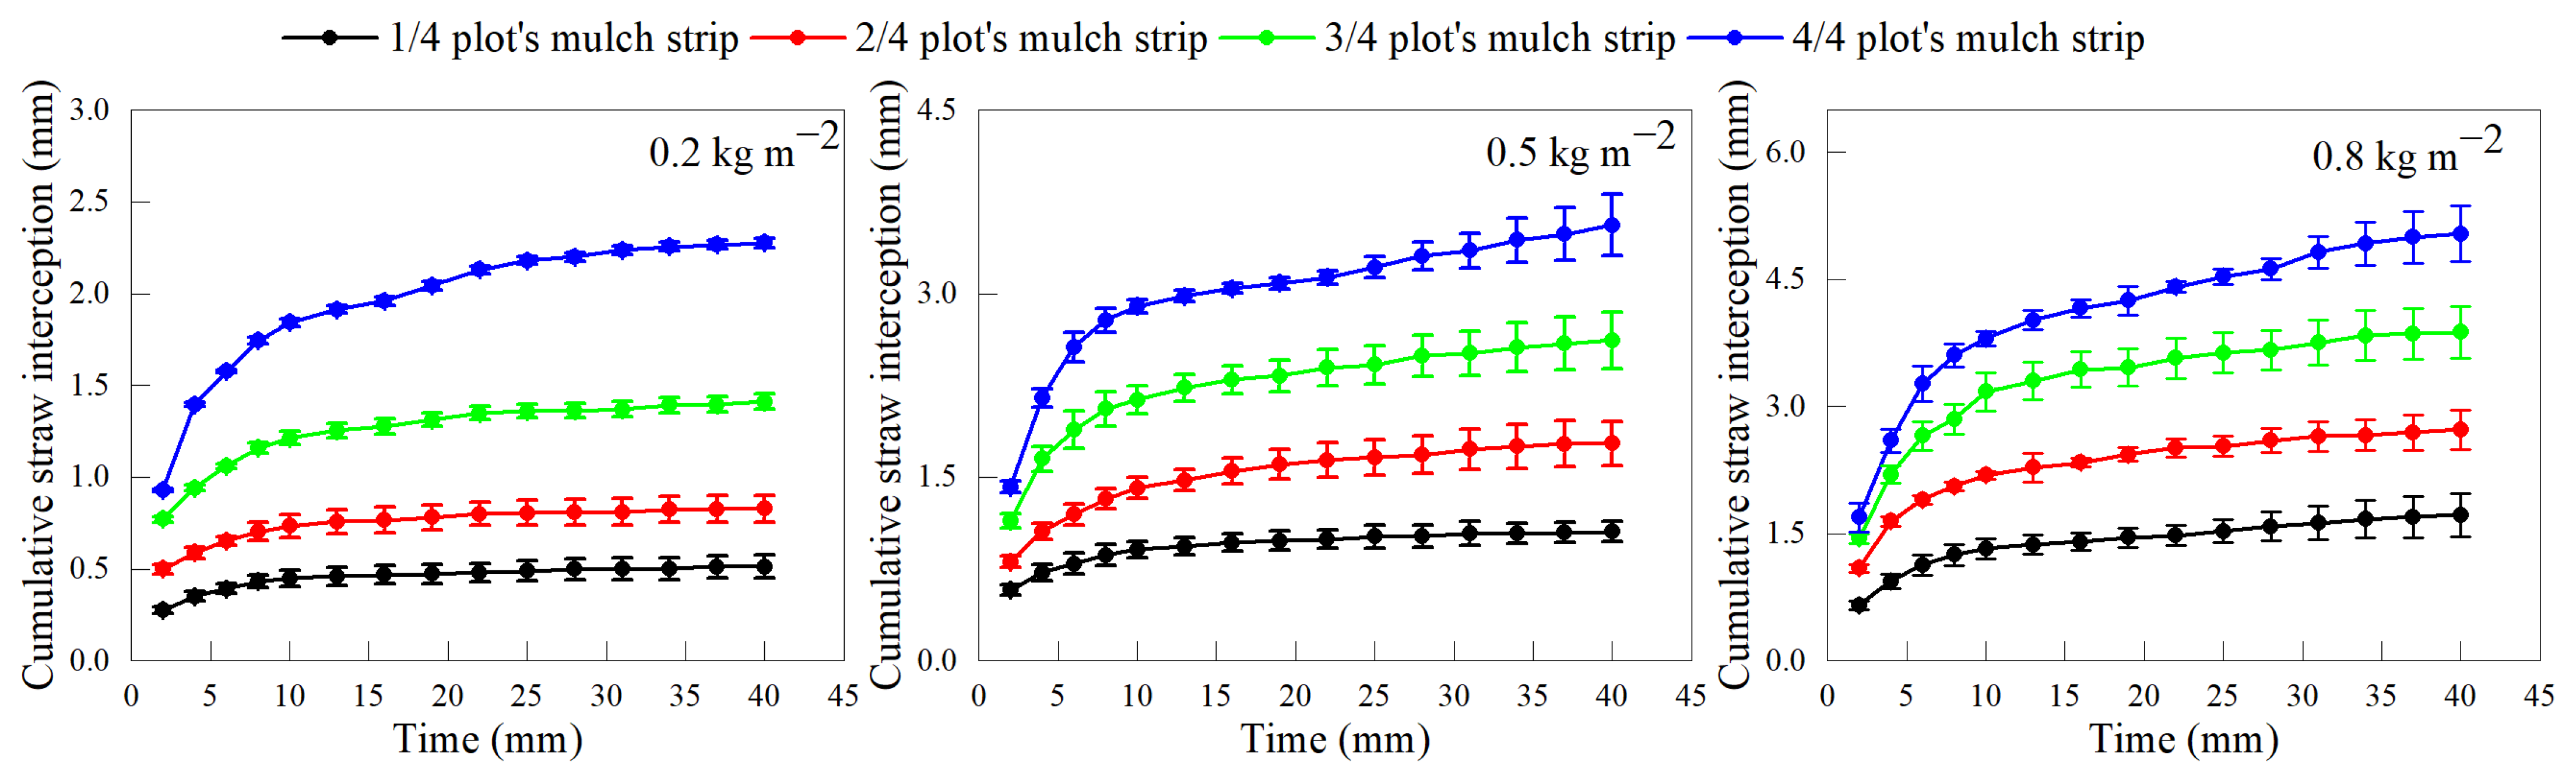
3.1. Interception Process of Different Straw Mulching Methods

Through the first type of experiment, the study obtained the variation in interception capacity with rainfall duration for different straw mulching methods. The results of the interception duration curve show that the interception process is similar for the different straw mulching methods (Figure 3). The interception process can be divided into the rapid wetting stage and the saturated stable stage. In the rapid wetting stage, the interception rate decreases rapidly with the rapid increase in the moisture content of straw. Then, with the increased straw moisture content, the interception rate slowly decreases to a stable level. The total interception of straw under different mulching methods ranges from 0.5 to 5.04 mm. The total interception increases with the increasing straw coverage rate and mulching strip length.

3.2. Influence of Different Straw Mulching Methods on the Runoff and Soil Erosion

3.2.1. Initial Runoff Time

Through the second type of experiment, the study obtained the effect of different straw mulching methods on the initial runoff time, runoff, and soil erosion. Table 2 shows the effect of different straw mulching methods on the initial runoff time. The results show that the initial runoff time is 61.2 s on bare slopes and between 335.4 and 1500.4 s on slopes with different mulching treatments. The initial runoff time on straw-mulched slopes was 274.2–1439.2 s longer than on bare slopes, and the straw mulch delayed the generation of slope runoff. Overall, the initial runoff time increased with increasing straw coverage rates and mulching strip lengths. The statistical results show a significant difference (p < 0.05) in the initial runoff time between covering 1/4 of the slope length and the bare slope. Covering only 1/4 of the slope length with straw was effective in delaying the generation of runoff. Moreover, there was no significant difference in the initial runoff time between 0.5 kg m−2 and 0.8 kg m−2 coverage rates when the mulching strip length was the same. Therefore, after increasing the straw coverage rate to 0.5 kg m−2, further increases in coverage rate will not significantly increase the time of delayed runoff production. When the straw coverage rates were 0.5 kg m−2 and 0.8 kg m−2, there was no significant difference in the initial runoff time between covering 3/4 and 4/4 of the slope length. Therefore, when the coverage rates are 0.5 kg m−2 and 0.8 kg m−2, after the coverage exceeds 3/4 of the slope length, further increasing the mulching strip length will not significantly increase the time of delayed runoff generation.

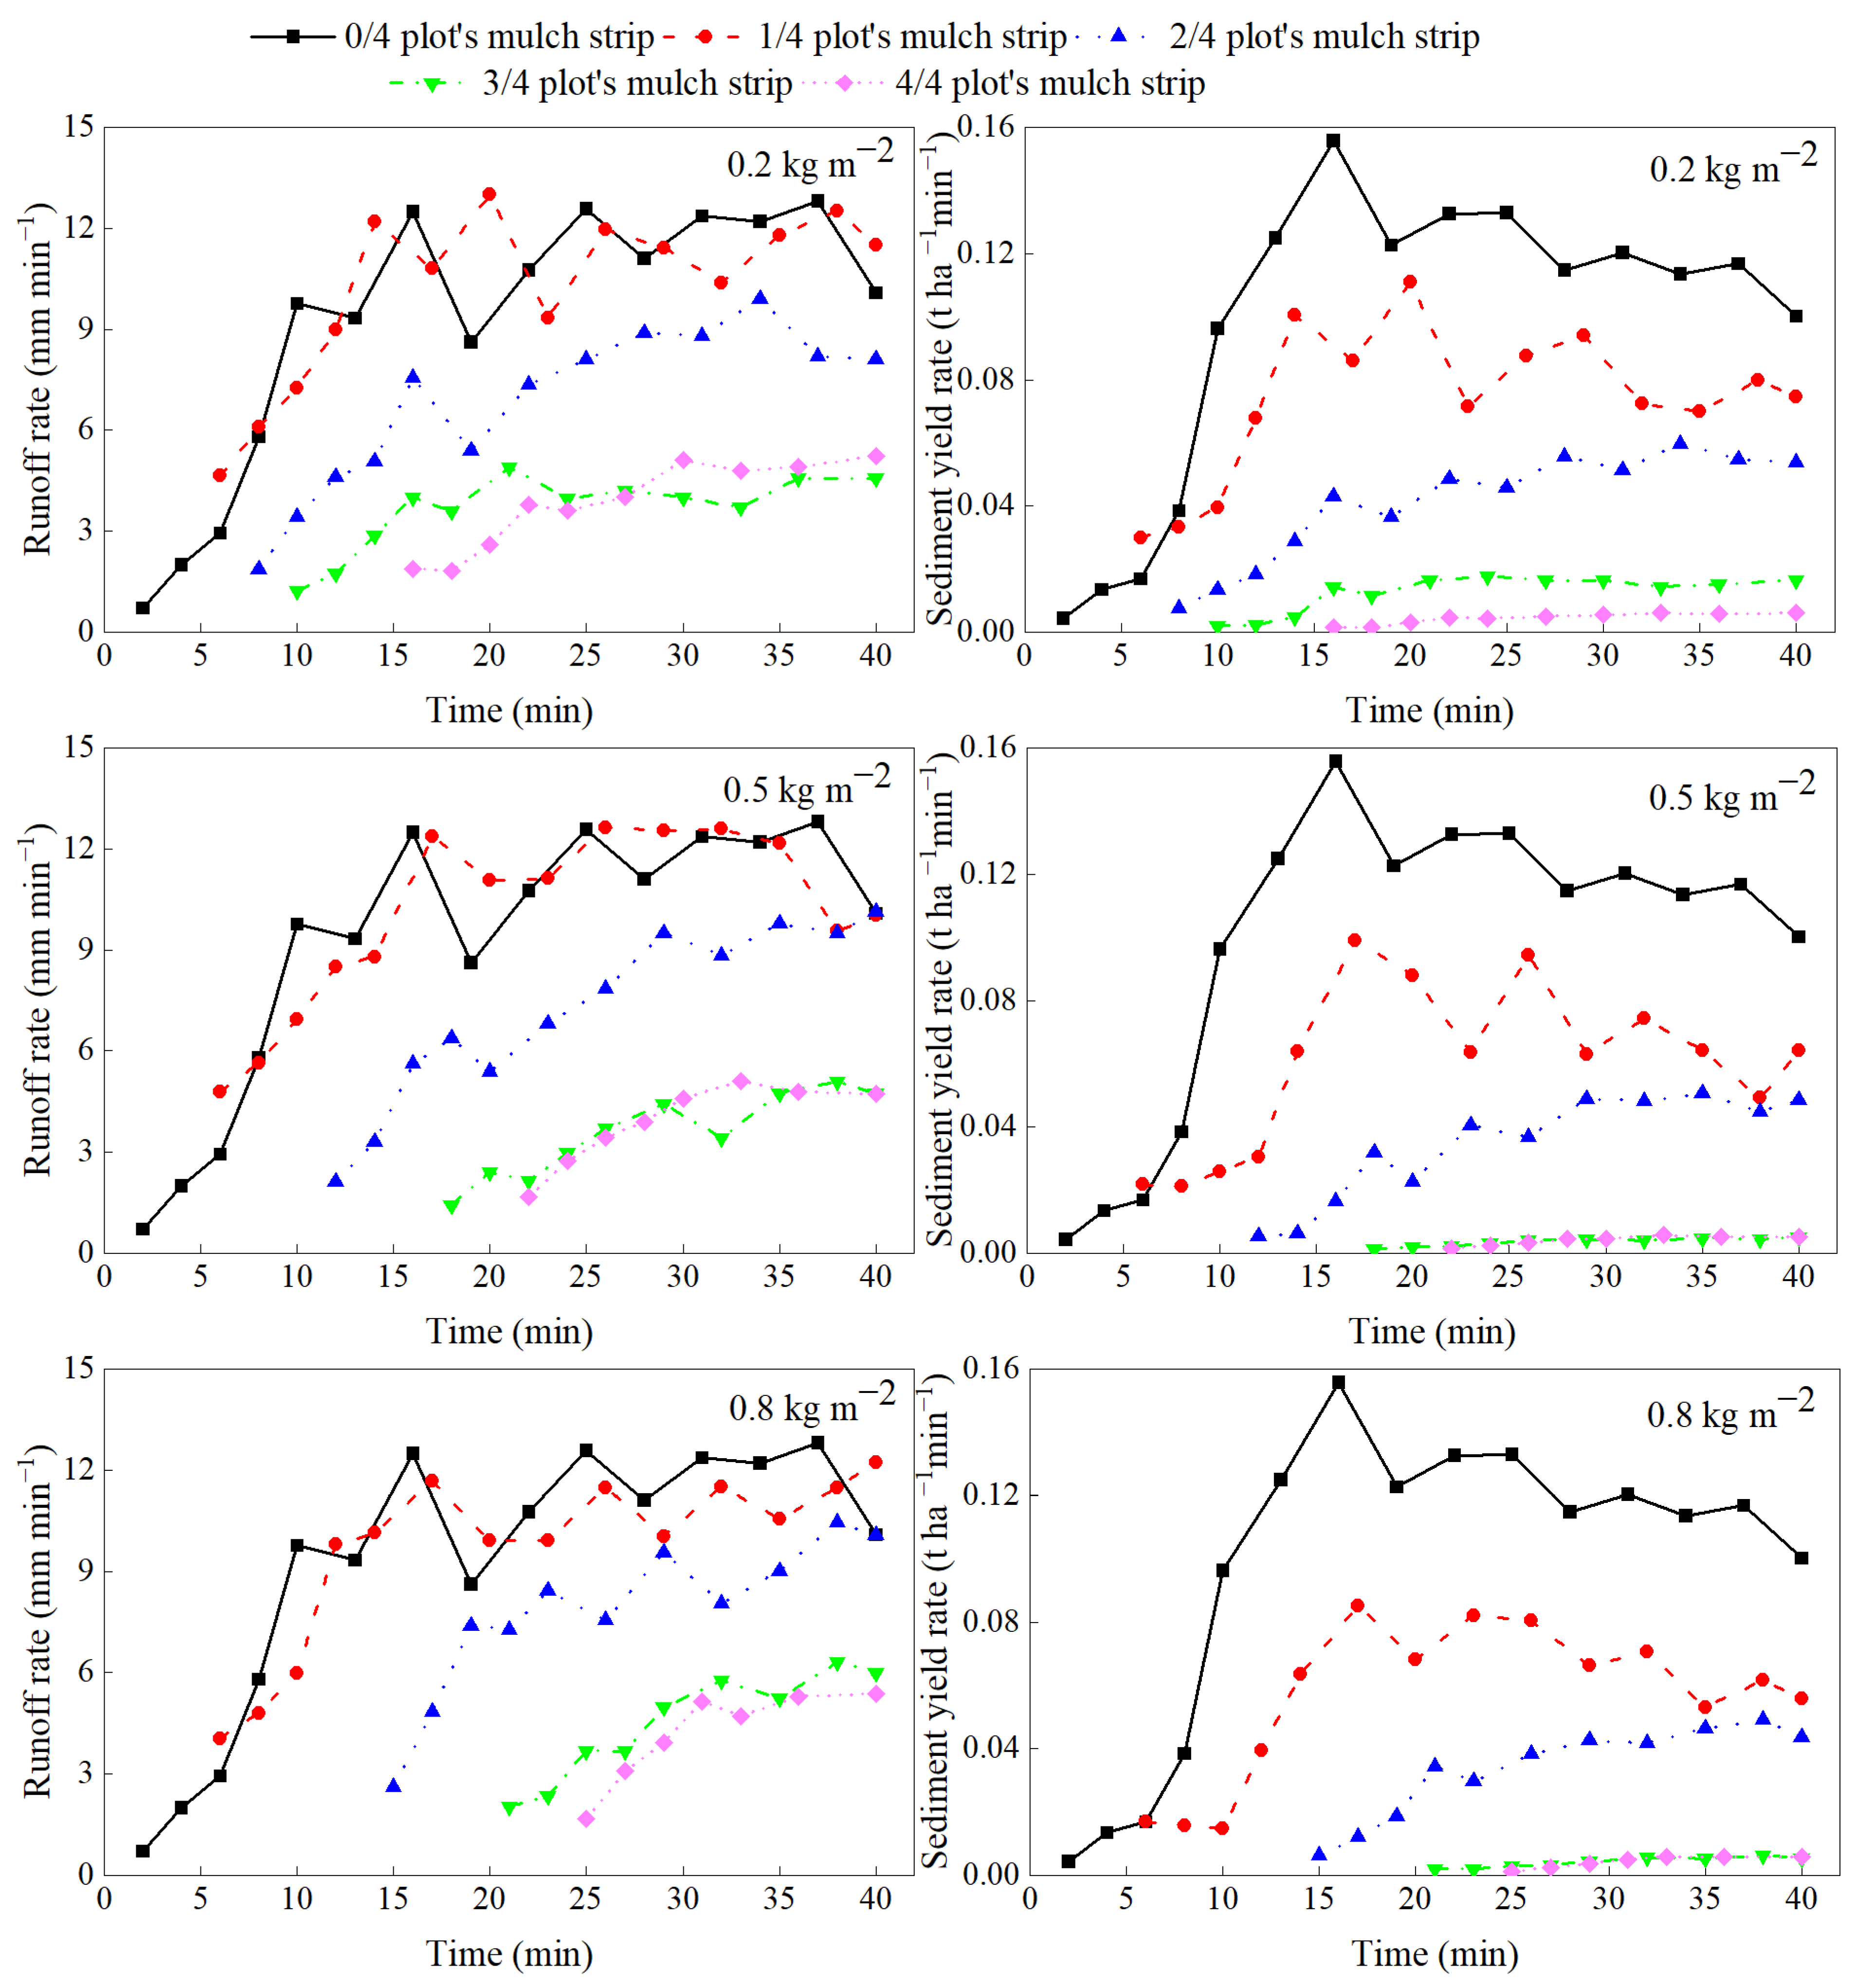
3.2.2. Runoff and Soil Erosion Processes

Figure 4 shows the curves of the runoff rate and sediment yield rate with rainfall time for the different treatments. The process of runoff production on the bare slope can be roughly divided into the stage of the rapid increase in runoff rate and the stage of stable runoff production. The sediment yield process on the bare slope is that the sediment yield rate first increases, then decreases, and finally tends to stabilize. When straw covers only 1/4 of the slope length, the runoff and sediment yield processes are similar to those of the bare slope, but the sediment yield rate is significantly lower than that of the bare slope. When the straw covers 1/2 or more of the slope length, the rates of runoff and sediment yields increase with the increase in rainfall duration, and the runoff and sediment yield rates are significantly lower than those of the bare slope.

3.2.3. Relationship between Runoff Rate and Sediment Yield Rates

The linear regression equation between runoff rate and sediment yield rate for the different treatment plots showed a positive correlation between runoff rate and sediment yield rate (R2 > 0.76) (Figure 5). Overall, the gradient of the regression line decreases as the straw mulching strip length and the mulching rate increase. The gradient of the bare slope (0.011) is the largest, and the gradient of straw mulch (0.001–0.0087) is smaller than that of the bare slope. It can be seen that straw mulch significantly reduces the sediment carrying capacity of runoff.

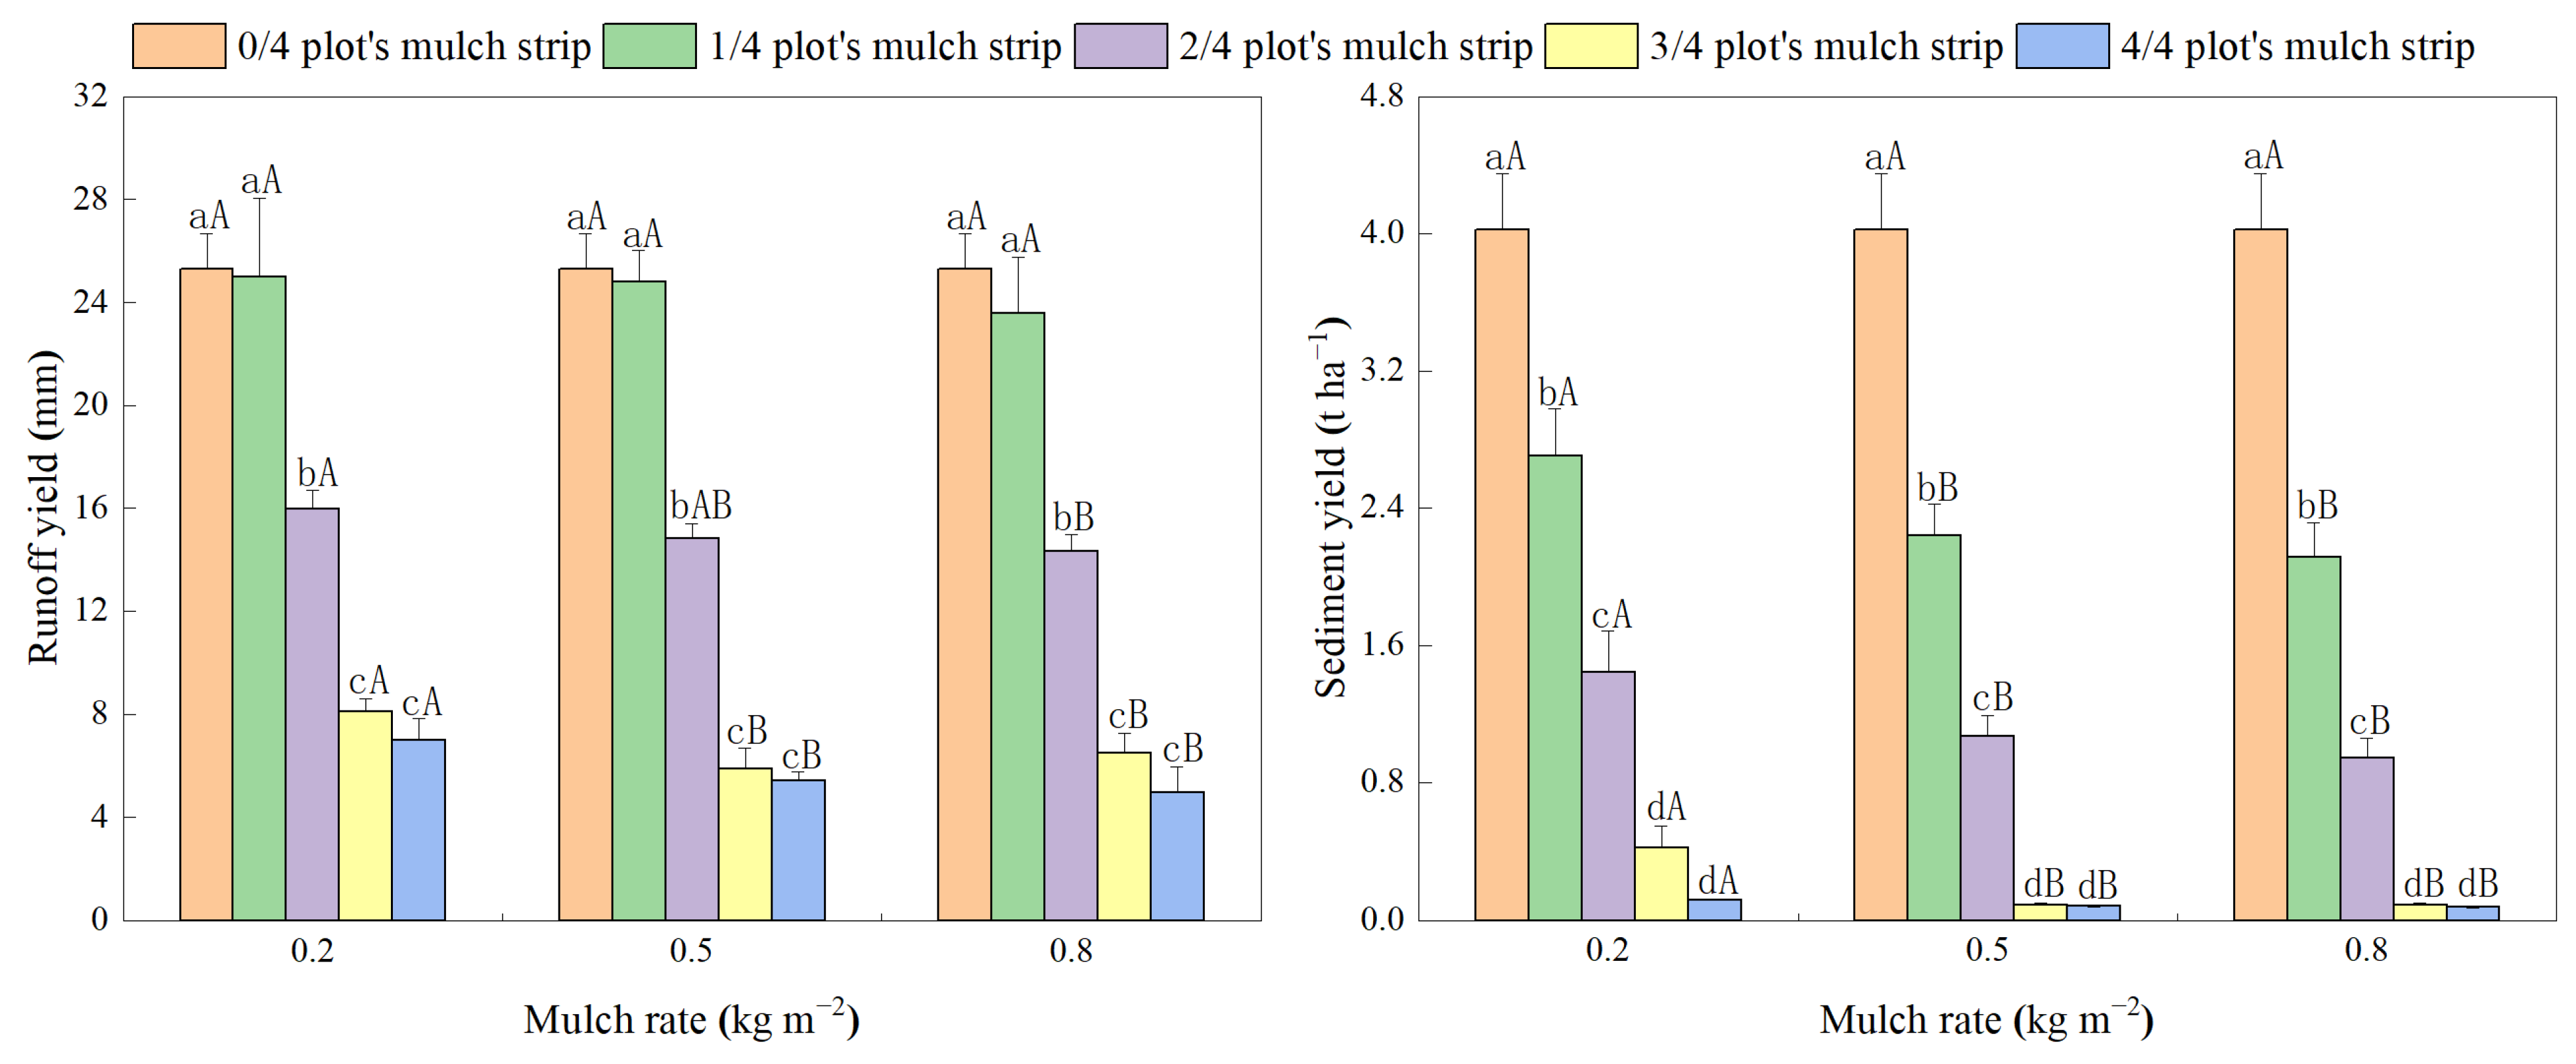
3.2.4. Runoff and Sediment Yields

Figure 6 shows the runoff and sediment yields by different straw mulching methods. The runoff and sediment yields on the bare slope were 25.3 mm and 4.03 t ha−1, respectively, while the runoff and sediment yields on the slope with different mulching methods ranged from 4.97 to 25.01 mm and 0.08 to 2.7 t ha−1, respectively. The mulching treatment reduced the slope flow and sand production to varying degrees. Overall, there were significant differences in sediment yield between different mulching methods and bare slopes. However, there were no significant differences in runoff yield between mulching 1/4 of the slope length and bare slopes. Thus, covering only 1/4 of the slope length can significantly reduce the sediment yield but not the runoff yield. The statistical results show that when the coverage rate is the same, there is no significant difference in runoff and sediment yields between covering 3/4 of the slope length and 4/4 of the slope length. Therefore, after the straw has covered more than 3/4 of the slope length, increasing the mulching strip length will not significantly reduce the runoff and sediment yields any further. In addition, there was no significant difference in sediment yield between 0.5 kg m−2 and 0.8 kg m−2 coverage rate when the cover strips were the same length. Therefore, after a straw coverage rate greater than 0.5 kg m−2, increasing the coverage rate cannot significantly reduce sediment yield.

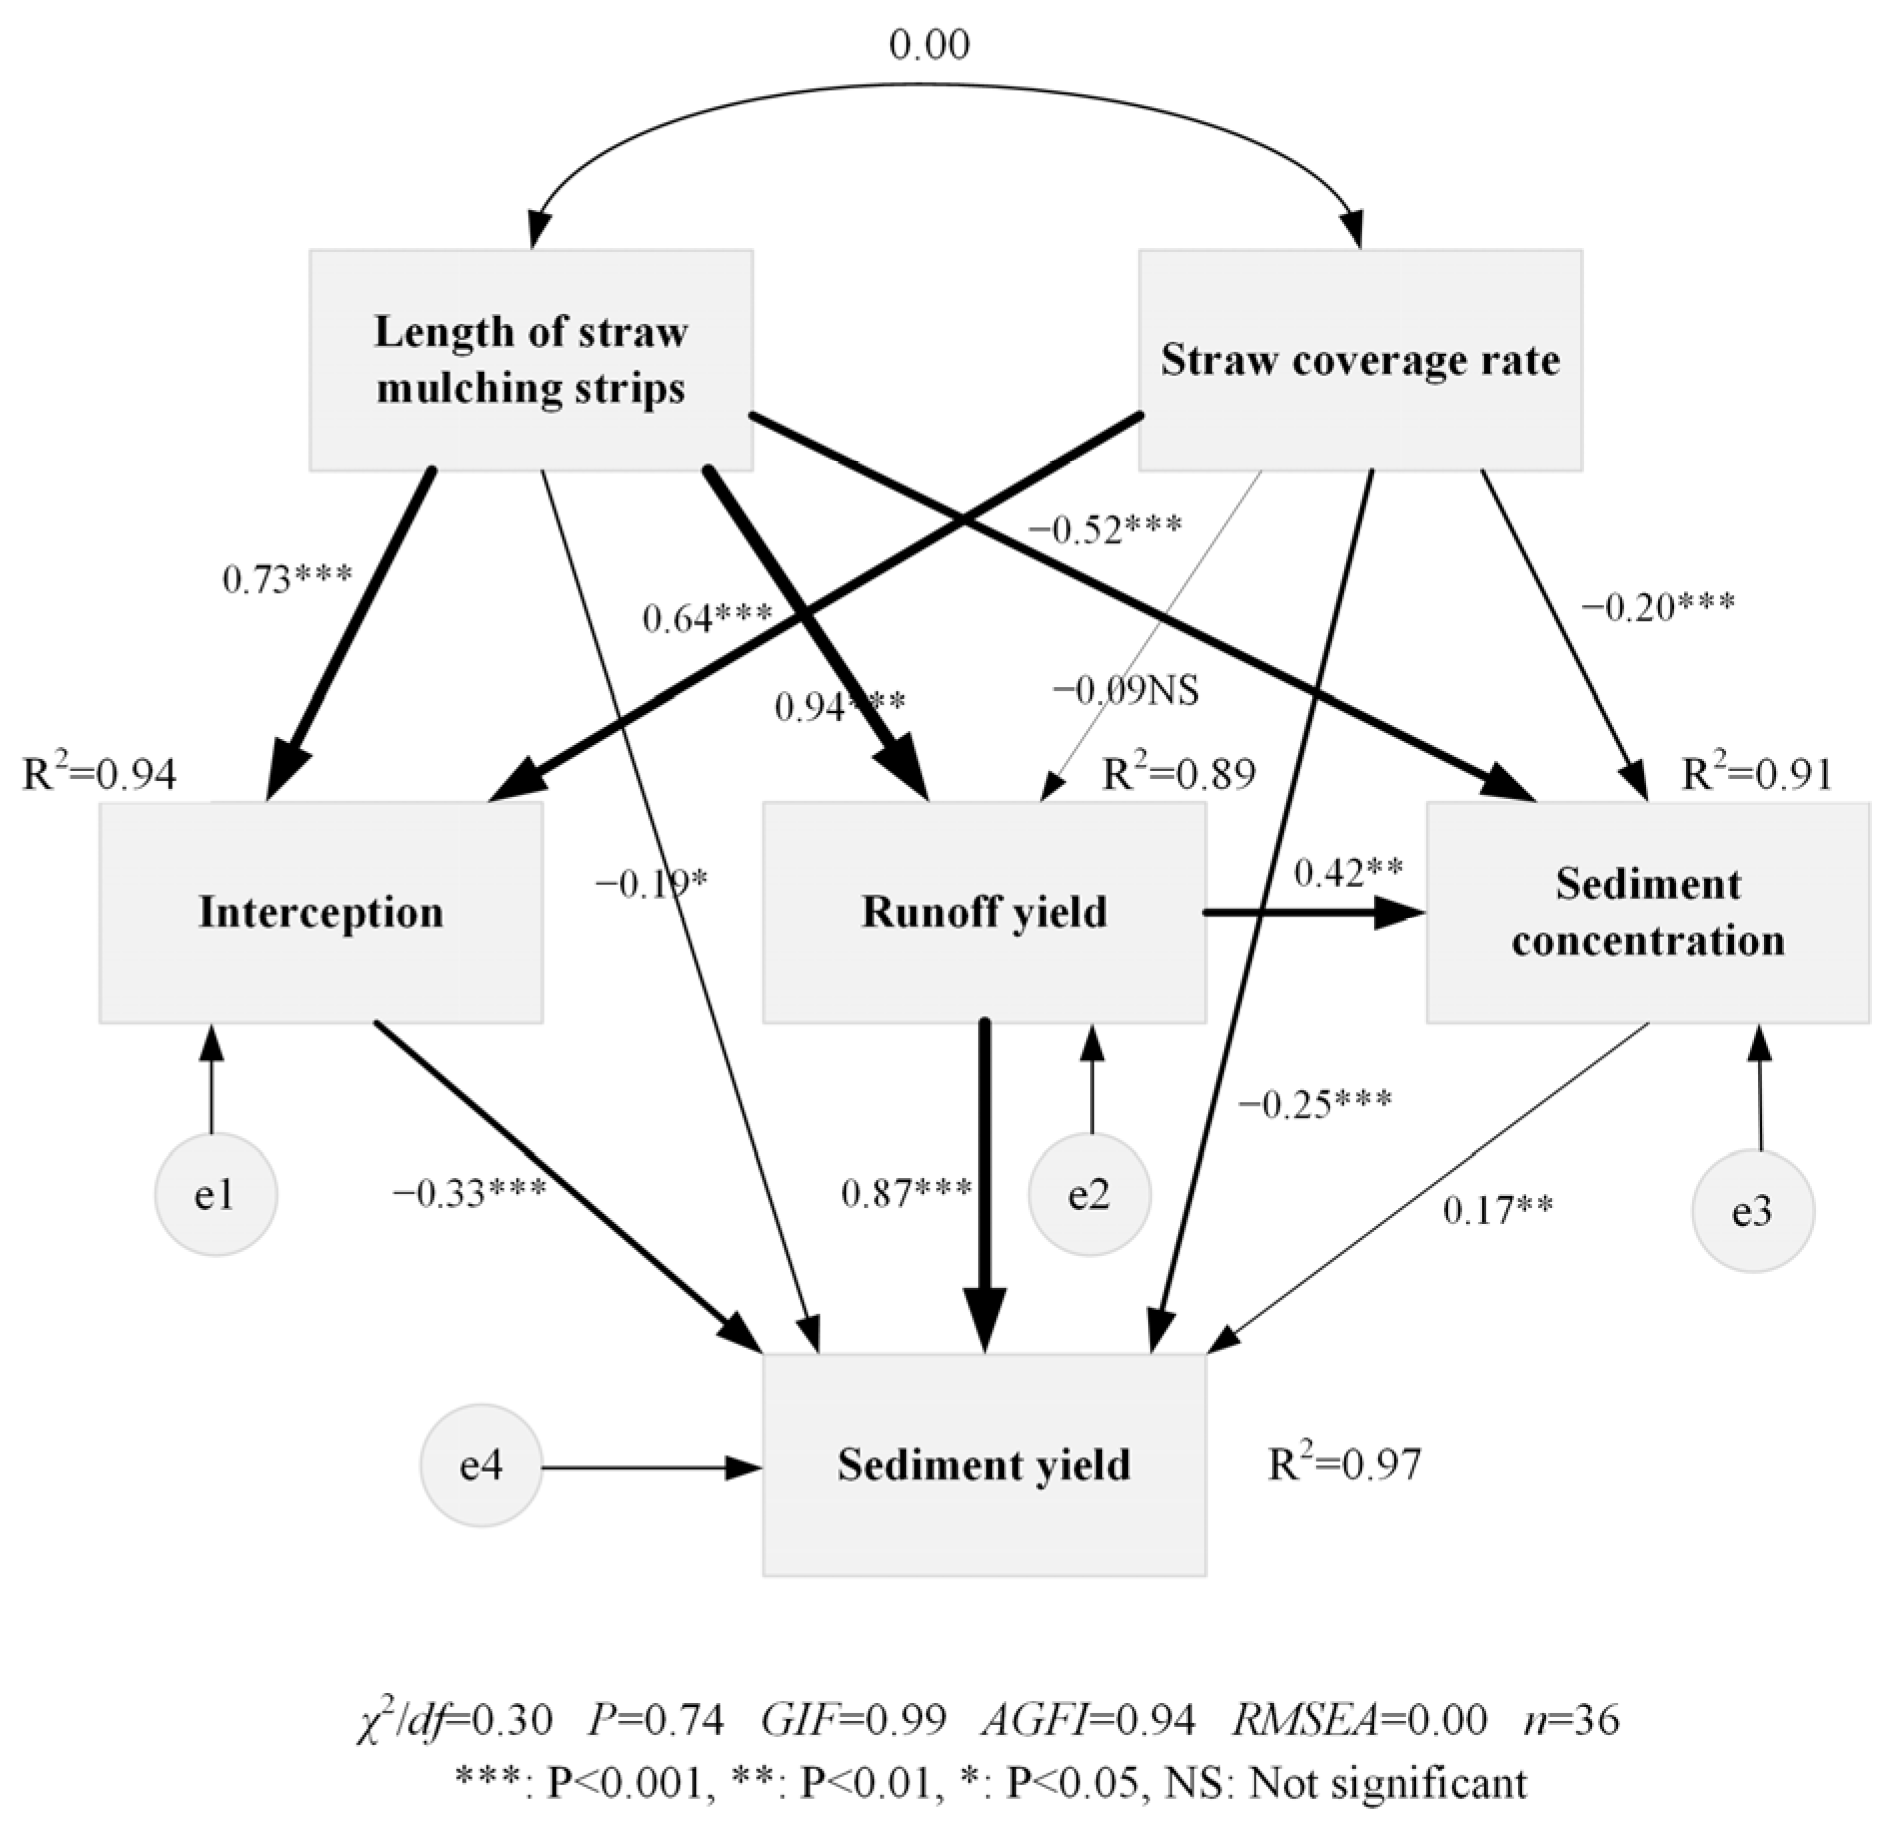
3.3. The Role of Straw Mulching Parameters on Soil Water Erosion

Our model explained 97% of the variance in the sediment yield (Figure 7). In the model, the direct effect is given by the path coefficient (β) between the two variables. The straw mulching strip length had a direct negative effect on the sediment yield (β = −0.2) and indirectly influenced the sediment yield through a positive influence on the interception and a negative influence on the runoff and the sediment concentration (β = 0.7, −0.9 and −0.5, respectively). The straw coverage rate had a direct negative effect on the sediment yield (β = −0.3) and indirectly influenced the sediment yield through a positive influence on the interception and a negative influence on the sediment concentration (β = 0.6 and −0.2, respectively). The straw coverage rate has no significant effect on the runoff. The influence path coefficients of interception, runoff, and sediment concentration on sediment yield are −0.3, 0.9, and 0.2, respectively. Furthermore, Table 3 presents the decomposition of the correlations into direct, indirect, and total effects on the sediment yield. The total effect of straw mulching strip length and coverage rate on the sediment yield was −0.9 and −0.3, respectively, with mulching strip length having a more significant effect on the sediment yield than the coverage rate had.

4. Discussion

4.1. Straw Interception Models for Different Mulching Methods

Mulch interception is an important factor in water balance and plays an important role [15]. In this study, the straw intercepted 1.3–12.6% of the rainfall. Previous studies also reported that interception loss by mulch ranged from 1 to 70% of the rainfall [56]. Mulch interception is mainly influenced by mulch quality [18,57]. The results of our study showed that straw interception increased with increasing straw mulching strip lengths and coverage rates. In addition, the cumulative interception storage capacity is an instantaneous value during rainfall and is determined by the amount of water that can be retained in the mulch. Du et al. [23] showed that litter interception is also affected by the saturation rate of the litter layer. However, in some models, interception is not considered a separate process [13] or is even ignored altogether [14]. Canopy interception processes are often considered in hydrological models (such as the Gash, Rutter, and Merriam models), but few models are used to represent the interception process of the mulch layer [17,50]. This study uses the modified Merriam interception model to describe the measured interception duration curve. The results of the study showed that the R2 of the model ranged from 0.91 to 0.98, and the NSE ranged from 0.75 to 0.93 (Table 4). The modified Merriam interception model can be used to describe the change of interception with time under straw mulching conditions.

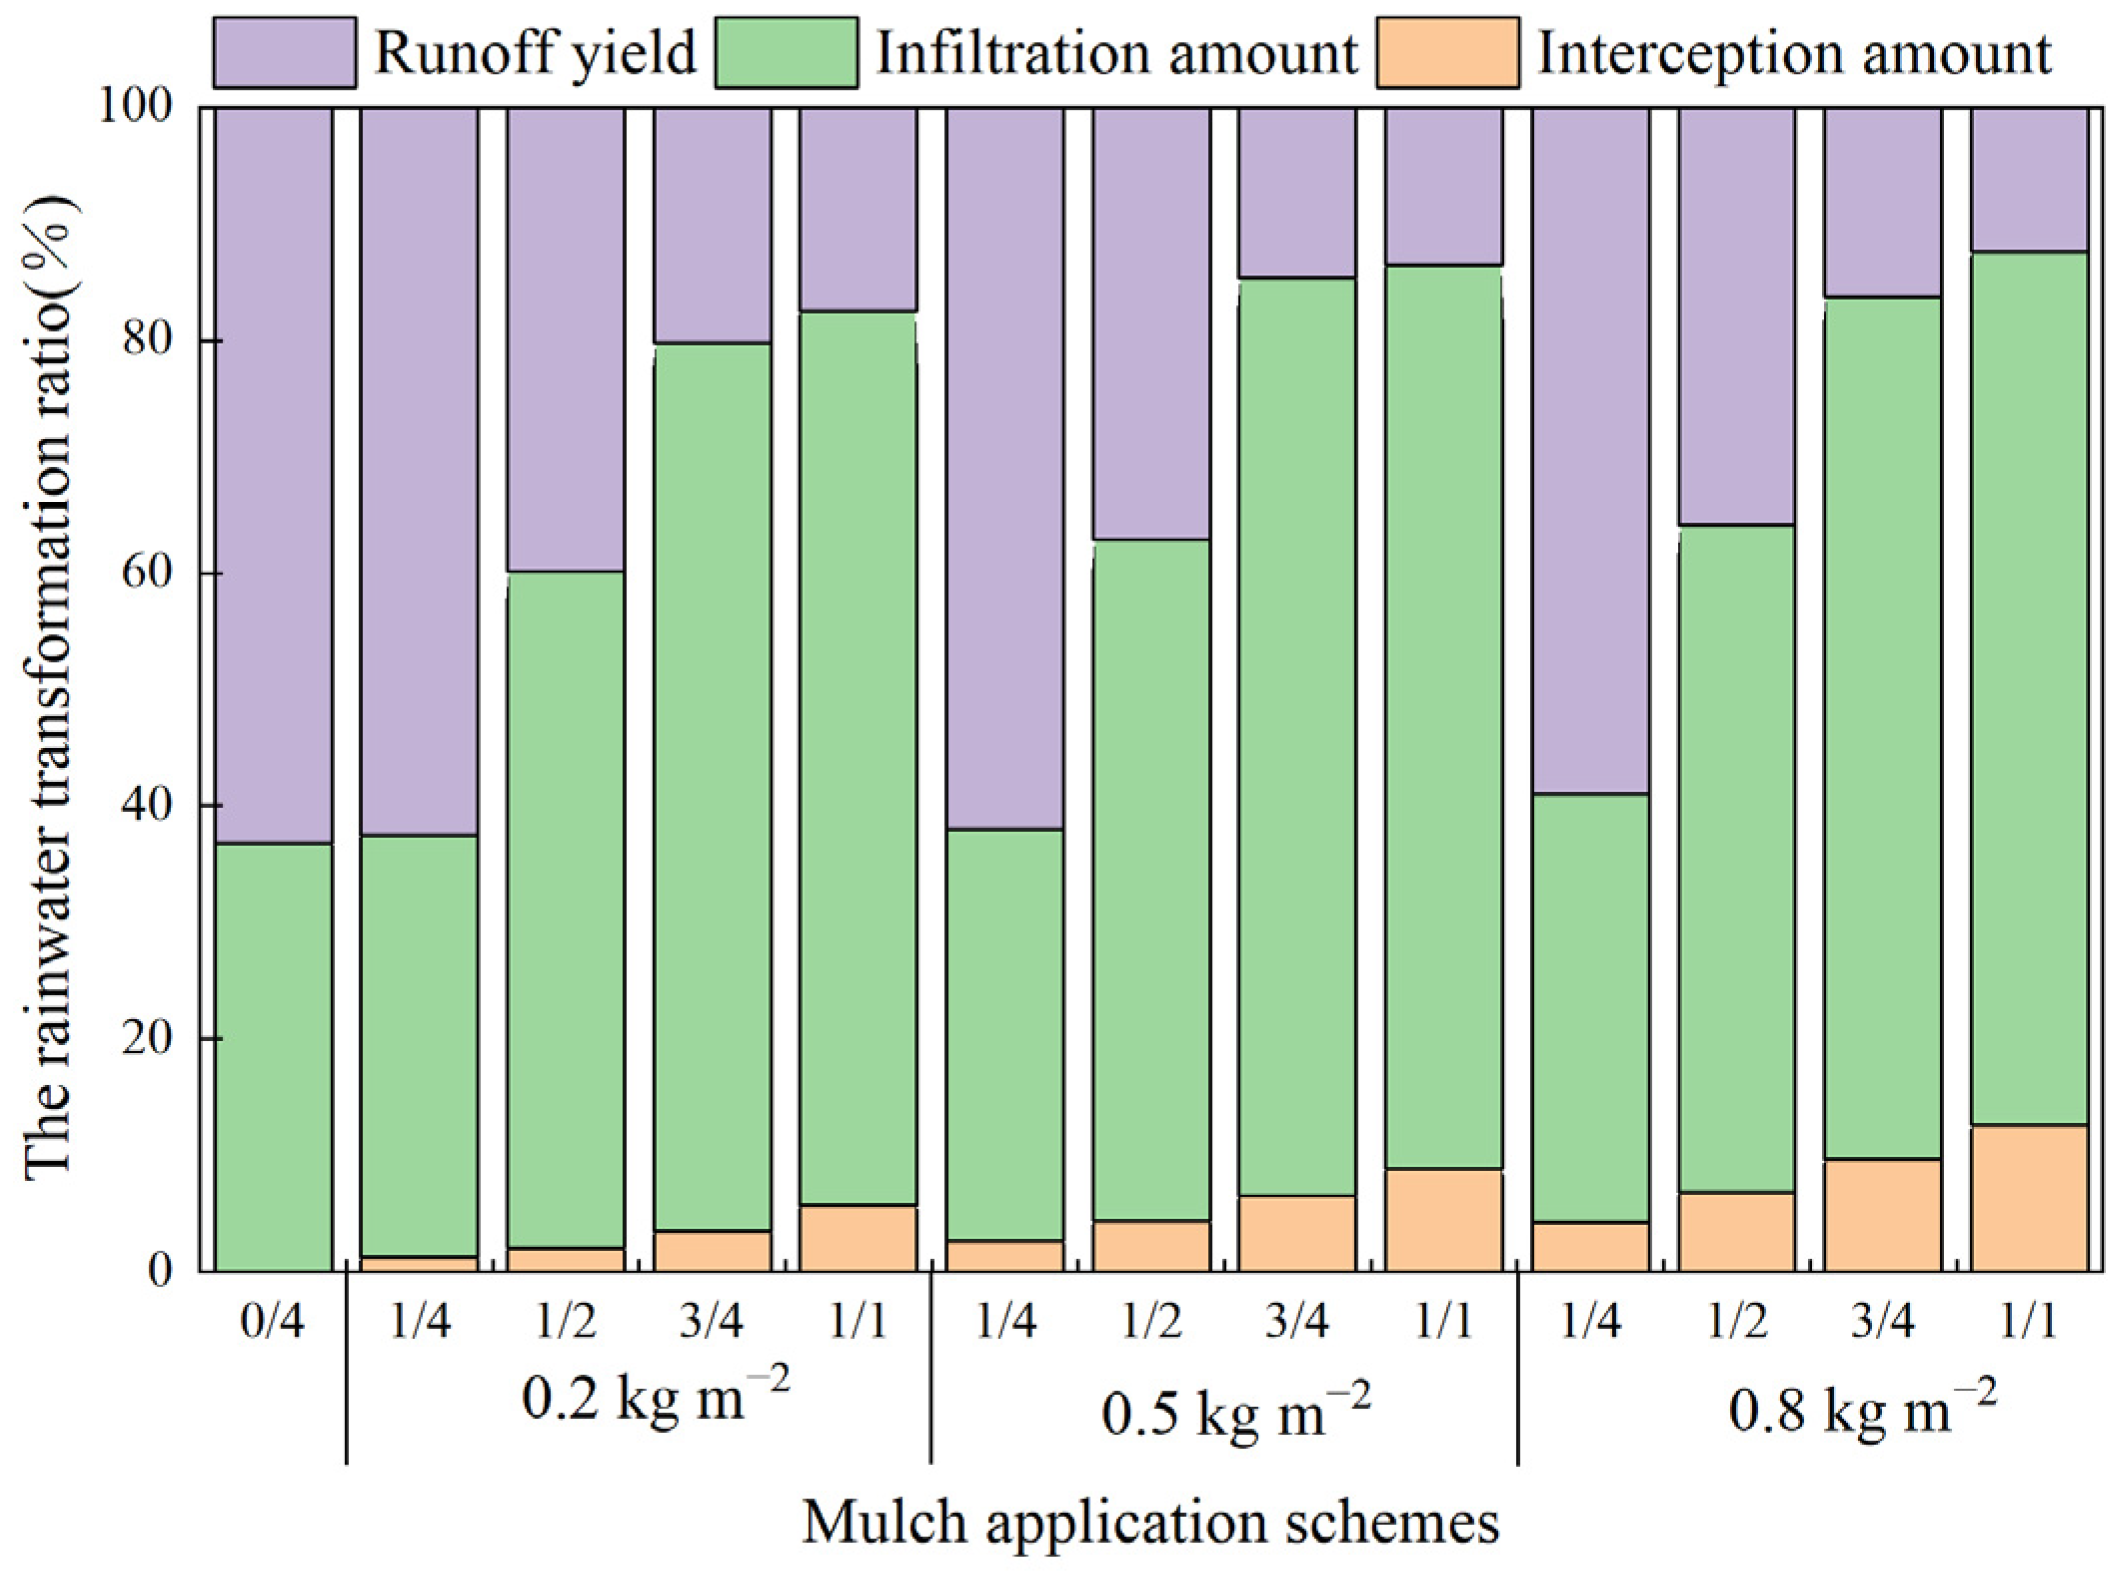
4.2. Effect of Different Mulching Methods on Rainwater Partitioning

Straw mulching intercepts runoff and inhibits runoff production [16,41]. Straw mulching also prevents raindrops from hitting the soil surface and weakens soil sealing [23]. Straw mulching also reduces the slope flow velocity, allowing more time for runoff to infiltrate into the soil [26,57]. These factors change the proportion of rainfall converted to infiltration, runoff, and interception. In this study, the proportions of rainwater converted to infiltration, runoff, and interception are referred to as the infiltration, runoff, and interception coefficients, respectively (Figure 8). The results show that the runoff, infiltration, and interception coefficients for different mulching methods ranged from 12.4 to 62.5%, 36.2 to 78.8%, and 1.3 to 12.6%, respectively. The bare slope’s runoff, infiltration, and interception coefficients were 63.3%, 36.8%, and 0%, respectively. Overall, straw mulching increased the rainfall converted to infiltration and decreased the proportion of runoff. This phenomenon was also observed by Jourgholami et al. [57] and Parhizkar et al. [16].
The effect of straw on rainfall partitioning is also influenced by the mulching methods [40,41]. The SEM results showed that the total effect of straw mulching strip length on the runoff and sediment yields was more significant than the straw coverage rate’s (Table 3). The straw mulching strip length was a more critical factor in controlling soil erosion in fallow farmland. Prats et al. [40] also found that the change in erosion response mainly depends on the straw mulching strip length. The results of our test show that runoff is the dominant hydrological process when the straw covers none and 1/4 of the slope length (runoff coefficient > 58.9%). As the straw mulch strip length increases, the infiltration process becomes dominant when the straw mulch exceeds 1/2 of the slope length (infiltration coefficient > 57.3%). Abrantes et al. [41] also tested the effectiveness of straw mulching, but only at the bottom of slopes, in controlling erosion in their trial. They found that mulching the entire length of the flume and mulching 2/3 of the length of the flume was more effective in reducing runoff than mulching 1/3 of the length of the flume. Furthermore, at a straw cover of 3/4 of the slope length and a coverage rate of 0.5 kg m−2, the slope infiltration coefficient was the highest (78.8%) and most favorable for rainwater collection. That is, it is not the case that the greater the amount of straw covered, the greater the proportion of rainfall converted to infiltration. The interception of larger amounts of straw may apportion away the proportion of rainfall converted to infiltration. Whereas the intercepted rainfall flows out of the slope with time on the one hand [18,23], on the other hand, it will infiltrate into the soil and evaporate with time [58].

4.3. Effectiveness of Different Straw Mulching Methods in Controlling Soil and Water Losses

The SEM results showed that straw mulching had direct and indirect effects on sediment yield (Figure 7). The straw mulch protects the soil from the direct impact of raindrops during rainfall [29,32] and prevents spattered soil from being washed away by runoff. Straw mulching can also indirectly affect sediment yield by increasing interception, reducing runoff, and decreasing the sediment carrying capacity of runoff [16]. Overall, the sediment reduction benefits by covering (32.75–98.1%) are greater than the runoff reduction benefits (1.1–80.4%) (Figure 9), which is consistent with the previous research results [32,34,40].
Mulching a part of a hillside is an effective way to reduce the cost of mulching [41]. Martinez-Raya et al. [59] found that mulching four 3 m strips of thyme on a 24 m long plot reduced soil erosion by 97%. Harrison et al. [60] found a similar reduction (97% reduction in erosion) in a 1.25 m long (equivalent to 1/4 of the slope length covered) strip of forest litter covering the base of a 5 m long slope through field experiments. However, our study further observed that at least 3/4 of the slope length needed to be covered to achieve this value when using straw mulch. When the straw mulching rate is 0.2 kg m−2, the whole slope needs to be covered to reach this value. Moreover, Bhatt and Khera [43] found that the reduction in soil erosion (66% reduction) when covering the whole 5 m long plot with 0.6 kg m−2 straw was similar to that when covering only 1/3 of the slope length of the plot (52% reduction). Our study further found that on a 10 m plot, 3/4 of the slope length needed to be covered to reduce soil erosion as effectively as covering the whole slope but only covering 1/2 of the slope could reduce sediment by 64–77%. Furthermore, Prats et al. [40] observed that forest residues with a 50% ground coverage rate could significantly reduce soil erosion only when mulching the whole plot (mulching 1/3, 2/3, and 3/3 of the flume’s length). For a 70% ground coverage rate, all mulching methods can significantly reduce soil loss but not runoff. However, our study observed that three coverage rates (0.2, 0.5, and 0.8 kg m−2) and four cover strip lengths (covering 1/4, 1/2, 3/4, and 4/4 of the slope length) significantly reduced sediment yield when using straw mulch. Covering only 1/4 of the slope length did not significantly reduce runoff. This is because there are still a lot of exposed surfaces when the straw only covers 1/4 of the slope length, and the infiltration of the exposed part of the slope cannot be effectively increased. In addition, small amounts of straw have limited water holding capacity [41], so it cannot effectively reduce runoff.

4.4. Limitations of This Study

It is worth noting that the simulated rainfall was conducted in small-scale plots in this study. In fact, the values observed in rainfall simulation tests on small-scale plots are often underestimated [11]. This problem exists in most experimental studies on plot measurement [61]. Wang et al. [11] compared soil erosion measurements at the plot scale and large scale and found that soil erosion measurements at the large scale were greater than those at the small scale. The intensity, rate, and duration of rainfall under rainfall simulation conditions may tend to reduce soil erosion compared to natural precipitation [62]. In the future, the effects of straw mulching on runoff and soil erosion should be investigated for different slope lengths and gradients to select corresponding straw mulching methods according to different topographic factors. Nevertheless, this study provides comparative information on how straw mulching methods affect runoff and soil erosion on sloped farmland.
In addition, the bottom of the slope has a larger catchment area and flow velocity, which makes it more likely to produce rills [63]. Our straw mulch at the bottom of the slope prevents the creation of rills and prevents the further development and spread of rills. Nonetheless, the erosion and degradation of bare soil on slopes can still occur. Mulching straw at the base of the slope only reduces soil erosion to an acceptable level. Therefore, local land management needs should be considered when using these mulching methods.

5. Conclusions

In this study, the effects of straw mulching strip length (covering 1/4, 1/2, 3/4, and 4/4 of the entire slope) and coverage rate (0.2, 0.5, and 0.8 kg m−2) on interception, infiltration, runoff, and soil erosion were investigated using bare slopes as a control. Straw mulching can intercept rainwater and delay runoff generation. The initial runoff generation time on the straw-covered slope exceeded that on the bare slope by 448.04–2351.6%. The straw mulch increases the proportion of rainwater converted to infiltration. When straw covers 3/4 of the slope length and at a coverage rate of 0.5 kg m−2, the proportion of rainwater converted into infiltration water is the largest, exceeding 42.04% of the bare slope. Moreover, the different cover methods reduce runoff and sediment production to varying degrees. Covering only 1/4 of the slope length can have a significant sediment reduction benefit and covering only 1/2 of the slope length can have a significant runoff reduction benefit. When the straw mulching strip length is consistent, the increase in the coverage rate after the coverage rate reaches 0.5 kg m−2 cannot further significantly reduce the runoff and sediment yields. When the coverage rate is consistent, increasing the mulching strip length after covering 3/4 of the entire slope cannot further significantly reduce the runoff and sediment yields.
Overall, this study shows that straw mulching at the bottom of the slope can have significant benefits in reducing runoff and sediment. Covering part of the slope is an effective way of reducing the cost of mulching, especially in situations where the level of erosion is considered acceptable or where there is a shortage of mulching material. However, we only tested the effect of different straw mulching methods on runoff and soil erosion under gentle slope conditions. The range of test slopes should be extended in the future. In addition, it should also be tested in the future where straw mulching on different parts of the slope (the top, middle, and bottom of the slope) can be more effective in controlling runoff and soil erosion.

Author Contributions

Conceptualization, X.Z. and X.S.; methodology, X.Z. and X.S.; software, N.Y.; validation, X.Z.; formal analysis, D.W.; investigation, X.Z., L.L., P.M., C.F., L.W., W.W. and Y.L.; resources, H.L.; writing—original draft preparation, X.Z.; writing—review and editing, X.Z., X.S., L.L. and D.W.; supervision, X.S.; project administration, X.S.; funding acquisition, X.S. All authors have read and agreed to the published version of the manuscript.

Funding

This research was jointly funded by the National Natural Science Foundation of China (41771259 and 41171034) and the Natural Science Basic Research Plan in the Shaanxi Province of China (2023-JC-ZD-30 and 2019JZ–45).

Data Availability Statement

The required data is presented in the manuscript. The full data will be shared upon request.

Acknowledgments

We sincerely thank the academic editor and anonymous reviewers for their insightful and constructive comments. We also thank the staff at the Xifeng Experiment Station of Soil and Water Conservation as well as Zhixu Zhang, Shaona Wang, Ruoyu Jiao, and Xuwu Wang from the Xi’an University of Technology, China, and instructors Sun, Yibao Lou, and Lanjian Feng from Northwest A&F University, China for their help in the field experiments.

Conflicts of Interest

The authors declare that they have no known competing financial interests or personal relationships that could have appeared to influence the work reported in this paper and that the research follows scientific ethics and scientific integrity.

References

  1. Souza, T.E.M.d.S.; Souza, E.R.d.; Montenegro, A.A.d.A.; Bayabil, H. Could Forage Palm and Stone Barrier Be as Effective as Native Vegetation in Controlling Runoff and Erosion in the Brazilian Semiarid Region? Agronomy 2023, 13, 3026. [Google Scholar] [CrossRef]
  2. Li, X.; Wang, X.; Gu, J.; Sun, C.; Zhao, H.; You, S. Temporal and Spatial Variation in Rainfall Erosivity in the Rolling Hilly Region of Northeast China. Agronomy 2023, 13, 2877. [Google Scholar] [CrossRef]
  3. Liang, X.; Song, K.; Zhang, Y.; Huang, H.; Wang, Y.; Cao, Y. Effects of Different Tillage Practices on Slope Erosion Characteristics of Peanut Field. Agronomy 2023, 13, 2612. [Google Scholar] [CrossRef]
  4. Rahma, A.E.; Wang, W.; Tang, Z.; Lei, T.; Warrington, D.N.; Zhao, J. Straw mulch can induce greater soil losses from loess slopes than no mulch under extreme rainfall conditions. Agric. For. Meteorol. 2017, 232, 141–151. [Google Scholar] [CrossRef]
  5. Omidvar, E.; Hajizadeh, Z.; Ghasemieh, H. Sediment yield, runoff and hydraulic characteristics in straw and rock fragment covers. Soil Tillage Res. 2019, 194, 104324. [Google Scholar] [CrossRef]
  6. Zhang, J.; Duan, L.; Liu, T.; Chen, Z.; Wang, Y.; Li, M.; Zhou, Y. Experimental analysis of soil moisture response to rainfall in a typical grassland hillslope under different vegetation treatments. Environ. Res. 2022, 213, 113608. [Google Scholar] [CrossRef] [PubMed]
  7. Dey, D.; Gyeltshen, T.; Aich, A.; Naskar, M.; Roy, A. Climate adaptive crop-residue management for soil-function improvement; recommendations from field interventions at two agro-ecological zones in South Asia. Environ. Res. 2020, 183, 109164. [Google Scholar] [CrossRef]
  8. Yakubu, A.; Sabi, E.B.; Onwona-Agyeman, S.; Takada, H.; Watanabe, H. Impact of sugarcane bagasse mulching boards on soil erosion and carrot productivity. Catena 2021, 206, 105575. [Google Scholar] [CrossRef]
  9. Chai, Y.; Chai, Q.; Han, F.; Li, Y.; Ma, J.; Li, R.; Cheng, H.; Chang, L.; Chai, S. Increasing yields while reducing soil nutrient accumulation by straw strip mulching in the dryland wheat (Triticum aestivum L.) cropping system of Northwest China. Agric. Ecosyst. Environ. 2022, 326, 107797. [Google Scholar] [CrossRef]
  10. Foltz, R.B.; Dooley, J.H. Comparison of erosion reduction between wood strands and agricultural straw. Trans. ASAE 2003, 46, 1389–1396. [Google Scholar] [CrossRef]
  11. Wang, L.; Dalabay, N.; Lu, P.; Wu, F. Effects of tillage practices and slope on runoff and erosion of soil from the Loess Plateau, China, subjected to simulated rainfall. Soil Tillage Res. 2017, 166, 147–156. [Google Scholar] [CrossRef]
  12. Zhao, X.; Song, X.; Li, L.; Wang, D.; Meng, P.; Li, H. Effect of microrelief features of tillage methods under different rainfall intensities on runoff and soil erosion in slopes. Int. Soil Water Conserv. Res. 2023, in press. [Google Scholar] [CrossRef]
  13. Savenije, H.H.G. The importance of interception and why we should delete the term evapotranspiration from our vocabulary. Hydrol. Process. 2004, 18, 1507–1511. [Google Scholar] [CrossRef]
  14. Gerrits, A.M.J.; Savenije, H.H.G.; Hoffmann, L.; Pfister, L. New technique to measure forest floor interception—An application in a beech forest in Luxembourg. Hydrol. Earth Syst. Sci. 2010, 11, 695–701. [Google Scholar] [CrossRef]
  15. Sun, J.M.; Yu, X.X.; Li, H.Z.; Chang, Y.; Wang, H.N.; Tu, Z.H.; Liang, H.R. Simulated erosion using soils from vegetated slopes in the Jiufeng Mountains, China. Catena 2016, 136, 128–134. [Google Scholar] [CrossRef]
  16. Parhizkar, M.; Shabanpour, M.; Lucas-Borja, M.E.; Zema, D.A.; Li, S.; Tanaka, N.; Cerdà, A. Effects of length and application rate of rice straw mulch on surface runoff and soil loss under laboratory simulated rainfall. Int. J. Sediment. Res. 2021, 36, 468–478. [Google Scholar] [CrossRef]
  17. Bulcock, H.H.; Jewitt, G.P.W. Field data collection and analysis of canopy and litter interception in commercial forest plantations in the KwaZulu-Natal Midlands, South Africa. Hydrol. Earth Syst. Sci. 2012, 16, 3717–3728. [Google Scholar] [CrossRef]
  18. Xia, L.; Song, X.; Fu, N.; Cui, S.; Li, L.; Li, H.; Li, Y. Effects of forest litter cover on hydrological response of hillslopes in the loess plateau of China. Catena 2019, 181, 104076. [Google Scholar] [CrossRef]
  19. Li, X.; Niu, J.Z.; Xie, B.Y. Study on hydrological functions of litter layers in North China. PLoS ONE 2013, 8, e70328. [Google Scholar] [CrossRef]
  20. Putuhena, W.; Cordery, I. Estimation of interception capacity of the forest floor. J. Hydrol. 1996, 180, 283–299. [Google Scholar] [CrossRef]
  21. Marin, C.T.; Bouten, I.W.; Dekker, S. Forest floor water dynamics and root water uptake in four forest ecosystems in northwest Amazonia. J. Hydrol. 2000, 237, 169–183. [Google Scholar] [CrossRef]
  22. Guevaraescobar, A.; Gonzalezsosa, E.; Ramossalinas, M.; Hernandezdelgado, G.D. Experimental analysis of drainage and water storage of litter layers. Hydrol. Earth Syst. Sci. 2007, 11, 1703–1716. [Google Scholar] [CrossRef]
  23. Du, J.; Niu, J.; Gao, Z.; Chen, X.; Zhang, L.; Li, X.; van Doorn, N.S.; Luo, Z.; Zhu, Z. Effects of rainfall intensity and slope on interception and precipitation partitioning by forest litter layer. Catena 2019, 172, 711–718. [Google Scholar] [CrossRef]
  24. Girona-García, A.; Cretella, C.; Fernández, C.; Robichaud, P.R.; Vieira, D.C.S.; Keizer, J.J. How much does it cost to mitigate soil erosion after wildfires? J. Environ. Manag. 2023, 334, 117478. [Google Scholar] [CrossRef] [PubMed]
  25. Keesstra, S.; Nunes, J.; Novara, A.; Finger, D.; Avelar, D.; Kalantari, Z.; Cerdà, A. The superior effect of nature based solutions in land management for enhancing ecosystem services. Sci. Total Environ. 2018, 610–611, 997–1009. [Google Scholar] [CrossRef] [PubMed]
  26. Keesstra, S.D.; Rodrigo-Comino, J.; Novara, A.; Giménez-Morera, A.; Pulido, M.; Di Prima, S.; Cerdà, A. Straw mulch as a sustainable solution to decrease runoff and erosion in glyphosate-treated clementine plantations in Eastern Spain. An assessment using rainfall simulation experiments. Catena 2019, 174, 95–103. [Google Scholar] [CrossRef]
  27. Pannkuk, C.D.; Robichaud, P.R. Effectiveness of needle cast at reducing erosion after forest fires. Water Resour. Res. 2003, 39, 1333. [Google Scholar] [CrossRef]
  28. Mupangwa, W.; Twomlow, S.; Walker, S.; Hove, L. Effect of minimum tillage and mulching on maize (Zea mays L.) yield and water content of clayey and sandy soils. Phys. Chem. Earth. 2007, 32, 1127–1134. [Google Scholar] [CrossRef]
  29. Jordán, A.; Zavala, L.M.; Gil, J. Effects of mulching on soil physical properties and runoff under semi-arid conditions in Southern Spain. Catena 2010, 81, 77–85. [Google Scholar] [CrossRef]
  30. Foltz, R.B.; Wagenbrenner, N.S. An evaluation of three wood shred blends for postfire erosion control using indoor simulated rain events on small plots. Catena 2010, 80, 86–94. [Google Scholar] [CrossRef]
  31. Gholami, L.; Sadeghi, S.H.; Homaee, M. Straw mulching effect on splash erosion, runoff, and sediment yield from eroded plots. Soil Sci. Soc. Am. J. 2013, 77, 268–278. [Google Scholar] [CrossRef]
  32. Montenegro, A.A.A.; Abrantes, J.R.C.B.; De Lima, J.L.M.P.; Singh, V.P.; Santos, T.E.M. Impact of mulching on soil and water dynamics under intermittent simulated rainfall. Catena 2013, 109, 139–149. [Google Scholar] [CrossRef]
  33. Cerdà, A.; González-Pelayo, Ó.; Giménez-Morera, A.; Jordán, A.; Pereira, P.; Novara, A.; Brevik, E.C.; Prosdocimi, M.; Mahmoodabadi, M.; Keesstra, S.; et al. Use of barley straw residues to avoid high erosion and runoff rates on persimmon plantations in Eastern Spain under low frequency-high magnitude simulated rainfall events. Soil. Res. 2016, 54, 154–165. [Google Scholar] [CrossRef]
  34. Prats, S.A.; MacDonald, L.H.; Monteiro, M.S.V.; Ferreira, A.J.D.; Coelho, C.O.A.; Keizer, J.J. Effectiveness of forest residue mulching in reducing post-fire runoff and erosion in a pine and a eucalypt plantation in north-central Portugal. Geoderma 2012, 191, 115–124. [Google Scholar] [CrossRef]
  35. Prats, S.A.; Wagenbrenner, J.; Malvar, M.C.; Martins, M.A.S.; Keizer, J.J. Hydrological implications of post-fire mulching across different spatial scales. Land Degrad. Dev. 2016, 27, 1440–1452. [Google Scholar] [CrossRef]
  36. Hosseini, M.; Gonzalez Pelayo, O.; Vasques, A.R.; Ritsema, C.; Geissen, V.; Keizer, J.J. The short-term effectiveness of surfactant seed coating and mulching treatment in reducing post-fire runoff and erosion. Geoderma 2017, 307, 231–237. [Google Scholar] [CrossRef]
  37. Li, X.; Zhang, Y.; Ji, X.; Strauss, P.; Zhang, Z. Effects of shrub-grass cover on the hillslope overland flow and soil erosion under simulated rainfall. Environ. Res. 2022, 214, 113774. [Google Scholar] [CrossRef] [PubMed]
  38. Carrà, B.G.; Bombino, G.; Lucas-Borja, M.E.; Plaza-Alvarez, P.A.; Agostino, D.; Zema, D.A. Prescribed fire and soil mulching with fern in Mediterranean forests: Effects on surface runoff and erosion. Ecol. Eng. 2022, 176, 106537. [Google Scholar] [CrossRef]
  39. González-Pelayo, O.; Prats, S.A.; AMD, V.; DCS, V.; Maia, P.; Keizer, J.J. Impacts of barley (Hordeum vulgare L.) straw mulch on post-fire soil erosion and ground vegetation recovery in a strawberry tree (Arbutus unedo L.) stand. Ecol. Eng. 2023, 195, 107074. [Google Scholar] [CrossRef]
  40. Prats, S.A.; Abrantes, J.R.; Crema, I.P.; Keizer, J.J.; De Lima, J.L. Runoff and soil erosion mitigation with sieved forest residue mulch strips under controlled laboratory conditions. For. Ecol. Manag. 2017, 396, 102–112. [Google Scholar] [CrossRef]
  41. Abrantes, J.R.C.B.; Prats, S.A.; Keizer, J.J.; De Lima, J.L.M.P. Effectiveness of the application of rice straw mulching strips in reducing runoff and soil loss: Laboratory soil flume experiments under simulated rainfall. Soil Tillage Res. 2018, 180, 238–249. [Google Scholar] [CrossRef]
  42. Sun, M.X.; Xu, X.; Wang, C.; Bai, Y.; Wang, Y. Environmental burdens of the comprehensive utilization of straw: Wheat straw utilization from a life-cycle perspective. J. Clean. Prod. 2020, 259, 120702. [Google Scholar] [CrossRef]
  43. Bhatt, R.; Khera, K.L. Effect of tillage and mode of straw mulch application on soil erosion in the submontaneous tract of Punjab, India. Soil Tillage Res. 2006, 88, 107–115. [Google Scholar] [CrossRef]
  44. Are, K.S.; Babalola, O.; Oke, A.O.; Oluwatosin, G.A.; Adelana, A.O.; Ojo, O.A.; Oluremi, A.; Adeyolanu, O.D. Conservation strategies for effective management of eroded landform: Soil structural quality, nutrient enrichment ratio, and runoff water quality. Soil. Sci. 2011, 176, 252–263. [Google Scholar] [CrossRef]
  45. Song, S.; Yang, R.; Cui, X.; Chen, Q. County-Scale Spatial Distribution of Soil Nutrients and Driving Factors in Semiarid Loess Plateau Farmland, China. Agronomy 2023, 13, 2589. [Google Scholar] [CrossRef]
  46. Qiu, D.; Xu, R.; Wu, C.; Mu, X.; Zhao, G.; Gao, P. Vegetation restoration improves soil hydrological properties by regulating soil physicochemical properties in the loess plateau, China. J. Hydrol. 2022, 609, 127730. [Google Scholar] [CrossRef]
  47. Shi, H.; Shao, M. Soil and water loss from the Loess Plateau in China. J. Arid. Environ. 2000, 45, 9–20. [Google Scholar] [CrossRef]
  48. Shipitalo, M.J.; Edwards, W.M. Runoff and erosion control with conservation tillage and reduced-input practices on cropped watersheds. Soil. Tillage Res. 1998, 46, 1–12. [Google Scholar] [CrossRef]
  49. Guo, M.; Wang, W.; Shi, Q.; Chen, T.; Li, J. An experimental study on the effects of grass root density on gully headcut erosion in the gully region of China’s loess plateau. Land. Degrad. Dev. 2019, 30, 2107–2125. [Google Scholar] [CrossRef]
  50. Xia, L.; Song, X.; Fu, N.; Cui, S.; Li, L.; Li, H.; Li, Y. Effects of rock fragment cover on hydrological processes under rainfall simulation in a semi-arid region of China. Hydrol. Process 2018, 32, 792–804. [Google Scholar] [CrossRef]
  51. Li, P.; Zhang, K.; Wang, J.; Feng, D. Response of interrill erosion to flow parameters of sand loess in regions with high and coarse sediment yields. J. Hydrol. 2021, 592, 125786. [Google Scholar] [CrossRef]
  52. Fu, B.; Liu, Y.; Lü, Y.; He, C.; Zeng, Y.; Wu, B. Assessing the soil erosion control service of ecosystems change in the Loess Plateau of China. Ecol. Complex. 2011, 8, 284–293. [Google Scholar] [CrossRef]
  53. Sato, Y.; Kumagai, T.; Kume, A.; Otsuki, K.; Ogawa, S. Experimental analysis of moisture dynamics of litter layers-the effect of rainfall conditions and leaf shapes. Hydrol. Process. 2004, 18, 3007–3018. [Google Scholar] [CrossRef]
  54. Merriam, R.A. A note on the interception loss equation. J. Geogr. Sci. 1960, 65, 3850–3851. [Google Scholar] [CrossRef]
  55. Yang, K.; Zhao, Y.; Gao, L.; Sun, H.; Gu, K. Nonlinear response of hydrodynamic and soil erosive behaviors to biocrust coverage in drylands. Geoderma 2022, 405, 115457. [Google Scholar] [CrossRef]
  56. Stan, J.T.V.; Coenders-Gerrits, M.; Dibble, M.; Bogeholz, P.; Norman, Z. Effects of phenology and meteorological disturbance on litter rainfall interception for a Pinus elliottii stand in the Southeastern United States. Hydrol. Process. 2017, 31, 3719–3728. [Google Scholar] [CrossRef]
  57. Jourgholami, M.; Sohrabi, H.; Venanzi, R.; Tavankar, F.; Picchio, R. Hydrologic responses of undecomposed litter mulch on compacted soil: Litter water holding capacity, runoff, and sediment. Catena 2022, 210, 105875. [Google Scholar] [CrossRef]
  58. Gomyo, M.; Kuraji, K. Effect of the litter layer on runoff and evapotranspiration using the paired watershed method. J. For. Res. 2016, 21, 306–313. [Google Scholar] [CrossRef]
  59. Martinez-Raya, A.; Duran-Zuazo, V.H.; Francia-Martinez, J.R. Soil erosion and runoff response to plant-cover strips on semiarid slopes (SE Spain). Land Degrad. Dev. 2006, 17, 1–11. [Google Scholar] [CrossRef]
  60. Harrison, N.M.; Stubblefield, A.P.; Varner, J.M.; Knapp, E.E. Finding balance between fire hazard reduction and erosion control in the Lake Tahoe Basin, California–Nevada. For. Ecol. Manag. 2016, 360, 40–51. [Google Scholar] [CrossRef]
  61. Oliveira, P.T.S.; Nearing, M.A.; Wendland, E. Orders of magnitude increase in soil erosion associated with land use change from native to cultivated vegetation in a Brazilian savannah environment. Earth Surf. Process. Landf. 2015, 40, 1524–1532. [Google Scholar] [CrossRef]
  62. Ries, J.B.; Seeger, M.; Iserloh, T.; Wistorf, S.; Fister, W. Calibration of simulated rainfall characteristics for the study of soil erosion on agricultural land. Soil Tillage Res. 2009, 106, 109–116. [Google Scholar] [CrossRef]
  63. Qin, C.; Zheng, F.; Xu, X.; Wu, H.; Shen, H. A laboratory study on rill network development and morphological characteristics on loessial hillslope. J. Soils Sediments 2018, 18, 1679–1690. [Google Scholar] [CrossRef]
Figure 1. Schematic diagram of the geographic location of the study area and experimental plots. Photos (a,b) are diagrams of the geographic location of the test site. Photos (c,d) are the field plot views in the simulated rainfall experiment.
Agronomy 14 00696 g001
Figure 2. Schematic diagram of different straw mulching methods.
Agronomy 14 00696 g002
Figure 3. Time series of straw interception under different mulching methods; bars represent standard error.
Agronomy 14 00696 g003
Figure 4. Variation in runoff rate and sediment yield rates with rainfall duration in different treatments.
Agronomy 14 00696 g004
Figure 5. Linear regression between runoff and sediment measurements in different treatments.
Agronomy 14 00696 g005
Figure 6. Runoff and sediment yields of the slope under different straw mulching methods; bars represent standard deviations; different lowercase letters represent significant differences at the 0.05 level among different straw mulch strip lengths; different uppercase letters represent significant differences at the 0.05 level among different straw coverage rates.
Agronomy 14 00696 g006
Figure 7. Structural equation model of the causal relationships among straw mulching methods, interception, runoff yield, sediment concentration, and sediment yield. Rectangles represent measured variables. Arrows represent hypothetical causal relationships tested by the model. Adjacent path coefficients (equivalent to correlation coefficients or regression weights) estimate the strength of the relationship, and arrow width is proportional to the coefficient. Significant coefficients are represented by an asterisk. The fit statistics of the model denoted a very strong fit of the model to the data.
Agronomy 14 00696 g007
Figure 8. The rainwater transformation ratio to interception amount, infiltration amount, and runoff yield under different conditions.
Agronomy 14 00696 g008
Figure 9. Runoff and sediment reduction magnitudes (%) under different straw cover conditions.
Agronomy 14 00696 g009
Table 1. Basic properties of the soil in the field plots.
Clay (%) <2 μmSilt (%)
2–50 μm
Sand (%)
50–2000 μm
Soil TextureBulk Density
(g cm−3)
Organic Carbon
(g kg−1)
Ph
10.8 ± 1.232.3 ± 2.256.9 ± 2.7Sandy loam1.3 ± 0.16.4 ± 0.98.5 ± 0.3
Table 2. Initial runoff time (s) under different straw mulching method conditions.
Coverage Rate (kg m−2)Initial Runoff Time (s)
1/4 Plot’s Mulch Strip1/2 Plot’s Mulch Strip3/4 Plot’s Mulch Strip1 Plot’s Mulch
Strip
061.2 ± 11.4 aA61.2 ± 11.4 aA61.2 ± 11.4 aA61.2 ± 11.4 aA
0.2335.4 ± 30.2 bA439.7 ± 40.6 bAB559.8 ± 38.8 bB939.0 ± 196.7 bC
0.5356.3 ± 93.8 bA705.7 ± 139.4 cB1057.6 ± 176.6 cC1304.4 ± 227.6 cC
0.8369.1 ± 65.6 bA873.5 ± 154.1 cB1220.2 ± 233.5 cC1500.4 ± 253.1 cC
Note: Data are the mean ± standard deviation; different lowercase letters in the same column represent significant differences at the 0.05 level among different straw coverage rates; different uppercase letters in the same row represent significant differences at the 0.05 level among different straw mulch strip lengths.
Table 3. Standardized direct, indirect, and total effects on sediment yield via structural equation model.
VariableDirect EffectsIndirect EffectsTotal Effects
Straw coverage rate−0.25−0.09−0.34
Length of straw mulching strips−0.19−0.74−0.93
Runoff yield0.860.0720.95
Sediment concentration0.1700.17
Interception−0.330−0.33
Table 4. Prediction results of interception processes under different straw cover conditions.
Mulch Rate (kg m−2)Length of Straw Mulching Strips cR2NSE
0.21/4 plot0.140.950.84
2/4 plot0.250.910.75
3/4 plot0.360.940.8
4/4 plot0.430.960.89
0.51/4 plot0.280.940.8
2/4 plot0.330.960.86
3/4 plot0.530.960.83
4/4 plot0.670.950.8
0.81/4 plot0.260.950.82
2/4 plot0.510.970.88
3/4 plot0.690.980.93
4/4 plot0.730.970.89
Note: c is the effective interception coefficient.
Disclaimer/Publisher’s Note: The statements, opinions and data contained in all publications are solely those of the individual author(s) and contributor(s) and not of MDPI and/or the editor(s). MDPI and/or the editor(s) disclaim responsibility for any injury to people or property resulting from any ideas, methods, instructions or products referred to in the content.

