Article

Identification of Plant and Soil Characteristics Affecting Stability of Winter Wheat Cultivar in Temperate Climates

Department of Biometry, Institute of Agriculture, Warsaw University of Life Sciences, Nowoursynowska 159 Street, 02-776 Warsaw, Poland
*
Author to whom correspondence should be addressed.
Agronomy 2024, 14(4), 779; https://doi.org/10.3390/agronomy14040779
Submission received: 8 March 2024 / Revised: 3 April 2024 / Accepted: 8 April 2024 / Published: 10 April 2024
(This article belongs to the Section Plant-Crop Biology and Biochemistry)

Abstract

:
This study examines the significant variability in grain yield, thousand-grain weight, protein content, sedimentation value, and falling number among winter wheat cultivars across diverse trial locations, elucidating the profound influence of environmental factors on these traits. Employing Shukla’s stability variance and a multi-trait stability index (MTSI), cultivar stability is comprehensively assessed across multiple traits. Cultivars are ranked based on stability variance and cumulative ranking across all traits, with Bataja emerging as the most stable cultivar according to Shukla variance, while Apostel exhibits the lowest stability. Contrarily, MTSI rankings reveal distinct top performers, such as Medalistika and KWS Spencer. Canonical correspondence analysis (CCA) is utilized to discern relationships between stability and genotype characteristics, as well as trait values and soil properties/weather conditions. These findings contribute to the recommendation of stable cultivars for breeding programs and the optimization of crop management practices. Furthermore, this study underscores the need to explore causal relationships between accompanying variables, facilitating informed recommendations for plant breeders and advancing breeding progress amidst a changing climate. The use of multivariate statistical methods, including CCA, enhances our understanding of cultivar traits and stability, offering valuable insights for sustainable agriculture.

1. Introduction

Wheat is one of the most important crops grown worldwide and plays a crucial role in ensuring global food security [1,2]. Different forms of this species are cultivated, which are also related to its intended purpose and later use. In the temperate climate of Central Europe, the most popular form is winter wheat, characterized by high yields and good bread-making properties. Spring wheat, unfortunately, very often has a one-third lower yield, which is why it is not very popular [3].
Ongoing climate change and the associated various types of extreme weather phenomena have a negative impact both on yield value and on important grain quality traits [4]. Therefore, in such conditions, it becomes important to search for stable and widely adapted genotypes not only in terms of yield but also other important quality traits [5]. Until now, the common practice was to assess the stability of cereal cultivars for yield alone, neglecting the assessment of other grain quality traits that could be considered important for obtaining a good quality final product, such as bread.
Many previous studies have focused on assessing the stability of genotypes, mostly descriptively presenting stable and unstable genotypes. There has been no attempt to explain why certain genotypes are less or more stable. One method of finding the cause of the degree of stability may be by investigating causal relationships or other relationships between accompanying variables, e.g., those that characterize cultivars (e.g., disease resistance). Finding such relationships and connections will allow for the preparation of appropriate recommendations for plant breeders, which will facilitate both the phenotypic and genotypic selection of genotypes. Understanding the factors affecting the degree of cultivar stability will increase breeding progress and contribute to increased food security in a changing climate.
Multivariate statistical methods can be used to search for relationships between cultivar’s traits and their stability. One method that can be applied in this case is canonical correspondence analysis CCA [6], which is widely used in ecological research [7,8]. These methods have been used in other scientific fields as well. CCA is used to study the relationships between species abundance and environmental characteristics. CCA is one method in the group of ordination analysis methods [9], similar to the well-known and widely used PCA in agronomic research. The only difference is that CCA can search for relationships between two data sets (data matrix). We would like to propose and present the CCA method for exploring the relationship between cultivar stability and plant descriptions as well as environments. Finding such relationships will increase the efficiency of breeding efforts in the search for stable cultivars. It also serves an important scientific purpose, allowing for the justification or identification of traits that make certain genotypes stable while others are unstable. In addition to presenting the CCA method, we would like to investigate whether resistance to fungal diseases and lodging will influence the stability of yield and quality traits in winter wheat. Identifying such variables will lead to better recommendations for cultivar selection and the discovery of valuable parental forms. Therefore, the aim of the study is to (1) evaluate the stability of yield and other quality traits of winter wheat cultivars using both univariate and multivariate methods, (2) identify relationships between stability and genotype characteristics, and (3) investigate the relationships between trait values and soil properties.

2. Materials and Methods

2.1. Field Experiment and Study Traits

This study used data from multi-environment trials (METs) conducted within the framework of the Polish cultivar recommendation system for farmers, which is supervised by the Polish Research Centre for Cultivar Testing (COBORU). The MET included 55 winter wheat varieties tested in 12 locations over 5 growing seasons (2015/2016–2019/2020), constituting 60 environments. Each experiment in the MET was conducted in an alpha-design with 2 replicates, and the area of each plot was 15 m2. The soil characteristics of trial locations including, among others, reference bulk density, soil organic carbon stock, and cation exchange capacity are presented in Table S1. These data are presented as average values from all growing seasons. Due to low variability and to ensure soil health, these values constitute a permanent characteristic of specific locations. Crop management in each experiment included two fungicide applications at the Zadoks growth stage (GS) 31–32 [10] and GS 49–60, as well as a growth regulator (trinexapac-ethyl) application at GS 31. Fungicidal active agents (azoxystrobin, cyproconazole, and propiconazole) were selected depending on the severity of the occurrence of fungal diseases. A nitrogen dose of 40 kg ha−1 higher than the optimal dose for the given conditions at the location was also applied. Data for five variables were used: grain yield, thousand-grain weight, protein content, sedimentation value, and falling number.
The grain yield (GY) and thousand-grain weight (TGW) were determined from a 1 m2 sample collected from the center of the whole plot. The protein content (PC) (N × 5.7) was determined according to the Kjeldahl method (AACC Method 46-11.02), and the sedimentation value (SV) was obtained by the Zeleny method (AACC Method 56-61.02). The falling number (FN) was determined using the Hagberg–Perten method (AACC Method 56-81B).
In addition to these variables, we utilized the evaluation of variety resistance to winter survival (WH), lodging (RTL), and major fungal diseases (including powdery mildew, PM; brown rust, BR; Septoria leaf blight, SLB; chaff Septoria, CS; diseases of the stem base, DSB; and Fusarium ear blight, FEB). The evaluation was conducted on a 9-point scale, where 1 represents the worst condition and 9 the best condition for plants. These data are presented in Table S2 as average values across environments (comprising combinations of 12 locations and 5 growing seasons) (Supplementary Materials).

2.2. Statistical Methods
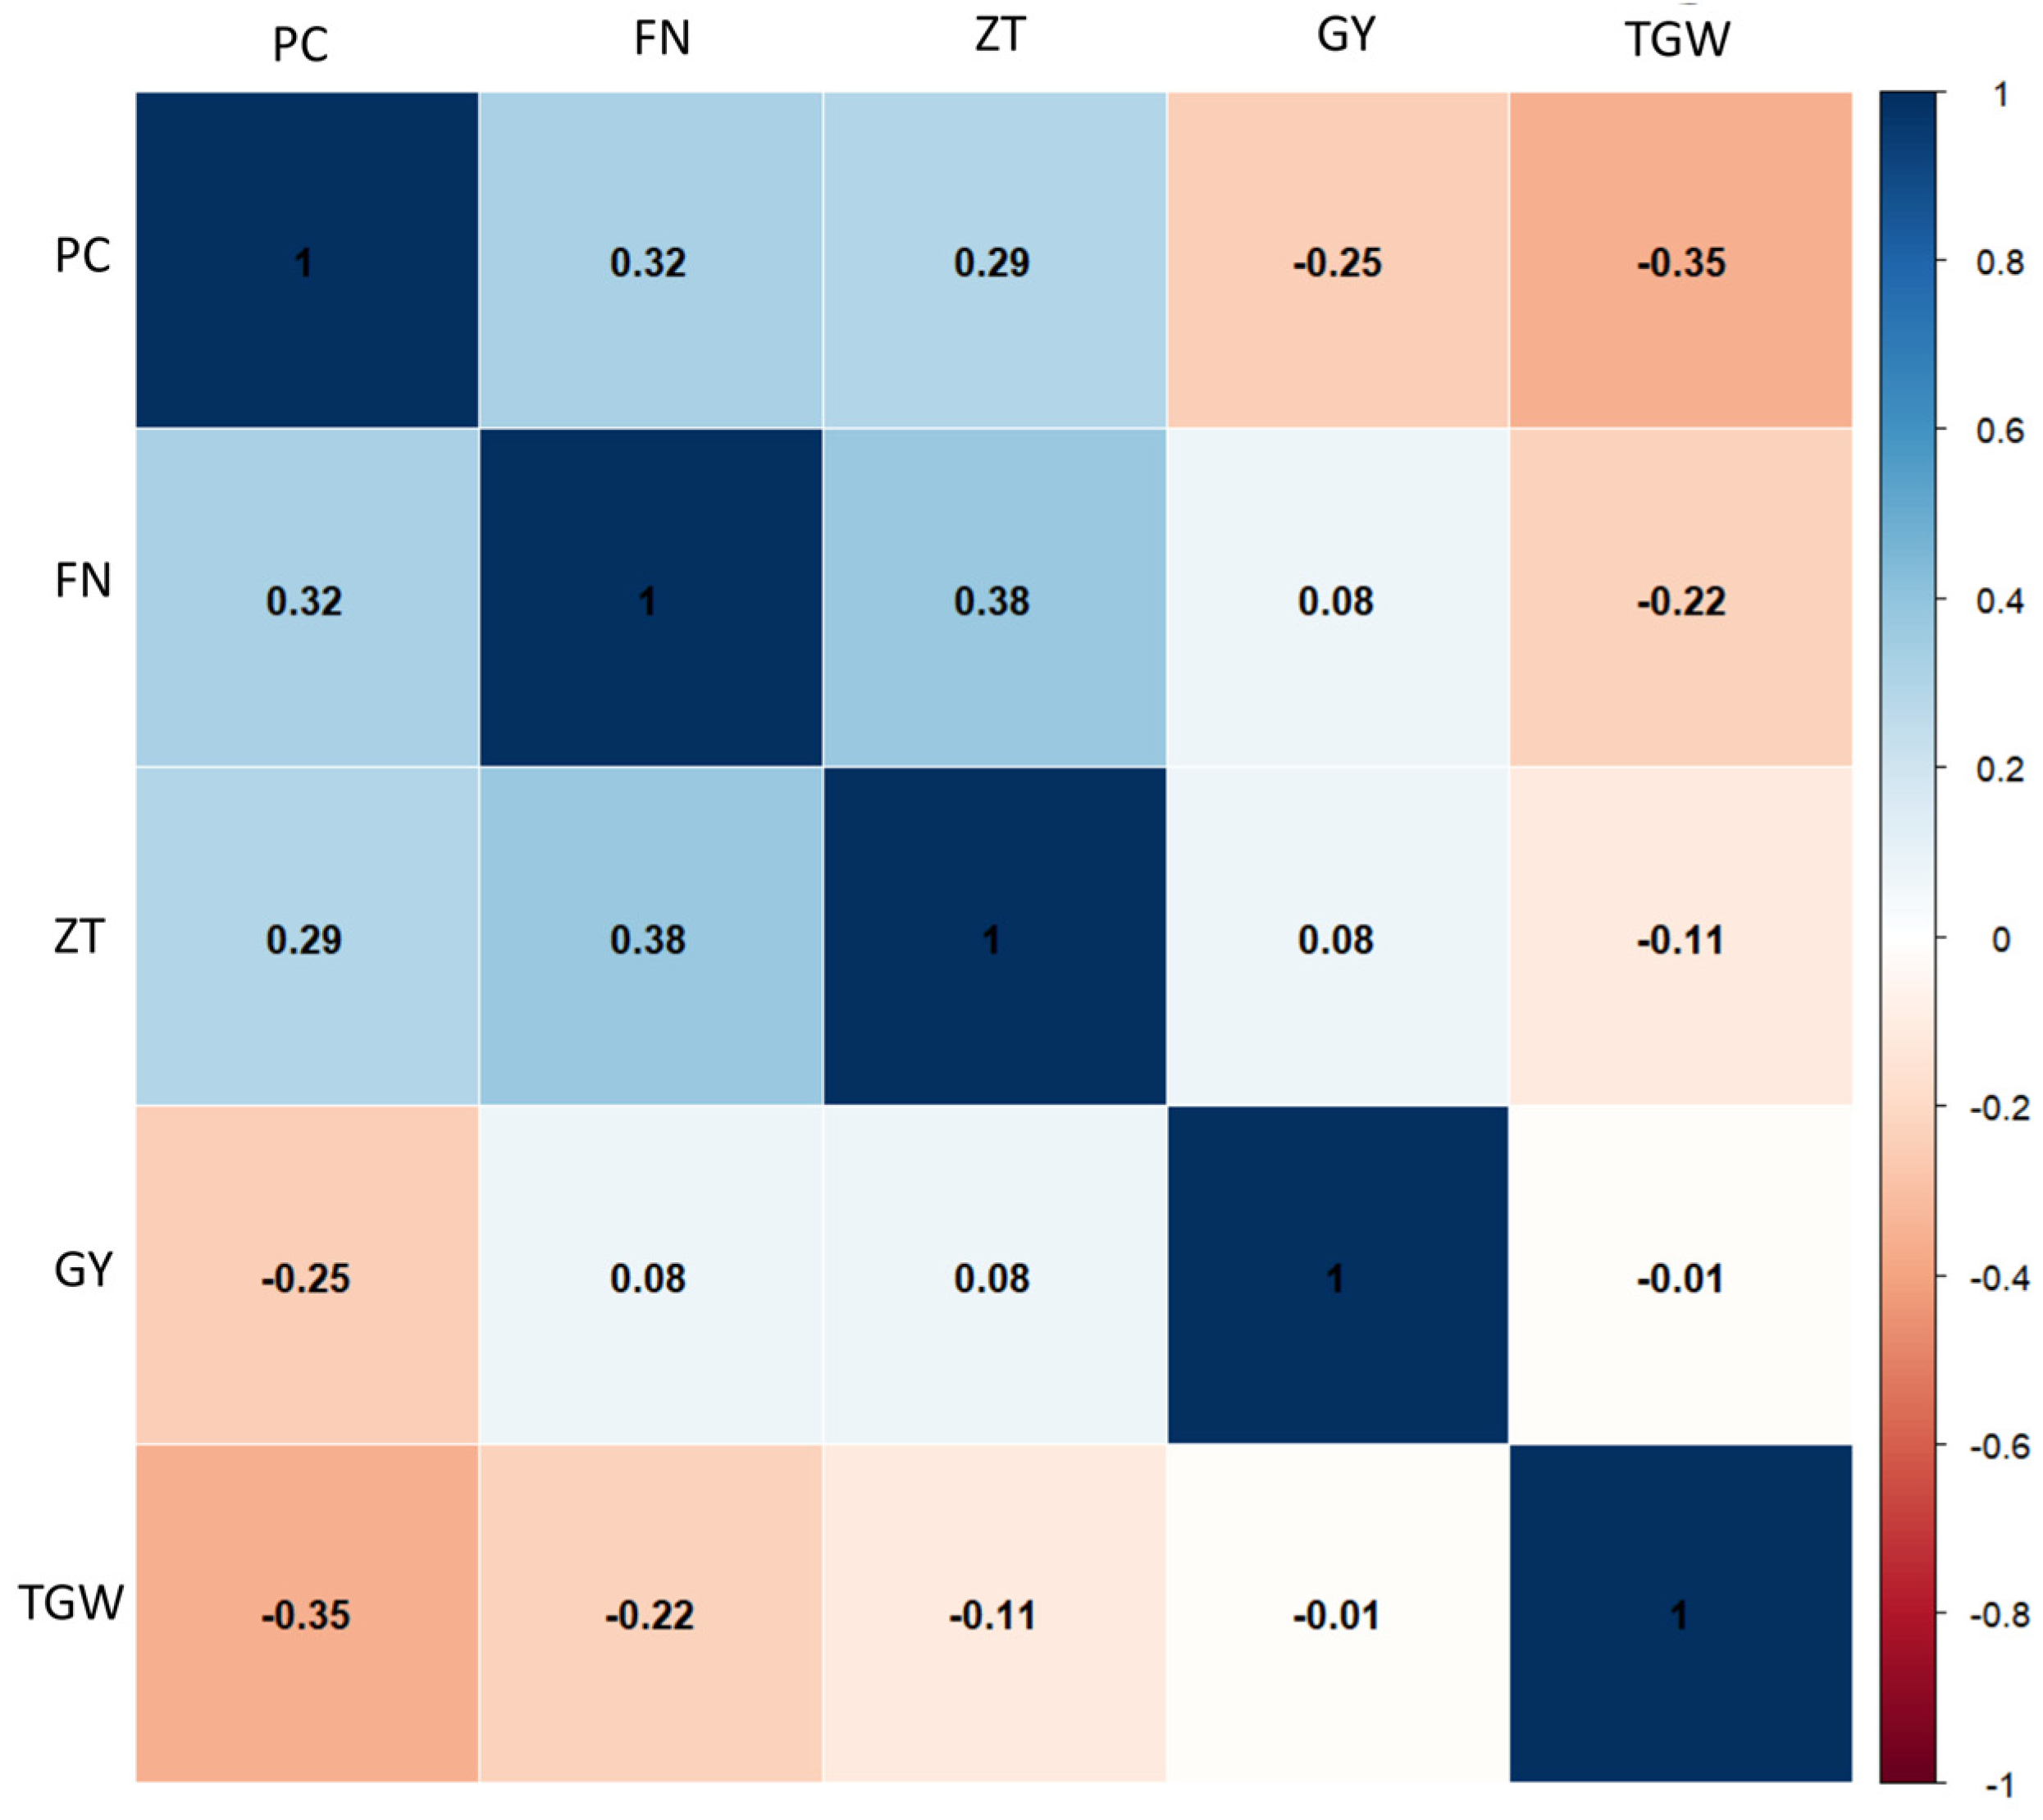
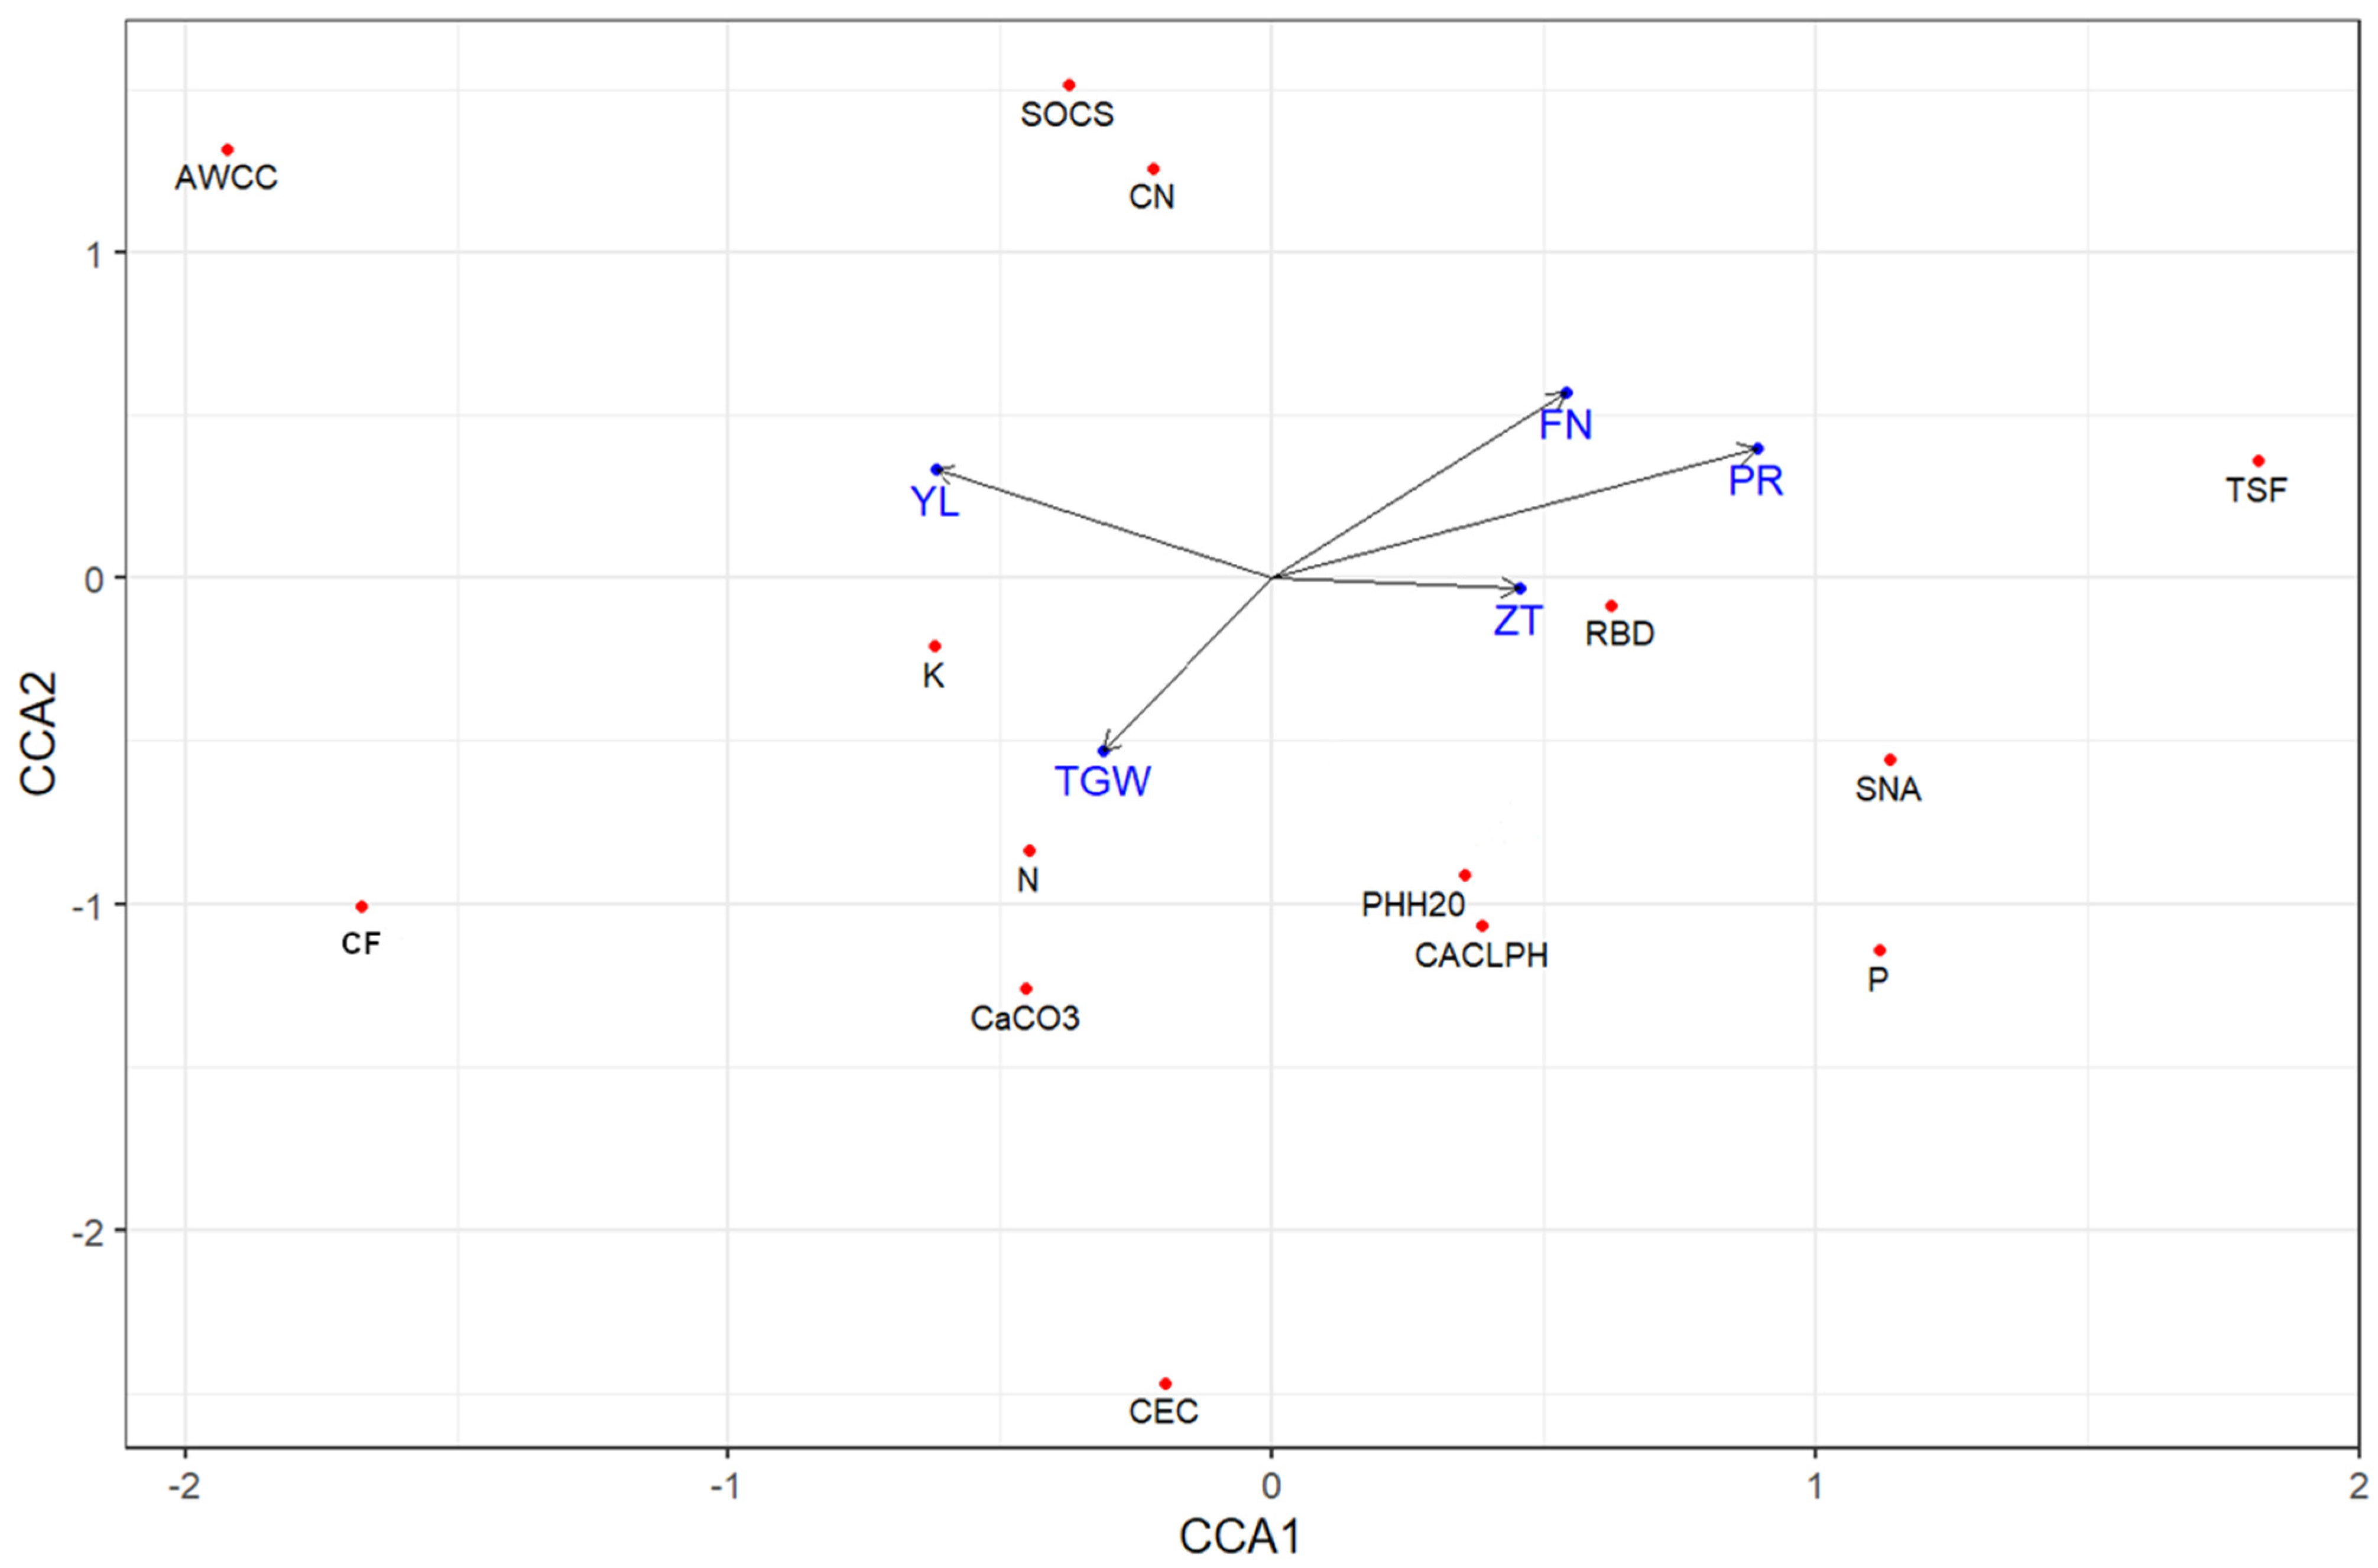
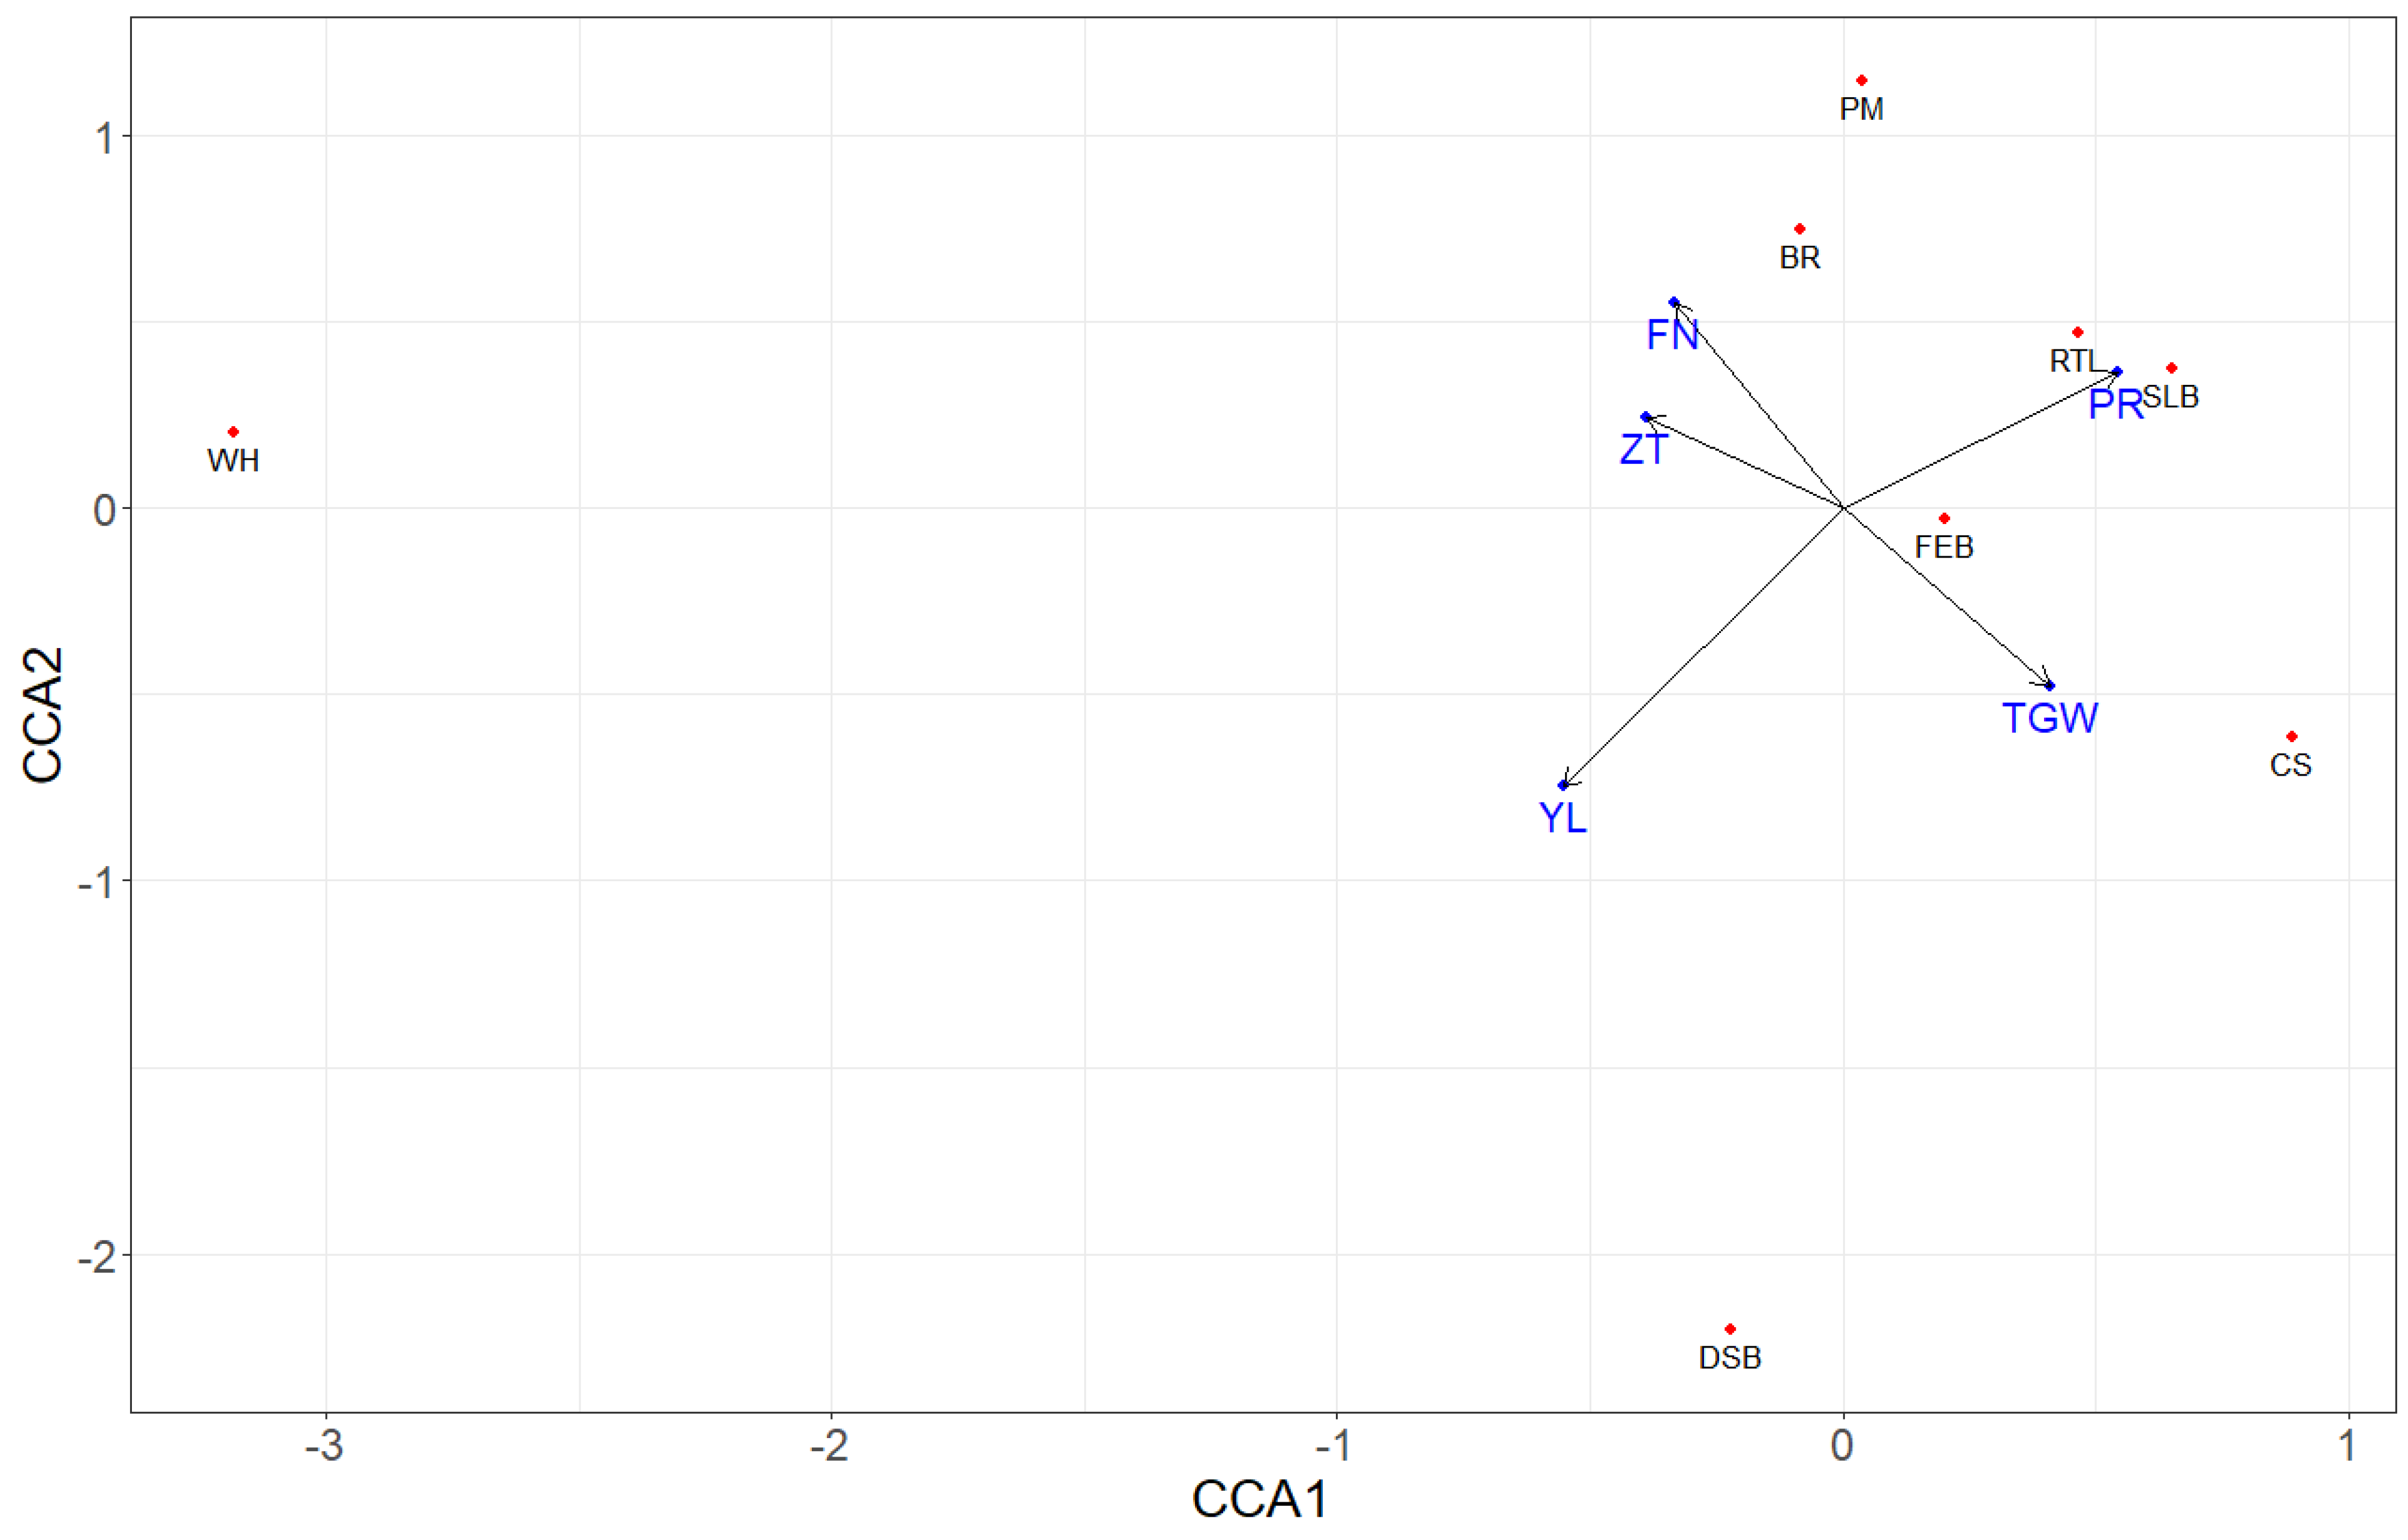
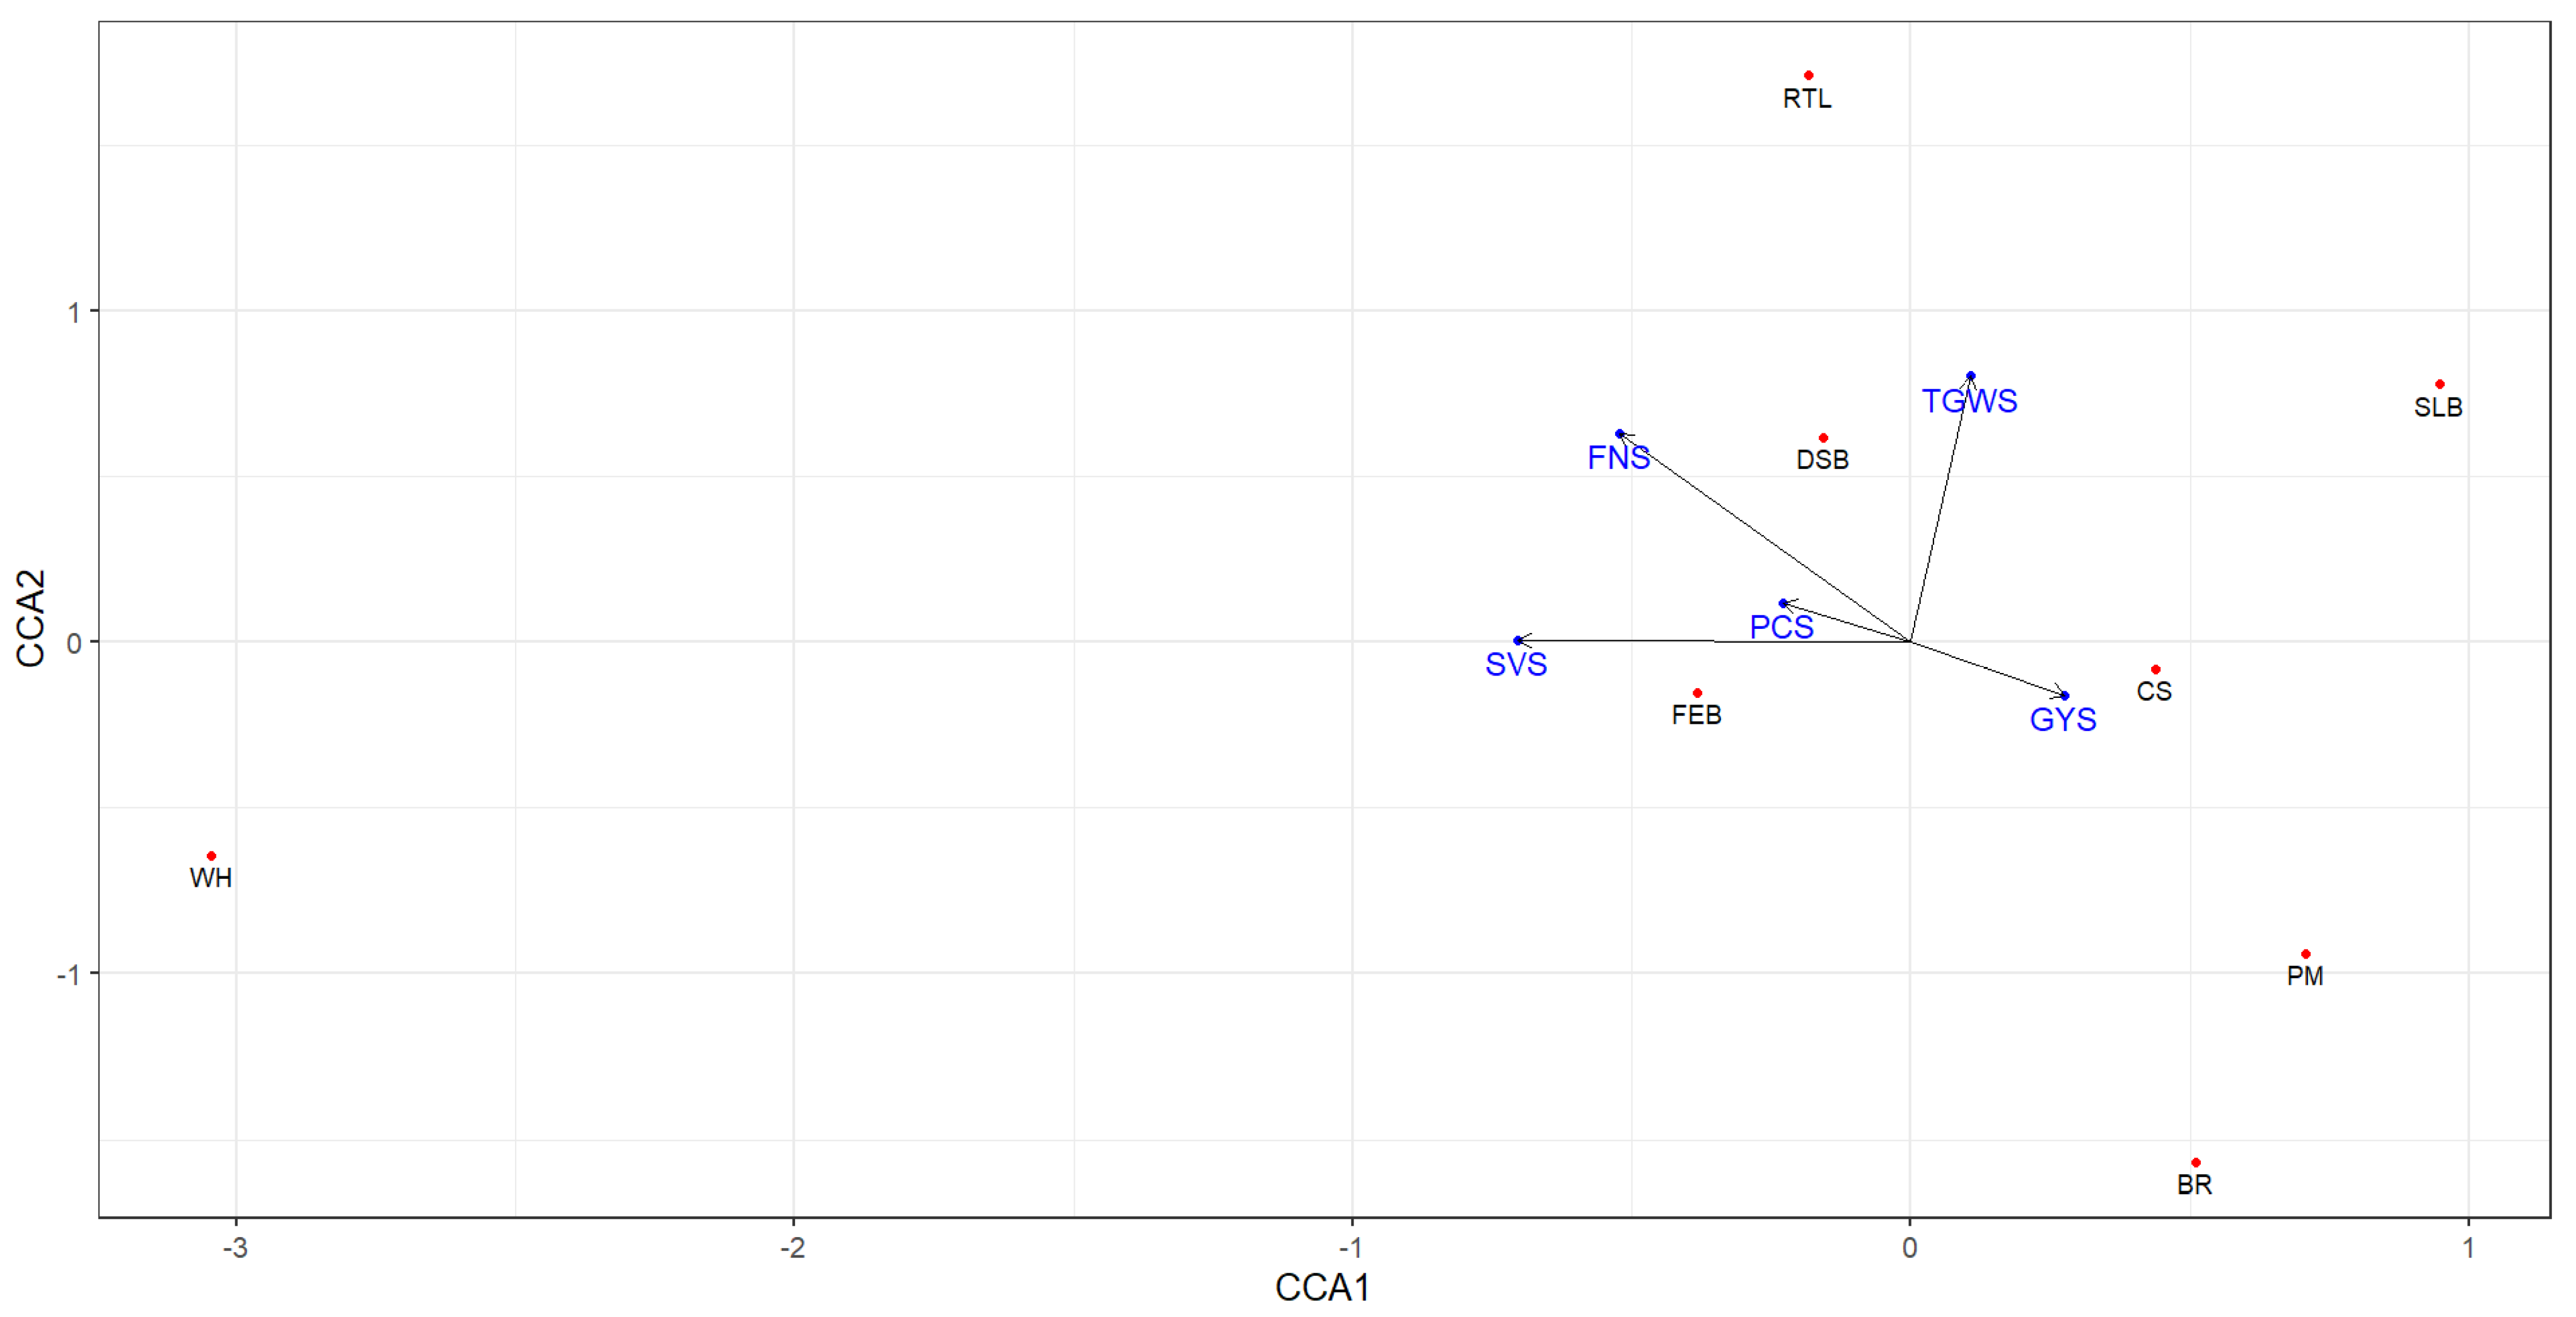
The statistical analysis of all study traits was performed using a single-stage approach for a linear mixed model (LMM) with the restricted maximum likelihood (REML) method, based on models shown below:
y i j k l h n = µ   +   g k +   l j + a i + ga k i + gl k j + la j i + gla k j i + r j i h + b j i h n + e i j k l h n
where yijklhn is the value of the trait under consideration; µ is the overall mean; gk is the fixed effect of kth cultivar; lj is the random effect of jth location; ai is the random effect of ith growing season; gaki is the random interaction effect of the kth cultivar and ith growing season; glkj is the random interaction effect of the kth cultivar and jth location; laji is the random interaction effect of the ith growing season and jth location; glakji is the random interaction effect of kth cultivar, jth location, and ith growing season; rji is the random effect of the hth replication nested in the jth location during the ith growing season; bjihn is the random effect of the nth block nested in the hth replication at the jth location during the ith growing season; and eijklhn is the random error associated with the trait under observation yijklhn.
Based on a linear mixed model (1), we calculated adjusted means of yield and studied grain quality traits for the main effects of cultivars and locations, as well as cultivar × location × growing season combinations, using the algorithm described by [11]. These calculated adjusted means will serve as the basis for determining stability parameters and other statistical measures.
We utilized Shukla’s stability variance [12] to assess the cultivar stability of each study trait individually. Additionally, we employed a multi-trait stability parameter (MTSI) as described by [13] to evaluate stability across all study traits simultaneously. This parameter facilitates the assessment of genotype stability across multiple traits concurrently, enabling the identification of genotypes with the highest degree of stability across all considered traits. The MTSI parameter is based on factor analysis for the matrix of standardized study trial means, with means standardized using the value of genotype–environment interaction effects. Its parameter interpretation aligns with commonly used stability indices, such as Shukla stability variance, where lower values indicate better stability. The MTSI indicators and Shukla stability variance for the combinations of year and location were treated as distinct environments.
We examined the relationship between the value of Shukla stability variance for all study traits and the characteristics of cultivars from Table S1 using canonical correspondence analysis (CCA). Furthermore, CCA was utilized to evaluate the relationships between the characteristics of locations presented in Table S2 and the mean values of yield and other traits in those locations. CCA is a technique that enables the description of response variable matrices as a linear combination of predictor variable matrices. The results of the analysis are visualized on a biplot graph, with interpretation similar to other widely used methods.
All statistical analyses were conducted using R 4.3.0 software [14]. Shukla’s stability variance and MTSI were derived using the metan package [15], while the CCA approach was implemented using the vegan package.

3. Results

The average values and coefficients of variation (CV) of the investigated traits for individual locations are presented in Table 1. Grain yield ranged from 80 dt ha−1 (location Bialogard) to 126 dt ha−1 (location Lisewo). However, the variability in this trait was also strongly diversified depending on the location; the lowest variability with a CV of 4.32% was observed in Jelania Góra, while the highest variability with a CV of 23.60% was found in Krzyzewo. The lowest protein content was 11.28% in Jelenia Gora, whereas the highest value was 13.86% in Sulejow. The variability in this trait also strongly depended on the location, ranging from CV = 4.43% in Krzyzewo to CV = 14.86% in Jelenia Gora.
The yield for the examined fifty-five varieties ranged from 91.07 dt ha−1 (Moschus) to 120.27 dt ha−1 for the Hybery cultivar (Table 2). Meanwhile, the coefficient of variation (CV) ranged from 7.44% (cultivar Bonanza) to 31.17% (cultivar Kometa). The average protein content for individual cultivars ranged from 11.63 (Hybery) to 14.18 (Impresja).
A lower value of Shukla variance reflects higher stability. Cultivars containing the least Shukla variance are ranked 1st in the Shukla stability ranking (Table 3). According to the Shukla variance, Bataja, SY Cellist, Bataja Opoka, and RGT Provision were the most stable cultivars in terms of yield, thousand-grain weight, protein, falling number, and Zeleny test, respectively. The cultivars Kometa, SU Mangold, Comandor, Błyskawica, and Plejada displayed the highest Shukla variance and were the least stable in terms of yield, thousand-grain weight, protein, falling number, and Zeleny test, respectively.
In the context of the Shukla stability variance ranking sum, cultivars with the lowest sum are considered the most stable, while those with the highest sum are regarded as the least stable. Among all cultivars, Apostel had the highest stability sum (243), signifying the least stability, whereas Bataja emerged as the most stable cultivar with the lowest stability sum (37).
We performed individual multi-trait selection index (MTSI) analyses for all fifty-five winter wheat cultivars across environments created as a combination of locations and growing seasons, as outlined in Table 3. To identify the most stable performers, we applied a selection pressure of 15%. Among these cultivars, Medalistika (1.81) and KWS Spencer (2.01) emerged as the top-ranked, securing the first and second positions in terms of stability.
In terms of the stability of varieties, measured as the Shukla stability variance ranking sum for all traits, and the MTSI parameter, we observe a lack of consistency between metrics in the assessment of variety stability. Completely different varieties are considered to be multi-stable when applying the sum of rankings and MTSI parameters. This can be shown through a low correlation coefficient value of 0.17 (p-value < 0.0001).
The strongest positive correlation was observed between the Zeleny sedimentation test and the Hagberg falling number, while a negative correlation was found between protein content and thousand-grain weight (Figure 1). We also observe a negative correlation between protein content and yield (−0.25) as well as protein content and thousand-grain weight (−0.35).
In the CCA analysis (Figure 2), we observed relationships between the mean values of the studied traits in locations and the chemical and physical properties of soils in those locations (presented in Table S1). We observed a correlation between yield in the location and the available water capacity class (AWCC) according to the FAO Harmonized World Soil Database and Soil Organic Carbon Stock. For TGW, there is a relationship with the clay fraction. Traits related to grain quality, such as protein content, falling number, and Zeleny test, exhibited a similar pattern dependent on soil nutrient availability class, sand fraction, and phosphorus content.
Figure 3 presents the results of CCA for the mean values of study traits and evaluation of cultivars’ resistance (from Table S2). We observe a strong correlation between the mean values for protein content and resistance to lodging and Septoria leaf blight. The mean thousand-grain weight was dependent on chaff septoria. Unfortunately, for grain yield, falling number, and Zeleny test, it is not possible to identify variables characterizing cultivars that have an impact on the values of these traits.
Figure 4 presents the results of CCA for cultivars’ Shukla stability variances of study traits and additional traits characterizing cultivars. We observed a strong correlation between yield stability and resistance to chaff Septoria, powdery mildew, and brown rust. For traits related to grain quality such as protein content, falling number, and Zeleny test, we observed a positive correlation, confirming the results of Pearson correlation analysis presented in Figure 1. The stability of thousand-grain weight was dependent on resistance to lodging and diseases of the stem base. The stability of protein content and the stability of Zeleny sedimentation values were dependent on Fusarium ear blight and winter hardiness.

4. Discussion

Assessing the stability of varieties is an important issue related to both genetic and agronomic progress in a changing climate [16,17]. It allows for the identification of genotypes or cultivars adapted to specific climatic and soil conditions, as well as production requirements. Stability is commonly used in recommending cultivars for cultivation by farmers, with tests conducted by state institutions or producer associations. These studies pinpoint specific genotypes recommended for cultivation in a given region [18]. Due to the high turnover of cultivars in the market and the fact that such recommendations are tailored to local conditions, they may not be of interest to a wider audience of scientists, including plant breeders [19]. However, understanding the relationships and dependencies of stability on genotype properties allows for generalization and inference, leading to an understanding of the causes of stability. As mentioned in the Introduction, there is currently a lack of research in this area. In our study, we proposed using a multivariate method, canonical correspondence analysis (CCA), to search for causal relationships.
A comprehensive assessment of cultivar stability should not focus solely on individual traits. For many traits, especially in the case of grains, it should encompass grain quality characteristics, or even baking quality traits. We also proposed the sum of Shukla’s variance rankings for each of the studied traits, which would serve as a synthesis of stability evaluations for individual traits. This approach allows for the selection of cultivars that are most stable across multiple traits simultaneously. However, this approach is straightforward and has several drawbacks. For instance, it may classify a cultivar as multivariate stable even if it ranks unfavorably for one of the traits in the stability ranking (high Shukla variance value). This limitation may become apparent, especially in datasets where a large number of traits are considered simultaneously. Therefore, in addition to the sum itself, we also provide the minimum and maximum values of the Shukla variance ranking for each cultivar. Olivoto et al. [20] proposed a multivariate model based on factor analysis, which allows for the assessment of stability using a single parameter value for multiple considered traits, referred to as MTSI. For our dataset of winter wheat cultivars, we observe a low level of agreement between the sum of Shukla variance rankings and the MTSI parameter. Many studies have been conducted comparing the agreement of assessments between different stability parameters, but they mainly focused on individual traits. These previous studies indicate that the level of agreement between parameters depends on the species, trait, and climatic conditions of the conducted trials [21].
Identified genotypes that are stable for all simultaneously important traits, whether through the Shukla variance ranking sum or the MTSI parameter, constitute valuable parental forms for breeding programs. In our set of cultivars, such genotypes of interest to breeders or other researchers include, Bataja and SY Yukon for the Shukla variance ranking sum and Medalistka and KWS Spencer for the MTSI. The application of CCA analysis to the mean values of the varieties showed a strong relationship between the protein content of the varieties and resistance to lodging and Septoria leaf blight [22,23]. Unfortunately, for the yield, the CCA analysis did not allow for the identification of any of the applied variables characterizing the varieties. This is probably due to the limited set of additional cultivar characteristics used.
The utilization of the CCA method facilitated the identification of traits that characterize cultivars and play a vital role in shaping the stability of key traits in the dataset of winter wheat. It was demonstrated that the stability of grain yield was contingent upon resistance to chaff Septoria, powdery mildew, and brown rust, factors closely associated with weather conditions [24,25]. The greater resistance of cultivars to these diseases resulted in reduced yield variability due to environmental conditions, consequently leading to greater yield stability. If plant breeders aim to enhance genotype stability regarding yield, they should focus on selecting cultivars resistant to these three fungal diseases. However, for grain quality traits, we observe that winter hardiness had a significant impact on their stability. A high level of plant healthiness post-winter for a cultivar allows for stable values of these traits across various environmental conditions. Varieties with low winter hardiness will exhibit significant variability depending on prevailing winter conditions, and the values of these traits will be more strongly influenced by wintering conditions, whether favorable or not. Having information about the cultivar traits that are important for their stability increases the efficiency of breeding work, both phenotype-based and genotype-based. It allows for the selection of these traits and/or their markers to focus on and pay special attention to during selection [26,27]. This will significantly improve efficiency and optimize the costs of genotype-based breeding [28].
Unfortunately, for the presented dataset, different variables characterizing varieties were related to the mean values of traits, while others were related to the Shukla stability cultivar. This further complicates the selection of traits that breeders should focus on. Ideally, the same traits characterizing the cultivar would have an impact on both the mean values of traits and their stability assessment.

5. Conclusions

In conclusion, the evaluation of cultivar stability should not solely focus on identifying varieties or recommending cultivars with a high degree of stability but should always be complemented by seeking relationships and causes of this stability, including the use of other traits characterizing cultivars or environments. We have demonstrated that yield stability was strongly dependent on the degree of resistance to the following fungal diseases: chaff Septoria, powdery mildew, and brown rust. However, traits related to the grain quality (e.g., protein contents, filling numbers) of winter wheat grain were dependent on winter hardiness. This will certainly contribute to breeding progress, especially the selection of multi-traits stable genotypes of winter wheat in temperate climates. Information about traits strongly associated with shaping the mean values and stability of the traits under study will ensure food security in a changing climate. The application of the CCA method proved to be a useful tool for exploring the relationships between the stability of grain traits and cultivar characteristics.

Supplementary Materials

The following supporting information can be downloaded at https://www.mdpi.com/article/10.3390/agronomy14040779/s1, Table S1. Characteristics of winter wheat cultivars based on official registration test. Table S2. Soil characteristics of study location.

Author Contributions

Conceptualization, M.S. and A.Z.G.; methodology, M.S.; software, A.Z.G.; validation, M.S., A.D. and A.Z.G.; formal analysis, A.Z.G.; investigation, M.S.; resources, M.S.; data curation, M.S.; writing—original draft preparation, A.Z.G. and M.S.; writing—review and editing, A.Z.G.; visualization, A.Z.G.; supervision, M.S.; project administration, M.S.; funding acquisition, M.S. All authors have read and agreed to the published version of the manuscript.

Funding

This research received no external funding.

Data Availability Statement

The data presented in this study are available upon request from the corresponding author (M.S.)

Conflicts of Interest

The authors declare no conflicts of interest.

References

  1. Gooding, M.J.; Shewry, P.R. Wheat: Environment, Food and Health; John Wiley & Sons: Hoboken, NJ, USA, 2022. [Google Scholar] [CrossRef]
  2. Gooding, M.J. Wheat. In ICC Handbook of 21st Century Cereal Science and Technology; Elsevier: Hoboken, NJ, USA, 2023; pp. 121–130. [Google Scholar] [CrossRef]
  3. Oleksiak, T.; Spyroglou, I.; Pacoń, D.; Matysik, P.; Pernisová, M.; Rybka, K. Effect of drought on wheat production in Poland between 1961 and 2019. Crop Sci. 2022, 62, 728–743. [Google Scholar] [CrossRef]
  4. Weiner, J.; Du, Y.L.; Zhao, Y.M.; Li, F.M. Allometry and yield stability of cereals. Front. Plant Sci. 2021, 12, 681490. [Google Scholar] [CrossRef] [PubMed]
  5. Poggi, G.M.; Aloisi, I.; Corneti, S.; Esposito, E.; Naldi, M.; Fiori, J.; Piana, S.; Ventura, F. Climate change effects on bread wheat phenology and grain quality: A case study in the north of Italy. Front. Plant Sci. 2022, 13, 936991. [Google Scholar] [CrossRef] [PubMed]
  6. Ter Braak, C.J. Canonical correspondence analysis: A new eigenvector technique for multivariate direct gradient analysis. Ecology 1986, 67, 1167–1179. [Google Scholar] [CrossRef]
  7. Greenacre, M. Canonical correspondence analysis in social science research. In Proceedings of the Classification as a Tool for Research: Proceedings of the 11th IFCS Biennial Conference and 33rd Annual Conference of the Gesellschaft für Klassifikation eV, Dresden, Germany, 13–18 March 2009; pp. 279–286. [Google Scholar] [CrossRef]
  8. van Dam, A.; Dekker, M.; Morales-Castilla, I.; Rodríguez, M.Á.; Wichmann, D.; Baudena, M. Correspondence analysis, spectral clustering and graph embedding: Applications to ecology and economic complexity. Sci. Rep. 2021, 11, 8926. [Google Scholar] [CrossRef] [PubMed]
  9. Legendre, P.; Legendre, L. Numerical Ecology. In Developments in Environmental Modelling; Third English Edition; Elsevier: Amsterdam, The Netherlands, 2012. [Google Scholar]
  10. Zadoks, J.C.; Chang, T.T.; Konzak, C.F. A decimal code for the growth stages of cereals. Weed Res. 1974, 14, 415–421. [Google Scholar] [CrossRef]
  11. Welham, S.; Cullis, B.; Gogel, B.; Gilmour, A.; Thompson, R. Prediction in linear mixed models. Aust. N. Z. J. Stat. 2004, 46, 325–347. [Google Scholar] [CrossRef]
  12. Shukla, G. Some statistical aspects of partitioning genotype-environmental components of variability. Heredity 1972, 29, 237–245. [Google Scholar] [CrossRef] [PubMed]
  13. Olivoto, T.; Lúcio, A.D.; da Silva, J.A.; Marchioro, V.S.; de Souza, V.Q.; Jost, E. Mean performance and stability in multi-environment trials I: Combining features of AMMI and BLUP techniques. Agron. J. 2019, 111, 2949–2960. [Google Scholar] [CrossRef]
  14. R Core Team. R: A Language and Environment for Statistical Computing; R Foundation for Statistical Computing: Vienna, Austria, 2003; Available online: https://www.r-project.org/ (accessed on 7 April 2024).
  15. Olivoto, T.; Lúcio, A.D.C. Metan: An R package for multi-environment trial analysis. Methods Ecol. Evol. 2020, 11, 783–789. [Google Scholar] [CrossRef]
  16. Macholdt, J.; Honermeier, B. Impact of highly varying seeding densities on grain yield and yield stability of winter rye cultivars under the influence of delayed sowing under sandy soil conditions. Arch. Agron. Soil Sci. 2017, 63, 1977–1992. [Google Scholar] [CrossRef]
  17. Macholdt, J.; Gyldengren, J.G.; Diamantopoulos, E.; Styczen, M. How will future climate depending agronomic management impact the yield risk of wheat cropping systems? A regional case study of Eastern Denmark. J. Agric. Sci. 2020, 158, 660–675. [Google Scholar] [CrossRef]
  18. Pennacchi, J.P.; Carmo-Silva, E.; Andralojc, P.J.; Lawson, T.; Allen, A.M.; Raines, C.A.; Parry, M.A. Stability of wheat grain yields over three field seasons in the UK. Food Energy Secur. 2019, 8, e00147. [Google Scholar] [CrossRef] [PubMed]
  19. Fadda, C.; Van Etten, J. Generating farm-validated variety recommendations for climate adaptation. In The Climate-Smart Agriculture Papers: Investigating the Business of a Productive, Resilient and Low Emission Future; Springer: Berlin/Heidelberg, Germany, 2019; pp. 127–138. [Google Scholar] [CrossRef]
  20. Olivoto, T.; Lúcio, A.D.; da Silva, J.A.; Sari, B.G.; Diel, M.I. Mean performance and stability in multi-environment trials II: Selection based on multiple traits. Agron. J. 2019, 111, 2961–2969. [Google Scholar] [CrossRef]
  21. Greveniotis, V.; Bouloumpasi, E.; Zotis, S.; Korkovelos, A.; Kantas, D.; Ipsilandis, C.G. Genotype-by-Environment Interaction Analysis for Quantity and Quality Traits in Faba Beans Using AMMI, GGE Models, and Stability Indices. Plants 2023, 12, 3769. [Google Scholar] [CrossRef] [PubMed]
  22. El Chami, J.; El Chami, E.; Tarnawa, Á.; Kassai, K.; Kende, Z.; Jolánkai, M. Effect of Fusarium infection on wheat quality parameters. Cereal Res. Commun. 2023, 51, 179–187. [Google Scholar] [CrossRef]
  23. Luckert, D.; Toubia-Rahme, H.; Steffenson, B.J.; Choo, T.M.; Molnar, S.J. Novel septoria speckled leaf blotch resistance loci in a barley doubled-haploid population. Phytopathology 2012, 102, 683–691. [Google Scholar] [CrossRef] [PubMed]
  24. Prahl, K.C.; Klink, H.; Hasler, M.; Verreet, J.A.; Birr, T. Will Climate Change Affect the Disease Progression of Septoria Tritici Blotch in Northern Europe? Agronomy 2023, 13, 1005. [Google Scholar] [CrossRef]
  25. Te Beest, D.; Paveley, N.; Shaw, M.; Van Den Bosch, F. Disease–weather relationships for powdery mildew and yellow rust on winter wheat. Phytopathology 2008, 98, 609–617. [Google Scholar] [CrossRef]
  26. Happ, M.M.; Graef, G.L.; Wang, H.; Howard, R.; Posadas, L.; Hyten, D.L. Comparing a mixed model approach to traditional stability estimators for mapping genotype by environment interactions and yield stability in soybean [Glycine max (L.) Merr.]. Front. Plant Sci. 2021, 12, 630175. [Google Scholar] [CrossRef]
  27. Kraakman, A.T.; Niks, R.E.; Van den Berg, P.M.; Stam, P.; Van Eeuwijk, F.A. Linkage disequilibrium mapping of yield and yield stability in modern spring barley cultivars. Genetics 2004, 168, 435–446. [Google Scholar] [CrossRef] [PubMed]
  28. Xavier, A.; Jarquin, D.; Howard, R.; Ramasubramanian, V.; Specht, J.E.; Graef, G.L.; Beavis, W.D.; Diers, B.W.; Song, Q.; Cregan, P.B. Genome-wide analysis of grain yield stability and environmental interactions in a multiparental soybean population. G3 Genes Genomes Genet. 2018, 8, 519–529. [Google Scholar] [CrossRef] [PubMed]
Figure 1. A correlation analysis for all study traits across genotypes and study environments. Protein content, PC; falling number, FN; Zeleny test, ZT; grain yield, GY; thousand-grain weight, TGW.
Agronomy 14 00779 g001
Figure 2. Biplot CCA for trial locations containing means of the study traits and soil characterizing locations. Reference bulk density, RBD; sand fraction, TSF; clay fraction, CF; soil nutrient availability class, SNA; available water capacity class, AWCC; soil organic carbon stock, SOCS; calcium carbonates, CaCO3; cation exchange capacity, CEC; C:N, CN; potassium content, K; nitrogen content, N; phosphorus content, P; pH in CaCl, CACLPH; pH in H2O, PHH20; protein content, PR falling number, FN; Zeleny test, ZT; grain yield, YL thousand-grain weight, TGW.
Agronomy 14 00779 g002
Figure 3. Biplot CCA for cultivar means of the study traits and additional traits characterizing these cultivars. Winter hardiness, WH; resistance to lodging, RTL; powdery mildew, PM; brown rust, BR; Septoria leaf blight, SLB; chaff Septoria, CS; diseases of the stem base, DSB; Fusarium ear blight, FEB; protein content, PR falling number, FN; Zeleny test, ZT; grain yield, YL; thousand-grain weight, TGW.
Agronomy 14 00779 g003
Figure 4. Biplot CCA for cultivars’ Shukla stability variance of study traits and additional traits characterizing these cultivars. Winter hardiness, WH; resistance to lodging, RTL; powdery mildew, PM; brown rust, BR; Septoria leaf blight, SLB; chaff Septoria, CS; diseases of the stem base, DSB; Fusarium ear blight, FEB; protein content Shukla stability PCS; falling number Shukla stability, FNS; Zeleny test Shukla stability, SVS; grain yield Shukla stability, GYS; thousand-grain weight Shukla stability, TGWS.
Agronomy 14 00779 g004
Table 1. Mean and coefficient of variance (CV) for winter wheat traits of trial locations across trial locations and growing seasons.
LocationYield (t ha−1)Thousand-Grain Weight (g)Protein (%)Falling Number (s)Zeleny Test (mL)
MeanCVMeanCVMeanCVMeanCVMeanCV
Bezek9.2212.8746.298.8213.646.03350.4824.4790.256.69
Bialogard8.04221.1851.218.3312.666.01319.1923.8775.4612.88
Glubczyce12.036.6943.3810.2612.897.46361.6618.9183.218.98
Jelenia Góra10.024.3241.918.6811.2814.8635115.4979.29.53
Kaweczyn9.739.6446.7215.7813.4512.69377.0518.0586.817.39
Koscielna Wies10.7314.9741.58.5613.735.98385.3216.8686.027.65
Krzyzewo9.1223.643.216.7313.034.43341.7125.8684.048.66
Lisewo12.646.5749.766.2512.218.34347.9720.2685.18.02
Pawlowice9.369.8238.4318.713.1110.63396.4516.1585.347.43
Ruska Wies8.7215.3545.59.6412.9110.17337.2222.1385.69
Sulejów8.5714.9738.911313.865.97405.7111.8880.612.1
Wegrzce11.136.5450.295.9911.699.19327.526.0480.649.61
Table 2. Mean and coefficient of variance (CV) for winter wheat traits of cultivars across trial locations and growing seasons.
CultivarsYield (t ha−1)Thousand-Grain Weight (g)Protein (%)Falling Number (s)Zeleny Test (mL)
MeanCVMeanCVMeanCVMeanCVMeanCV
Admont10.1821.6444.1814.6912.876.62295.8333.1683.466.99
Ambicja9.6311.746.8314.0213.589.4339911.2690.584.64
Apostel9.9225.9547.6511.613.027.34363.2213.5382.117.96
Argument9.3910.6845.5213.0213.411.04336.4217.8390.885.96
Artist10.4518.0746.6811.8512.3912.15381.919.2488.825.62
Bataja9.1719.844.8910.213.037.16351.9413.0987.57.47
Blyskawica9.9828.1546.459.6412.586.17201.5651.577.349.07
Bonanza11.697.4447.6310.5511.899.71337.526.1378.6710.75
Bosporus9.8416.3642.2615.7212.687.71339.5614.9778.6110.15
Comandor10.1123.2444.339.0113.267.54392.6112.8177.539.81
Euforia10.3425.3545.029.0713.356.93989.9582.177.58
Formacja9.9921.3543.0612.8713.29.45382.9510.184.816.03
Hybery F112.038.446.2811.1211.637.27337.6714.276.0811.51
Impresja9.5315.6943.711.7914.187.35375.2513.8480.928.6
Kariatyda9.6712.5446.1211.7713.79.42398.3312.6184.048.71
Kometa9.4731.1743.6215.3313.1914.02348.6717.3268.2510.2
KWS Donovan10.1218.9243.5512.6913.057.73350.888.8374.6710.64
KWS Firebird10.6017.4843.1214.6613.0510.25398.811.3891.34.32
KWS Spencer10.3819.8747.4914.2212.9412.62390.131889.834.47
KWS Talium9.4612.4841.3812.0613.0110.32384.0815.3787.139.4
KWS Universum9.4615.4244.3113.3613.5210.6371.2514.385.138.65
LG Jutta10.5211.6139.7813.0912.0311.19343.7516.3580.427.47
LG Keramik9.8820.0543.3410.7913.145.61336.7817.1591.065.41
Lindbergh10.3022.9746.159.7212.6210.73353.6714.3675.55.54
Lokata9.7822.7444.298.7913.267.38401.3316.9283.148.32
Medalistka10.7613.8348.7112.5512.3210.97396.511.9284.217.25
MHR Promienna9.3413.8541.9512.112.949.32313.3321.3384.679.28
Moschus9.1121.5545.998.4814.157.3428.068.5590.174.85
Nordkap10.3820.846.0811.5212.9610.28381.514.4787.465
Opcja9.9815.5141.9616.7912.4510.3313.8322.3873.716.37
Opoka9.6320.3948.5612.4913.417.01377.949.4684.637.67
Owacja10.7017.9244.7612.3412.7211.26311.9320.7680.176.56
Patras9.6723.2649.8610.8613.319.11384.2719.2484.46.2
Plejada10.1028.8446.199.3512.57.46362.4415.679.4410.88
Reduta9.7321.0645.3712.0113.147.7377.6714.1881.147.55
RGT Bilanz10.9319.8345.2910.3112.499.2378.9315.9289.94.28
RGT Kilimanjaro10.2419.6445.1512.7613.39.27407.97.9789.984.85
RGT Metronom10.3418.148.5113.4113.411.31385.619.9987.931.97
RGT Provision9.7118.2744.0810.4512.97.37288.1719.9980.676.79
RGT Ritter10.0213.5747.1811.7413.0710.28373.3316.8680.56.84
RGT Specialist9.6318.7741.2811.1312.887.6369.8314.7483.315.31
Rivero10.6214.4542.5514.4812.2210.6387.7515.0785.885.31
Sfera10.4717.4443.8617.8912.6510.06349.216.4675.938.28
SU Mangold9.9410.8441.4519.9513.2711.26339.8329.6181.886.66
SU Petronia10.0815.5744.0814.6212.9412.09275.6735.3670.718.27
SU Tarroca10.1816.5348.8211.7413.0210.93245.6729.7662.8812.12
SU Viedma9.8719.9446.7615.7813.398.65284.7822.6280.5610.46
SY Cellist9.5015.2144.212.2313.5711.29358.3318.886.216.67
SY Dubaj9.3220.3747.698.3613.67.45431.227.1593.817.91
SY Orofino10.2120.3346.4511.1412.716.66285.2819.9885.395.44
SY Yukon9.3720.3244.8110.5813.127.02439.837.2894.315.23
Symetria9.341238.9614.5413.169.88412.586.1480.798.79
Titanus10.6522.0948.213.0612.569.31292.8735.7792.43.95
Tytanika10.4219.6841.314.9612.618.31315.0728.9774.58.75
Venecja9.8318.6446.6913.8213.115.14376.1110.6689.565.34
Table 3. Ranked Shukla stability variances, the cultivars’ cumulative ranking across all study traits, and the multi-trait stability index.
CultivarsRanking of Shukla Stability VarianceMTSI
YieldThousand-Grain WeightProteinFalling NumberZeleny TestSumMinMaxValueRanking
Admont384436544421636543.8536
Ambicja2220253171057312.7714
Apostel484751435424343542.8216
Argument3544332271414433.4625
Artist192449112512811492.133
Bataja1131814371143.5427
Błyskawica494840555024240554.646
Bonanza253611404615811463.2119
Bosporus173510103710910374.5345
Comandor324255394921732553.8435
Euforia503052295321429533.3420
Formacja63392222923393.7831
Hybery F13341139481449483.7230
Impresja5291735361225364.6448
Kariatyda4503841201534503.3521
Kometa553231331917019555.2854
KWS Donovan81822231812314.3642
KWS Firebird1414417281047412.6913
KWS Spencer415244284020528522.012
KWS Talium111128461611211464.1939
KWS Universum464033161114611464.138
LG Jutta4261626381286424.3944
LG Keramik44215176842443.3924
Lindbergh5412192791219543.5226
Lokata403154495222631543.5628
Medalistka373312154314012431.811
MHR Promienna1553537211135374.7349
Moschus43827122922433.7932
Nordkap5337919121309532.58
Opcja512514501815814514.9150
Opoka262121115841262.6712
Owacja122648364716912483.8434
Patras31277243923312.255
Plejada522845425522228553.3623
Reduta244950445121824513.7129
RGT Bilanz302320143312014332.286
RGT Kilimanjaro2221844502222.457
RGT Metronom104546343416910462.144
RGT Provision13165231581234.3241
RGT Ritter3532338321493532.9818
RGT Specialist21782110677214.2640
Rivero4710320241043472.9717
Sfera9513218411519514.3843
SU Mangold185537482618418554.6147
SU Petronia7435352301857535.3855
SU Tarroca205442303918520545.1152
SU Viedma234634452917723463.9437
SY Cellist3413025231131343.8333
SY Dubaj28344513844342.6211
SY Orofino2794751451799513.3622
SY Yukon1617265462172.7815
Symetria3939241381238395.0951
Titanus451529533517715532.529
Tytanika293826474218226475.1353
Venecja36196317813362.5710
Disclaimer/Publisher’s Note: The statements, opinions and data contained in all publications are solely those of the individual author(s) and contributor(s) and not of MDPI and/or the editor(s). MDPI and/or the editor(s) disclaim responsibility for any injury to people or property resulting from any ideas, methods, instructions or products referred to in the content.

