Article

Quantitative Relationship of Plant Height and Leaf Area Index of Spring Maize under Different Water and Nitrogen Treatments Based on Effective Accumulated Temperature

1
College of Hydraulic and Civil Engineering, Xinjiang Agricultural University, Urumqi 830052, China
2
Xinjiang Key Laboratory of Hydraulic Engineering Safety and Water Disaster Prevention, Urumqi 830052, China
*
Author to whom correspondence should be addressed.
Agronomy 2024, 14(5), 1018; https://doi.org/10.3390/agronomy14051018
Submission received: 3 April 2024 / Revised: 23 April 2024 / Accepted: 9 May 2024 / Published: 11 May 2024
(This article belongs to the Section Water Use and Irrigation)

Abstract

:
To optimize the growth management of spring maize, it is essential to understand the dynamics of plant height and leaf area index (LAI) under controlled water and nitrogen supply. This study conducted two-year field experiments (2022–2023) in Karamay, Xinjiang. Three irrigation levels (75%, 100%, and 125% of Crop Evapotranspiration (ETc)) and four nitrogen application rates (0, 93, 186, and 279 kg N/ha) were set. A logistic growth model was fitted using accumulated effective temperature as the independent variable to analyze the growth and development characteristics of spring maize under various water and nitrogen conditions. The results demonstrated that the logistic models, based on relative effective accumulated temperature, had a determination coefficient (R2) of over 0.99 and a Normalized Root Mean Square Error (NRMSE) of less than 10%. Irrigation extended the rapid growth phase of plant height, whereas nitrogen application shortened the time to enter this rapid growth phase and prolonged its duration. Irrigation increased the maximum LAI growth rate and shortened and prolonged the rapid growth phase, while nitrogen extended the duration of the rapid growth phase for LAI. The W2N2 treatment, consisting of 100% ETc irrigation and 186 kg N/ha, was identified as the optimal drip irrigation water–nitrogen combination for spring maize in the study area. Under optimal water and nitrogen supply, both the maximum growth rate and the average growth rate during the rapid growth phase were higher, requiring accumulated effective temperatures of 825.16–845.74 °C·d and 856.68–890.00 °C·d, respectively, to reach these rates. The appropriate water and nitrogen supply significantly enhanced the synergistic promotion of growth and development in spring maize. This study provides a theoretical basis for the quantitative analysis of growth dynamics in summer maize using effective accumulated temperature.

1. Introduction

Maize, as one of the most widely cultivated and highest yielding crops globally, plays a crucial role in global food supply, energy production, feed manufacturing, and industrial applications [1]. The growth condition is a key factor influencing yield formation, and accurately mastering and regulating the dynamics of maize growth is of both theoretical and practical significance for ensuring global food security and promoting economic development [2]. Qualitative descriptions of maize growth only provide a superficial understanding of growth trends. In contrast, quantitative analysis of the dynamics of maize growth and development is essential for clearly understanding how to control the crop’s growth indicators.
Irrigation and fertilization are indispensable components of agricultural production, directly affecting crop growth and development. Effective irrigation management is crucial for enhancing crop growth and yield. Plant height is a vital indicator of crop vigor, growth rate, and health status, providing a direct reflection of the impact of irrigation and fertilization. Effective water and nitrogen supply is key to ensuring overall healthy growth of maize plant height [3]. The LAI is a critical indicator reflecting changes in leaf area of plant communities and internal light capture, directly affecting the light use efficiency of plant communities and being closely related to yield formation. Changes in the LAI reflect maize’s response to environmental conditions, and irrigation and nitrogen application directly affect changes in the LAI and can even impact yield. Plant height and the LAI exhibit regular dynamic changes throughout the growth period, but water and nitrogen supply can affect these dynamics. Analyzing crop growth dynamics can optimize water and nitrogen management strategies [4]. Crop growth models are effective for quantitatively describing crop growth dynamics. The growth dynamics of crops, including plant height, LAI, and dry matter accumulation, can be accurately described by growth models, with the logistic model being particularly effective and widely used [5,6]. For instance, Ding et al. [7] analyzed the dynamics of plant height and dry matter accumulation during a winter wheat–summer maize rotation using the logistic model, thoroughly evaluating the impact of continuous mulching on crop growth. Sepaskhah et al. [8] used the logistic model to quantitatively analyze the impact of seasonal water and nitrogen management on maize dry matter accumulation and yield formation, establishing a well-functioning empirical model for simulating maize dry matter and yield. Temperature is a key factor for normal crop growth, and effective accumulated temperature reflects the temperature required for crop growth during the growth period, providing a more stable basis than growth time alone. Crop growth models based on effective accumulated temperature can more accurately quantify the dynamic process of crop growth [9]. Gong et al. [10] evaluated the impact of effective accumulated temperature on spring maize yield and yield components, optimizing management strategies for different maize varieties. Luan et al. [11] constructed a general model for estimating maize LAI based on effective accumulated temperature, considering different varieties, soil properties, planting densities, and management measures. Wang et al. [12] found that logistic models based on effective accumulated temperature could effectively simulate the dry matter accumulation process in grapes. There is extensive research on the simulation and quantitative analysis of dry matter accumulation and yield for various crop varieties, planting dates, and management measures based on effective accumulated temperature, but there is less research on the quantitative analysis of plant height and LAI, and there remains a lack of systematic studies simulating crop growth and development under different water and nitrogen conditions based on effective accumulated temperature.
This study, based on effective accumulated temperature, constructed a dynamic logistic model for spring maize plant height and LAI under different water and nitrogen conditions. It reveals the effective accumulated temperature requirements of spring maize under various water and nitrogen conditions and discusses the quantitative relationship between water and nitrogen conditions and the dynamics of plant height and LAI in spring maize. This provides a basis for predicting the growth dynamics of spring maize plant height and LAI based on effective accumulated temperature and offers theoretical support for using effective accumulated temperature to quantitatively analyze crop growth dynamics.

2. Materials and Methods

2.1. Physical Overview of the Experimental Area

The experiment was conducted in 2022–2023 (April–October) in the Agricultural Comprehensive Development Zone of Karamay City, Xinjiang Uyghur Autonomous Region, China (84°93′ E, 45°46′ N) (Figure 1). The experimental area is characterized by a continental arid desert climate (Köppen–Geiger climate classification: BWk) [13,14], with low precipitation and high evaporation. The annual average temperature is 8.1 °C, the annual average precipitation is 101.1 mm, and the annual average evaporation is 3545.2 mm. The total annual sunshine hours range from 2600 to 3400 h, with a frost-free period of 197 to 268 days. In the test area, according to the USDA soil classification [15], the soil type from 0 to 40 cm is classified as loam, with a composition of 53.65% sand, 27.48% silt, and 18.87% clay. From 40 to 100 cm, the soil is characterized as sandy loam, containing 66.26% sand, 24.55% silt, and 13.19% clay, with a groundwater level of 3–4 m. Before maize planting, the soil fertility status of the tillage layer (0–20 cm) was as follows: pH 8.30 (the potentiometric method), organic matter content 17.88 g/kg (the dichromate oxidation method), alkali-hydrolyzable nitrogen 62.92 mg/kg (the alkaline diffusion method), available phosphorus 11.81 mg/kg (atomic absorption spectrometry), and available potassium 140.20 mg/kg (the molybdenum antimony colorimetric method). The temperature and precipitation changes during the spring maize growing season in 2022–2023 are shown in Figure 2. The effective accumulated temperature in 2022 was 2017.41 °C·d, and in 2023, it was 2042.47 °C·d.

2.2. Experimental Materials and Experimental Design

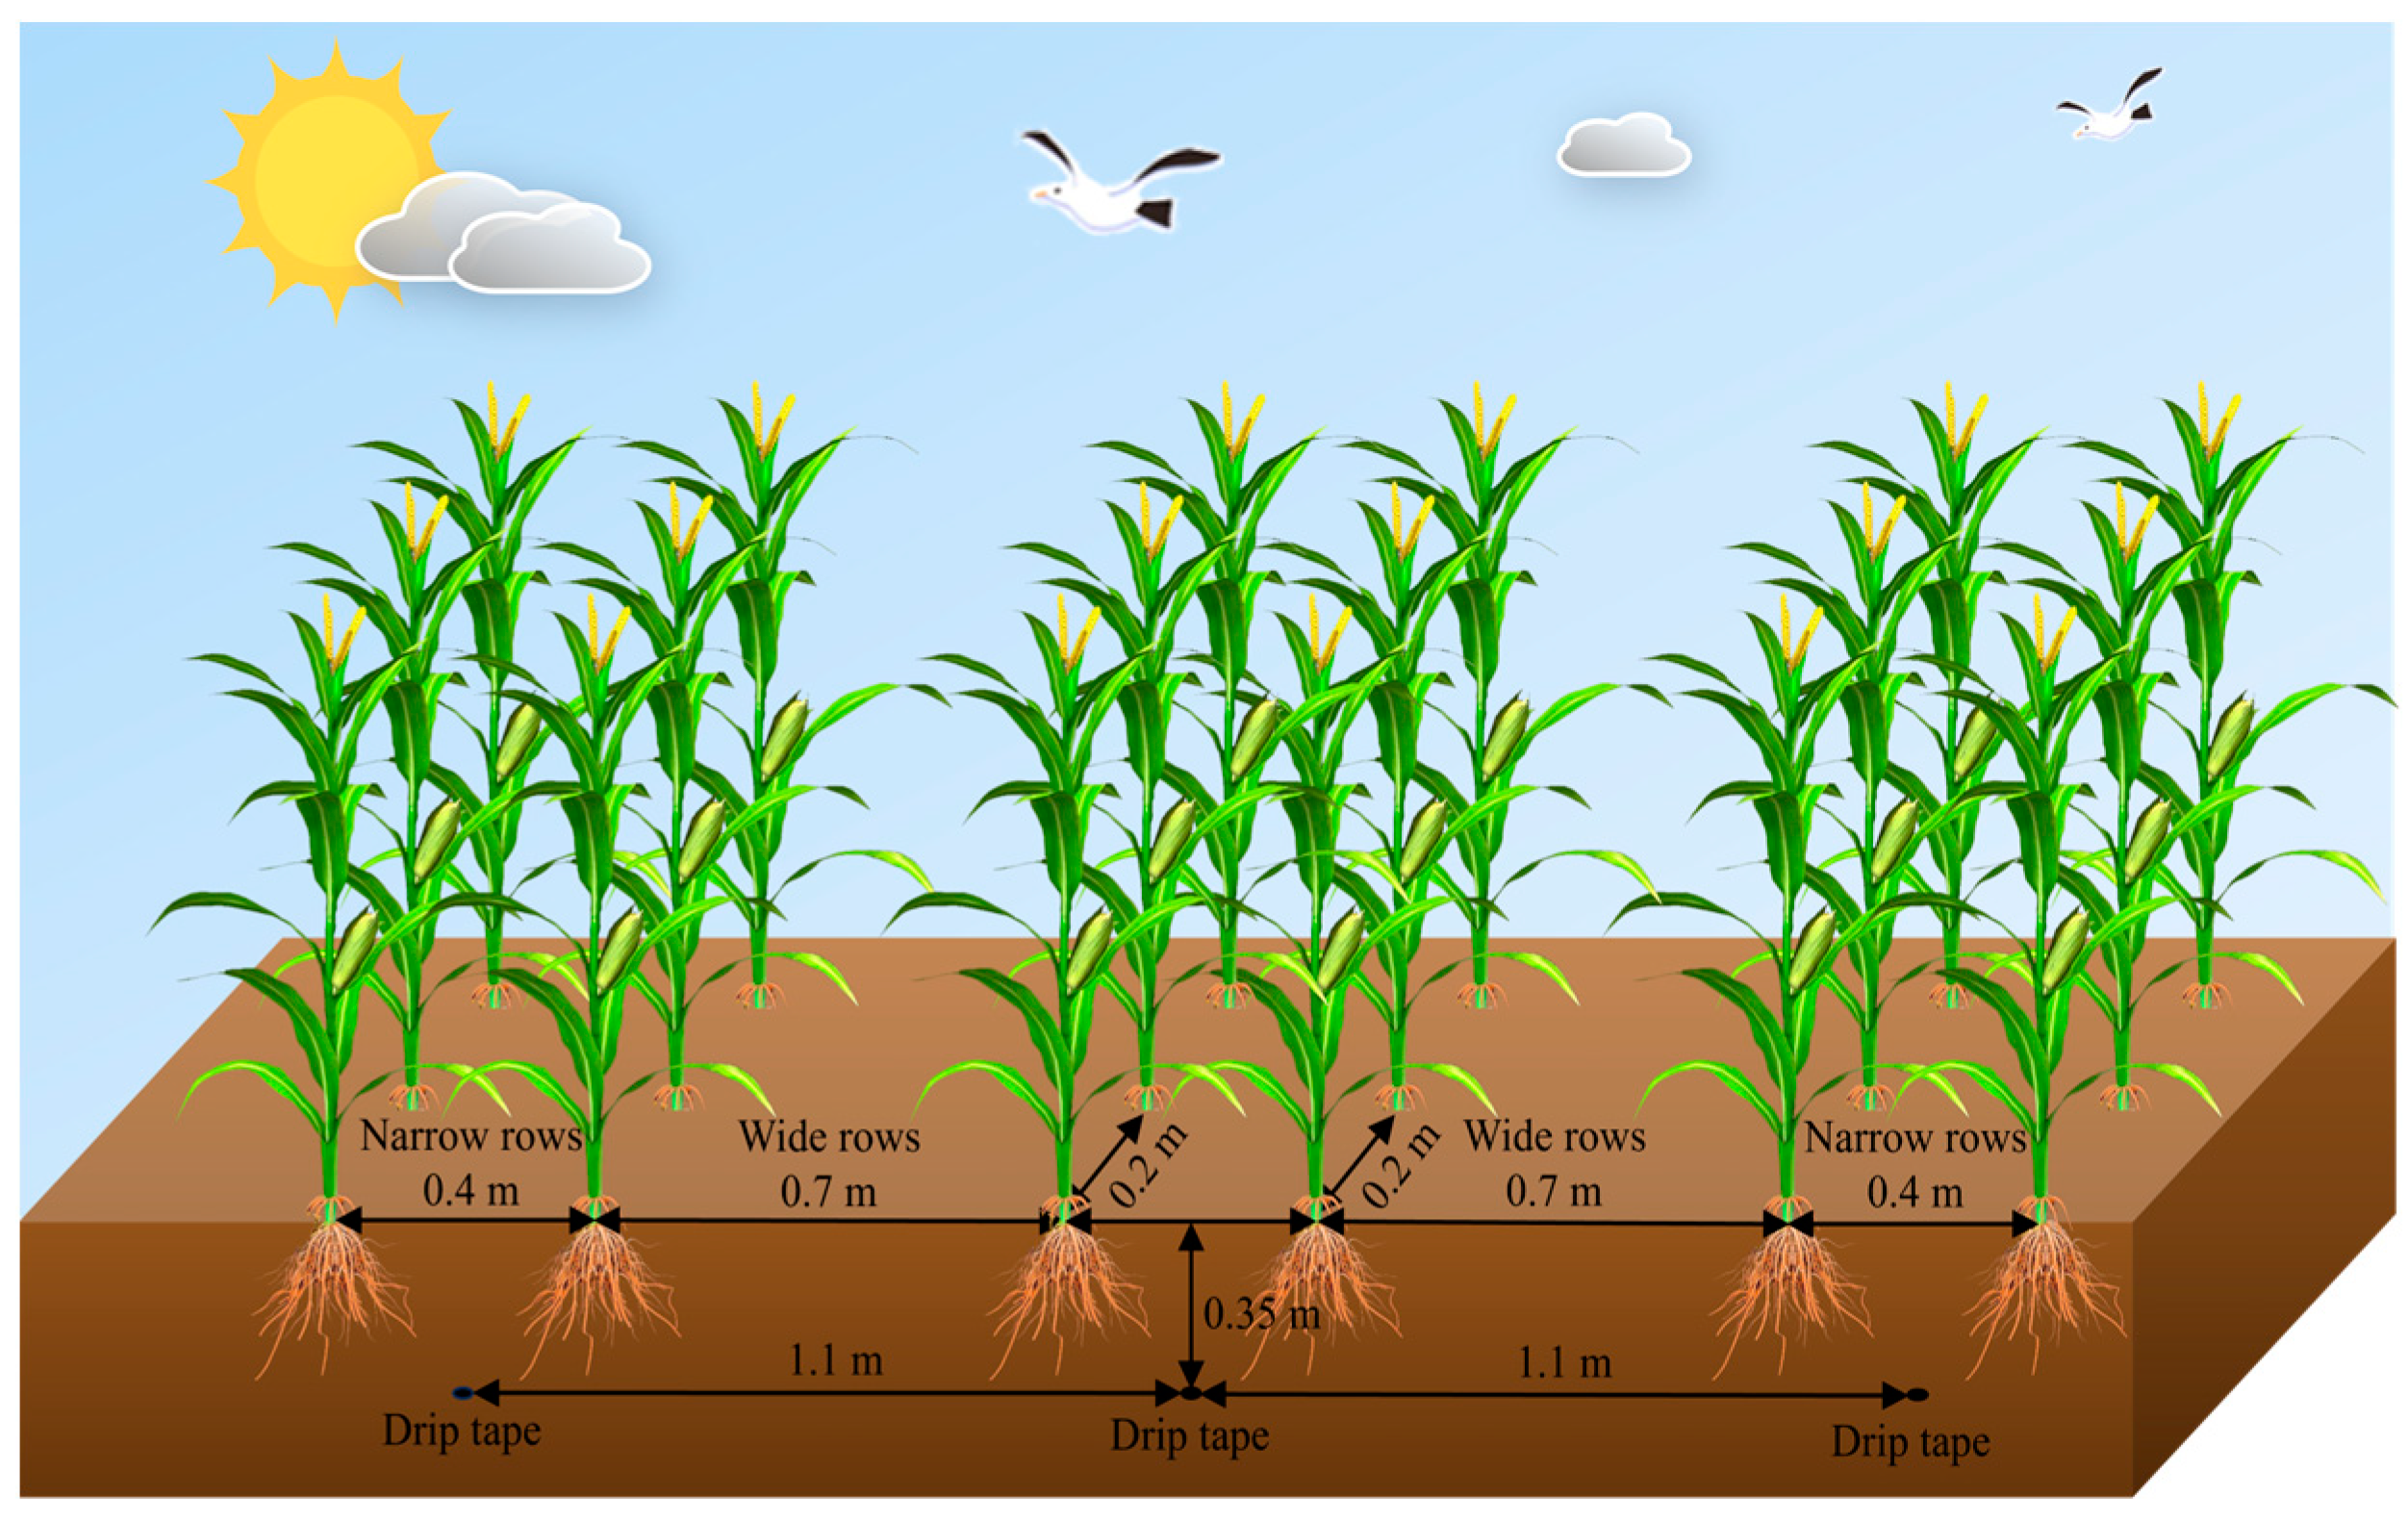
The experimental spring maize variety used was Xinong 008 (nominal height: 292 cm). The experiment was designed as a factorial trial with three levels of irrigation (75% ETc (W1), 100% ETc (W2), and 125% ETc (W3)) and four levels of nitrogen application (0 kg N/ha (N0), 93 kg N/ha (N1), 186 kg N/ha (N2), and 279 kg N/ha (N3)). There was a total of 12 treatments, each replicated three times, resulting in 36 plots arranged in a randomized complete block design. Each plot was 48 m2 (6 m × 8 m) in size, with a 1.1 m wide buffer row between adjacent plots. The spring maize was planted in alternating narrow (0.4 m) and wide (0.7 m) row spacings. The planting distance in the row was 0.2 m, resulting in a plant density of 80,000 plants/ha. The subsurface drip irrigation pattern and field layout for spring maize planting are shown in Figure 3.
Irrigation was conducted using subsurface drip irrigation, with the drip tape buried at a depth of 0.35 m, an inter-row spacing of 1.1 m, a dripper spacing of 0.3 m, and a dripper flow rate of 2.8 L/h. Sowing was carried out using a dry sowing and wet emergence technique, with an irrigation volume of 45 mm for seed emergence. Apart from emergence irrigation, the crops were watered 10 times throughout the growing season, with a 7-day interval between irrigations. Fertilization was conducted concurrently with irrigation during the experiment. For the nitrogen treatments, the fertilizers used were urea (containing 46% N, Xinjiang Jinjiang Chemical Co. Ltd., Kuitun, China), monoammonium phosphate (containing 12% N and 61% P2O5, Shandong Anquan Chemical Technology Co. Ltd., Zibo, China), and potassium sulfate (containing 52% K2O, Sdic Xinjiang Lobopo potash Co. Ltd., Ürümqi, China). Monoammonium phosphate was applied at a rate of 200 kg/ha, and potassium sulfate at 130 kg/ha. For the plots without nitrogen treatment, dipotassium phosphate (containing 52% P2O5 and 34% K2O, Wuhan Nanqing Technology Development Co. Ltd., Wuhan, China) was used. The phosphorus and potassium nutrient levels were maintained consistently across all treatment plots. The application rates of nitrogen, phosphorus, and potassium fertilizers varied according to the growth stages of spring maize, with the distribution of fertilizer application at the seedling stage (once), jointing stage (three times), tasseling stage (three times), and grain filling stage (three times) being 10%:10%:10%, 12%:5%:5%, 12%:15%:15%, and 6%:10%:10%, respectively.
The irrigation volume for each event during the growth period was determined based on the actual crop water demand during the previous irrigation cycle. The calculation formula is as follows:
E T C = K C × E T 0
where ETc represents the crop water demand for spring maize, and ET0 denotes the reference crop evapotranspiration, which is calculated using the Penman–Monteith equation recommended by the Food and Agriculture Organization (FAO) (Rome, Italy) [16]. Meteorological parameters such as atmospheric pressure, temperature, solar radiation, wind speed, and relative humidity are automatically recorded every hour by the experimental area’s weather station (HOBO event logger, Onset Computer Corporation, Bourne, MA, USA). The crop coefficient Kc values are determined based on the FAO-56-recommended Kc table for spring maize as a sole crop and on the literature [17]. The crop coefficients for the different growth stages—seedling, jointing, tasseling, and grain filling—are 0.7, 0.99, 1.02, and 1.2, respectively.

2.3. Sample Collection and Measurement

Plant height: Within each growth stage, three plants were randomly selected and marked within each experimental plot. Plant height was measured using a tape measure from the ground to the tip of the main stem of the maize. From the tasseling stage onwards, the measurement was taken from the ground to the tip of the tassel.
Leaf area index (LAI): This was determined through measurements of leaf length and maximum leaf width, along with statistics on the ground area occupied by the maize. For each plot, three plant samples were collected, and the length and width of the maize leaves were measured using a tape measure. The calculation of maize leaf area employed the length–width coefficient method, with an empirical coefficient (k) of 0.75. The formula for the calculation is as follows:
L A I = 1 m i = 1 n L i × W i × D × k S
where LAI represents the leaf area index; m is the number of sampled plants; n is the total number of leaves on the sampled plants; Li is leaf length (cm); Wi is leaf width (cm); k is the leaf area correction coefficient, set at 0.75; D is plant density (plants/m2); S is the conversion coefficient, 10,000 (cm2/m2).
Effective accumulated temperature: Meteorological station data were used to calculate the average temperature, from which the effective accumulated temperature (TGDD) for the entire growing period was determined.
T G D D = i = 1 n T max + T min 2 T b a s e
where TGDD represents the effective accumulated temperature (°C·d) on the nth day after sowing; Tmax is the daily maximum temperature (°C); Tmin is the daily minimum temperature (°C); Tbase is the base temperature required for crop growth activities (°C). The base temperature for maize was identified as 10 °C [18].

2.4. Characteristic Parameters of the Logistic Equation and Validation of Its Effectiveness

2.4.1. The Logistic Model and Its Characteristic Parameters

The logistic growth model is a commonly used mathematical framework designed to describe the growth of populations or individual organisms within limited growth environments. This model is not only applicable in the fields of ecology and biology but is also widely utilized in agricultural science, particularly for simulating the dynamics of crop growth [19].
The growth process of crops exhibits an “S” shaped trend, conforming to the logistic model, with the model equation as follows:
Y = a 1 + b e c x
where Y represents the relevant indicators for spring maize; a is the limit value that the relevant indicator can reach under specific environmental conditions for the crop; b is the intercept coefficient; c is the growth rate coefficient of the relevant indicator; x represents the value of effective accumulated temperature (TGDD).
Differentiating Equation (4) yields the equation for the growth rate of the relevant growth indicators.
V = abce cx ( 1 + be cx ) 2
By taking the first derivative of Equation (5) and setting it to zero, the maximum growth rate of the relevant growth indicators, V1, can be determined, and the effective accumulated temperature (T1) at which this maximum rate occurs can be calculated.
V 1 = ac 4
T 1 = ln b c
Taking the second derivative of Equation (5) allows for the identification of the inflection points T2 and T3 on the growth curve. From T2 and T3, the average growth rate V2 during the rapid growth phase can be calculated.
T 2 = ln b ln ( 2 + 3 ) c
T 3 = ln b ln ( 2 3 ) c
V 2 = a 3 ( T 3 T 2 )

2.4.2. Model Validity Test

The model’s fit can be evaluated using the coefficient of determination (R2) and the Normalized Root Mean Square Error (NRMSE). The formulas for calculation are as follows [20]:
R 2 = i = 1 n O i O ¯ S i S ¯ i = 1 n O i O ¯ 2 0.5 i = 1 n S i S ¯ 2 0.5 2
N R M S E = 1 n i = 1 n S i O i 2 0.5 O ¯ × 100
where Oi represents the observed values, Si represents the simulated values, S ¯ is the average of Si, O ¯ is the average of Oi, and n is the sample size. The closer the coefficient of determination R2 is to 1, the better the fit of the equation. An NRMSE less than 10% signifies excellent model fitting. An NRMSE between 10% and 20% indicates good model fitting, between 20% and 30% suggests moderate model fitting, and an NRMSE greater than 30% indicates poor model performance [21].

2.4.3. Statistical Data Analysis

In this study, multiple comparisons were conducted using the Least Significant Difference (LSD). Curve Expert 1.4 was utilized for fitting the logistic model, Origin 2021 for graphing, and SPSS 22.0 for statistical analysis.

3. Results

3.1. Analysis of the Correlation between the Plant Height and LAI of Spring Maize under Different Water and Nitrogen Treatments

To apply the logistic model for simulating the growth dynamics of plant height and the LAI in spring maize, a correlation analysis was performed on plant height and LAI under different water and nitrogen treatments (Table 1). The results indicated that, during the 2022–2023 growing seasons, the growth dynamics of plant height and LAI in spring maize under various water and nitrogen treatments were consistent, with both exhibiting a correlation coefficient above 0.98, indicating a highly significant positive relationship. This suggests that a single model can be employed to fit and analyze the growth patterns of plant height and the LAI in spring maize.

3.2. Dynamics of Plant Height in Spring Maize and Its Effective Accumulated Temperature Model

3.2.1. Dynamics of Plant Height in Spring Maize as Influenced by Effective Accumulated Temperature under Different Water and Nitrogen Treatments

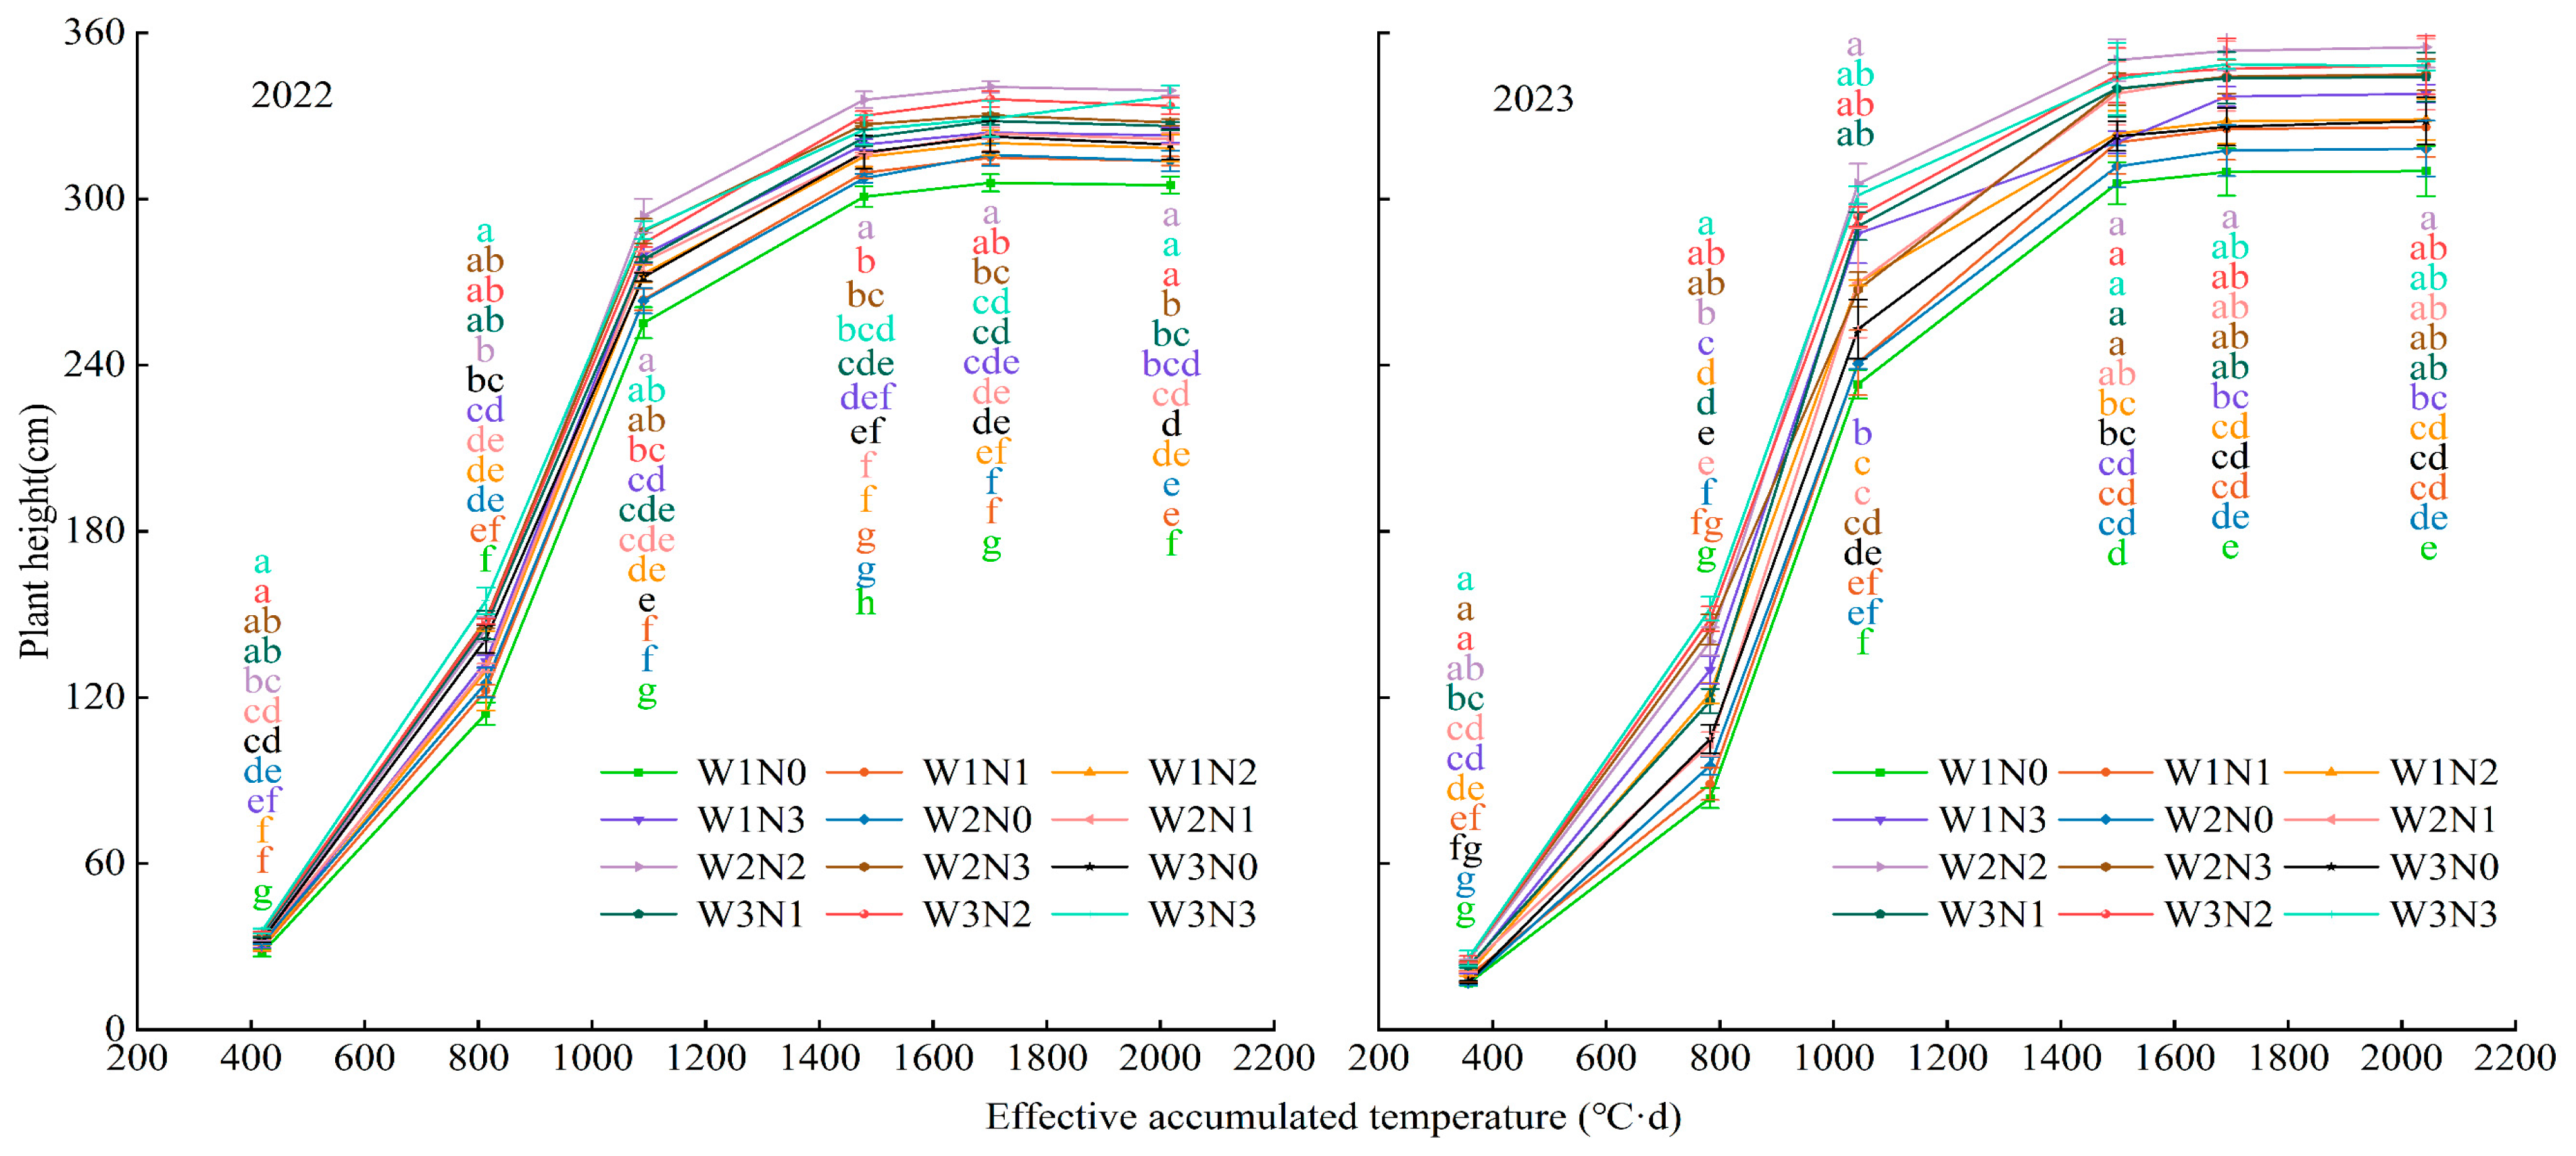
Under different water and nitrogen treatments, the plant height dynamics of spring maize consistently exhibited a slow–fast–slow S-shaped logistic model trend in relation to the accumulation of effective temperature (Figure 4). In the early growth stages, plant height increased with nitrogen application at a constant irrigation level, and, similarly, plant height increased with irrigation volume at a constant nitrogen level. The highest plant heights over two years were observed in the W2N2 treatment, reaching 339.17 cm and 354.87 cm, respectively; the second highest in 2022 was under the W3N3 treatment, while in 2023, it was under the W3N2 treatment, followed by W3N3. The lowest plant heights were consistently found in the W1N0 treatment, at 305.00 cm and 310.10 cm, respectively. These variations in plant height under different water and nitrogen treatments highlighted significant differences, indicating the substantial impact of water and nitrogen supply on the growth of spring maize. In the later growth stages, plant heights in the W2N2 treatment surpassed those in the W2N3, W3N2, and W3N3 treatments, although not significantly, suggesting that excessive application of water and nitrogen does not markedly enhance plant height growth. These experimental patterns remained consistent over two years. According to the growth patterns observed across the treatments, the W2N2 treatment, with a 100% ETc irrigation level and a nitrogen application rate of 186 kg N/ha, was found to be the most conducive to plant height growth.

3.2.2. Establishment and Validation of a Growth Model for Spring Maize Plant Height

Utilizing Curve Expert 1.4 software, a nonlinear fitting of the logistic model was conducted for the effective accumulated temperature and plant height under various treatments during 2022–2023, to obtain equation parameters and derive the logistic dynamic fitting equations for plant height in each treatment (Table 2).
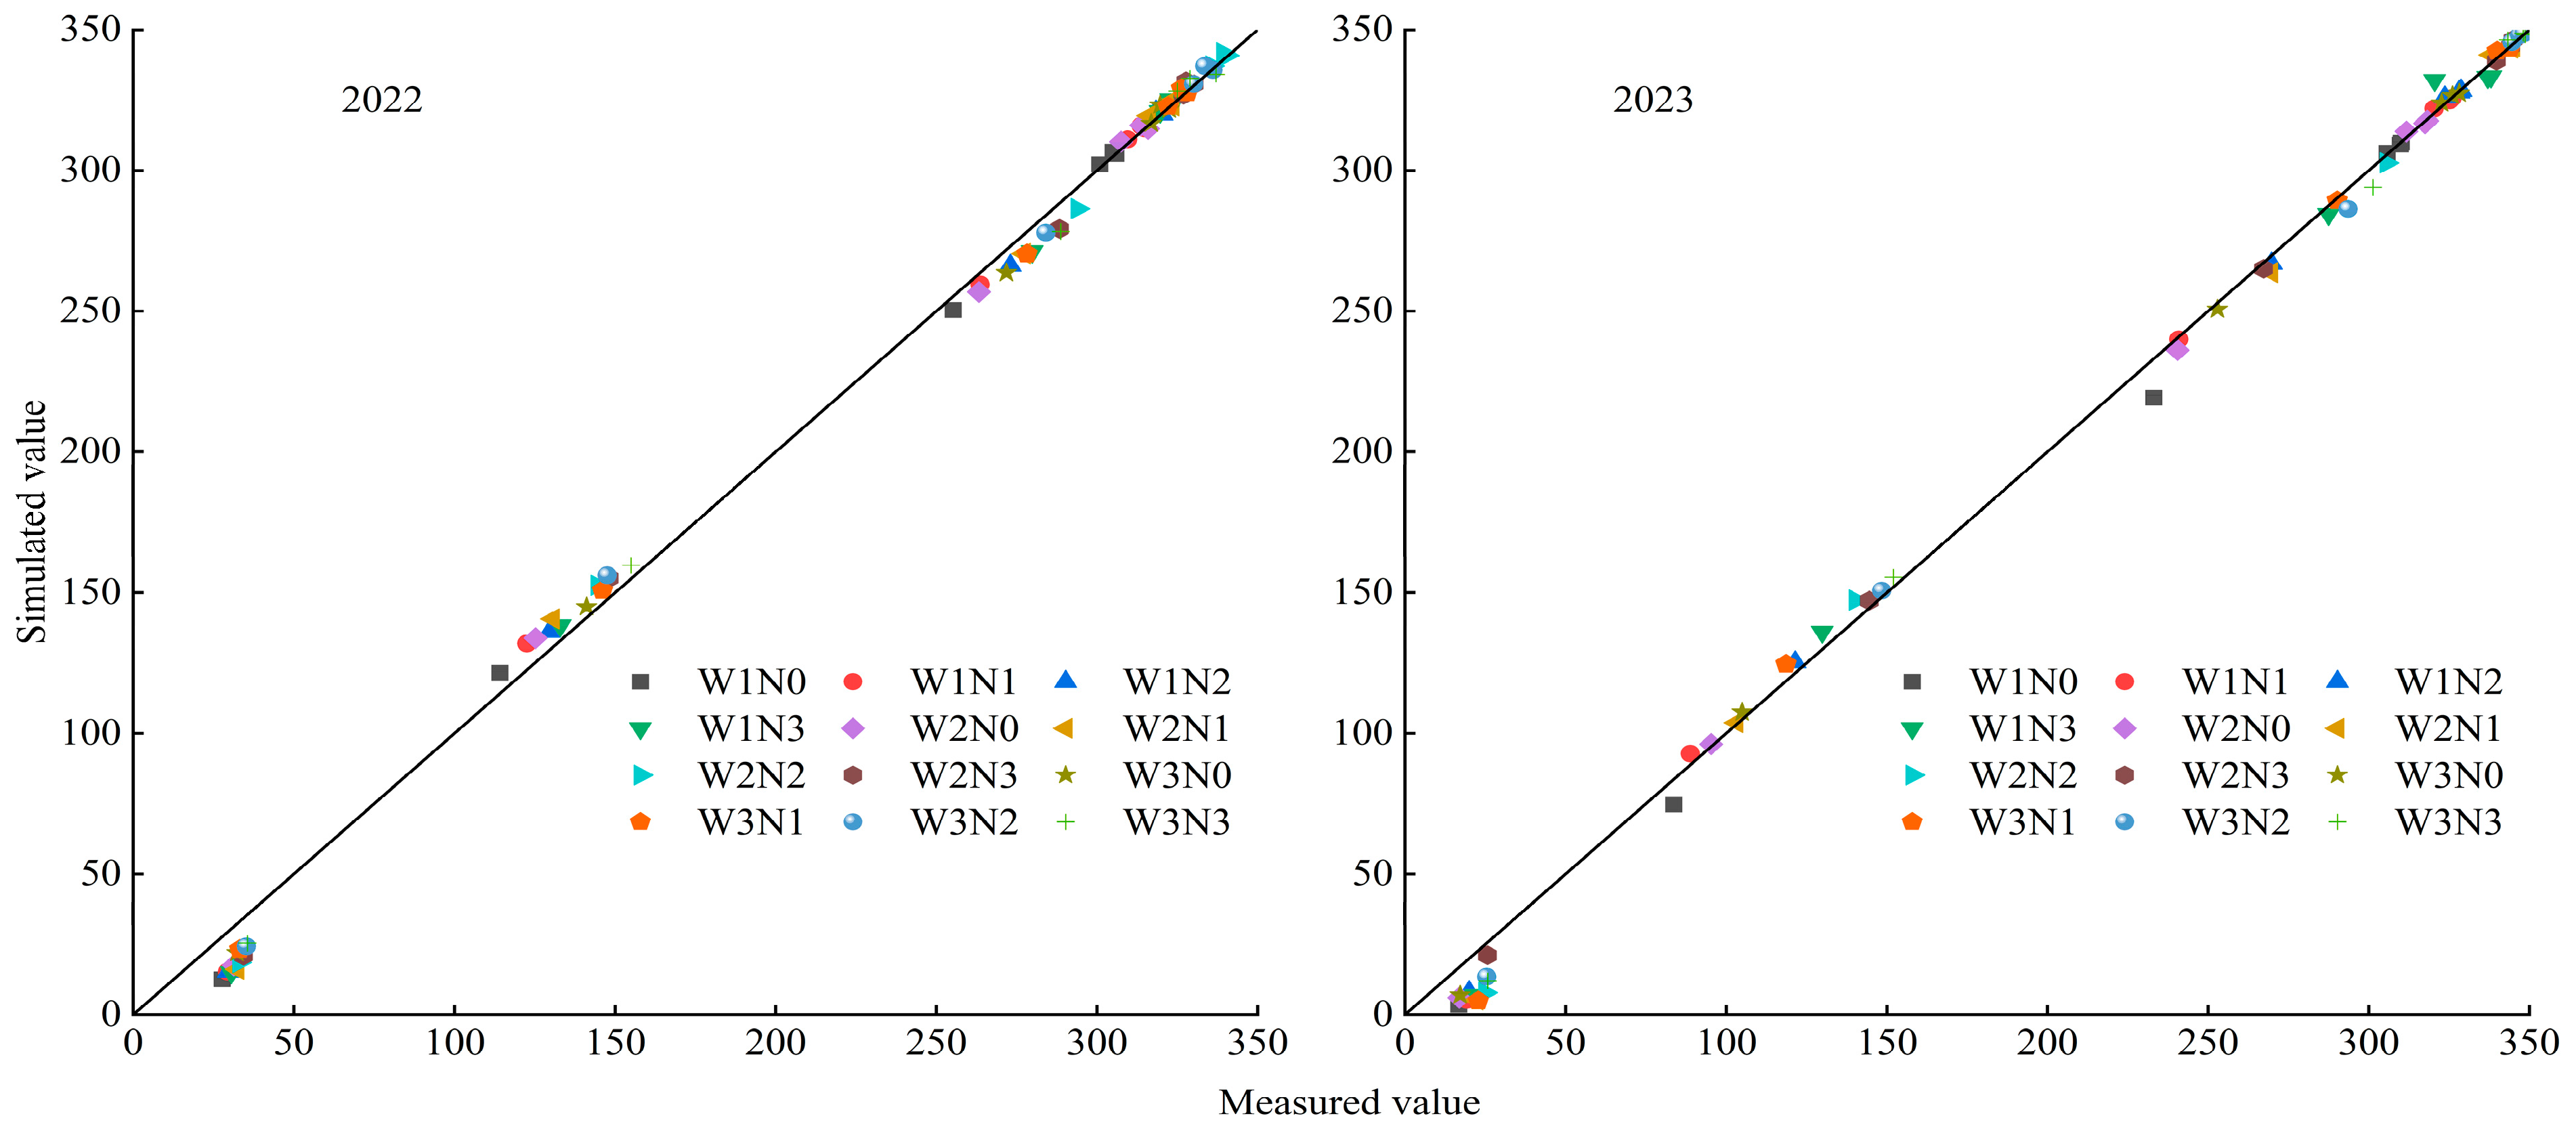
We evaluated the model’s performance in terms of accuracy and precision as presented in Table 3. The logistic growth model for spring maize, established based on relative effective accumulated temperature from 2022 to 2023, achieved NRMSE values ranging from 0.98% to 4.11%, all below 10%, and R2 from 0.9957 to 0.9997, indicating excellent model fitting. This underscores that the logistic model, based on relative effective accumulated temperature, can accurately describe the growth process of spring maize plant height under drip irrigation conditions. The 1:1 plot of measured versus simulated values for each treatment (Figure 5) shows that the actual and simulated plant heights are uniformly distributed near the 1:1 line, suggesting that under the conditions of this experiment, the logistic simulation of plant height growth holds significant biological relevance. This allows for the analysis of the dynamic changes in spring maize plant height under different water and nitrogen treatments in relation to effective accumulated temperature.

3.2.3. Analysis of Characteristic Parameters in the Model Equation for Plant Height in Spring Maize

An analysis of the characteristic parameters of the logistic model for plant height in spring maize under different water and nitrogen treatments during 2022–2023 was conducted (Table 4). It was found that the effective accumulated temperature required for spring maize to reach the rapid growth phase was significantly lower in the W2N2 treatment, with the highest growth rate in plant height, compared to the W1N0 treatment over two years, showing a significant average reduction of 57.21 °C·d, 56.93 °C·d, and 57.49 °C·d, respectively. This indicated the highest rate of growth in plant height. With the same nitrogen application level, an increase in the amount of irrigation water extended the duration of the rapid growth phase. At the W1 irrigation level, as the amount of nitrogen applied increased, the accumulated temperature required to achieve the maximum growth rate in plant height decreased, and plants entered the rapid and slow growth phases earlier. At the W2 irrigation level, with increasing amounts of nitrogen, the accumulated temperature required for reaching the maximum growth rate in plant height showed fluctuating changes; the temperature required was lower for W2N3, indicating an earlier entry into the rapid and slow growth phases. However, the maximum growth rate was highest for W2N2, with a significantly higher growth rate during the rapid growth phase compared to other treatments. At the W3 irrigation level, with increasing nitrogen application, the accumulated temperature needed to reach the maximum growth rate in plant height decreased, and plants entered the rapid and slow growth phases earlier, but the maximum growth rate showed a trend of increasing and then decreasing. While the model parameters varied slightly over the two years, the overall patterns were consistent. Based on the analysis of plant height changes with water and nitrogen supply in conjunction with model parameters, it is suggested that irrigation prolongs the duration of the rapid growth phase, while nitrogen application shortens the time to enter the rapid growth phase and extends its duration. The W2N2 treatment exhibited the highest growth rate and the best development, with the effective accumulated temperature required to reach the maximum growth rate being 825.16–845.74 °C·d, indicating an appropriate level of water and nitrogen supply. In summary, a single model parameter can only reflect changes in growth stages. Integrating the variation pattern of all model parameters suggests that appropriate amounts of irrigation and nitrogen application can have a greater effect on promoting the entire growth and development process of plant height, whereas excessive or insufficient irrigation and nitrogen application can delay the progress of plant height growth and development.

3.3. Dynamics of the LAI in Spring Maize and Its Effective Accumulated Temperature Model

3.3.1. Dynamics of the LAI in Spring Maize as Influenced by Effective Accumulated Temperature under Different Water and Nitrogen Treatments

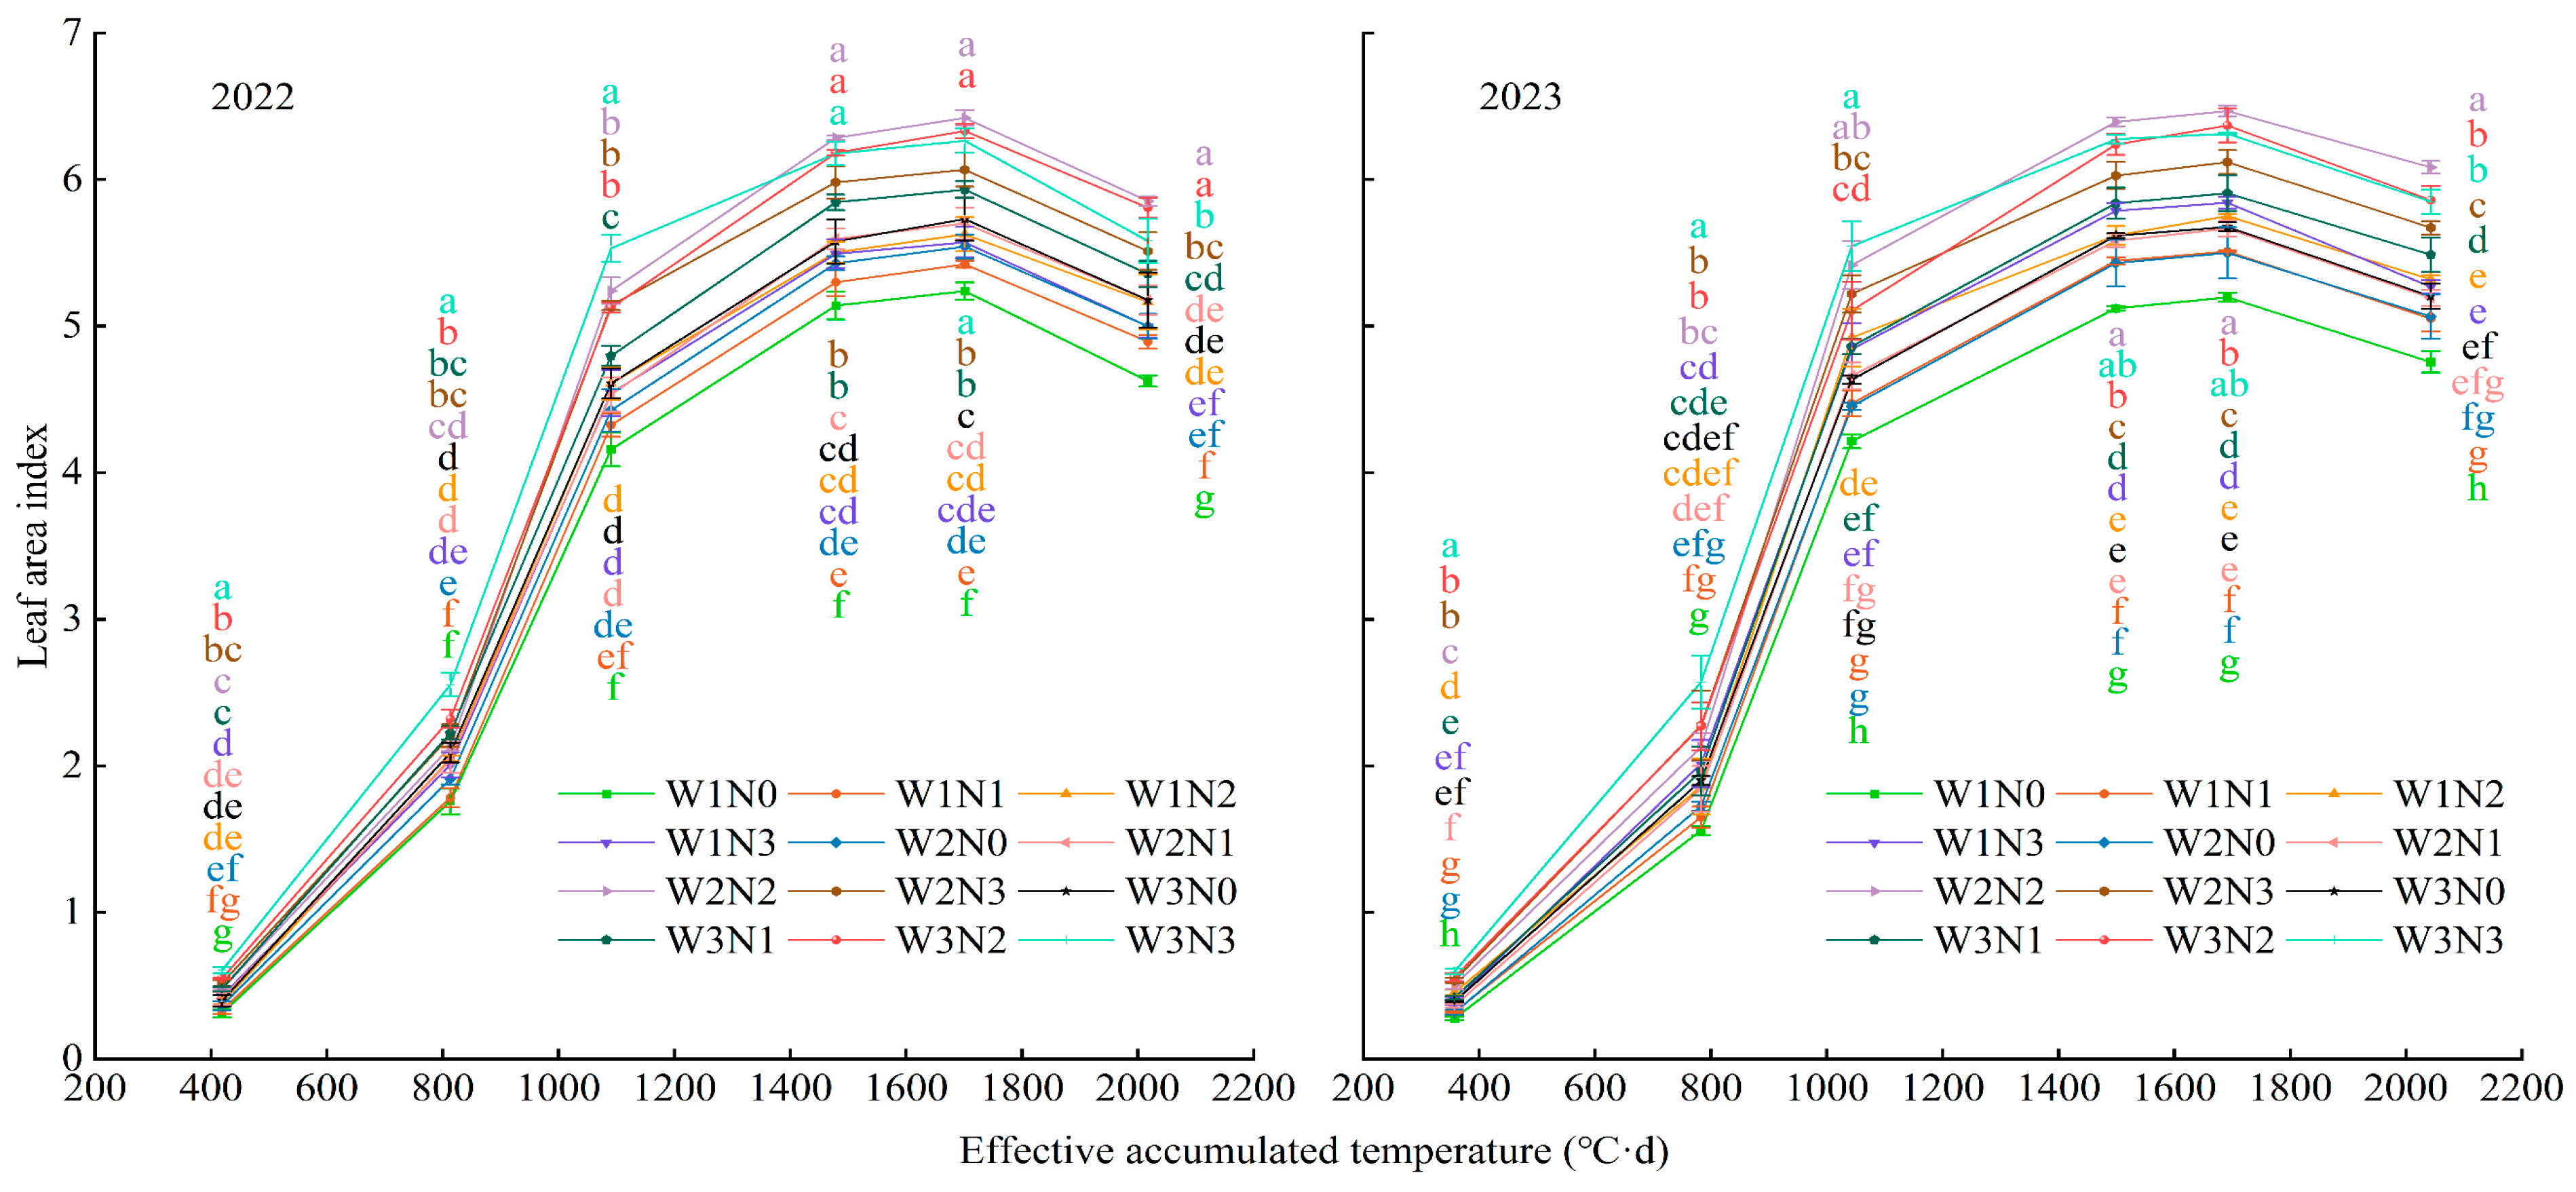
Under different water and nitrogen treatments, the LAI dynamics of spring maize consistently exhibited a slow–fast–slow S-shaped logistic model trend in relation to the accumulation of effective temperature, showing an initial increase followed by a decrease throughout the entire growth period (Figure 6). In the early growth stage, under the same irrigation level, the LAI demonstrated an initial increase followed by a decrease with the increase in nitrogen application; under the same nitrogen level, the LAI generally increased linearly with the increase in irrigation. The highest LAI over the two years was observed in the W2N2 treatment, with LAI values of 5.85 and 6.08 at maturity, respectively; the second highest was in the W2N3 treatment, while the lowest LAI values were consistently observed in the W1N0 treatment, with values of 4.62 and 4.75 at maturity, respectively. Significant differences in LAI under different water and nitrogen treatments indicate a substantial impact of water and nitrogen supply on the LAI of spring maize. The final LAI in W2N2 was significantly higher than that in the W2N3, W3N2, and W3N3 treatments, suggesting that excessive water and nitrogen application does not continuously promote leaf growth and may even inhibit it. This pattern was consistent across two years of experimentation. Based on the LAI change patterns across treatments, it is considered that the W2N2 treatment, with 100% ETc irrigation level and 186 kg N/ha nitrogen application, is the most beneficial for the leaf growth of spring maize.

3.3.2. Establishment and Validation of a Growth Model for Spring Maize LAI

The Curve Expert 1.4 software was utilized to perform a nonlinear fit of the logistic model for effective accumulated temperature and LAI under various treatments during 2022–2023, acquiring equation parameters and obtaining the logistic dynamic fitting equations for LAI across treatments (Table 5).
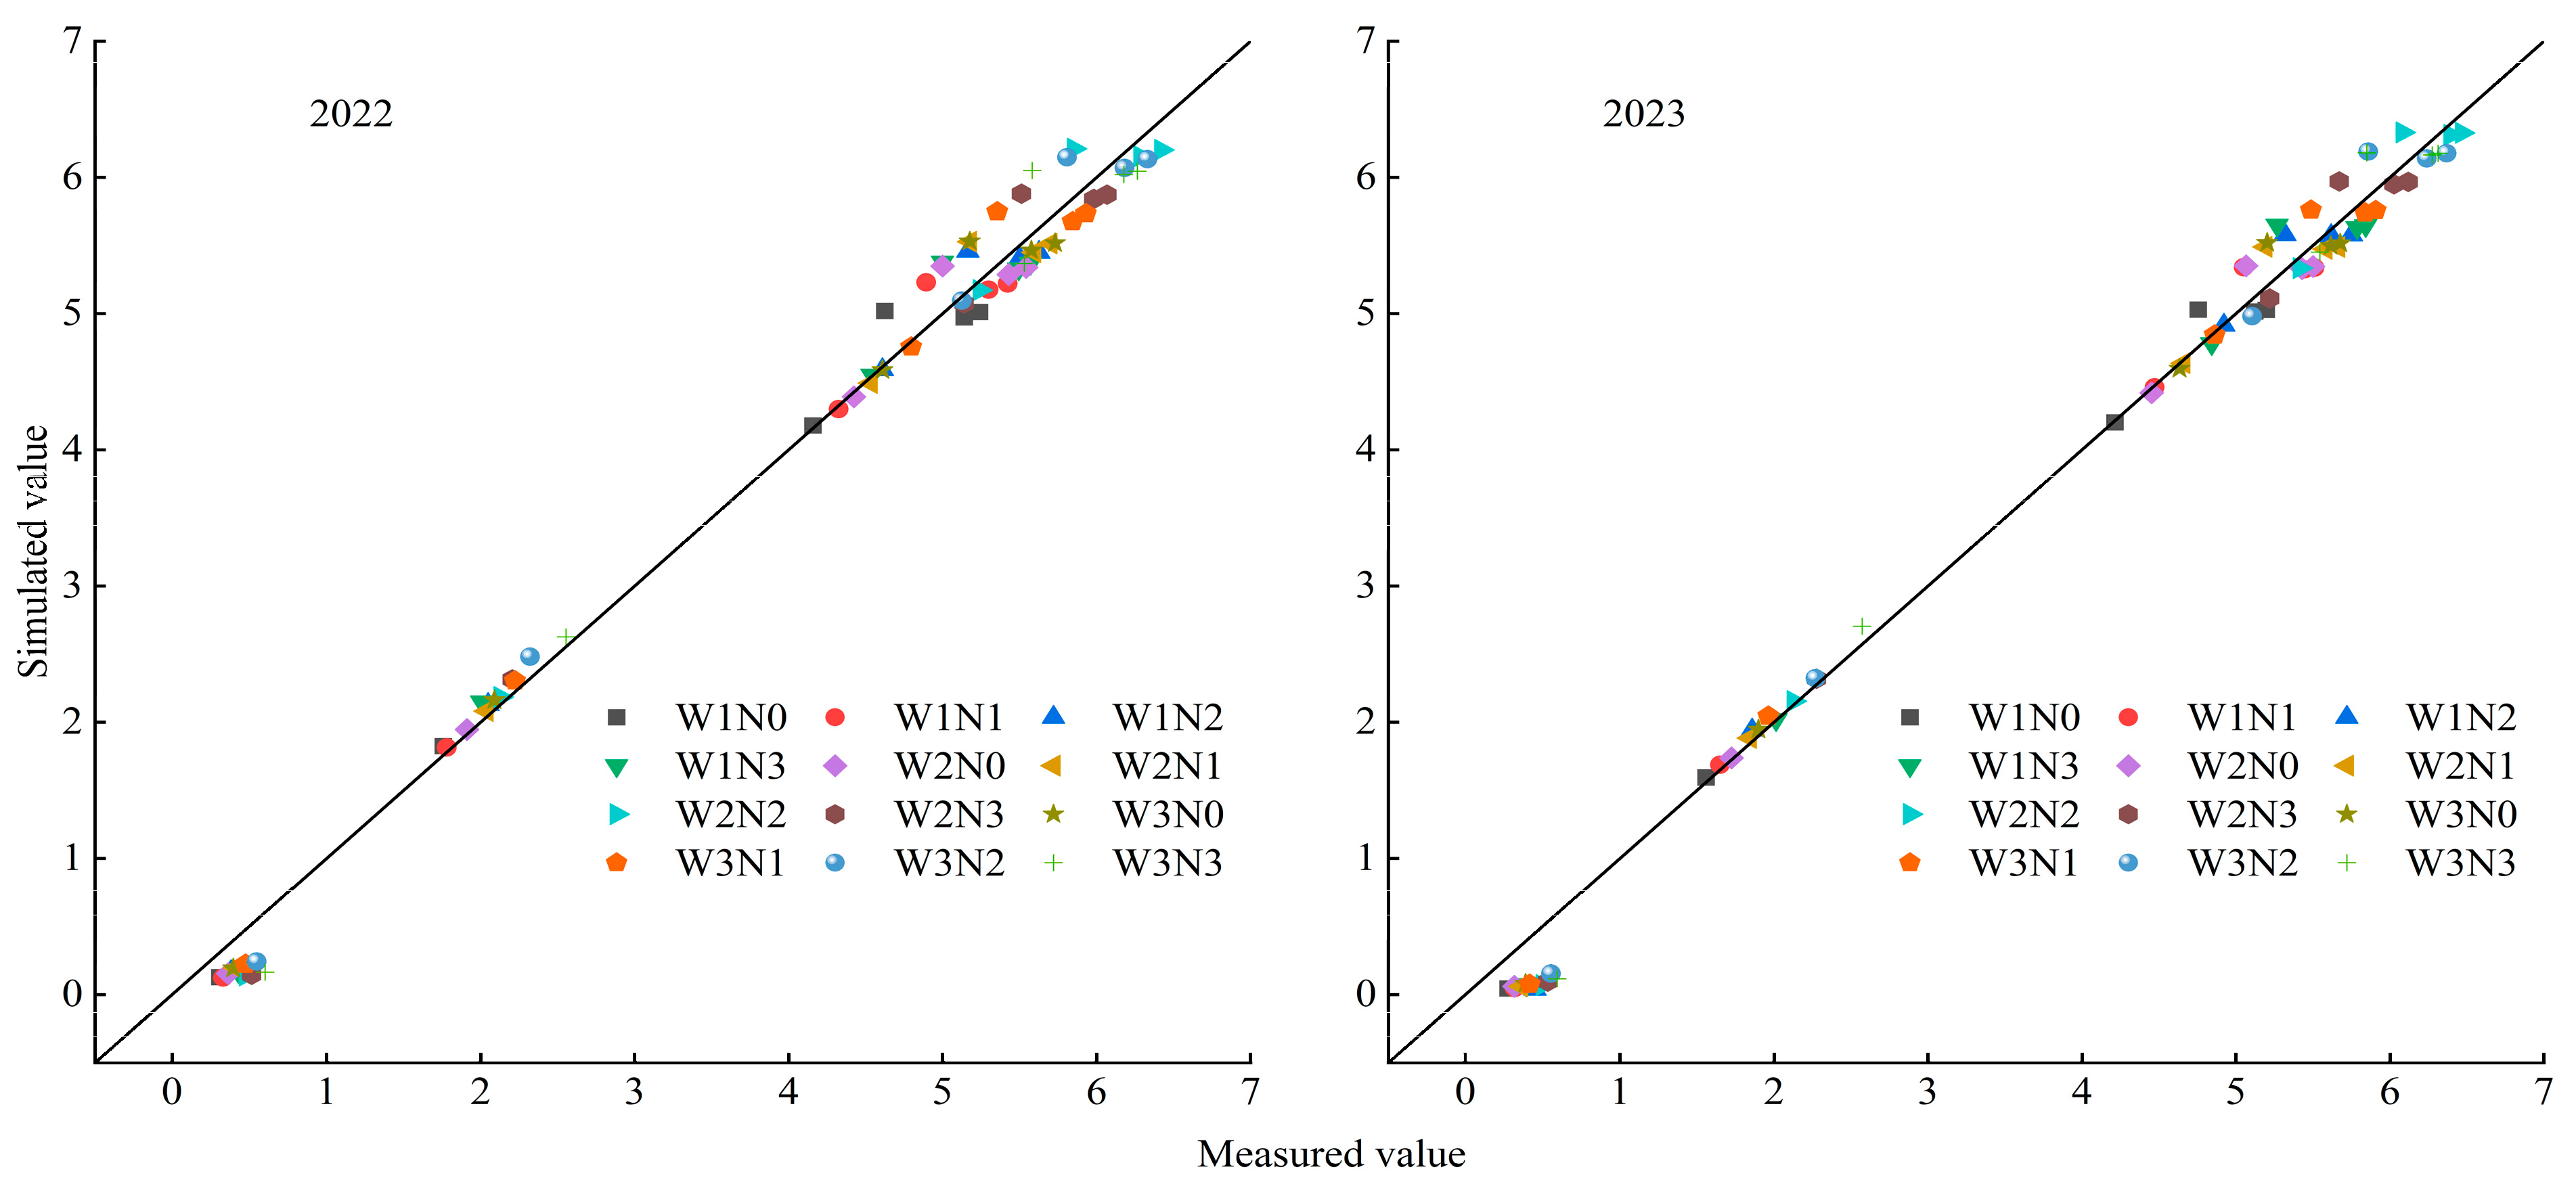
We evaluated the model’s performance in terms of accuracy and precision as presented in Table 6. For the years 2022–2023, the NRMSE of the logistic growth model, based on relative effective accumulated temperature and spring maize LAI, was less than 10%, and the R2 was above 0.99, indicating excellent model performance. The 1:1 plot of observed-versus-simulated values (Figure 7) shows that LAI values are uniformly distributed near the 1:1 line, demonstrating that under the conditions of this experiment, the logistic model simulation of leaf area growth has practical biological significance. This allows for the analysis of the dynamic changes in the LAI of spring maize under different water and nitrogen treatments with effective accumulated temperature.

3.3.3. Analysis of Characteristic Parameters in the Model Equation for LAI in Spring Maize

The logistic model simulation characteristics for the leaf area index (LAI) of spring maize under various water and nitrogen treatments for the years 2022–2023 are detailed in Table 7. The W3N3 treatment required a relatively low effective accumulated temperature for the highest LAI growth rate, with a significant average reduction of 47.48 °C·d, 45.57 °C·d, and 49.40 °C·d compared to the W1N0 treatment over the two years. The maximum growth rate of the LAI was highest in the W3N3 treatment, followed by the W2N2 and W2N3 treatments, although the latter required a higher effective accumulated temperature. This indicates that a higher supply of water and nitrogen can enhance the maximum growth rate of the LAI. The W3N3 treatment also required less effective accumulated temperature to enter both the rapid and slow growth phases, with significant differences from other treatments. For the W2N2 treatment, the effective accumulated temperature needed to initiate both the rapid and slow growth phases was moderate. However, the rapid growth phase has the shortest duration; this is closely associated with the average growth rate during the rapid growth phase, facilitating the leaves’ swift expansion and the attainment of a relatively stable level. Under the same irrigation level, the duration of the rapid LAI growth phase increases with higher nitrogen application rates. At the same nitrogen application level, increased irrigation volumes result in a greater maximum LAI growth rate, necessitating less effective accumulated temperature and extending the duration of the rapid growth phase. Based on an analysis of the effects of water and nitrogen supply on changes in LAI and integrating model parameters for quantitative analysis, it is suggested that irrigation enhances the maximum growth rate of the LAI and may shorten the duration of the rapid growth phase while extending it, whereas nitrogen application prolongs the duration of the rapid growth phase. The W2N2 treatment, representing an optimal level of water and nitrogen supply, required an effective accumulated temperature of 856.68–890.00 °C·days for the LAI to reach its maximum growth rate, which was the highest observed. In summary, the dynamics of the LAI are significantly influenced by water and nitrogen availability. Excessive or insufficient water and nitrogen supply, compared to an adequate supply, reduces the growth rate of summer maize LAI, increases the effective accumulated temperature required for LAI growth, and does not maximize the synergistic effects of water and nitrogen supply on the dynamic changes of LAI at various stages.

4. Discussion

Water and nitrogen are indispensable factors in the growth and development of maize, jointly influencing its growth dynamics. In this study, it was found that the height and LAI of maize exhibit a “slow–fast–slow” S-shaped logistic curve in response to water and nitrogen supply, significantly affecting these growth parameters. Plant height increases with both irrigation and nitrogen application; LAI increases with irrigation alone and initially rises then falls with increased nitrogen application. Under the W2N2 treatment (irrigation: 100% ETc, nitrogen: 186 kg N/ha), mature-stage maize height and LAI were noticeably higher than those in treatments with less water and nitrogen supply, and slightly higher than those in treatments with more. The W2N2 treatment represents an appropriate level of water and nitrogen supply. As indispensable factors for maize growth, the synergistic interaction between water and nitrogen cannot be overlooked. Appropriate water and nitrogen supply can effectively enhance plant height and LAI, benefiting the overall growth of maize. However, excessive nitrogen fertilizer usage can lead to nutrient imbalance, which may inhibit growth. This aligns with findings from Wang et al. [22]. Moderate irrigation and nitrogen management not only promote maize plant growth and increase leaf area, improving the LAI, but also influence photosynthetic capability and nutrient transport [23,24]. An optimal water–nitrogen ratio can optimize the growth environment for maize, promoting healthy plant growth, and improving yield and quality [25]. In summary, achieving an efficient and stable growth of maize is crucially dependent on precise irrigation and fertilization strategies to control plant height and LAI, optimizing growth conditions, and thus enhancing later growth stages and resource use efficiency.
Establishing dynamic growth models for crops provides a reliable basis for the quantitative analysis of growth dynamics and the regulation of population growth. This study developed a logistic model for the height and LAI of spring maize under various water and nitrogen gradients based on effective accumulated temperature, showing good model fitting. However, the relationship between effective accumulated temperature and the maximum LAI was slightly delayed compared to the results obtained by Kong et al. [26], mainly due to differences in geographic location, climatic conditions, crop varieties, and irrigation management. Quantitative analysis based on characteristic parameters suggests that irrigation extends the rapid growth phase of spring maize height, while nitrogen application shortens the time to enter this phase and prolongs its duration. Irrigation increases the maximum growth rate of the LAI and shortens the duration of the rapid growth phase, while nitrogen extends it. According to Li et al. [27], irrigation extends the growth duration in wheat to increase plant height, whereas nitrogen application shortens the time to enter the rapid growth phase and prolongs the growth duration, thus enhancing height. Irrigation significantly boosts the maximum growth rate of the LAI, whereas nitrogen reduces the accumulated temperature required to reach both the maximum rate and maximum LAI. Although spring maize and wheat are different crops, water and nitrogen show consistent effects on their height and LAI. This study suggests that under appropriate water and nitrogen gradients, the requirement for effective accumulated temperature for maize height and LAI, compared to conditions of scarcity or excess, is in the moderate range, also facilitating a quicker transition into and prolongation of the rapid and slow growth phases. The maximum growth rates and the rates during the rapid growth phase are relatively higher, leading to overall better development of spring maize height and LAI. This is similar to the findings of Chen et al. [28], with slight differences due to crop variety, experimental factors, geographic location, and climatic conditions. Crop variety and external environmental factors affect the growth and development of maize, but the overall impact patterns are broadly similar.
Plant height and LAI are critical metrics for describing crop growth, representing the crop’s ability to extend vertically and expand horizontally, respectively. Various factors such as geographic conditions, climatic environments, and irrigation management can significantly affect crop development and yield outcomes [29,30]. Analyzing the dynamic changes in plant height and LAI under different water and nitrogen treatments is crucial for understanding the regulatory mechanisms of water and nitrogen management on maize growth dynamics, aiming to achieve efficient growth control of maize. The ultimate goal of crop cultivation is to achieve high yields, and the accumulation of dry matter and nutrients forms the basis for yield formation. Therefore, the analysis of dry matter and nutrient accumulation is a focal point in crop growth modeling research [31]. This paper has solely simulated the impact of water and nitrogen supply on the growth of spring maize’s plant height and LAI. The next phase will involve simulating the accumulation of dry matter and nitrogen, as well as yield, to develop a comprehensive model of spring maize’s growth, development, and nutrient accumulation. This will provide a theoretical basis for the precise management of water and nitrogen in spring maize, forecasting growth, development, and yield formation. Optimizing the water and nitrogen management strategies for spring maize aims to enhance quality and efficiency.

5. Conclusions

Under varying water and nitrogen conditions, the growth dynamics of spring maize’s plant height and LAI follow a “slow–fast–slow” S-shaped logistic curve in relation to the accumulation of effective accumulated temperature. Irrigation extends the duration of the rapid growth phase for plant height, whereas nitrogen application reduces the time it takes for plant height to enter the rapid growth phase and prolongs its duration. Similarly, irrigation enhances the maximum LAI growth rate and shortens the time it takes for the plant to enter and extend the rapid growth phase, while nitrogen prolongs the duration of the LAI’s rapid growth phase. The W2N2 treatment exhibits the highest growth rate for plant height and optimal late-stage development, requiring an effective accumulated temperature of 825.16–845.74 °C·d to achieve the maximum growth rate. As for the LAI, the W2N2 treatment requires an effective accumulated temperature of 856.68–890.00 °C·d for the maximum growth rate, indicating the highest LAI growth rate. For spring maize, the accumulated temperature required to enter both the rapid and slow growth phases, and the temperature needed for the maximum growth rate, are at moderate levels. The maximum growth rate and the average growth rate during the rapid growth phase are both substantial. The W2N2 treatment (irrigation: 100% ETc, nitrogen application: 186 kg N/ha) represents an appropriate combination of water and nitrogen supply. In conclusion, moderate irrigation and nitrogen application have a more pronounced effect on promoting the growth and development of plant height and LAI throughout their growth cycles. An excessive or insufficient water and nitrogen supply delays the growth and development process of plant height and LAI. Compared to a moderate supply, an excessive or insufficient water and nitrogen supply does not fully exploit the synergistic effects on the dynamic changes in plant height and LAI at different stages. Utilizing effective accumulated temperature to establish a logistic model allows for a quantitative description of the dynamic changes in plant height and LAI under different water and nitrogen conditions, providing a theoretical basis for the dynamic simulation and growth prediction of crops.

Author Contributions

Conceptualization, T.Y., J.Z. and Q.F.; methodology, T.Y.; software, T.Y.; validation, J.Z. and Q.F.; formal analysis, T.Y. and J.Z.; investigation, T.Y.; writing—original draft preparation, T.Y. and J.Z.; writing—review and editing, T.Y. and J.Z.; visualization, T.Y. and Q.F.; supervision, J.Z. and Q.F. All authors have read and agreed to the published version of the manuscript.

Funding

This study was supported by the National Natural Science Foundation of China: 52169013.

Data Availability Statement

Data are contained within the article. The data that support the findings of this study is available from the corresponding author.

Conflicts of Interest

The authors declare no conflicts of interest.

References

  1. Hammad, H.M.; Abbas, F.; Ahmad, A.; Farhad, W.; Wilkerson, C.J.; Hoogenboom, G. Evaluation of Timing and Rates for Nitrogen Application for Optimizing Maize Growth and Development and Maximizing Yield. Agron. J. 2018, 110, 565–571. [Google Scholar] [CrossRef]
  2. Zhan, X.X.; Kong, F.L.; Liu, Q.L.; Lan, T.Q.; Liu, Y.Q.; Xu, J.Z.; Ou, Q.; Chen, L.; Kessel, G.; Kempenaar, C.; et al. Maize basal internode development significantly affects stalk lodging resistance. Field Crops Res. 2022, 286, 108611. [Google Scholar] [CrossRef]
  3. Gu, L.M.; Liu, T.N.; Zhao, J.; Dong, S.T.; Liu, P.; Zhang, J.W.; Zhao, B. Nitrate leaching of winter wheat grown in lysimeters as affected by fertilizers and irrigation on the North China Plain. J. Integr. Agric. 2015, 14, 374–388. [Google Scholar] [CrossRef]
  4. Hocaoğlu, O.; Gönülal, E.; Akçura, M. Modelling the Effect of Irrigation Deficit on Maize Growth with Logistic Regression. Commun. Soil Sci. Plant Anal. 2023, 54, 1293–1305. [Google Scholar] [CrossRef]
  5. Li, C.; Luo, X.Q.; Li, Y.; Wang, N.J.; Zhang, T.B.; Dong, Q.G.; Feng, H.; Zhang, W.X.; Siddique, K.H.M. Ridge planting with transparent plastic mulching improves maize productivity by regulating the distribution and utilization of soil water, heat, and canopy radiation in arid irrigation area. Agric. Water Manag. 2023, 280, 108230. [Google Scholar] [CrossRef]
  6. Ran, J.J.; Ran, H.; Ma, L.F.; Jennings, S.A.; Yu, T.G.; Deng, X.; Yao, N.; Hu, X.T. Quantifying water productivity and nitrogen uptake of maize under water and nitrogen stress in arid Northwest China. Agric. Water Manag. 2023, 285, 108370. [Google Scholar] [CrossRef]
  7. Ding, D.Y.; Feng, H.; Zhao, Y.; Hill, R.L.; Yan, H.M.; Chen, H.X.; Hou, H.J.; Chu, X.S.; Liu, J.C.; Wang, N.J.; et al. Effects of continuous plastic mulching on crop growth in a winter wheat-summer maize rotation system on the Loess Plateau of China. Agric. For. Meteorol. 2019, 271, 385–397. [Google Scholar] [CrossRef]
  8. Sepaskhah, A.R.; Fahandezh-saadi, S.; Zand-parsa, S. Logistic model application for prediction of maize yield under water and nitrogen management. Agric. Water Manag. 2011, 99, 51–57. [Google Scholar] [CrossRef]
  9. Cai, J.B.; Chang, H.F.; Chen, H.; Zhang, B.Z.; Wei, Z.; Peng, Z.G. Simulation of maize dry matter accumulation in normalized logistic model with different effective accumulated temperatures in field. Trans. Chin. Soc. Agric. Mach. 2020, 51, 263–271, (In Chinese with English Abstract). [Google Scholar] [CrossRef]
  10. Gong, X.J.; Qian, C.R.; Yu, Y.; Jiang, Y.B.; Hao, Y.B.; Li, L.; Ge, X.L. Effects of different sowing date on grain yield and yield components of spring maize. J. Maize Sci. 2019, 27, 108–113, (In Chinese with English Abstract). [Google Scholar] [CrossRef]
  11. Luan, Q.; Guo, J.P.; Ma, Y.L.; Zhang, L.M.; Wang, J.X. A general model for estimating leaf area index of maize. Chin. J. Agrometeorol. 2020, 41, 506–519, (In Chinese with English Abstract). [Google Scholar] [CrossRef]
  12. Wang, Y.J.; Zhang, J.H.; Wang, Q.J.; Su, L.J.; Feng, J. Comparative analysis of growth models of aboveground dry biomass of grape. Agric. Res. Arid. Areas 2013, 31, 257–263, (In Chinese with English Abstract). [Google Scholar]
  13. Chen, D.L.; Chen, H.W.T. Using the Köppen classification to quantify climate variation and change: An example for 1901–2010. Environ. Dev. 2013, 6, 69–79. [Google Scholar] [CrossRef]
  14. Peel, M.C.; Finlayson, B.L.; McMahon, T.A. Updated world map of the Köppen-Geiger climate classification. Hydrol. Earth Syst. Sci. 2007, 11, 1633–1644. [Google Scholar] [CrossRef]
  15. USDA. Soil Taxonomy-A Basic System of Soil Classification for Making and Interpreting Soil Surveys, 2nd ed.; USDA: Washington, DC, USA, 1999. Available online: https://www.nrcs.usda.gov/ (accessed on 10 October 2023).
  16. Allen, R.G.; Pereira, L.S.; Raes, D.; Smith, M. Crop Evapotranspiration Guidelines for Computing Crop Water Requirements, Fao Irrigation and Drainage Paper 56; FAO: Rome, Italy, 1998; Available online: https://www.fao.org/home/en (accessed on 23 January 2022).
  17. Liang, W.Q. Research on Evapotranspiration and Crop Coefficients of Winter Wheat and Summer Maize. Master’s Thesis, Northwest Sci-Tech University of Agriculture and Forestry, Xianyang, China, 2012. (In Chinese with English Abstract). [Google Scholar]
  18. Miedema, P. The effects of low temperature on Zea mays. Adv. Agron. 1982, 35, 93–128. [Google Scholar] [CrossRef]
  19. Yu, Q.; Liu, J.D.; Zhang, Y.Q.; Li, J. Simulation of rice biomass accumulation by an extended logistic model including influence of meteorological factors. Int. J. Biometeorol. 2002, 46, 185–191. [Google Scholar] [CrossRef] [PubMed]
  20. Xiao, Z.; Lei, H.; Jin, C.; Pan, H.; Lian, Y. Relationship between the dynamic characteristics of tomato plant height and leaf area index with yield, under aerated drip irrigation and nitrogen application in greenhouses. Agronomy 2023, 13, 116. [Google Scholar] [CrossRef]
  21. Chen, P.P.; Gu, X.B.; Li, Y.N.; Qiao, L.R.; Li, Y.P.; Fang, H.; Yin, M.H.; Zhou, C.M. Effects of residual film on maize root distribution, yield and water use efficiency in Northwest China. Agric. Water Manag. 2022, 260, 107289. [Google Scholar] [CrossRef]
  22. Wang, K.J.; Yang, Q.Q.; Wang, J.; Lu, Y.M.; Wang, X.P.; Kang, J.H. Synergistic effects of water and nitrogen on photosynthetic characteristics and yield of maize. Soil. Fertil. Sci. China 2023, 7, 48–55, (In Chinese with English Abstract). [Google Scholar] [CrossRef]
  23. Kresović, B.; Tapanarova, A.; Tomić, Z.; Životić, L.; Vujović, D.; Sredojević, Z.; Gajić, B. Grain yield and water use efficiency of maize as influenced by different irrigation regimes through sprinkler irrigation under temperate climate. Agric. Water Manag. 2016, 169, 34–43. [Google Scholar] [CrossRef]
  24. Amin, M.T.; Anjum, L.; Alazba, A.A.; Rizwan, M. Effect of the irrigation frequency and quality on yield, growth and water productivity of maize crops. Qual. Assur. Saf. Crops Foods 2015, 7, 721–730. [Google Scholar] [CrossRef]
  25. Cui, J.J.; Mak-Mensah, E.; Wang, J.W.; Li, Q.; Huang, L.; Song, S.; Zhi, K.K.; Zhang, J. Interactive effects of drip irrigation and nitrogen fertilization on wheat and maize yield: A meta-analysis. J. Soil. Sci. Plant Nutr. 2024. [Google Scholar] [CrossRef]
  26. Kong, D.Y.; Yang, S.; Hang, S.Q.; Li, X.B.; Yang, Q.Y. Dynamic simulation of maize leaf area index in Hetao region. Chin. J. Agrometeorol. 2014, 35, 281–286, (In Chinese with English Abstract). [Google Scholar] [CrossRef]
  27. Li, Z.P.; Song, M.D.; Feng, H. Dynamic characteristics of leaf area index and plant height of winter wheat influenced by irrigation and nitrogen coupling and their relationships with yield. Trans. CSAE 2017, 33, 195–202, (In Chinese with English Abstract). [Google Scholar] [CrossRef]
  28. Chen, Y.; Xu, M.Z.; Wang, Y.H.; Bai, Y.L.; Lu, Y.L.; Wang, L. Quantitative study on effective accumulated temperature and dry matter and nitrogen accumulation of summer maize under different nitrogen supply levels. Sci. Agric. Sin. 2022, 55, 2973–2987, (In Chinese with English Abstract). [Google Scholar] [CrossRef]
  29. Karyoti, A.; Bartzialis, D.; Sakellariou-makrantonaki, M.; Danalatos, N. Effects of irrigation and green manure on corn (Zea mays L.) biomass and grain yield. J. Soil Sci. Plant Nutr. 2018, 18, 820–832. [Google Scholar] [CrossRef]
  30. Xu, C.; Zhao, H.X.; Li, Q.; Liu, X.L.; Zhang, Z.A.; Bian, S.F. Study on dry matter accumulation and leaf response to light and CO2 of maize under irrigation quota. Cereal Res. Commun. 2020, 48, 173–178. [Google Scholar] [CrossRef]
  31. Zhang, Z.Z.; Zhou, N.B.; Xing, Z.P.; Liu, B.L.; Tian, J.Y.; Wei, H.Y.; Gao, H.; Zhang, H.C. Effects of temperature and radiation on yield of spring wheat at different latitudes. Agriculture 2022, 12, 627. [Google Scholar] [CrossRef]
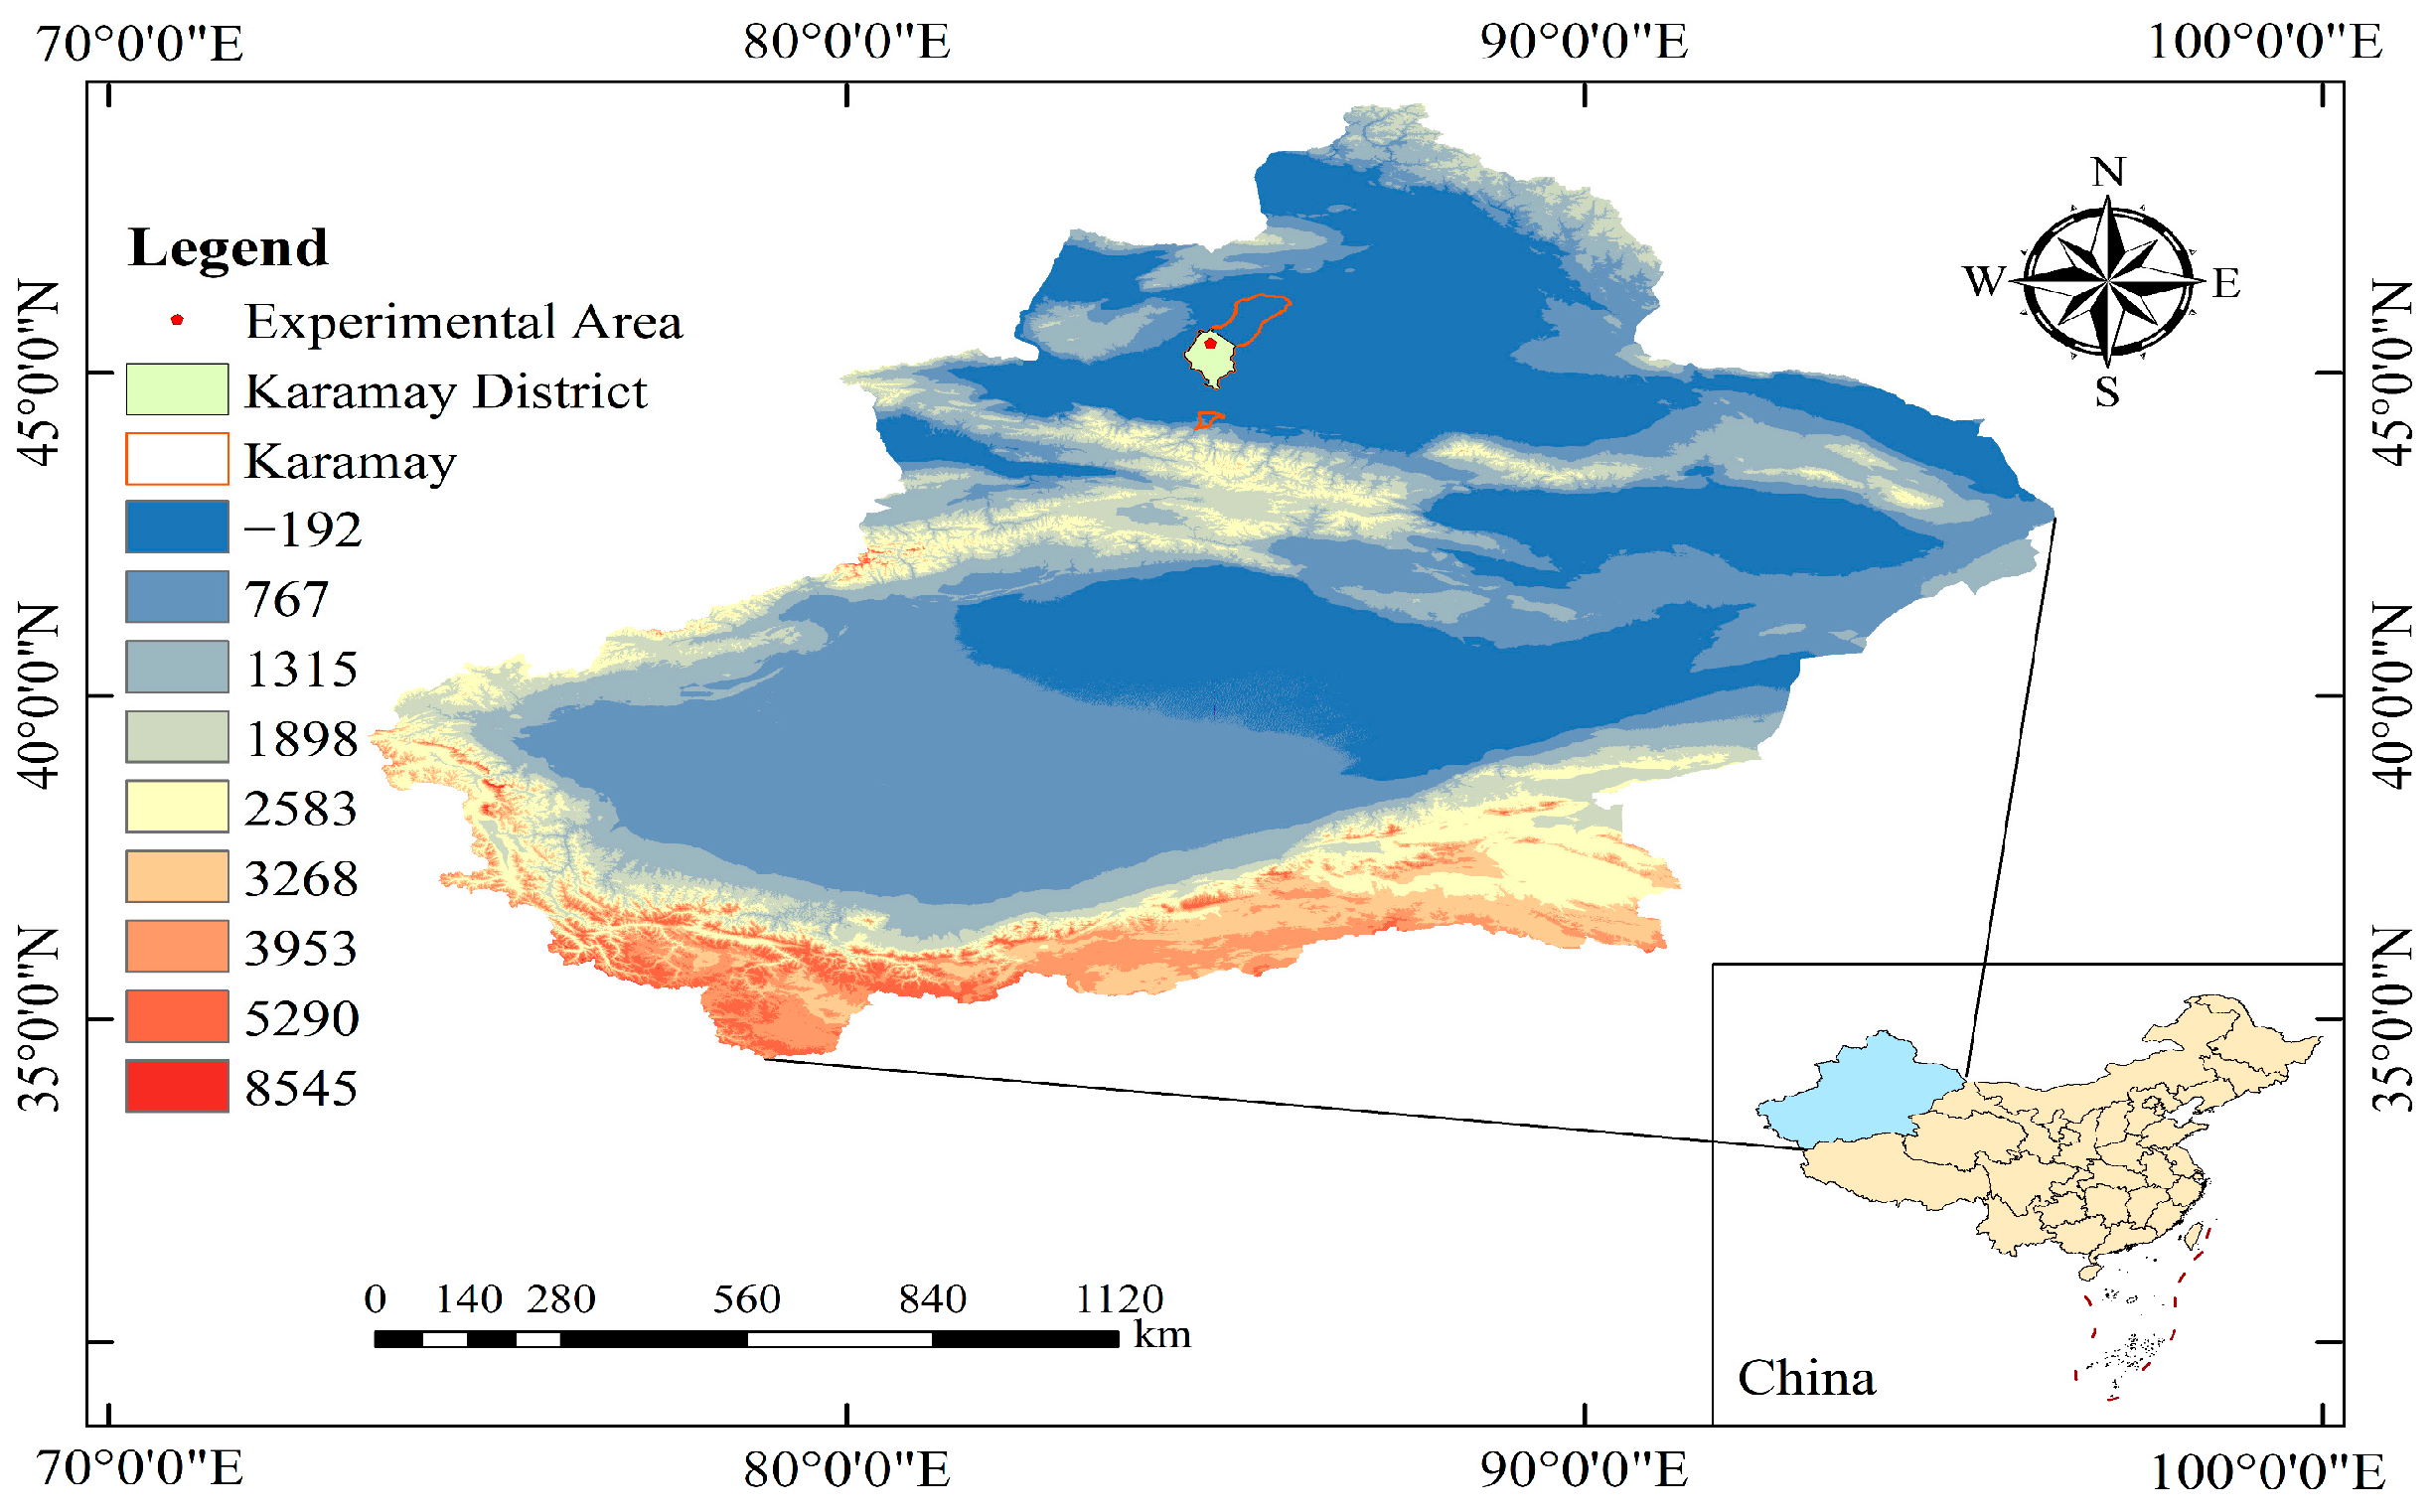
Figure 1. Location of the experimental area.
Agronomy 14 01018 g001
Figure 2. Air temperature and rainfall during the growth period of spring maize in 2022 and 2023.
Agronomy 14 01018 g002
Figure 3. Maize planting pattern.
Agronomy 14 01018 g003
Figure 4. Dynamics of plant height in spring maize under different water and nitrogen treatments as influenced by effective accumulated temperature, 2022–2023. Note: different letters within the same column indicate significant differences at the 0.05 level (LSD), with different colored letters representing different treatments.
Agronomy 14 01018 g004
Figure 5. Measured versus simulated values of plant height in spring maize.
Agronomy 14 01018 g005
Figure 6. Dynamics of LAI in spring maize under different water and nitrogen treatments as influenced by effective accumulated temperature, 2022–2023. Note: different letters within the same column indicate significant differences at the 0.05 level (LSD), with different-colored letters representing different treatments.
Agronomy 14 01018 g006
Figure 7. Measured versus simulated values of LAI in spring maize.
Agronomy 14 01018 g007
Table 1. Correlation analysis of plant height and LAI in spring maize under different water and nitrogen treatments.
YearW1N0W1N1W1N2W1N3W2N0W2N1W2N2W2N3W3N0W3N1W3N2W3N3
20220.994 **0.996 **0.997 **0.995 **0.996 **0.996 **0.995 **0.995 **0.996 **0.995 **0.996 **0.989 **
20230.994 **0.993 **0.995 **0.993 **0.995 **0.995 **0.996 **0.991 **0.995 **0.997 **0.992 **0.981 **
Note: ** indicates that plant height and LAI are significantly correlated at the 0.01 level. This significant result is derived from Pearson correlation coefficient analysis.
Table 2. Growth dynamic model equations of plant height in spring maize under different water and nitrogen treatments.
Treatment20222023
Model EquationModel Equation
W1N0y = 306.88/(1 + 418.16 × exp(−0.0069x))y = 309.97/(1 + 1414.70 × exp(−0.0078x))
W1N1y = 316.05/(1 + 325.05 × exp(−0.0067x))y = 325.77/(1 + 892.90 × exp(−0.0075x))
W1N2y = 321.10/(1 + 342.88 × exp(−0.0068x))y = 328.46/(1 + 575.73 × exp(−0.0075x))
W1N3y = 325.35/(1 + 370.76 × exp(−0.0069x))y = 333.42/(1 + 892.44 × exp(−0.0082x))
W2N0y = 316.21/(1 + 248.64 × exp(−0.0064x))y = 317.72/(1 + 700.10 × exp(−0.0073x))
W2N1y = 323.98/(1 + 329.45 × exp(−0.0068x))y = 344.08/(1 + 1041.23 × exp(−0.0078x))
W2N2y = 341.95/(1 + 289.00 × exp(−0.0067x))y = 354.46/(1 + 799.38 × exp(−0.0081x))
W2N3y = 331.82/(1 + 225.40 × exp(−0.0065x))y = 346.76/(1 + 117.79 × exp(−0.0057x))
W3N0y = 323.46/(1 + 175.99 × exp(−0.0061x))y = 327.49/(1 + 621.65 × exp(−0.0073x))
W3N1y = 329.37/(1 + 169.25 × exp(−0.0061x))y = 343.72/(1 + 1479.20 × exp(−0.0086x))
W3N2y = 337.38/(1 + 166.02 × exp(−0.0061x))y = 348.89/(1 + 292.21 × exp(−0.0069x))
W3N3y = 334.40/(1 + 156.33 × exp(−0.0061x))y = 348.79/(1 + 377.82 × exp(−0.0073x))
Table 3. Accuracy and precision evaluation of measured versus simulated plant heights in spring maize.
YearTest ParameterW1N0W1N1W1N2W1N3W2N0W2N1W2N2W2N3W3N0W3N1W3N2W3N3
2022R20.99700.99670.99730.99730.99660.99570.99710.99690.99820.99820.99740.9973
NRMSE (%)3.293.193.073.253.223.633.033.032.482.362.622.73
2023R20.99890.99860.99890.99620.99930.99870.99780.99970.99930.99780.99890.9985
NRMSE (%)4.112.732.293.612.253.163.030.981.973.202.332.61
Table 4. Characteristic parameters of the logistic model for dynamic changes in plant height of spring maize.
Treatment20222023
V1T1T2T3V2V1T1T2T3V2
W1N00.5294 ab874.76 a683.90 a1065.63 a0.4641 ab0.6044 b910.55 a741.70 a1079.39 a0.5300 b
W1N10.5294 ab863.28 ab666.72 ab1059.84 ab0.4642 ab0.6108 b905.93 a730.34 ab1081.52 a0.5356 b
W1N20.5459 ab858.44 bc664.77 abc1052.11 abc0.4786 ab0.6159 b847.42 cd671.82 d1023.01 bc0.5400 b
W1N30.5612 ab857.33 bc666.46 abc1048.19 bc0.4921 ab0.6835 ab828.53 de667.93 d989.14 c0.5993 ab
W2N00.5059 ab861.88 ab656.1 abcd1067.65 a0.4436 ab0.5798 bc897.43 ab717.02 bc1077.83 a0.5084 bc
W2N10.5508 ab852.56 bc658.89 abcd1046.23 abc0.4829 ab0.6710 ab890.79 b721.95 abc1059.63 ab0.5883 ab
W2N20.5728 a845.74 cd649.17 bcde1042.30 bc0.5022 a0.7178 a825.16 e662.58 d987.75 c0.6293 a
W2N30.5392 ab833.52 de630.91 cdef1036.13 c0.4728 ab0.4941 c836.65 cde605.60 f1067.69 a0.4333 c
W3N00.4933 b847.61 cd631.72 def1063.51 abc0.4325 b0.5977 b881.15 b700.74 c1061.55 a0.5240 b
W3N10.5023 b841.21 de625.31 ef1057.10 abc0.4404 b0.7390 a848.75 c695.62 c1001.89 c0.6479 a
W3N20.5145 ab838.05 cd622.16 ef1053.95 abc0.4511 ab0.6018 b822.82 ef631.96 e1013.69 c0.5277 b
W3N30.5100 ab828.19 e612.30 f1044.09 c0.4471 ab0.6365 ab812.93 f632.53 e993.34 c0.5581 ab
Note: V1 represents the maximum growth rate of plant height, T1 is the TGDD when plant height reaches its maximum growth rate, T2 is the TGDD required for plant height to enter the rapid growth phase, T3 is the TGDD required for plant height to enter the slow growth phase, and V2 is the average growth rate during the rapid growth phase of plant height. Different letters within the same column indicate significant differences at the 0.05 level (LSD).
Table 5. Growth dynamic model equations of LAI in spring maize under different water and nitrogen treatments.
Treatment20222023
Model EquationModel Equation
W1N0y = 5.02/(1 + 997.35 × exp(−0.0078x))y = 5.03/(1 + 2901.57 × exp(−0.0092x))
W1N1y = 5.23/(1 + 1073.33 × exp(−0.0078x))y = 5.34/(1 + 2914.38 × exp(−0.0092x))
W1N2y = 5.46/(1 + 756.57 × exp(−0.0076x))y = 5.58/(1 + 5098.09 × exp(−0.0101x))
W1N3y = 5.38/(1 + 728.17 × exp(−0.0076x))y = 5.65/(1 + 1768.09 × exp(−0.0088x))
W2N0y = 5.35/(1 + 780.72 × exp(−0.0075x))y = 5.35/(1 + 2043.46 × exp(−0.0088x))
W2N1y = 5.53/(1 + 534.18 × exp(−0.0071x))y = 5.49/(1 + 2203.48 × exp(−0.0090x))
W2N2y = 6.21/(1 + 1236.49 × exp(−0.0080x))y = 6.33/(1 + 2230.72 × exp(−0.0090x))
W2N3y = 5.88/(1 + 1215.18 × exp(−0.0082x))y = 5.97/(1 + 1323.12 × exp(−0.0086x))
W3N0y = 5.53/(1 + 591.49 × exp(−0.0073x))y = 5.52/(1 + 1427.75 × exp(−0.0085x))
W3N1y = 5.75/(1 + 482.23 × exp(−0.0071x))y = 5.76/(1 + 1652.25 × exp(−0.0087x))
W3N2y = 6.15/(1 + 476.88 × exp(−0.0071x))y = 6.19/(1 + 546.84 × exp(−0.0074x))
W3N3y = 6.05/(1 + 1210.14 × exp(−0.0084x))y = 6.18/(1 + 1168.35 × exp(−0.0087x))
Table 6. Accuracy and precision evaluation of measured versus simulated LAI in spring maize.
YearTest ParameterW1N0W1N1W1N2W1N3W2N0W2N1W2N2W2N3W3N0W3N1W3N2W3N3
2022R20.98740.99160.99320.98790.99110.99150.99210.98980.99120.98960.99120.9858
NRMSE (%)6.045.144.465.815.195.025.205.674.985.395.006.59
2023R20.99360.99340.99280.99070.99430.99310.99520.99300.99260.99370.99220.9908
NRMSE (%)4.784.925.405.704.654.994.825.415.144.805.375.69
Table 7. Characteristic parameters of the logistic model for dynamic changes in LAI of spring maize.
Treatment20222023
V1T1T2T3V2V1T1T2T3V2
W1N00.0098 b885.27 ab716.43 ab1054.11 ab0.0086 b0.0116 c866.63 a723.48 a1009.78 ab0.0101 c
W1N10.0102 b894.68 a725.84 a1063.52 ab0.0089 b0.0123 abc867.11 a723.96 a1010.26 ab0.0108 abc
W1N20.0104 b872.21 abc698.93 cd1045.49 ab0.0091 b0.0141 ab845.21 ab714.82 a975.60 bc0.0124 ab
W1N30.0101 b878.74 abc703.14 bcd1054.33 ab0.0088 b0.0124 abc849.73 ab700.08 abc999.39 abc0.0109 abc
W2N00.0100 b888.03 abc712.43 abc1063.62 ab0.0088 b0.0118 bc866.18 a716.53 a1015.84 ab0.0103 bc
W2N10.0098 b884.61 abc699.12 cd1070.10 a0.0086 b0.0124 abc855.31 a708.98 ab1001.64 ab0.0108 abc
W2N20.0124 a890.00 ab725.38 a1054.62 ab0.0109 a0.0142 a856.68 ab710.35 ab1003.00 abc0.0125 a
W2N30.0121 a866.18 c705.57 abc1026.78 b0.0106 a0.0128 abc835.78 bc682.65 bcd988.92 bc0.0113 abc
W3N00.0101 b874.33 abc693.93 cd1054.74 ab0.0088 b0.0117 c854.57 ab699.63 abc1009.51 ab0.0103 bc
W3N10.0102 b870.20 bc684.71 d1055.69 ab0.0089 b0.0125 abc851.71 ab700.34 abc1003.09 ab0.0110 abc
W3N20.0109 b868.63 abc683.14 d1054.12 ab0.0096 b0.0115 c851.91 ab673.95 cd1029.88 a0.0100 c
W3N30.0127 a845.06 d688.28 d1001.84 c0.0111 a0.0134 abc811.88 c660.50 d963.25 c0.0118 abc
Note: V1 represents the maximum growth rate of LAI, T1 is the TGDD when LAI reaches its maximum growth rate, T2 is the TGDD required for LAI to enter the rapid growth phase, T3 is the TGDD required for LAI to enter the slow growth phase, and V2 is the average growth rate during the rapid growth phase of LAI. Different letters within the same column indicate significant differences at the 0.05 level (LSD).
Disclaimer/Publisher’s Note: The statements, opinions and data contained in all publications are solely those of the individual author(s) and contributor(s) and not of MDPI and/or the editor(s). MDPI and/or the editor(s) disclaim responsibility for any injury to people or property resulting from any ideas, methods, instructions or products referred to in the content.