
Screening of Germplasm and Construction of Evaluation System for Autotoxicity Tolerance during Seed Germination in Cucumber


Abstract
1. Introduction
2. Materials and Methods
2.1. Materials
2.2. Treatment
2.3. Determination Method
2.3.1. Determination of Growth Index
2.3.2. Determination of Physiological Indicators
2.4. Statistical Analysis
3. Results
3.1. Correlation Analysis of Various Indicators of Different Cucumber Cultivars under CA Stress
3.2. Principal Component Analysis of Various Indices of Different Cucumber Cultivars under CA Stress
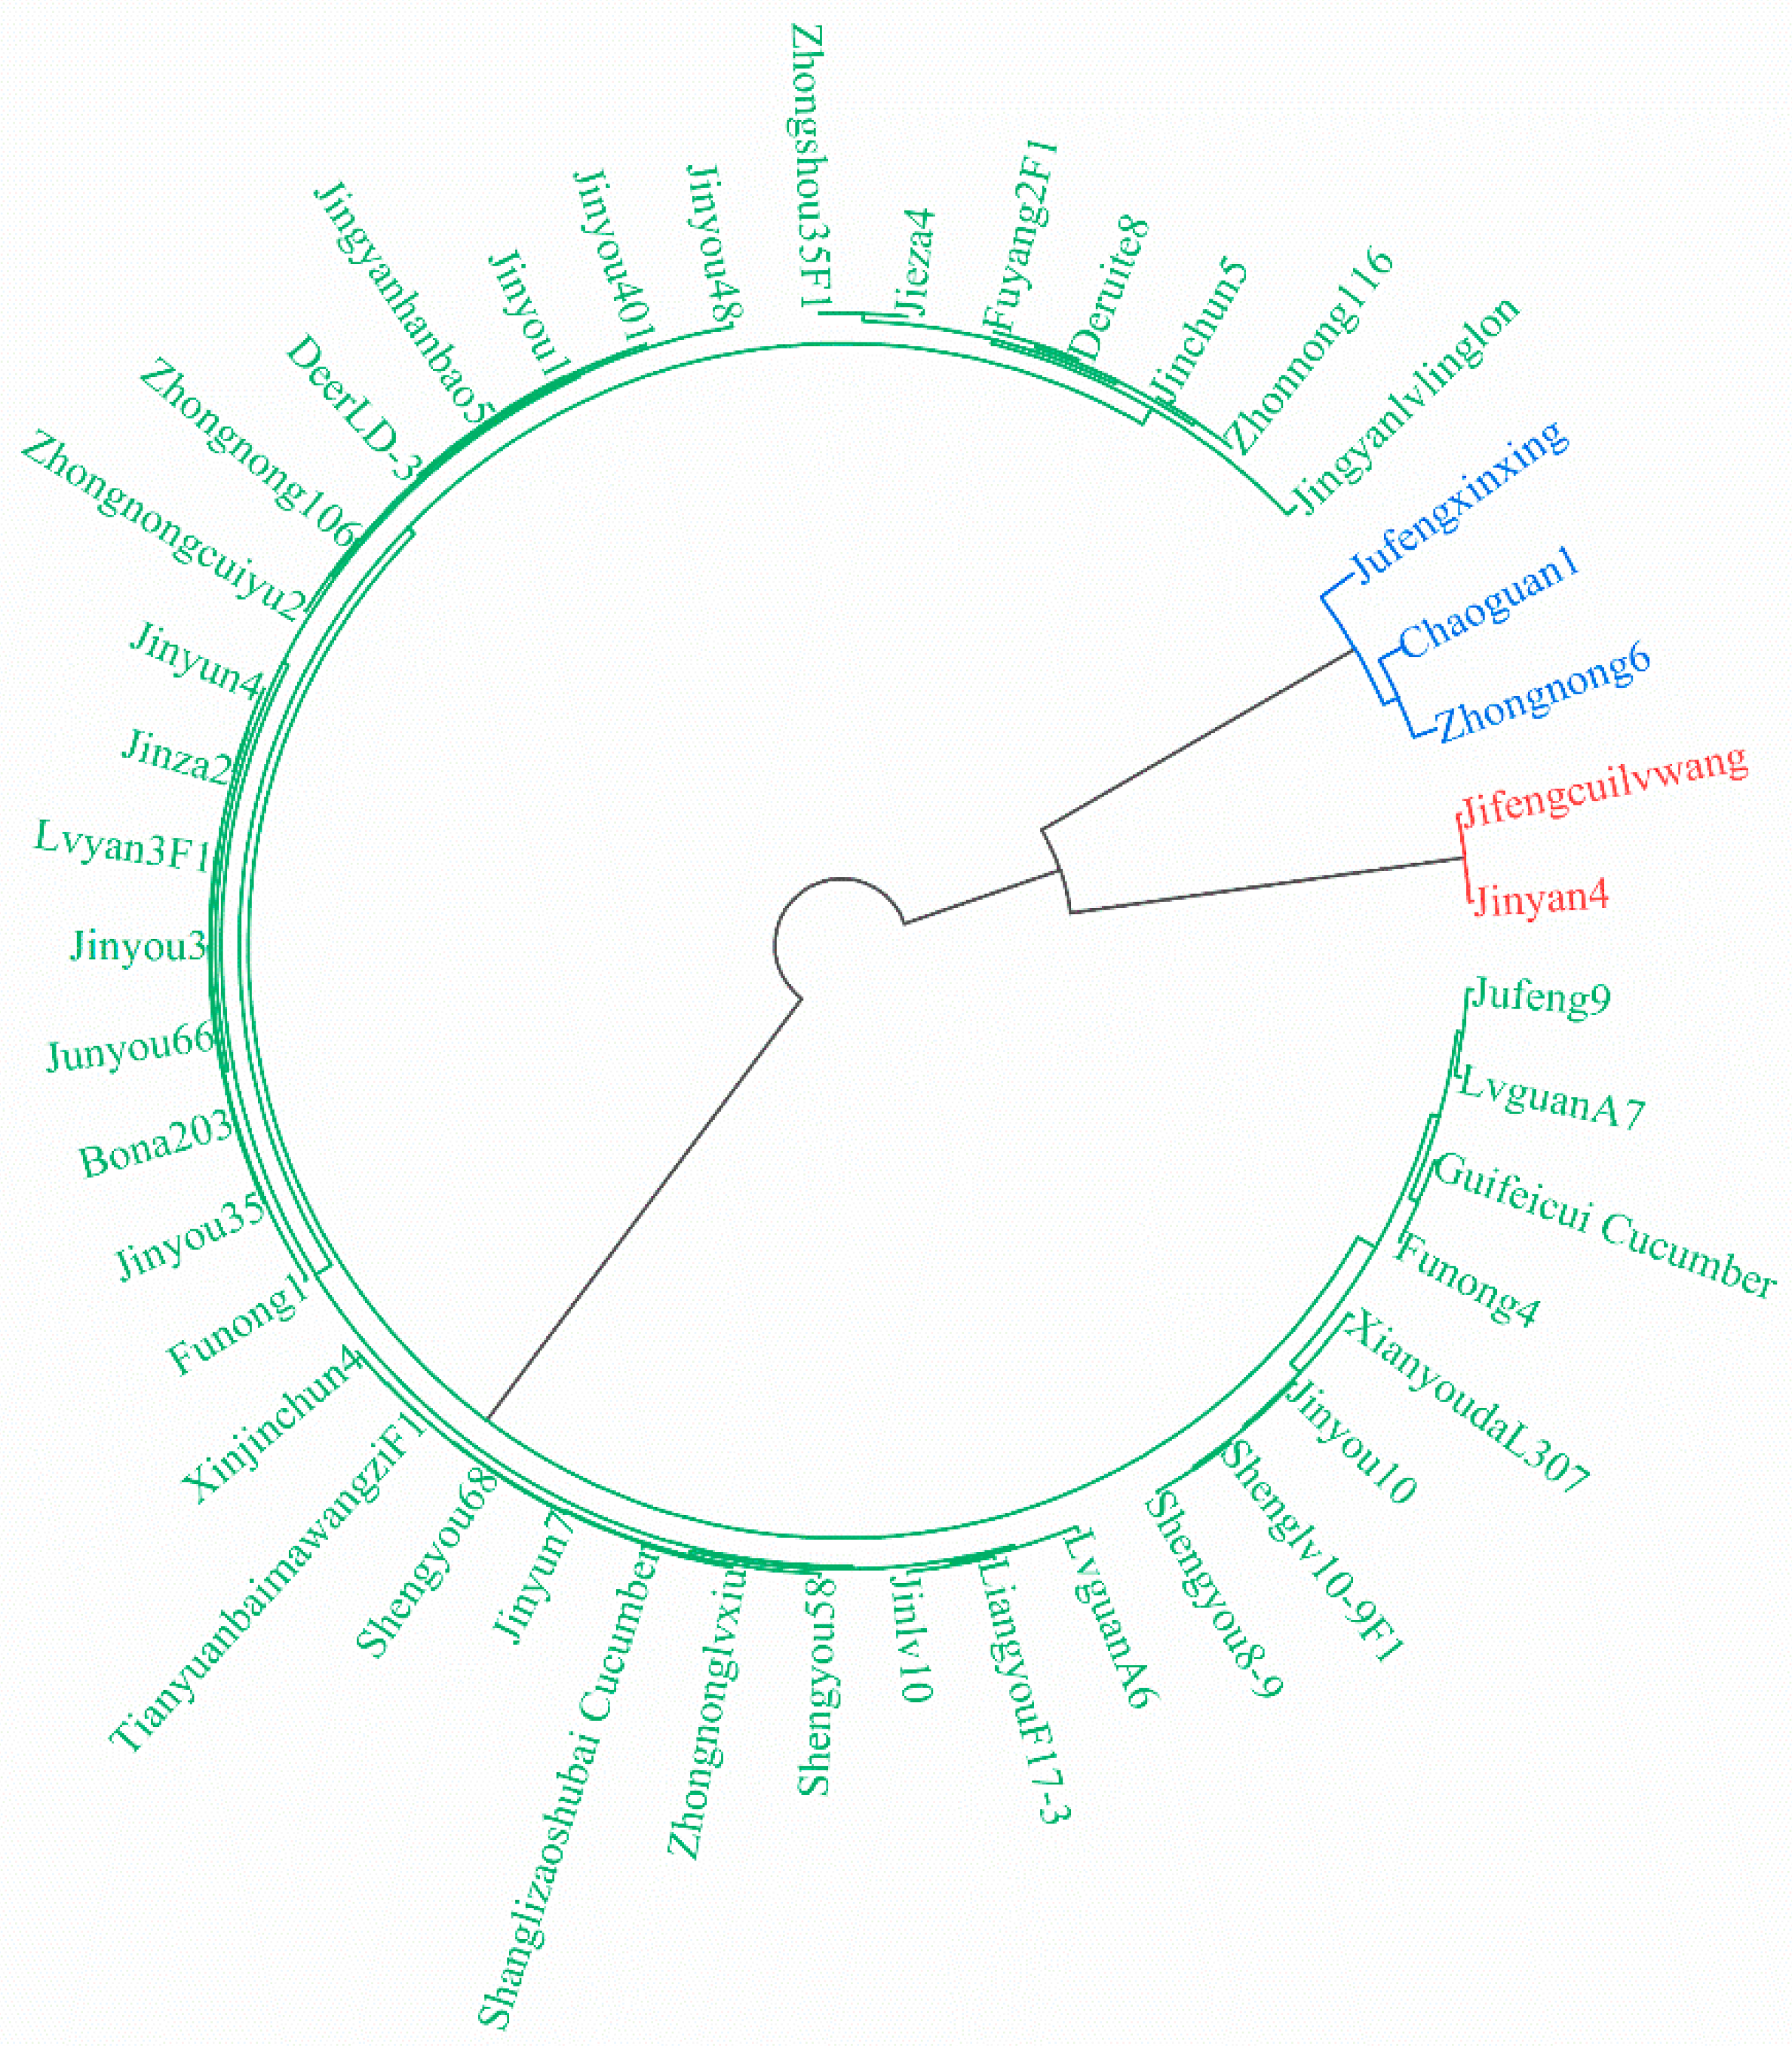
3.3. Comprehensive Evaluation of Autotoxicity Tolerance of Different Cucumber Cultivars
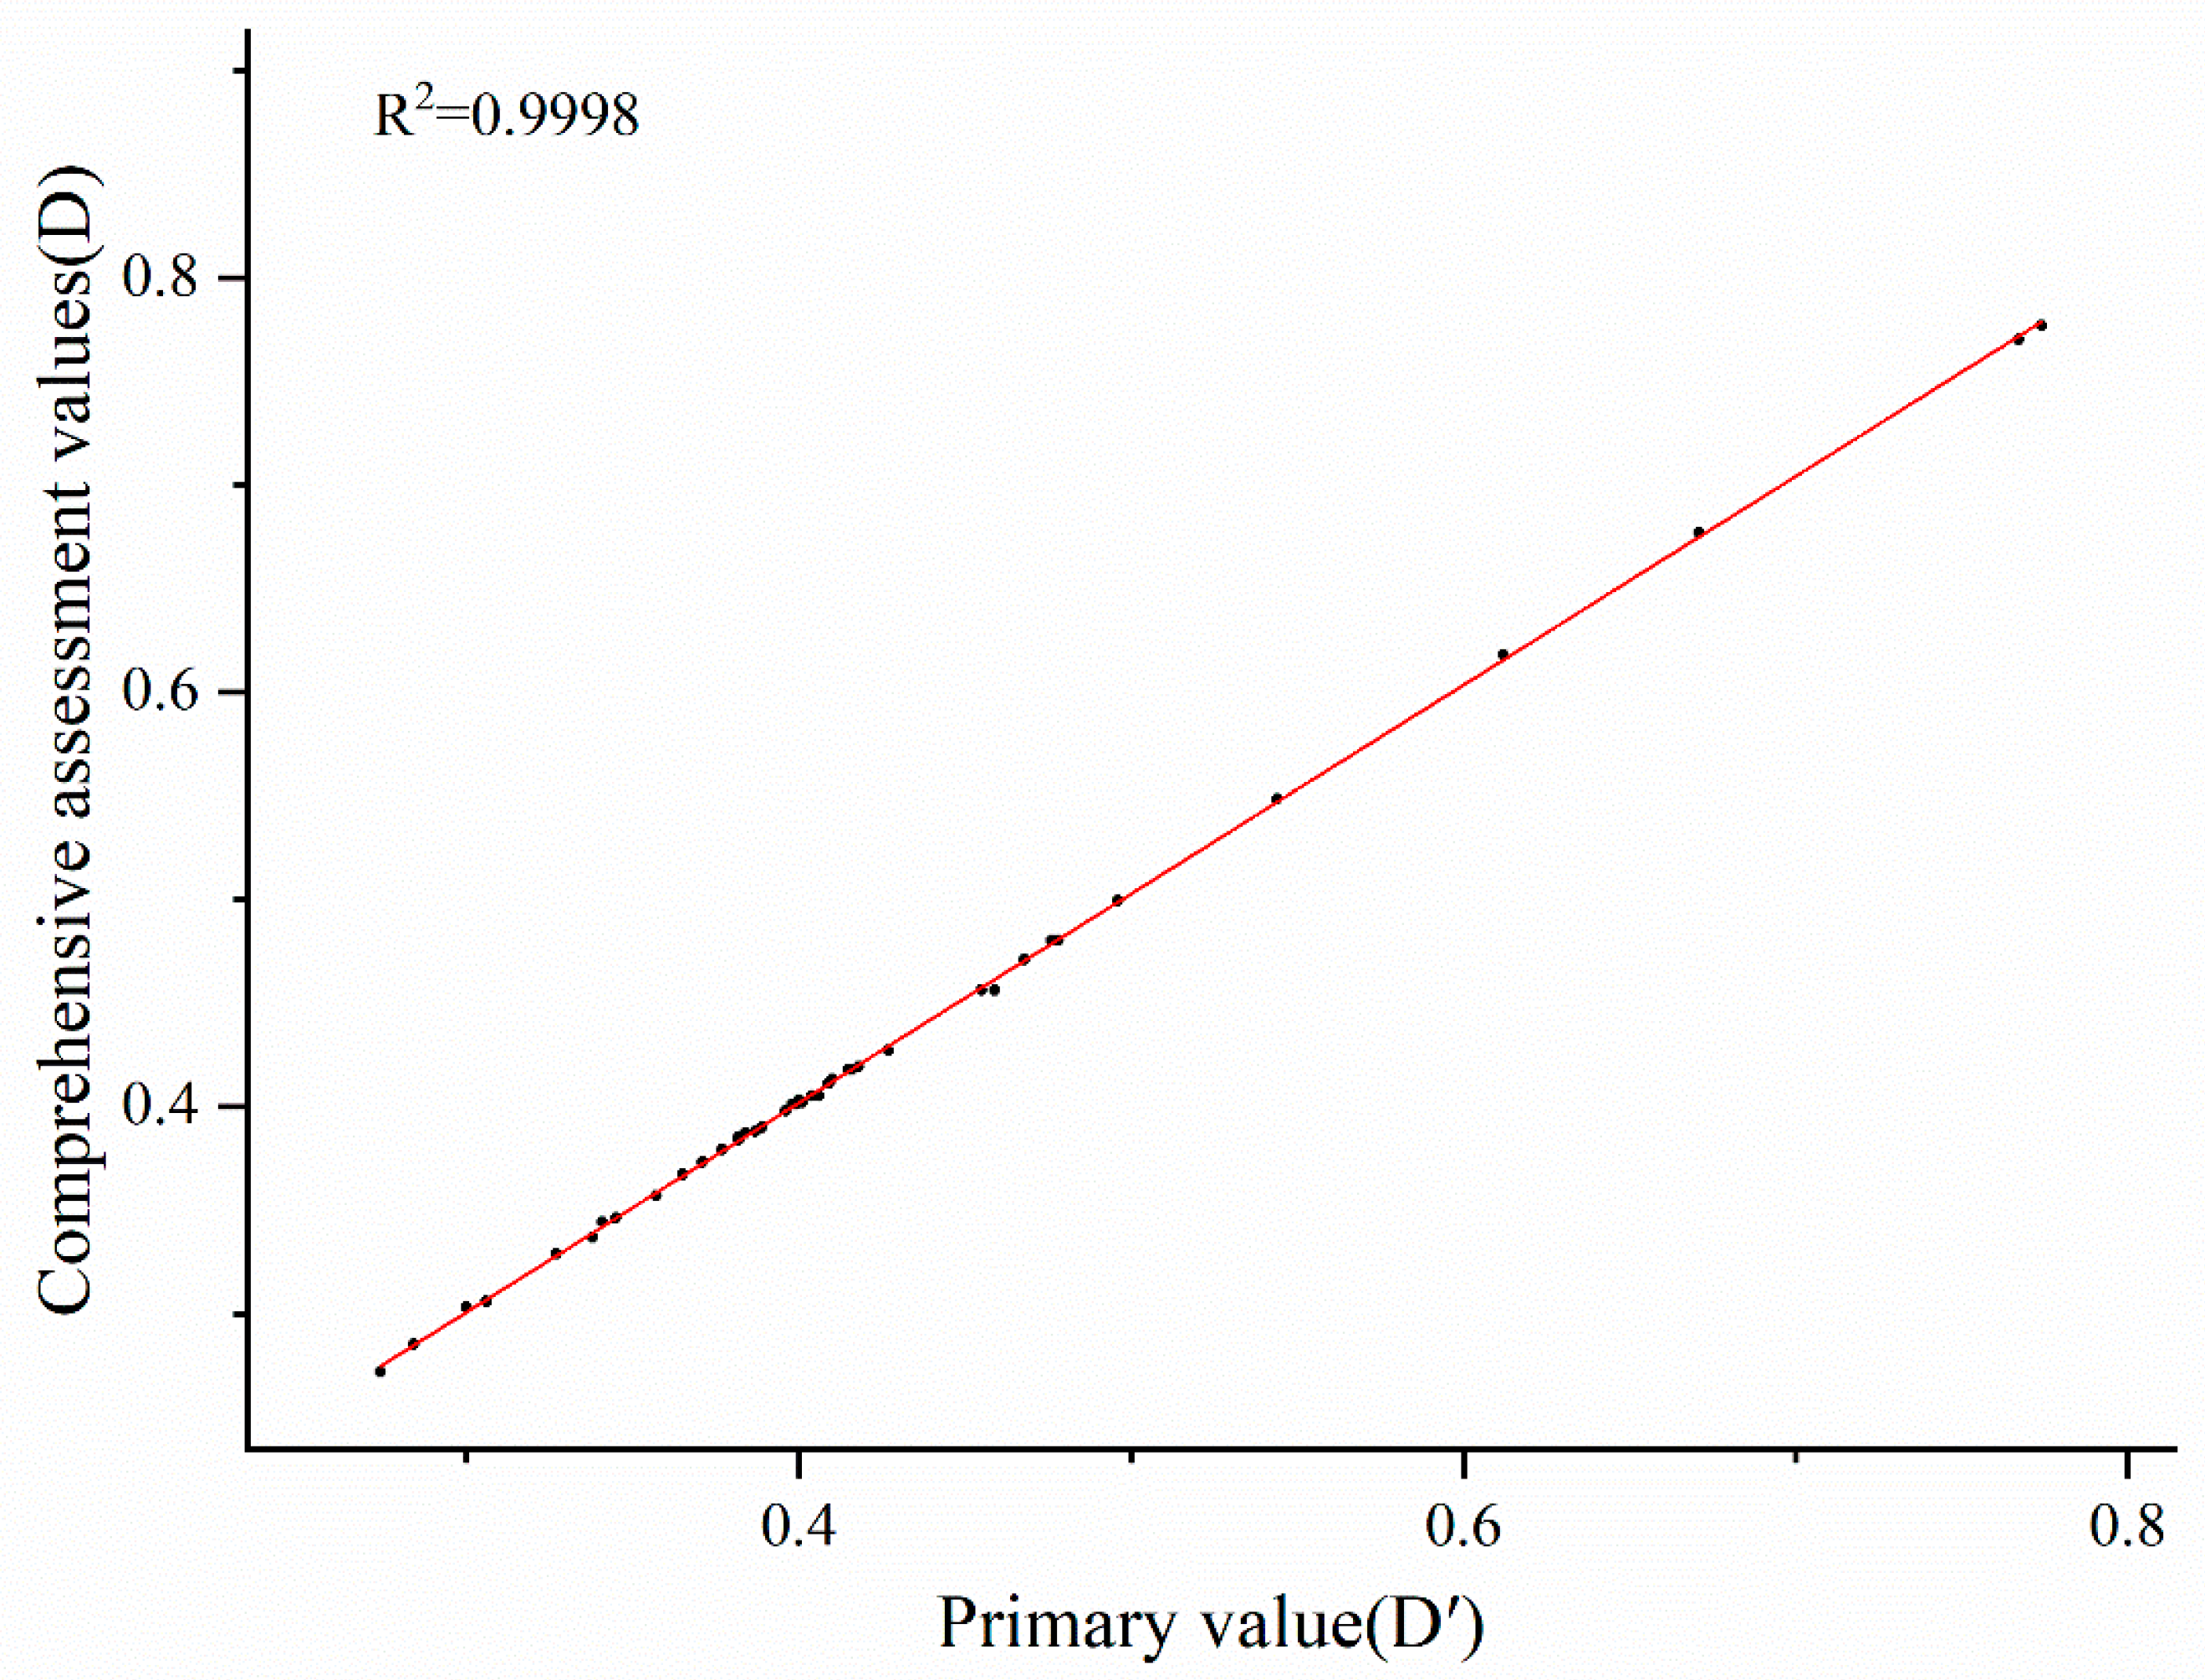
3.4. Construction of an Autotoxicity Tolerance Evaluation System of Cucumber Cultivars
4. Discussion
5. Conclusions
Supplementary Materials
Author Contributions
Funding
Data Availability Statement
Conflicts of Interest
References
- Yu, J.Q. Autotoxic potential of cucurbit crops: Phenomenon, chemicals, mechanisms and means to overcome. J. Crop Prod. 2001, 4, 335–348. [Google Scholar] [CrossRef]
- Singh, H.P.; Batish, D.R.; Kohli, R.K. Autotoxicity: Concept, organisms, and ecological significance. Crit. Rev. Plant Sci. 1999, 18, 757–772. [Google Scholar] [CrossRef]
- Liu, X.; Li, Y.J.; Ren, X.J.; Chen, B.H.; Zhang, Y.; Shen, C.W.; Wang, F.; Wu, D.F. Long-term greenhouse cucumber production alters soil bacterial community structure. J. Soil Sci. Plant Nutr. 2020, 20, 306–321. [Google Scholar] [CrossRef]
- Xiao, X.; Cheng, Z.; Lv, J.; Xie, J.; Ma, N.; Yu, J. A green garlic (Allium sativum L.) based intercropping system reduces the strain of continuous monocropping in cucumber (Cucumis sativus L.) by adjusting the micro-ecological environment of soil. PeerJ. 2019, 7, e7267. [Google Scholar] [CrossRef] [PubMed]
- Bai, X.; Gao, J.; Wang, S.; Cai, H.; Chen, Z.; Zhou, J. Excessive nutrient balance surpluses in newly built solar greenhouses over five years leads to high nutrient accumulations in soil. Agric. Ecosyst. Environ. 2020, 288, 106717. [Google Scholar] [CrossRef] [PubMed]
- Zhang, Z.H.; Fan, J.R.; Wu, J.H.; Zhang, L.Z.; Wang, J.R.; Zhang, B.B.; Wang-Pruski, G. Alleviating effect of silicon on melon seed germination under autotoxicity stress. Ecotoxicol. Environ. Saf. 2020, 188, 109901. [Google Scholar] [CrossRef] [PubMed]
- Yu, J.Q.; Matsui, Y. Phytotoxic substances in root exudates of cucumber (Cucumis sativus L.). J. Chem. Ecol. 1994, 20, 21–31. [Google Scholar] [CrossRef]
- Wu, F.Z.; Liu, D.; Shi, L.F. Effect of duration of protected cultivation on yield of cucumber. J. Northeast Agric. Univ. 1999, 30, 245–248. [Google Scholar] [CrossRef]
- Kato-Noguchi, H.; Nakamura, K.; Okuda, N. Involvement of an autotoxic compound in asparagus decline. J. Plant Physiol. 2018, 224–225, 49–55. [Google Scholar] [CrossRef]
- Yang, P.; Muhammad, A.N.; Li, F.X.; Bai, L.S.; Li, J. Brassinosteroids regulate antioxidant system and protect chloroplast ultrastructure of autotoxicity stressed cucumber (Cucumis sativus L.) Seedlings. Agronomy 2019, 9, 265. [Google Scholar] [CrossRef]
- Bu, R.F.; Xie, J.M.; Yu, J.H.; Liao, W.B.; Xiao, X.M.; Lv, J.; Wang, C.L.; Ye, J.; CalderonUrrea, A. Autotoxicity in cucumber (Cucumis sativus L.) seedlings is alleviated by silicon through an increase in the activity of antioxidant enzymes and by mitigating lipid peroxidation. J. Plant Biol. 2016, 59, 247–259. [Google Scholar] [CrossRef]
- Liu, F.H.; Lv, J.; Yu, J.H.; Jin, N.; Jin, L.; Hu, L.L.; Wu, Y.; Liu, X.Q.; Wang, S.Y. Effects of silicon on physiological characteristics of cucumber seed germination under self-toxic stress. J. Northwest A F Univ. (Nat. Sci. Ed.) 2020, 48, 90–96. [Google Scholar] [CrossRef]
- Hu, W.; Zhang, Y.; Huang, B.; Teng, Y. Soil environmental quality in greenhouse vegetable production systems in eastern China: Current status and management strategies. Chemosphere 2017, 170, 183–195. [Google Scholar] [CrossRef] [PubMed]
- Kyriacou, M.C.; Rouphael, Y.; Colla, G.; Zrenner, R.; Schwarz, D. Vegetable grafting: The implications of a growing agronomic imperative for vegetable fruit quality and nutritive value. Front. Plant Sci. 2017, 8, 741. [Google Scholar] [CrossRef] [PubMed]
- Miao, L.; Di, Q.; Sun, T.; Li, Y.; Duan, Y.; Wang, J.; He, C.; Wang, C.; Yu, X. Integrated metabolome and transcriptome analysis provide insights into the effects of grafting on fruit flavor of cucumber with different rootstocks. Int. J. Mol. Sci. 2019, 20, 3592. [Google Scholar] [CrossRef]
- Wang, S.; Kang, X.; Dai, J.; Dai, W.; Zhang, J.; Ji, J. Evaluation of areca quality based on principal component and hierarchical cluster analyses in Hainan, China. HortScience 2023, 58, 699–703. [Google Scholar] [CrossRef]
- Gao, B.Y.; Lu, Y.J.; Sheng, Y.; Chen, P.; Yu, L.L. Differentiating organic and conventional sage by chromatographic and mass spectrometry flow injection fingerprints combined with principal component analysis. J. Agric. Food Chem. 2013, 61, 2957–2963. [Google Scholar] [CrossRef] [PubMed]
- Li, J.; Yu, J.H.; Wu, Y.; Tang, Z.Q.; Liu, Z.C.; Lv, J. Quality evaluation of different small fruit watermelon varieties. China Cucurbits Veg. 2020, 33, 61–67. [Google Scholar] [CrossRef]
- Men, L.Z.; Wang, Y.; Gao, Y.E.; Chen, Q.Y.; Tian, Y.Q.; Gao, L.H. Salt tolerance indexs screening of different cucumber cultivars at seedling stage and construction of its evaluation system. China Veg. 2013, 22, 20–26. [Google Scholar] [CrossRef]
- Fu, L.J.; Li, C.X.; Su, S.Y.; Li, Y.H.; Zhou, Y. Screening of cucumber germplasms in seedling stage and the construction of evaluation system for heat tolerance. Plant Physiol. J. 2020, 56, 1593–1604. [Google Scholar] [CrossRef]
- Miao, Y.M.; Ning, Y.; Gao, Y.J.; Shen, J.; Pang, X.; Gui, L.; Cheng, C.Y.; Chen, J.F. Evaluation of cucumber’s chilling tolerance at germination and seedling stages. Chin. J. Appl. Ecol. 2013, 24, 1914–1922. [Google Scholar]
- Chen, E.Y.; Wang, R.F.; Qin, L.; Yang, Y.B.; Li, F.F.; Zhang, H.W.; Wang, H.L.; Liu, B.; Kong, Q.H.; Guan, Y.A. Comprehensive identification and evaluation of foxtail millet for saline-alkaline tolerance during germination. Acta Agron. Sin. 2020, 46, 1591–1604. [Google Scholar] [CrossRef]
- Bu, R.F.; Zhang, H.R.; Zhang, S.; Wang, L.S.; Peng, C.Y.; Zhao, X.H.; Zhang, X.N.; Xie, J.M. Silicon alleviates autotoxicity by regulating membrane lipid peroxidation and improving photosynthetic efficiency in cucumber seedlings (Cucumis sativus L.). Sci. Hortic. 2024, 325, 112692. [Google Scholar] [CrossRef]
- Meng, X.; Luo, S.L.; Dawuda, M.M.; Gao, X.Q.; Wang, S.Y.; Xie, J.M.; Tang, Z.Q.; Liu, Z.C.; Wu, Y.; Jin, L.; et al. Exogenous silicon enhances the systemic defense of cucumber leaves and roots against CA-induced autotoxicity stress by regulating the ascorbate-glutathione cycle and photosystem II. Ecotoxicol. Environ. Saf. 2021, 227, 112879. [Google Scholar] [CrossRef] [PubMed]
- Xiao, X.; Lv, J.; Xie, J.; Feng, Z.; Ma, N.; Li, J.; Yu, J.; Calderón-Urrea, A. Transcriptome analysis reveals the different response to toxic stress in rootstock grafted and non-grafted cucumber seedlings. Int. J. Mol. Sci. 2020, 21, 774. [Google Scholar] [CrossRef] [PubMed]
- Xiao, X.M.; Ma, N.; Li, J.; Wang, R.; Hu, L.L.; Wu, Y.; Yu, J.H. Effect of autotoxic stress on seed germination and antioxidant property of cucumber scion and rootstock. China Veg. 2022, 9, 22–29. [Google Scholar] [CrossRef]
- Dhindsa, R.S.; Plumb-Dhindsa, P.; Thopre, T.A. Leaf senescence: Correlated with increased levels of membrane permeability and lipid peroxidation, and decreased levels of superoxide dismutase and catalase. J. Exp. Bot. 1981, 32, 93–101. [Google Scholar] [CrossRef]
- Song, A.; Li, Z.J.; Zhang, J.; Xue, G.F.; Fan, F.L.; Liang, Y.C. Silicon-enhanced resistance to cadmium toxicity in Brassica chinensis L. is attributed to Si-suppressed cadmium uptake and transport and Si-enhanced antioxidant defense capacity. J. Hazard. Mater. 2009, 172, 74–83. [Google Scholar] [CrossRef]
- Gunes, A.; Inal, A.; Bagci, E.G.; Coban, S.; Pilbeam, D.J. Silicon mediates changes to some physiological and enzymatic parameters symptomatic for oxidative stress in spinach (Spinacia oleracea L.) grown under B toxicity. Sci. Hortic. 2007, 113, 113–119. [Google Scholar] [CrossRef]
- Bialecka, B.; Kepczyhski, J. Germination, α-, β-amylase and total dehydrogenase activities of amaranthus caudatus seeds under water stress in the presence of ethephon or gibberellin A3. Acta Biol. Cracoviensia Ser. Bot. 2010, 52, 7–12. [Google Scholar] [CrossRef]
- Li, F.X.; Zhou, Y.F.; Wang, Y.T.; Sun, L.; Bai, W.; Yan, T.; Xu, W.J.; Huang, R.D. Screening and identification of sorghum cultivars for alkali tolerance during germination. Sci. Agric. Sin. 2013, 46, 1762–1771. [Google Scholar] [CrossRef]
- Han, F.; Zhuge, Y.P.; Lou, Y.H.; Wang, H.; Zhang, N.D.; He, W.; Chao, Y. Evaluation of salt tolerance and screening for salt tolerant accessions of 63 foxtail millet germplasm. J. Plant Genet. Resour. 2018, 19, 685–693. [Google Scholar] [CrossRef]
- Jatav, V.; Singh, D.; Singh, N.; Panchbhaiya, A. Principal component analysis in bitter gourd (Momordica Charantia L.). Bangladesh J. Bot. 2022, 51, 1–7. [Google Scholar] [CrossRef]
- Wu, F.Z.; Huang, C.H.; Zhao, F.Y. Effects of phenolic acids on growth and activities of membrance protective enzymes of cucumber seedlings. Sci. Agric. Sin. 2002, 35, 821–825. [Google Scholar] [CrossRef]
- Ma, N.; Chen, B.; Yang, H.; Liu, W.; Huang, X.C.; Xiao, X.M.; Xie, J.M. Different response of growth, development and photosynthetic fluorescence characteristics of non-grafted and rootstock grafted cucumber seedling to autotoxic stress. China Cucurbits Veg. 2020, 33, 17–23. [Google Scholar] [CrossRef]
- Tian, X.; Liu, X.Q.; Liu, X.R.; Li, Q.S.; Abd_Allah, E.F.; Wu, Q.S. Mycorrhizal cucumber with Diversispora versiformis has active heat stress tolerance by up-regulating expression of both CsHsp70s and CsPIPs genes. Sci. Hortic. 2023, 319, 111870. [Google Scholar] [CrossRef]
- Yu, Y.; Li, Y.J.; Wang, F.; Wang, N.; Huo, Y.L.; Feng, T. Principal component and cluster analysis of agronomic characters on cucumber germplasm resources in northern China. China Cucurbits Veg. 2020, 33, 29–34. [Google Scholar] [CrossRef]
- Wang, L.Y.; Wang, X.M.; Jing, R.Y.; Guo, Y.X. Comprehensive quality evaluation and analysis of nutrition components of various flaxseed. Food Mach. 2021, 37, 26–32. [Google Scholar] [CrossRef]
- Cao, Q.W.; Du, L.D.; Yang, Z.H.; Li, L.B.; Duan, X.; Yang, W.Q.; Chen, W.; Meng, Z.J. Screening and evaluation of cucumber salt-tolerant germplasm. J. Nucl. Agric. Sci. 2022, 36, 865–875. [Google Scholar] [CrossRef]
- Xu, X.; Liu, M.J.; Wang, J.H.; Sun, Q.; Xiang, C.Y. Differences in vigor of sweet corn seeds under different adverse conditions. Jiangsu Agric. Sci. 2019, 47, 76–79. [Google Scholar] [CrossRef]
- Zhao, W.X.; Liu, X.C.; Li, X.H.; Xu, X.L.; Chang, G.Z.; Liang, S.; Kang, L.Y.; Gao, N.N. Physiological responses of muskmelon seedlings to different adversity stresses and synthetical evaluation of stress resistance. Southwest China J. Agric. Sci. 2017, 30, 322–326. [Google Scholar] [CrossRef]
- Guo, C.; Zhu, L.; Sun, H.; Han, Q.; Wang, S.; Zhu, J.; Zhang, Y.; Zhang, K.; Bai, Z.; Li, A.; et al. Evaluation of drought-tolerant varieties based on root system architecture in cotton (Gossypium hirsutum L.). BMC Plant Biol. 2024, 24, 127. [Google Scholar] [CrossRef] [PubMed]
- Tian, H.; Liu, H.; Zhang, D.; Hu, M.; Zhang, F.; Ding, S.; Yang, K. Screening of salt tolerance of maize (Zea mays L.) lines using membership function value and GGE biplot analysis. PeerJ. 2024, 12, e16838. [Google Scholar] [CrossRef] [PubMed]
- Bahmani, K.; Izadi-Darbandi, A.; Noori SA, S.; Jafari, A.A.; Moradi, N. Determination of interrelationships among phenotypic traits of iranian fennel (Foeniculum vulgare Mill.) using correlation, stepwise regression and path analyses. J. Essent. Oil Bear. Plants 2012, 15, 424–444. [Google Scholar] [CrossRef]
- Zhang, N.; Zhang, H.; Ren, J.; Bai, B.; Guo, P.; Lv, Z.; Kang, S.; Zhao, X.; Yu, H.; Zhao, T. Characterization and comprehensive evaluation of phenotypic and yield traits in salt-stress-tolerant peanut germplasm for conservation and breeding. Horticulturae 2024, 10, 147. [Google Scholar] [CrossRef]

| No. | Cultivars | Breeding Institutes (Production Unit) | No. | Cultivars | Breeding Institutes (Production Unit) |
|---|---|---|---|---|---|
| 1 | Jinchun5 | TJKRCRI | 24 | LiangyouF17-3 | TJYLT Co., Ltd. |
| 2 | Jinyou1 | TJKRCRI | 25 | Chaoguan1 | SDSGSASI Co., Ltd. |
| 3 | Jinyun7 | TJKRCRI | 26 | Bona203 | TJDRC |
| 4 | Jinyou35 | TJKRCRI | 27 | Jufeng9 | SDSGCGASI Co., Ltd. |
| 5 | Jinyou3 | TJKRCRI | 28 | Jufengxinxing | SDSGCGASI Co., Ltd. |
| 6 | Jinyun4 | TJKRCRI | 29 | TianyuanbaimawangziF1 | JXSRLMA Co., Ltd. |
| 7 | Jinlü10 | TJCRI | 30 | XianyoudaL307 | TJXYDSI Co., Ltd. |
| 8 | Jinza2 | TJKRCRI | 31 | Shanglizaoshubai Cucumber | HNZZNZSI Co., Ltd. |
| 9 | Jinyan4 | TJKRCRI | 32 | Guifeicui Cucumber | HVRIHBP |
| 10 | Xinjinchun4 | TJCRI | 33 | Jieza4 | JLVFRI |
| 11 | Zhongnong6 | CAAS | 34 | Shengyou68 | YNAAS |
| 12 | Zhongnong106 | CAAS | 35 | Shengyou8-9 | YNAAS |
| 13 | Zhongnonglüxiu | CAAS | 36 | Shengyou58 | YNAAS |
| 14 | Zhonnong116 | CAAS | 37 | Lüyan3F1 | WHGDFACT Co., Ltd. |
| 15 | Zhongshou35F1 | SDSGXXRH Co., Ltd. | 38 | LüguanA6 | SDAAS |
| 16 | Funong1 | SDSGHWSI Co., Ltd. | 39 | LüguanA7 | SDAAS |
| 17 | Funong4 | SDSGHWSI Co., Ltd. | 40 | Deruite8 | TJDRC |
| 18 | Fuyang2F1 | SDSGHLSI Co., Ltd. | 41 | Jingyanhanbao5 | BJVRI |
| 19 | Jingyanlülinglon | BJVRI | 42 | Zhongnongcuiyu2 | SDAAS |
| 20 | Shenglv10-9F1 | BJVRI | 43 | Junyou66 | LNVRI |
| 21 | Jinyou48 | TJKRCRI | 44 | Jifengcuilüwang | JLVFRI |
| 22 | Jinyou10 | TJKRCRI | 45 | DeerLD-3 | TJDETSI Co., Ltd. |
| 23 | Jinyou401 | TJKRCRI |
| Principal Component | Ⅰ | Ⅱ | Ⅲ | Ⅳ | Ⅴ | Ⅵ | Ⅶ | Ⅷ | Ⅸ |
|---|---|---|---|---|---|---|---|---|---|
| Eigen value | 6.30 | 4.72 | 3.80 | 2.85 | 2.40 | 1.60 | 1.45 | 1.34 | 1.05 |
| Contribution (%) | 22.51 | 16.85 | 13.56 | 10.19 | 8.56 | 5.73 | 5.20 | 4.79 | 3.74 |
| Cumulative contribution (%) | 22.51 | 39.36 | 52.93 | 63.12 | 71.68 | 77.40 | 82.60 | 87.39 | 91.13 |
| No. | Z1 | Z2 | Z3 | Z4 | Z5 | Z6 | Z7 | Z8 | Z9 |
|---|---|---|---|---|---|---|---|---|---|
| 1 | 25.061 | 7.426 | 38.382 | 54.591 | 2.661 | 104.669 | 24.861 | 59.744 | 220.965 |
| 2 | 18.143 | 5.195 | 23.292 | 36.267 | 22.812 | 82.506 | 38.620 | 60.271 | 244.565 |
| 3 | 20.106 | 6.159 | 8.840 | 18.731 | 31.420 | 106.923 | −3.287 | 74.545 | 177.678 |
| 4 | 6.140 | 9.353 | −0.797 | 33.579 | 46.410 | 93.772 | 52.939 | 124.199 | 261.966 |
| 5 | 4.630 | 25.641 | 0.580 | 23.259 | 27.773 | 84.420 | 65.268 | 89.463 | 282.263 |
| 6 | 8.779 | 18.235 | 12.647 | 10.032 | 16.385 | 112.009 | 47.912 | 96.187 | 264.947 |
| 7 | 20.353 | −2.832 | 22.810 | 9.598 | 39.254 | 91.388 | 22.139 | 33.793 | 202.477 |
| 8 | 11.583 | 21.213 | 6.507 | 24.618 | 24.428 | 87.665 | 45.350 | 59.247 | 258.950 |
| 9 | 53.654 | 42.631 | 77.092 | 73.365 | −36.330 | 151.127 | −35.911 | 114.178 | 250.063 |
| 10 | 20.279 | −13.937 | 31.185 | 4.973 | 36.790 | 141.979 | −1.269 | 31.758 | 283.087 |
| 11 | 35.297 | 32.068 | 52.411 | 73.230 | 15.017 | 140.915 | −39.853 | 112.753 | 267.594 |
| 12 | 27.595 | −1.319 | 0.465 | 12.970 | 37.583 | 116.158 | 15.648 | 65.776 | 273.294 |
| 13 | 16.350 | 4.353 | 19.455 | 13.547 | 9.686 | 121.629 | 16.175 | 82.469 | 212.177 |
| 14 | 31.198 | 9.385 | 34.784 | 43.267 | 21.171 | 83.463 | 12.347 | 28.200 | 217.949 |
| 15 | 9.998 | 23.463 | 17.341 | 19.547 | 21.810 | 111.049 | 59.241 | 93.036 | 296.614 |
| 16 | 17.226 | 13.198 | 18.285 | 5.416 | 17.541 | 107.228 | −11.657 | 96.365 | 213.958 |
| 17 | −6.636 | 4.911 | 12.516 | −2.630 | 40.447 | 82.834 | 98.765 | 81.877 | 252.072 |
| 18 | 21.500 | 19.239 | 21.337 | 34.850 | 19.004 | 102.001 | 4.061 | 83.530 | 241.118 |
| 19 | 35.123 | 0.099 | 29.745 | 42.404 | 28.056 | 110.560 | 14.825 | 24.686 | 282.031 |
| 20 | 17.657 | −2.352 | 3.108 | 10.905 | 32.074 | 83.218 | 40.808 | 61.667 | 232.877 |
| 21 | 28.140 | −10.478 | 25.626 | 58.790 | 8.009 | 122.645 | −17.828 | 62.115 | 213.980 |
| 22 | 13.203 | 2.802 | 23.011 | 36.420 | 18.585 | 55.887 | 16.366 | 30.800 | 183.931 |
| 23 | 19.271 | 7.181 | 31.258 | 16.303 | 21.051 | 98.985 | 59.237 | 37.830 | 205.656 |
| 24 | 17.113 | −23.217 | 5.562 | 52.892 | 37.118 | 136.005 | 48.680 | 55.290 | 235.530 |
| 25 | 28.405 | 25.618 | 46.464 | 58.471 | 24.524 | 141.735 | −52.733 | 121.390 | 281.987 |
| 26 | 16.662 | 12.272 | 13.585 | 28.484 | 27.284 | 75.532 | 43.487 | 38.557 | 251.527 |
| 27 | 4.291 | −11.472 | 13.513 | 4.562 | 30.170 | 80.349 | 16.292 | 74.389 | 248.032 |
| 28 | 44.147 | 7.686 | 24.110 | 40.108 | 20.646 | 83.781 | 43.217 | 73.211 | 273.856 |
| 29 | 23.427 | 0.012 | 8.215 | 41.296 | 19.222 | 78.439 | 25.454 | 38.368 | 262.882 |
| 30 | 5.929 | −2.210 | 17.082 | 21.773 | 28.844 | 97.232 | 34.270 | 56.345 | 220.762 |
| 31 | 30.624 | 1.333 | 5.588 | 21.941 | 31.143 | 75.127 | 5.993 | 25.278 | 209.296 |
| 32 | 20.212 | −24.542 | 6.138 | 16.189 | 46.063 | 79.032 | 48.915 | 36.956 | 217.611 |
| 33 | 31.326 | 10.309 | 13.282 | 55.562 | −22.350 | 73.810 | 59.322 | 76.822 | 261.528 |
| 34 | 13.265 | −4.653 | 12.038 | 30.158 | 17.611 | 124.918 | 55.403 | 89.765 | 262.421 |
| 35 | 24.083 | −1.522 | 18.527 | −0.543 | 22.511 | 55.907 | 40.083 | 61.543 | 166.249 |
| 36 | 23.600 | −7.236 | 26.331 | 0.284 | 55.521 | 97.287 | −7.840 | −4.808 | 265.569 |
| 37 | 19.429 | 24.763 | −0.445 | 31.265 | 25.620 | 60.632 | 6.247 | 56.591 | 217.513 |
| 38 | 24.582 | −6.892 | 11.870 | 6.825 | 42.949 | 63.238 | 25.636 | 39.514 | 244.030 |
| 39 | 11.183 | −14.402 | 19.213 | 21.071 | 47.459 | 59.794 | −20.791 | 32.884 | 209.853 |
| 40 | 30.325 | 11.668 | 7.494 | 9.379 | 51.595 | 83.785 | 32.295 | 34.515 | 345.673 |
| 41 | 31.269 | −7.391 | 16.263 | 9.869 | 30.455 | 104.614 | 30.013 | 40.989 | 282.867 |
| 42 | 25.056 | −4.848 | 5.727 | 4.287 | 50.636 | 92.913 | 62.515 | 36.378 | 346.776 |
| 43 | 18.087 | −4.805 | 25.270 | 35.150 | 60.891 | 70.402 | −23.890 | 13.793 | 331.124 |
| 44 | 43.017 | 14.977 | 86.984 | 110.428 | 17.877 | 159.654 | −76.240 | 110.890 | 319.256 |
| 45 | 25.224 | 4.937 | 9.632 | 21.412 | 37.917 | 94.130 | 12.136 | 56.727 | 234.813 |
| No. | µ(X1) | µ(X2) | µ(X3) | µ(X4) | µ(X5) | µ(X6) | µ(X7) | µ(X8) | µ(X9) | Assessment Values (D) | Rank |
|---|---|---|---|---|---|---|---|---|---|---|---|
| 1 | 0.526 | 0.476 | 0.446 | 0.506 | 0.401 | 0.470 | 0.578 | 0.500 | 0.303 | 0.480 | 8 |
| 2 | 0.411 | 0.443 | 0.274 | 0.344 | 0.608 | 0.257 | 0.656 | 0.504 | 0.434 | 0.418 | 15 |
| 3 | 0.444 | 0.457 | 0.110 | 0.189 | 0.697 | 0.492 | 0.417 | 0.615 | 0.063 | 0.387 | 31 |
| 4 | 0.212 | 0.505 | 0.000 | 0.320 | 0.851 | 0.365 | 0.738 | 1.000 | 0.530 | 0.401 | 26 |
| 5 | 0.187 | 0.747 | 0.016 | 0.229 | 0.659 | 0.275 | 0.809 | 0.731 | 0.643 | 0.402 | 23 |
| 6 | 0.256 | 0.637 | 0.153 | 0.112 | 0.542 | 0.541 | 0.709 | 0.783 | 0.547 | 0.405 | 20 |
| 7 | 0.448 | 0.323 | 0.269 | 0.108 | 0.777 | 0.342 | 0.562 | 0.299 | 0.201 | 0.373 | 35 |
| 8 | 0.302 | 0.681 | 0.083 | 0.241 | 0.625 | 0.306 | 0.695 | 0.497 | 0.514 | 0.405 | 21 |
| 9 | 1.000 | 1.000 | 0.887 | 0.672 | 0.000 | 0.918 | 0.230 | 0.922 | 0.464 | 0.777 | 1 |
| 10 | 0.446 | 0.158 | 0.364 | 0.067 | 0.752 | 0.830 | 0.428 | 0.283 | 0.647 | 0.390 | 28 |
| 11 | 0.696 | 0.843 | 0.606 | 0.671 | 0.528 | 0.819 | 0.208 | 0.911 | 0.561 | 0.677 | 3 |
| 12 | 0.568 | 0.346 | 0.014 | 0.138 | 0.760 | 0.581 | 0.525 | 0.547 | 0.593 | 0.413 | 18 |
| 13 | 0.381 | 0.430 | 0.231 | 0.143 | 0.473 | 0.634 | 0.528 | 0.677 | 0.254 | 0.384 | 33 |
| 14 | 0.628 | 0.505 | 0.405 | 0.406 | 0.591 | 0.266 | 0.506 | 0.256 | 0.286 | 0.480 | 7 |
| 15 | 0.276 | 0.715 | 0.207 | 0.196 | 0.598 | 0.532 | 0.774 | 0.758 | 0.722 | 0.456 | 12 |
| 16 | 0.396 | 0.562 | 0.217 | 0.071 | 0.554 | 0.495 | 0.369 | 0.784 | 0.264 | 0.398 | 27 |
| 17 | 0.000 | 0.438 | 0.152 | 0.000 | 0.790 | 0.260 | 1.000 | 0.672 | 0.475 | 0.306 | 42 |
| 18 | 0.467 | 0.652 | 0.252 | 0.332 | 0.569 | 0.444 | 0.459 | 0.685 | 0.415 | 0.471 | 10 |
| 19 | 0.693 | 0.367 | 0.348 | 0.398 | 0.662 | 0.527 | 0.520 | 0.229 | 0.641 | 0.499 | 6 |
| 20 | 0.403 | 0.330 | 0.044 | 0.120 | 0.704 | 0.263 | 0.669 | 0.515 | 0.369 | 0.344 | 39 |
| 21 | 0.577 | 0.209 | 0.301 | 0.543 | 0.456 | 0.643 | 0.334 | 0.519 | 0.264 | 0.427 | 13 |
| 22 | 0.329 | 0.407 | 0.271 | 0.345 | 0.565 | 0.000 | 0.529 | 0.276 | 0.098 | 0.337 | 40 |
| 23 | 0.430 | 0.472 | 0.365 | 0.167 | 0.590 | 0.415 | 0.774 | 0.331 | 0.218 | 0.419 | 14 |
| 24 | 0.394 | 0.020 | 0.072 | 0.491 | 0.755 | 0.772 | 0.714 | 0.466 | 0.384 | 0.367 | 36 |
| 25 | 0.581 | 0.747 | 0.538 | 0.540 | 0.626 | 0.827 | 0.134 | 0.978 | 0.641 | 0.618 | 4 |
| 26 | 0.386 | 0.548 | 0.164 | 0.275 | 0.654 | 0.189 | 0.684 | 0.336 | 0.472 | 0.401 | 25 |
| 27 | 0.181 | 0.195 | 0.163 | 0.064 | 0.684 | 0.236 | 0.529 | 0.614 | 0.453 | 0.272 | 45 |
| 28 | 0.842 | 0.480 | 0.284 | 0.378 | 0.586 | 0.269 | 0.683 | 0.605 | 0.596 | 0.548 | 5 |
| 29 | 0.499 | 0.366 | 0.103 | 0.389 | 0.571 | 0.217 | 0.581 | 0.335 | 0.535 | 0.390 | 29 |
| 30 | 0.208 | 0.332 | 0.204 | 0.216 | 0.670 | 0.398 | 0.631 | 0.474 | 0.302 | 0.329 | 41 |
| 31 | 0.618 | 0.385 | 0.073 | 0.217 | 0.694 | 0.185 | 0.470 | 0.233 | 0.238 | 0.385 | 32 |
| 32 | 0.445 | 0.000 | 0.079 | 0.166 | 0.847 | 0.223 | 0.715 | 0.324 | 0.285 | 0.303 | 43 |
| 33 | 0.630 | 0.519 | 0.160 | 0.515 | 0.144 | 0.173 | 0.775 | 0.633 | 0.528 | 0.456 | 11 |
| 34 | 0.330 | 0.296 | 0.146 | 0.290 | 0.555 | 0.665 | 0.752 | 0.733 | 0.533 | 0.388 | 30 |
| 35 | 0.510 | 0.343 | 0.220 | 0.018 | 0.605 | 0.000 | 0.665 | 0.514 | 0.000 | 0.346 | 38 |
| 36 | 0.502 | 0.258 | 0.309 | 0.026 | 0.945 | 0.399 | 0.391 | 0.000 | 0.550 | 0.379 | 34 |
| 37 | 0.432 | 0.734 | 0.004 | 0.300 | 0.637 | 0.046 | 0.471 | 0.476 | 0.284 | 0.403 | 22 |
| 38 | 0.518 | 0.263 | 0.144 | 0.084 | 0.815 | 0.071 | 0.582 | 0.344 | 0.431 | 0.357 | 37 |
| 39 | 0.296 | 0.151 | 0.228 | 0.210 | 0.862 | 0.038 | 0.317 | 0.292 | 0.242 | 0.285 | 44 |
| 40 | 0.613 | 0.539 | 0.094 | 0.106 | 0.904 | 0.269 | 0.620 | 0.305 | 0.994 | 0.471 | 9 |
| 41 | 0.629 | 0.255 | 0.194 | 0.111 | 0.687 | 0.470 | 0.607 | 0.355 | 0.646 | 0.418 | 16 |
| 42 | 0.526 | 0.293 | 0.074 | 0.061 | 0.895 | 0.357 | 0.793 | 0.319 | 1.000 | 0.411 | 19 |
| 43 | 0.410 | 0.294 | 0.297 | 0.334 | 1.000 | 0.140 | 0.299 | 0.144 | 0.913 | 0.402 | 24 |
| 44 | 0.824 | 0.588 | 1.000 | 1.000 | 0.558 | 1.000 | 0.000 | 0.897 | 0.848 | 0.770 | 2 |
| 45 | 0.528 | 0.439 | 0.119 | 0.213 | 0.764 | 0.369 | 0.505 | 0.477 | 0.380 | 0.418 | 17 |
| Weight | 0.247 | 0.185 | 0.149 | 0.112 | 0.094 | 0.063 | 0.057 | 0.053 | 0.041 |
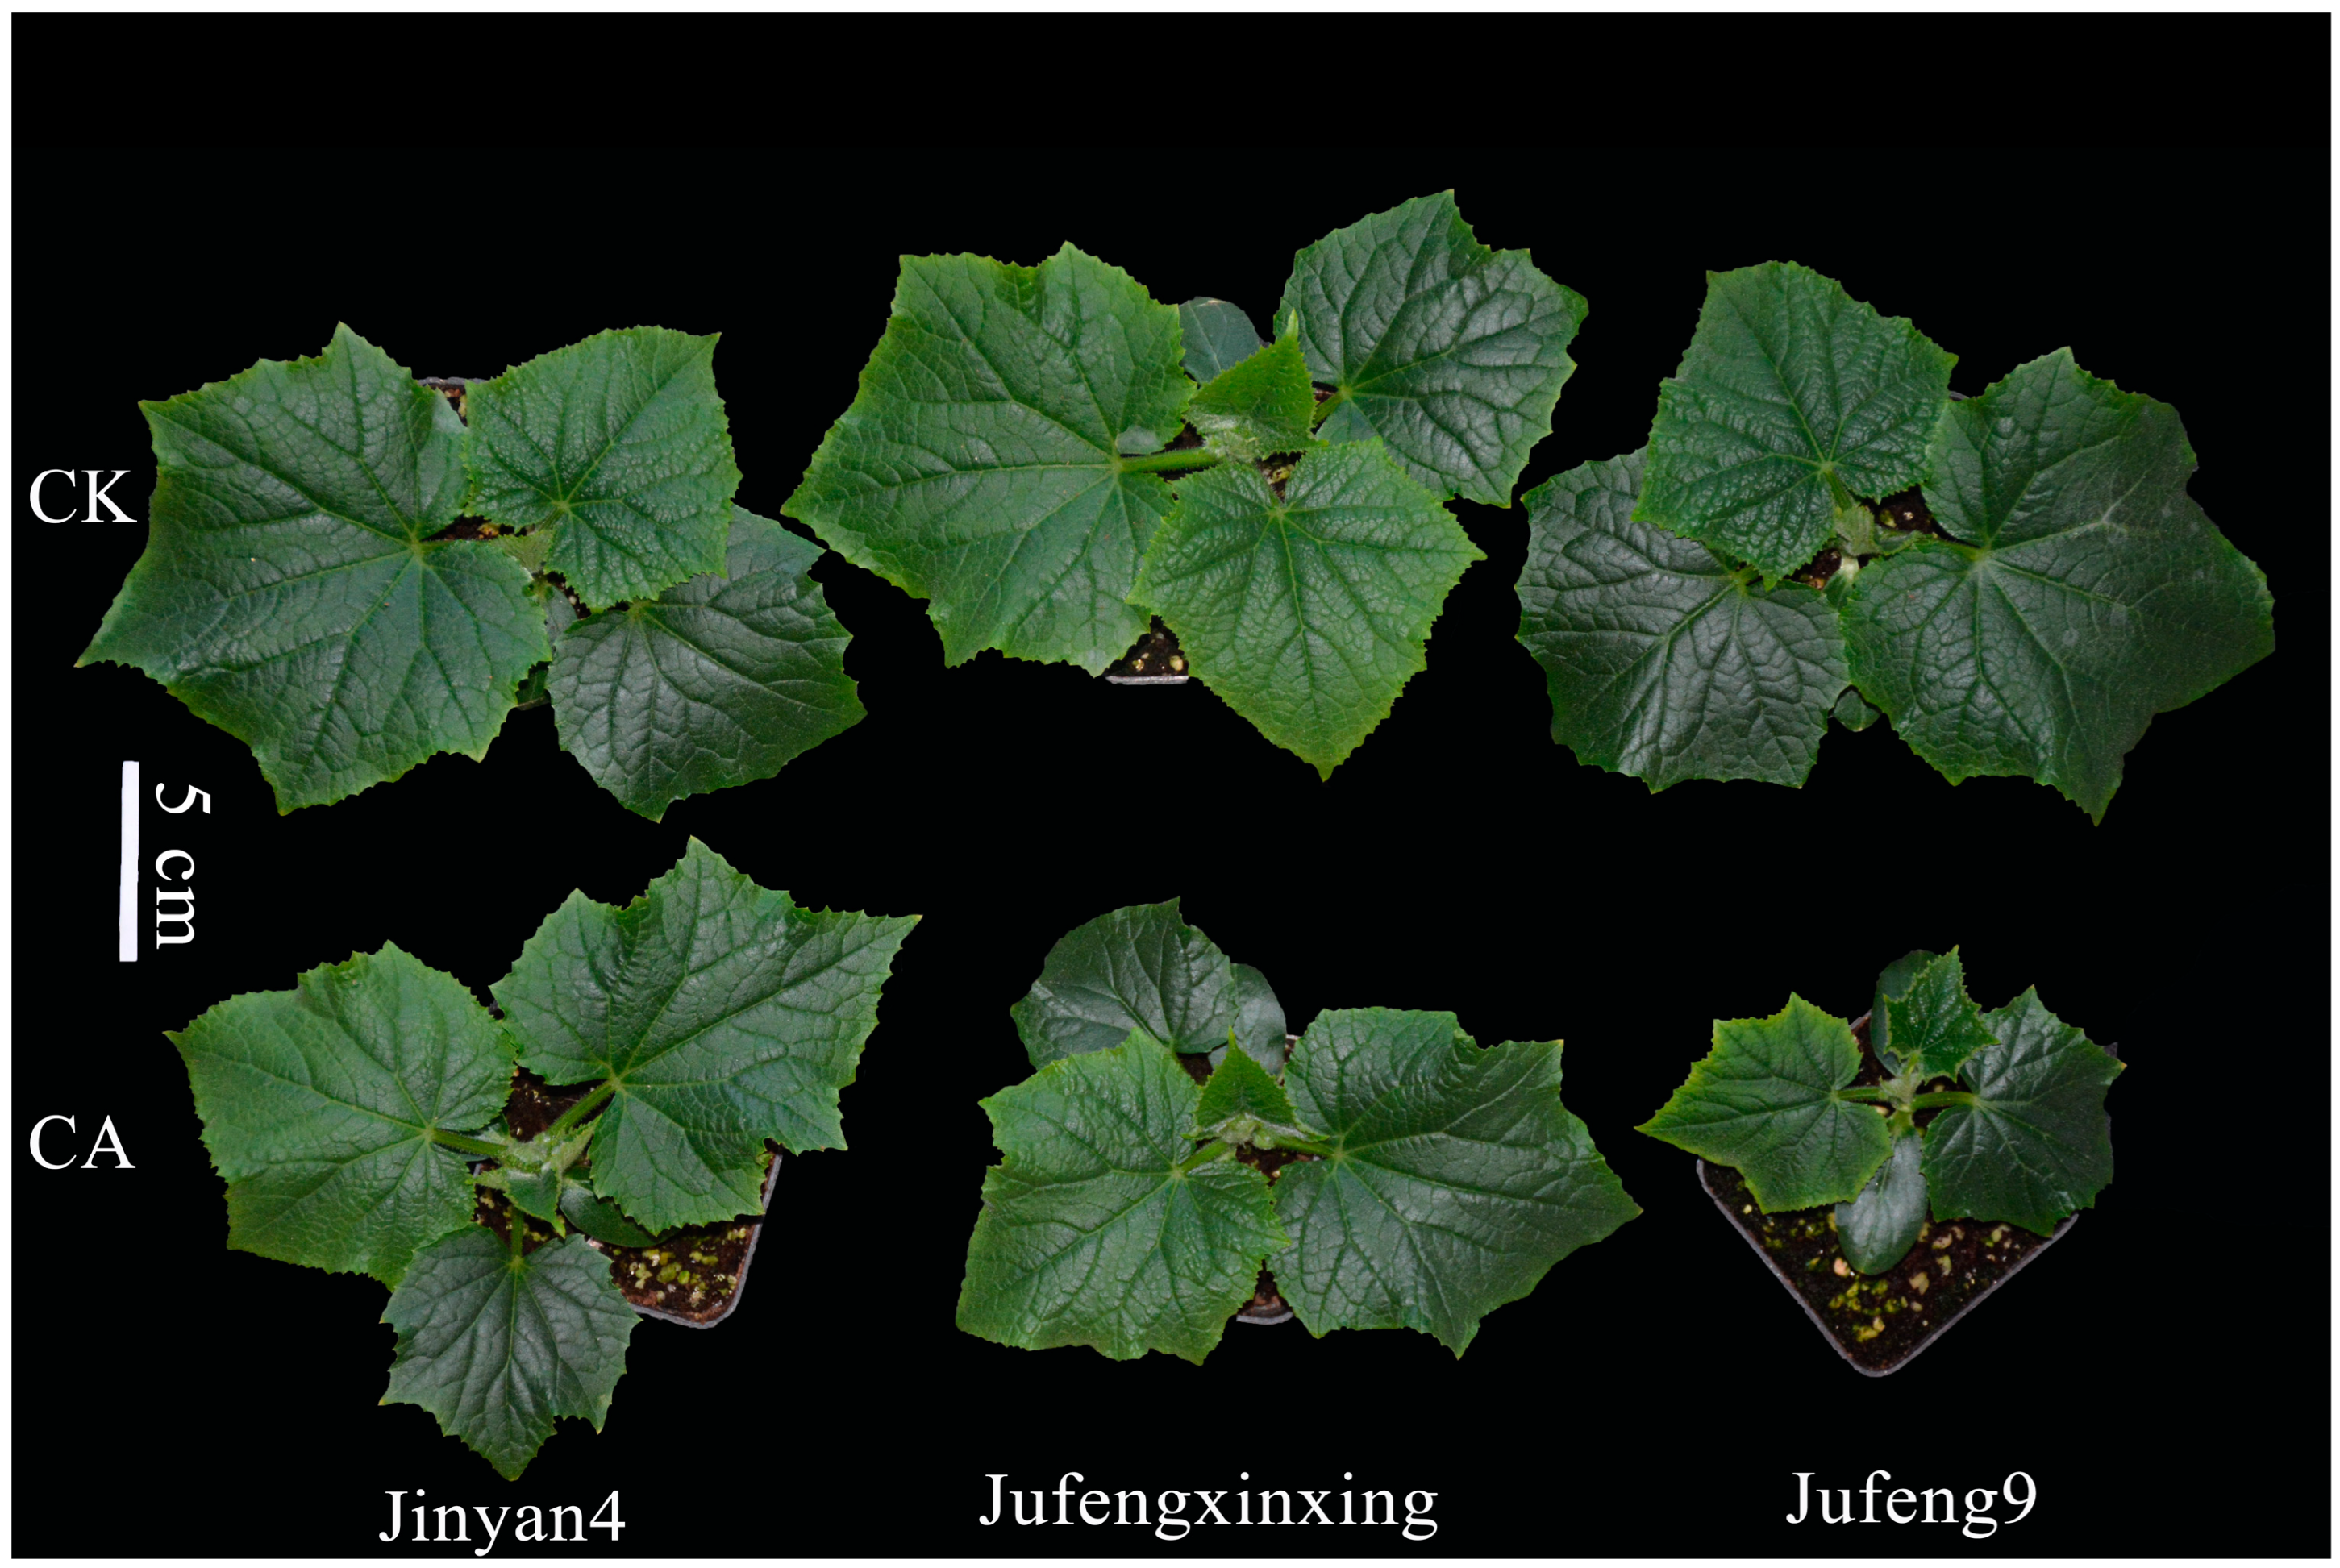
| Cultivars and Treatments | Plant Height (cm) | Stem Diameter (mm) | Leaf Area (cm2) | Root Length (cm) | |
|---|---|---|---|---|---|
| Jinyan4 | CK | 13.87 ± 0.36 a | 5.30 ± 0.24 ab | 22.49 ± 0.59 a | 8.90 ± 0.36 a |
| CA | 13.17 ± 0.36 a | 4.77 ± 0.14 bc | 20.95 ± 0.77 a | 7.93 ± 0.46 ab | |
| Jufengxinxing | CK | 13.97 ± 0.42 a | 5.43 ± 0.36 a | 22.17 ± 0.68 a | 8.70 ± 0.78 a |
| CA | 10.90 ± 0.32 b | 4.23 ± 0.05 cd | 17.00 ± 0.93 b | 6.43 ± 0.14 b | |
| Jufeng9 | CK | 13.63 ± 0.58 a | 5.10 ± 0.18 ab | 22.63 ± 0.99 a | 8.63 ± 1.05 a |
| CA | 8.10 ± 0.45 c | 4.03 ± 0.14 d | 10.07 ± 0.46 c | 4.13 ± 0.74 c | |
Disclaimer/Publisher’s Note: The statements, opinions and data contained in all publications are solely those of the individual author(s) and contributor(s) and not of MDPI and/or the editor(s). MDPI and/or the editor(s) disclaim responsibility for any injury to people or property resulting from any ideas, methods, instructions or products referred to in the content. |
© 2024 by the authors. Licensee MDPI, Basel, Switzerland. This article is an open access article distributed under the terms and conditions of the Creative Commons Attribution (CC BY) license (https://creativecommons.org/licenses/by/4.0/).
Share and Cite
Li, J.; Li, J.; Yang, P.; Fu, H.; Yang, Y.; Liu, C. Screening of Germplasm and Construction of Evaluation System for Autotoxicity Tolerance during Seed Germination in Cucumber. Agronomy 2024, 14, 1081. https://doi.org/10.3390/agronomy14051081
Li J, Li J, Yang P, Fu H, Yang Y, Liu C. Screening of Germplasm and Construction of Evaluation System for Autotoxicity Tolerance during Seed Germination in Cucumber. Agronomy. 2024; 14(5):1081. https://doi.org/10.3390/agronomy14051081
Chicago/Turabian StyleLi, Jie, Jian Li, Ping Yang, Hongbo Fu, Yongchao Yang, and Chaowei Liu. 2024. "Screening of Germplasm and Construction of Evaluation System for Autotoxicity Tolerance during Seed Germination in Cucumber" Agronomy 14, no. 5: 1081. https://doi.org/10.3390/agronomy14051081
APA StyleLi, J., Li, J., Yang, P., Fu, H., Yang, Y., & Liu, C. (2024). Screening of Germplasm and Construction of Evaluation System for Autotoxicity Tolerance during Seed Germination in Cucumber. Agronomy, 14(5), 1081. https://doi.org/10.3390/agronomy14051081