Article

Fertilising Maize with Bio-Based Mineral Fertilisers Gives Similar Growth to Conventional Fertilisers and Does Not Alter Soil Microbiome

by
Marcia Barquero
1,
Cinta Cazador
2,
Noemí Ortiz-Liébana
1,
Maurizio Zotti
3,
Javier Brañas
2 and
Fernando González-Andrés
1,*
1
Chemical, Environmental & Bioprocess Engineering Group, University of León, Institute of Research and Innovation in Engineering (I4), 24008 León, Spain
2
Centro de Tecnologías Agroambientales (CTA) Fertiberia, Edificio CITIUS (Centro de Investigación, Tecnología e Innovación) 1, Avd. Reina Mercedes 4-B, 41012 Sevilla, Spain
3
Department of Agricultural Sciences, University of Naples Federico II, Via Universita 100, 80055 Portici, Italy
*
Author to whom correspondence should be addressed.
Agronomy 2024, 14(5), 916; https://doi.org/10.3390/agronomy14050916
Submission received: 5 March 2024 / Revised: 19 April 2024 / Accepted: 24 April 2024 / Published: 26 April 2024
(This article belongs to the Section Soil and Plant Nutrition)

Abstract

:
The production of mineral fertilisers relies heavily on mineral deposits that are becoming depleted or is based on processes that are highly energy demanding. In this context, and in line with the circular economy and the European Green Deal, the recovery of nitrogen (N), phosphorus (P), and potassium (K) from organic wastes using chemical technologies is an important strategy to produce secondary raw materials for incorporation into mineral fertilisers, partially replacing the traditional sources of N, P, and K. However, there are very few studies on the agronomic and environmental effects of such substitution. The aim of this work was to evaluate plant growth under microcosm conditions and the effect on the soil microbiome of mineral fertilisers in which part of the N, P, or K content comes from bio-based materials (BBMFs), namely ash, struvite, and a patented chemical process. The crop was maize, and a metataxonomic approach was used to assess the effect on the soil microbiome. The BBMF treatments were compared with a control treated with a conventional mineral fertiliser. The conventional fertiliser performed significantly better than the bio-based fertilisers in terms of maize biomass production at the first sampling point 60 days after sowing (DAS), but at the last sampling point, 90 DAS, the BBMFs showed comparable or even better biomass production than the conventional one. This suggests that BBMFs may have a slightly slower nutrient release rate. The use of fertiliser, whether conventional or BBMF, resulted in a significant increase in microbiome biodiversity (Shannon index), while it did not affect species richness. Interestingly, the use of fertilisers modulated the composition of the bacterial community, increasing the abundance of beneficial bacterial taxa considered to be plant-growth-promoting bacteria, without significant differences between the conventional mineral fertilisers and the BBMFs. The predominance of PGPRs in the rhizosphere of crops when BBMFs are used could be part of the reason why BBMFs perform similarly or even better than conventional fertilisers, even if the rate of nutrient release is slower. This hypothesis will be tested in future field trials. Thus, BBMFs are an interesting option to make the food chain more sustainable.

1. Introduction

European Union (EU) waste management policies aim to reduce the environmental and health impacts of waste and improve Europe’s resource efficiency [1]. Turning waste into resources is key to a circular economy; in particular, bio-waste valorisation is an attractive approach that can offer potentially useful alternatives for dealing with residues [2]. Basic valorisation strategies, including composting, reusing, and incineration, are well known and accepted worldwide practices which, however, are able to recover/convert only a fraction of the waste into useful products [3,4]. Advanced valorisation strategies based on chemical technologies are more attractive from the practical, economic, and sustainability points of view, leading to numerous possibilities for the production of goods [5]. Therefore, these advanced strategies, including different extraction approaches for the production of useful bio-based materials, can diversify the generation of multiple products from a single feedstock [6,7].
In response to the rising demand for food from an increasing world population, the farming sector must answer the challenge in a sustainable way, increasing its productivity and the efficient use of quality nutrients provided by fertilisers as well as reducing the carbon footprint of food production [8]. Fertilisers are an integral part of the food supply chain, and their contribution, in combination with good agricultural practices, is a key aspect to make food systems fair, healthy, and environmentally friendly, as intended by the Farm to Fork Strategy, which is at the heart of the European Green Deal [9].
At present, the production of fertilisers relies heavily on fossil mineral resources, the reserves of which are limited and declining: mainly natural gas, phosphate rock, and potassium salts [10]. The European fertiliser industry is also highly dependent on imports of these raw materials, making it very vulnerable to supply and pricing policies outside Europe [11]. Therefore, the implementation of efficient nutrient recycling strategies is a challenge for the fertiliser industry [12], and advanced chemical technologies have been developed to recover nitrogen (N), phosphorus (P), and potassium (K) from bio-waste for use as secondary raw materials in the production of mineral fertilisers. This is considered to be an energy-efficient and environmentally friendly alternative for the valorisation of organic waste [13]; in fact, the EU expects that raw materials from bio-waste origins will replace up to 30% of the non-renewable raw materials currently used for the production of mineral and organic–mineral fertilisers [14], giving rise to so-called bio-based mineral fertilisers, or BBMFs [15]. In line with the EU Fertiliser Regulation and circular economy principles, BBMFs in Europe use locally available waste streams and avoid the use of fossil resources [15]. Although BBMFs offer many advantages, the main knowledge gap is about the availability of N, P, and K from the new fertilisers, as the molecular forms of the N, P, and K from the bio-based sources might be different from those from conventional sources. As a result, the availability of these nutrients can vary depending on factors such as soil type, climate, and specific crop needs [16], requiring specific analysis to evaluate their performance and environmental impact [17]. The most relevant bio-based materials that can be used as ingredients of mineral fertilisers are struvite [18] and biomass ash-based products [19], which are recognised as such in the last European regulation about mineral fertilisers [20]. The Regulation states that the Commission will collect information on the feasibility of using such raw materials for the production of mineral fertilisers. For this reason, struvite and biomass ash have been used in this work as a partial replacement for conventional raw materials.
As there is a lack of information on the effect of mineral BBMFs on plant growth and soil microbiomes, the aim of this work was to evaluate the performance of BBMFs in a microcosm trial with maize with the following objectives: (i) to evaluate the effect of BBMFs on plant growth compared with conventional mineral fertilisers with the same nutrient content but produced from conventional raw materials; (ii) to evaluate the environmental performance of BBMFs by assessing their effects on the soil bacterial community, in terms of biodiversity and composition, compared with conventional fertilisers and an unfertilised control.

2. Materials and Methods

2.1. Description of the Bio-Based Fertilisers

To reduce the dependence on mineral fertilisers from non-renewable sources of raw materials, in this work, four BBMFs were designed in which a varying percentage of the conventional and non-renewable raw materials (Table 1) were replaced with a renewable source obtained from bio-based materials. The total N-P2O5-K2O content, in percentage w:w, was 8-15-15 for all the products. In the control, the raw materials were the conventional ones (see Supplementary Materials Table S1 for detailed information), whilst in the fertilisers named PKA, PA, PD, and ST, respectively, the percentages of N-P2O5-K2O indicated in Table 1 came from the renewable source indicated (for a complete description of the raw materials of all the products, see Supplementary Materials Table S1).

2.2. Microcosm Assay Design

The microcosm assay under greenhouse conditions was carried out to analyse and compare the performance of new BBMFs and conventional fertilisers (CF).
The BBMFs were tested in maize (Zea mays L.) plants, cultivar Antalya, grown in 4 L pots filled with 3100 g of substratum. The statistical design was a completely randomised design (CRD) with six treatments, including controls: non-fertilised (C−), control with conventional fertilisation (C+), and four treatments with the new BBMFs: PKA, PA, PD, and ST. There was a total of 18 pots per treatment and 2 plants per pot. The substratum was a mixed soil-vermiculate at a ratio of 3:1 (volume:volume). The soil was a basic (pH 7.93), sandy loam texture (sand 58%, silt 22%, clay 20%), 1.87% organic matter, total N content of 0.13%, P Olsen 13.51 ppm, Ca+ 20.69 cmol·kg−1, Mg+ 0.80 cmol·kg−1, K+ 1.27 cmol·kg−1, and a CEC (total cation exchange capacity) of 12.4 cmol·kg−1 (see Supplementary Materials Table S2 for detailed information). Except for the unfertilised control, each pot received exactly the same quantity of N (0.96 g), P2O5, and K2O (1.80 g of each); the amount of each fertiliser varied according to its actual content of each nutrient, as indicated in Table 1. Four days later, maize seeds were sown in the pots. The plants were watered as needed to keep the soil at 80% field capacity ±10%.

2.3. Sampling and Plant and Soil Chemical Analysis

A first destructive sampling was carried out 60 days after sowing (DAS) (6 samples), followed by a final sampling at the end of the experiment, at 90 DAS (12 samples). Fresh and dry (oven-dried at 60 °C to a constant weight) aerial biomass was determined. Three samples per treatment were taken for plant nutrient analysis as well as for soil chemical analysis. Soil samples were taken at 20 cm depth with a plastic column.
For plant nutrient analysis, dry samples were crushed with a blade mill. Total nitrogen (N) was determined using the Dumas method, and total phosphorus (P) and potassium (K) using an inductively coupled plasma-optical emission spectrometer (ICP-OES).
For chemical soil analysis, NH4+-N, NO3−-N, and available P and K content were determined. NH4+-N and NO3−-N were analysed immediately after sampling to avoid environmental exposure of the sample and potential alteration of the analytical results. The amount of NH4+-N in soil was measured with the selective electrode method [21], and the NO3−-N was measured with the UV spectrometry method [22]. For the remaining analyses, the soil was air-dried at room temperature and sieved through a 2 mm screen. The available P content was determined with the Olsen method, and the K (cation) was extracted with AcONH4 1 N pH 7; concentration values were determined using ICP-OES.

2.4. Metataxonomic Analysis

In order to determine the impact of the new BBMFs in the rhizosphere microbiome, analysis of the bacterial community using a metataxonomic approach was carried out. For each treatment, five replicates were collected, each one comprising rhizosphere roots of two plants. Samples were taken at the end of the experiment, 90 DAS. To avoid cross-contamination between one sample and the next, the tools used for sampling were cleaned and disinfected with alcohol at 70%. Rhizospheric soil in contact with the roots was collected using previously sterilised brushes to avoid cross-contamination, sieved (2 mm), homogenised, and stored at −80 °C for subsequent DNA extraction. Total microbial DNA extraction was performed with the DNeasy Power Soil kit (Qiagen, Hilden, Germany) following the manufacturer’s instructions. The 16S rDNA gene amplicons were amplified following the 16S rDNA gene Metagenomic Sequencing Library Preparation Illumina protocol. The gene-specific sequences used in this protocol target the 16S rDNA gene V3 and V4 region. Illumina adapter overhang nucleotide sequences were added to the gene-specific sequences. The primers were selected from Klindworth et al. [23]. The full-length primer sequences to follow the protocol targeting this region were 16S rDNA gene Amplicon PCR Forward Primer (5′-TCGTCGGCAGCGTCAGATGTGTATAAGAGACAGCCTACGGGNGGCWGCAG-3′) and 16S rDNA gene Amplicon PCR Reverse Primer (5′-GTCTCGTGGGCTCGGAGATGTGTATAAGAGACAGGACTACHVGGGTATCTAATCC-3′).
Microbial genomic DNA (5 ng/μL in 10 mM Tris, pH 8.5) was used to initiate the protocol. After 16S rDNA gene amplification, the multiplexing step was performed using Nextera XT Index Kit (FC-131-1096). An amount of 1 μL of the PCR product was run on a Bioanalyzer DNA 1000 chip to verify the size; the expected size on a Bioanalyzer trace is ~550 bp. After size verification, the libraries were sequenced using a 2 × 300 pb paired-end run (MiSeq Reagent kit v3 (MS-102-3001)) on a MiSeq Sequencer according to the manufacturer’s instructions (Illumina). Quality assessment was performed using the Prinseq-lite program [24]. R1 and R2 from the Illumina sequencing were joined using flash from the suite [25]. Taxonomic affiliations were assigned using the RDP_classifier [26].

2.5. Data Analysis

Analysis of variance (ANOVA) was performed using the treatments as fixed factors. The effects of the treatments on aerial biomass, plant nutrient content, and soil nutrient content were analysed, and Tukey’s test was used for the mean, using IBM-SPSS v.26.0 (IBM Corporation, Armonk, NY, USA).
Primer v7 and PERMANOVA+ software was used to analyse the bacterial community structure [27]. Diversity metrics, identified as the species richness and the Shannon diversity index of the soil microbial communities, were determined, and boxplots were used to visualise the distribution of diversity indices. The significance of effect sizes was tested by pairwise comparison of results from the permutation analysis of variance (PERMANOVA; 9999 permutations) using the treatments as a fixed factor.
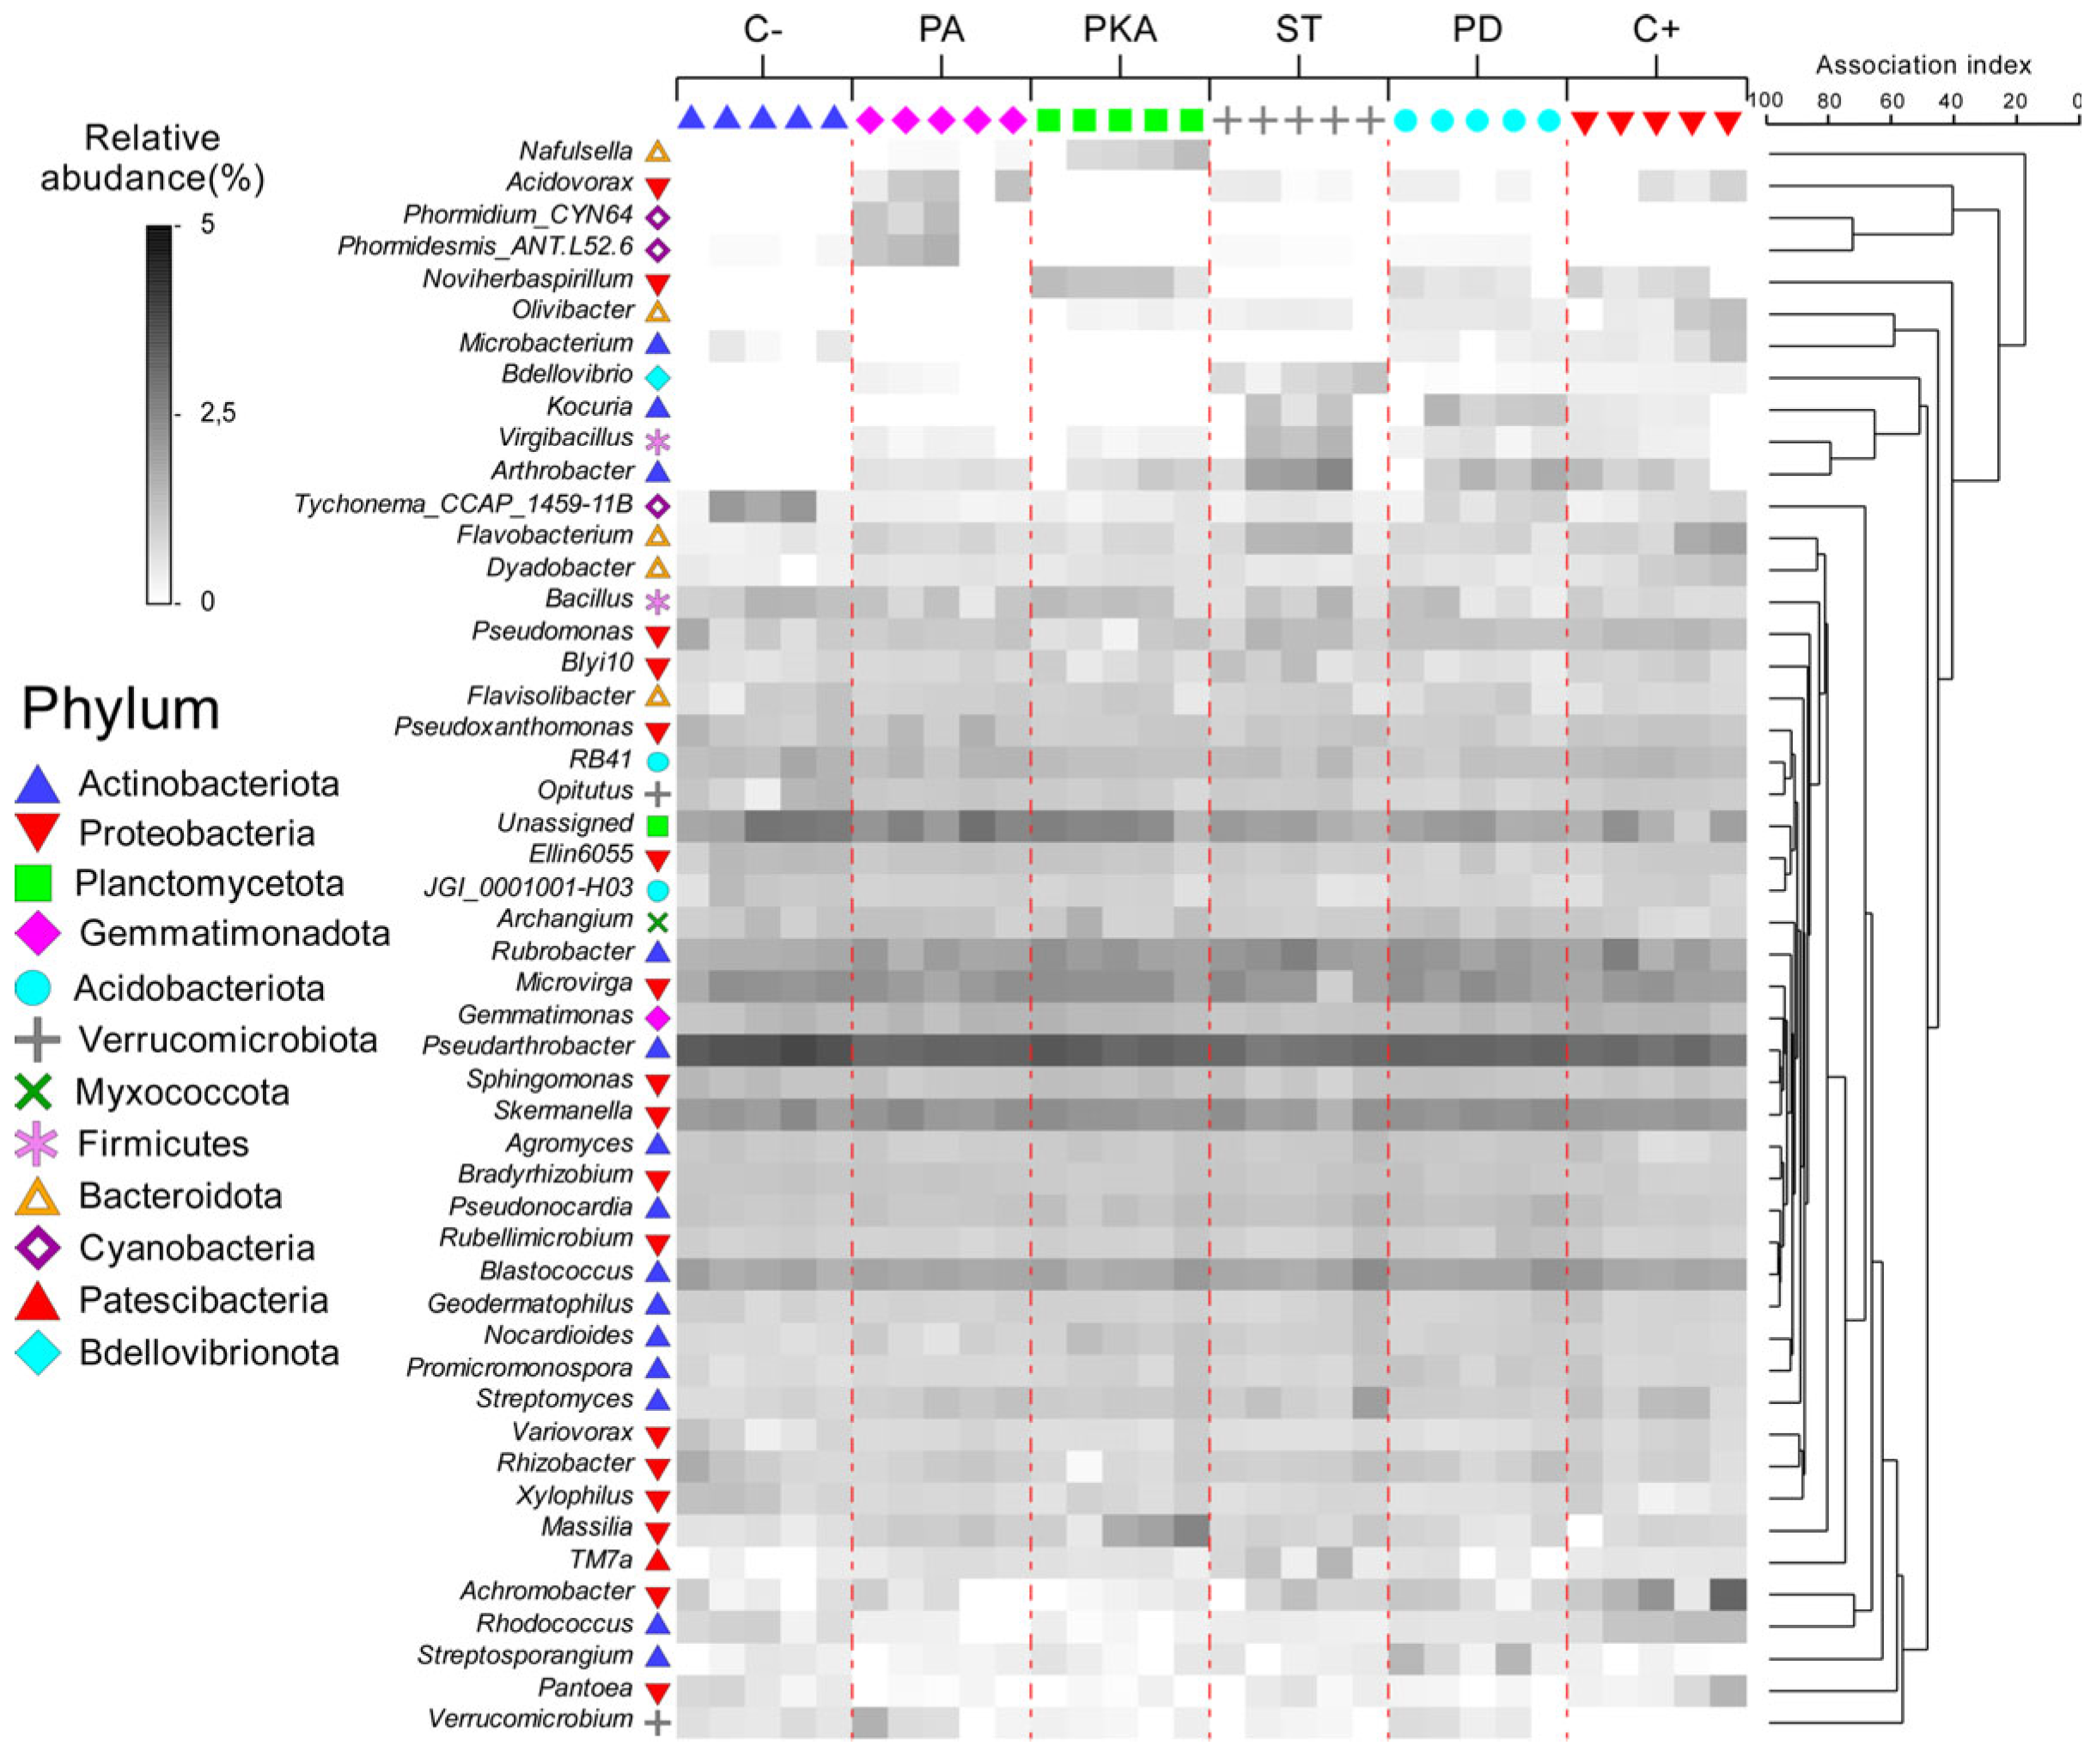
Stacked bar charts were used to represent the relative abundances of microbial taxa at the phylum level, while heatplots at the amplicon sequence variant (ASV) level were used to show the detailed organisation of the bacterial communities. Heatplots were used for clustering the bacterial community in the treatments according to Bray–Curtis dissimilarity and for assembling the 50 most frequent genera according to hierarchical clustering based on the index of association.
The variation in the composition of the bacterial communities after the application of the different treatments was evaluated using non-metric multidimensional scaling (nMDS) calculated on the basis of the Bray–Curtis similarity from Hellinger transformed data (square root of relative abundance).
The significance of the pairwise comparisons between the responses to the treatment within each treatment for the bacterial community was verified with PERMANOVA for 9999 permutations; dissimilarity was performed using Bray–Curtis with treatment considered as the fixed factor. A permutational test of multivariate dispersion (PERMDISP) was conducted prior to the PERMANOVA, based on the distance of samples in relation to the group average, to determine any deviation in dispersion in the similarities.
A canonical analysis of principal coordinates (CAP) was used to model changes in the community among the different treatments. The analysis was based on Bray–Curtis dissimilarities calculated from square root transformed abundances. Segmented bubble plots, showing segments whose sizes were directly proportional to the average taxa relative abundance across the treatments, were overlaid on the CAP ordination. Selection of taxa at the genus level was based on similarity percentage (SIMPER) analysis and heatmap results.
Once PERMANOVA was performed and differences between groups (treatments) were determined, the datasets were also tested for group similarity and dissimilarity by applying the SIMPER function at ASVs level with a cut-off for the lowest contribution of 30% within the community. SIMPER identified which taxa distinguished the components of such groups.
To investigate the relationship between bacterial clusters and plant data, an interaction network was constructed. In detail, a contingency matrix based on Pearson r coefficients was calculated on the 50 most frequent bacterial taxa obtained in the previous heatplot analysis with fresh and dry biomass and content of N, P, and K. According to the correlation obtained in the contingency matrix, bacterial taxa were clustered using the complete linkage algorithm, and clusters were defined using the similarity profile routine (Simprof) test (999 permutations) for level p < 0.05. To simplify the network, single correlations of mean values for bacterial taxa within each cluster were calculated for each of the plant biometric variables. Networks were generated by hand. The Simprof test and contingency matrices were generated using Primer-7 software.

3. Results

3.1. Plant Growth Parameters

The outcomes from the microcosm assays (Figure 1) reveal a distinctly positive impact of the fertiliser products across all treatments, including both conventional fertiliser (C+) and BBMFs, on the aerial biomass production of maize plants. Both fresh and dry weights at 60 and 90 DAS showed a biomass increase as a result of fertilisation compared with the non-fertilised control (C−), underlining the efficacy of the fertilisation (Figure 1A–D). However, at 60 DAS, only the BBMF PKA and the conventional fertiliser (C+) showed significant differences compared with the C− (Figure 1A,B), whilst at 90 DAS, all the BBMFs and the C+ produced significant differences from the C− (Figure 1C,D). Therefore, this suggests that the conventional fertiliser exhibits a higher rate of nutrient delivery compared with the BBMFs. Additionally, it is important to note that by the end of the experiment (90 DAS), the fresh and dry weights of the plants in the PA (ash bio-based source) treatment and the dry weight of the PD (DMPhos bio-based source) treatment surpassed those of the C+, although the differences were not statistically significant (Figure 1C,D).

3.2. Plant and Soil Nutrient Content

3.2.1. Plant Nutrient Content

At 60 DAS, the N content was statistically higher in the C+, PKA, and PA treatments compared with C−, while at 90 DAS, this difference was also significant for the PD treatment. However, it is noteworthy that in both periods, 60 and 90 DAS, no statistically significant differences were observed between the fertilised treatments (Table 2).
In the case of P, at 60 DAS, only the BBMF treatments showed significantly higher levels than C−, while at 90 DAS, all the fertilised treatments (C+ and BBMFs) were statistically different from C−. There were no statistically significant differences in K content between the treatments at 60 DAS. At 90 DAS, only the C+ showed a significant difference compared with C−, although none of the BBMFs showed statistically significant differences with C+. It is important to note that at 60 DAS, the highest values of both P and K were observed in the ST treatment. However, at 90 DAS, the highest values were found in the C+.

3.2.2. Soil Nutrient Content

The results detailing NO3-N, NH4+-N, and available P and K content in the soil are presented in Table 3. A decline in nutrient content is evident in the second period due to plant absorption. In general terms, the content was higher in the fertilised treatments.
The differences between the treatments and controls in soil NH4+-N content were not statistically significant. Nevertheless, at 60 DAS, the soil ammonium content was higher in the fertilised treatments, but at 90 DAS, the differences were negligible, with the highest content observed in the PKA and PA treatments. On the other hand, soil nitrate was significantly higher in the fertilised treatments than in C− in both periods, although no significant differences were observed between the fertilised treatments.
Concerning available P in the soil, in general terms, there were no statistically significant differences between the fertilised treatments. At 60 DAS, only the PA and PD treatments showed significantly higher levels than C−, but at 90 DAS, all fertilised treatments were statistically different from C−. In the case of K dynamics, although there were no statistically significant differences in K content between the treatments in either of the periods (60 and 90 DAS), it is essential to note that K content in fertilised treatments was consistently higher compared with the C−.

3.3. Metataxonomic Analysis

Effect of Fertiliser Application on Soil Bacterial Diversity

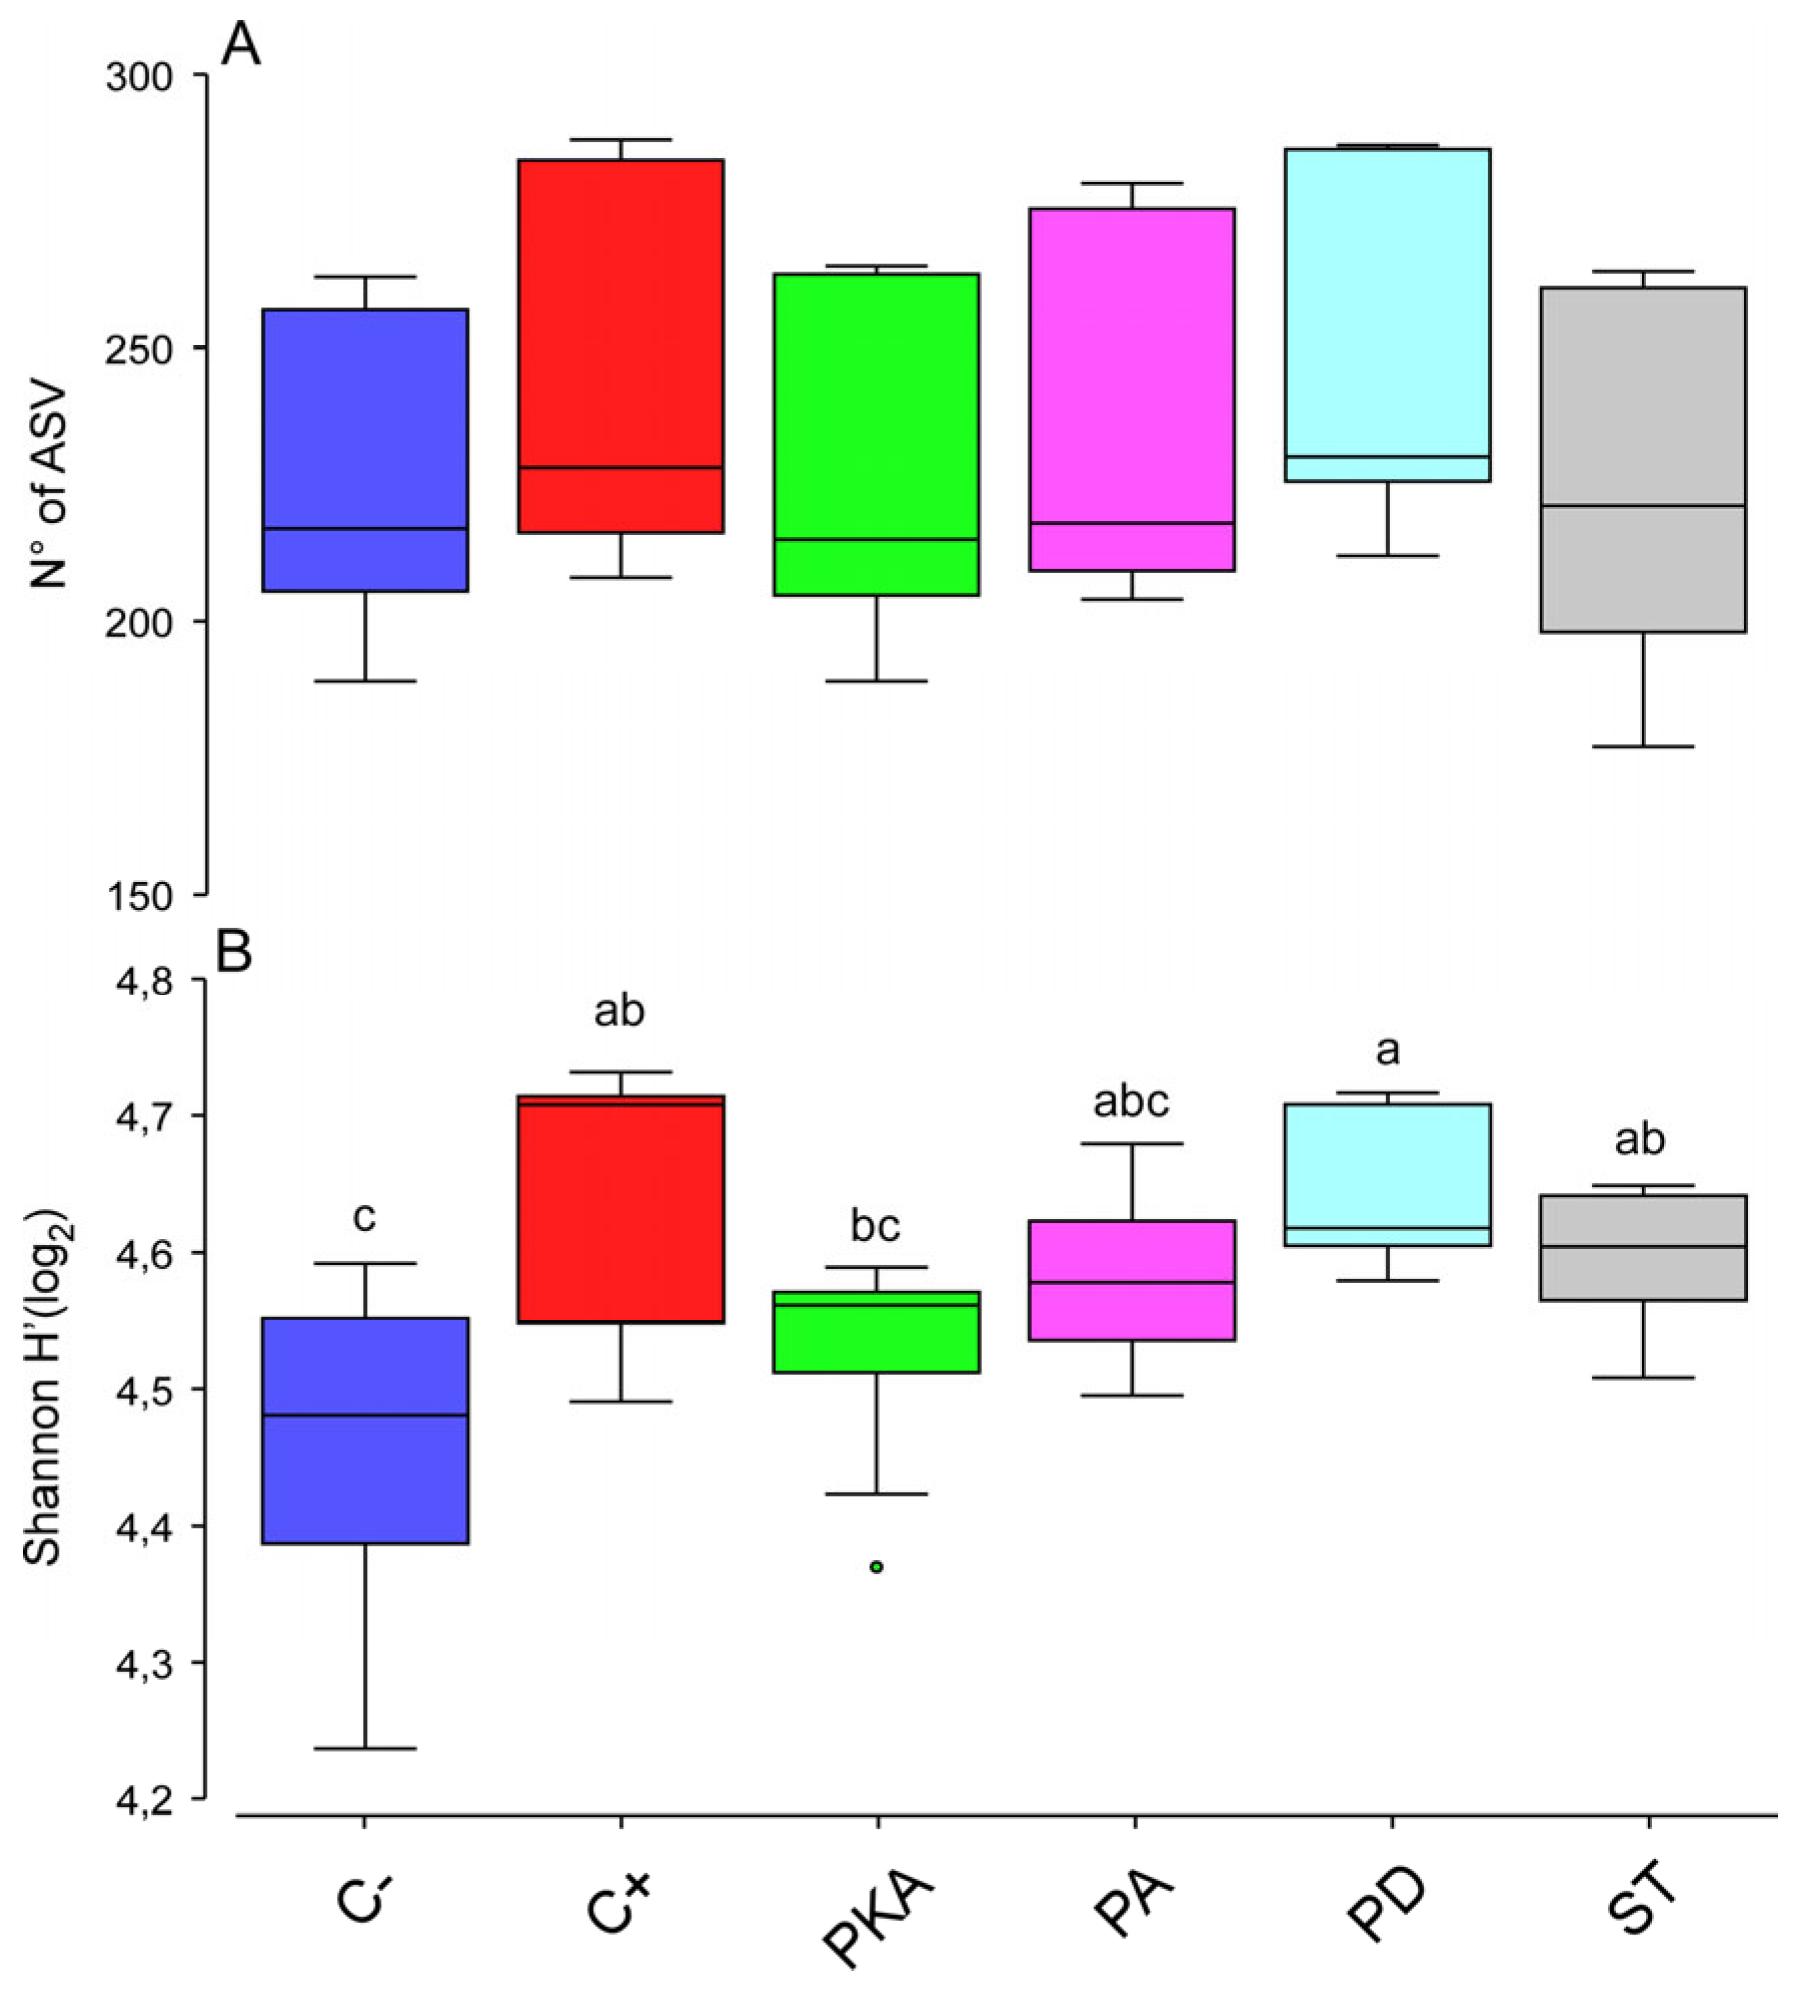
The effect of the treatments on the internal biodiversity of the bacterial populations (alpha diversity) was evaluated using two indices, species richness (S) and Shannon’s index (H′) (Figure 2 and Table 4). The PERMANOVA showed that the value of S was not modified by the treatments, while the index of diversity H’ was significantly affected by them (Table 4). Specifically, H′ increased in all fertilised treatments compared with C− except for PKA (Figure 2), although such an increase was statistically significant (p < 0.05) only for C+, ST, and PD (Table 4 and Figure 2).
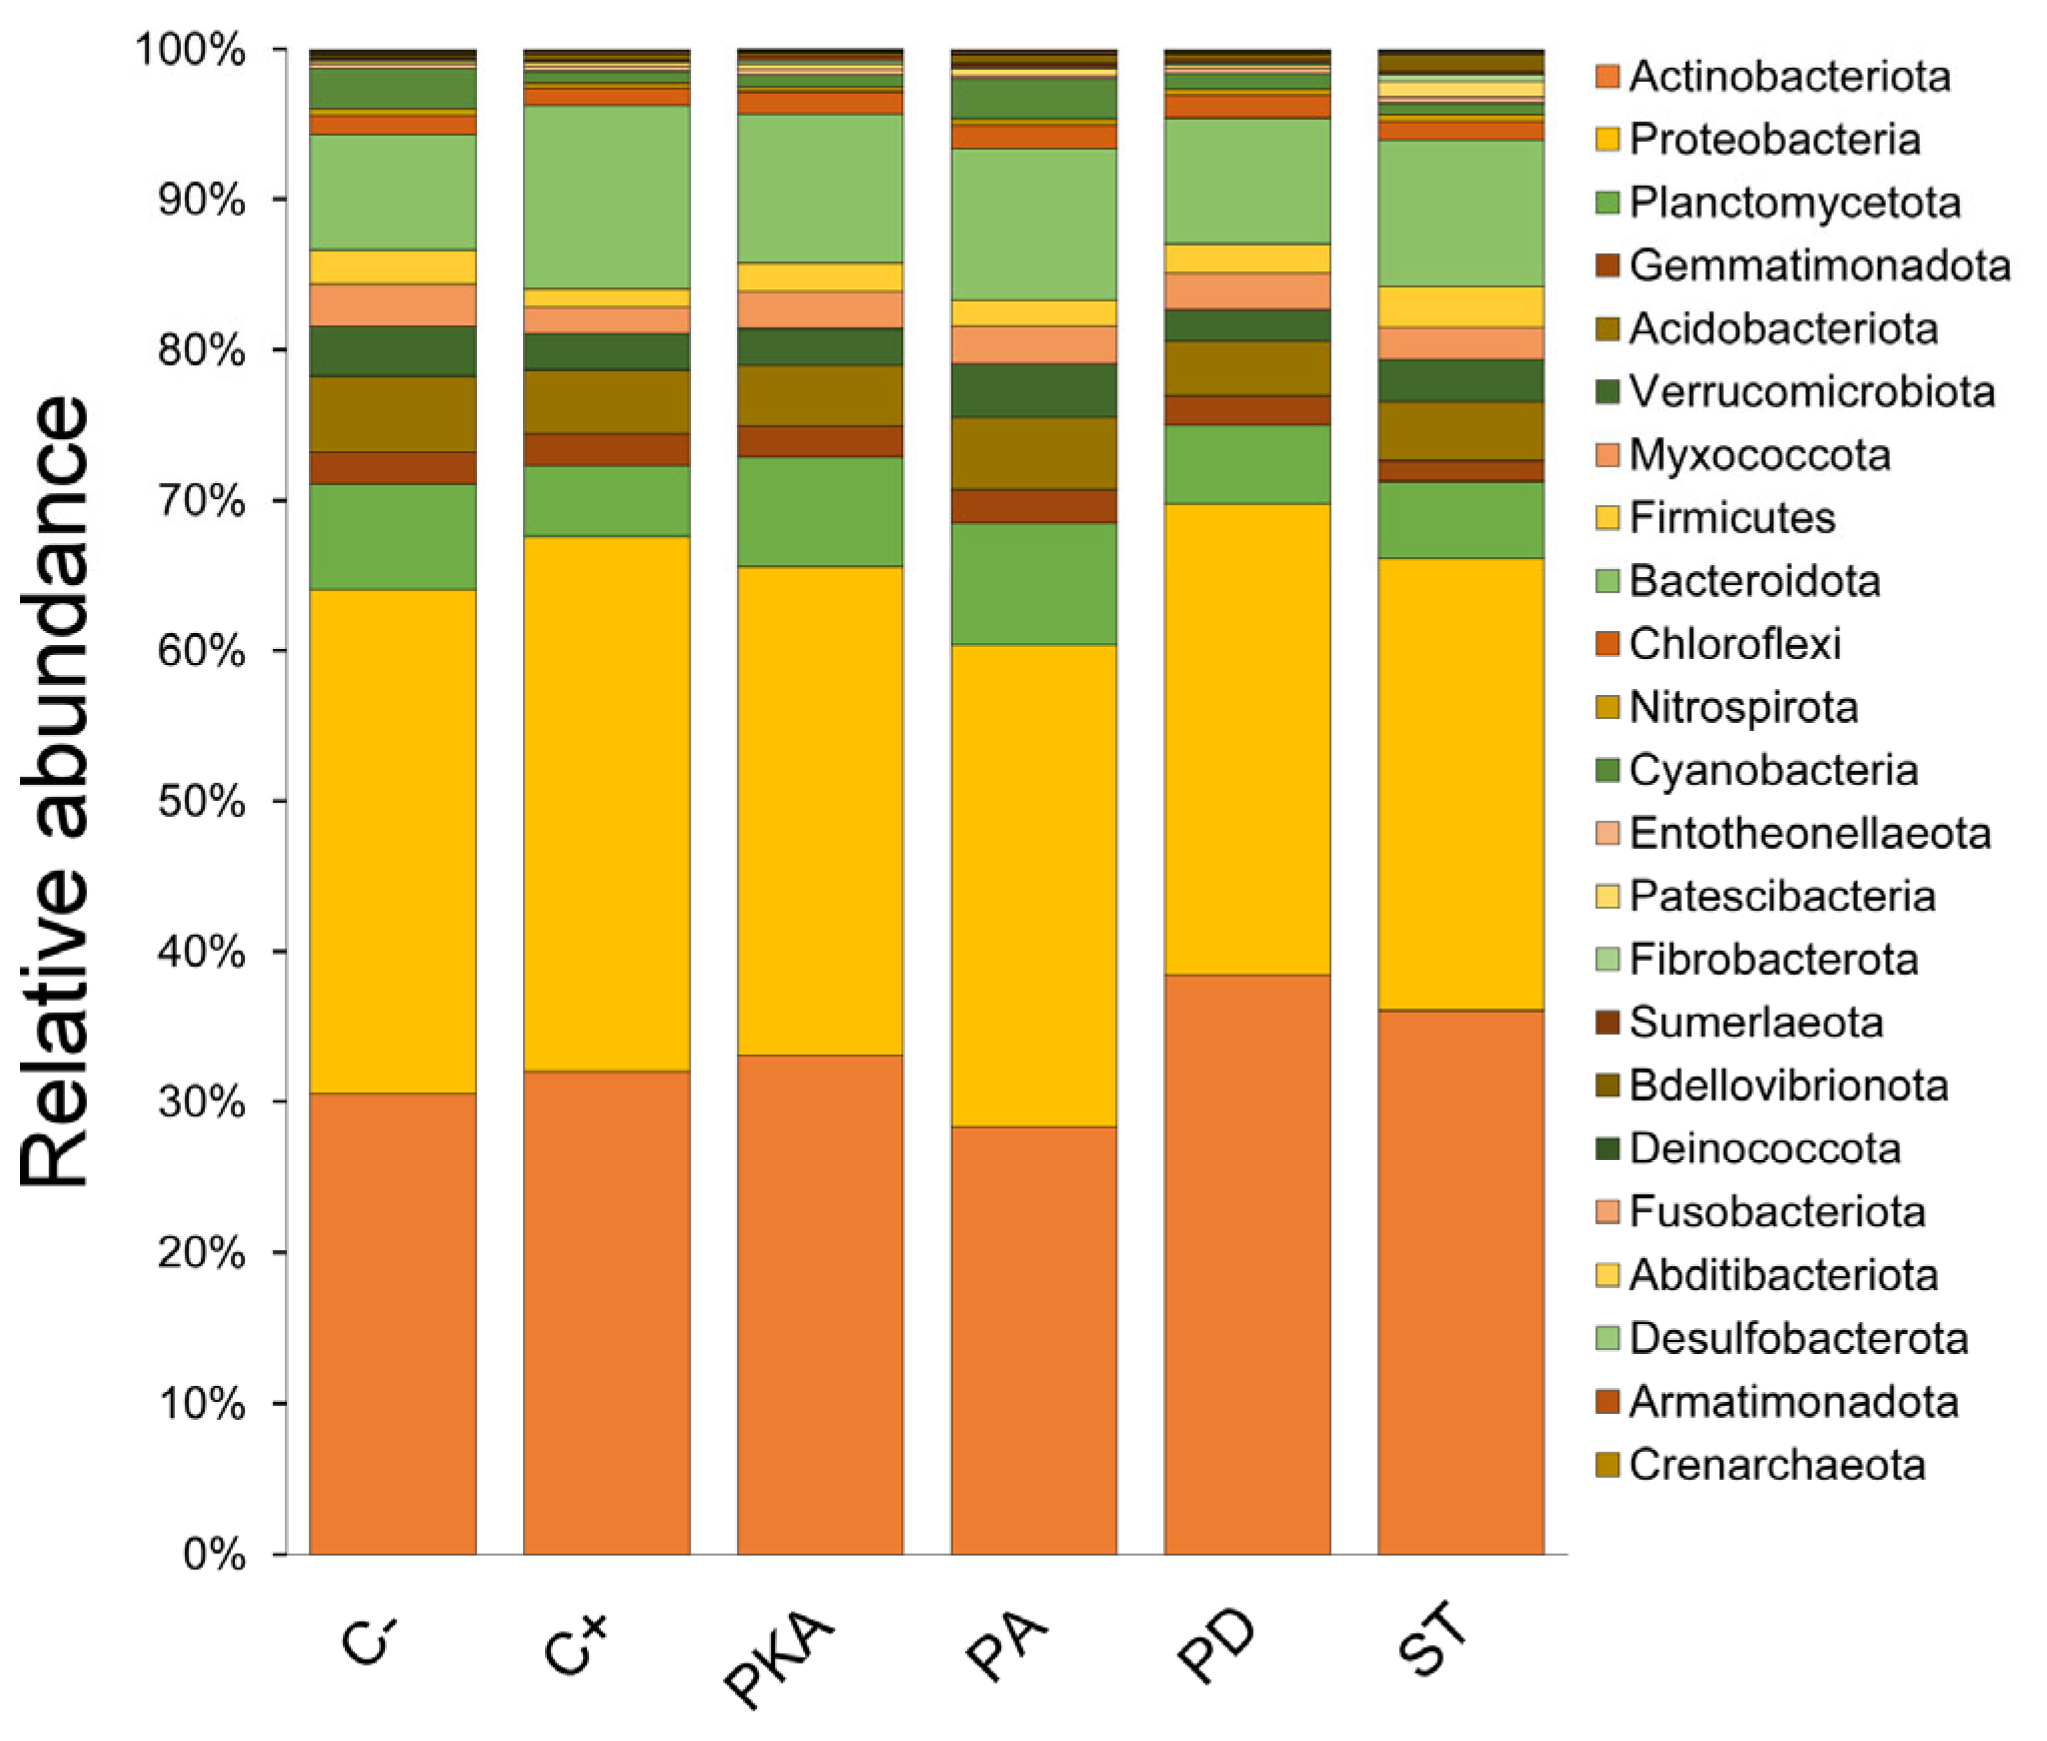
Subtle variations were noted in the bacterial community structure at the phylum level among the different treatments. In total, 23 phyla were found, with 11 being the most abundant, as shown in Figure 3. The dominant phyla were Actinobacteriota and Proteobacteria, exhibiting minimal variations across the different treatments, including Actinobacteriota, Planctomycetota, Gemmatimonadota, and Bacteroidota. The most notable phyla variation between treatments was observed among the less abundant phyla, including Cyanobacteria, Fusobacterota, Abditibacteriota, and others (Figure 3).
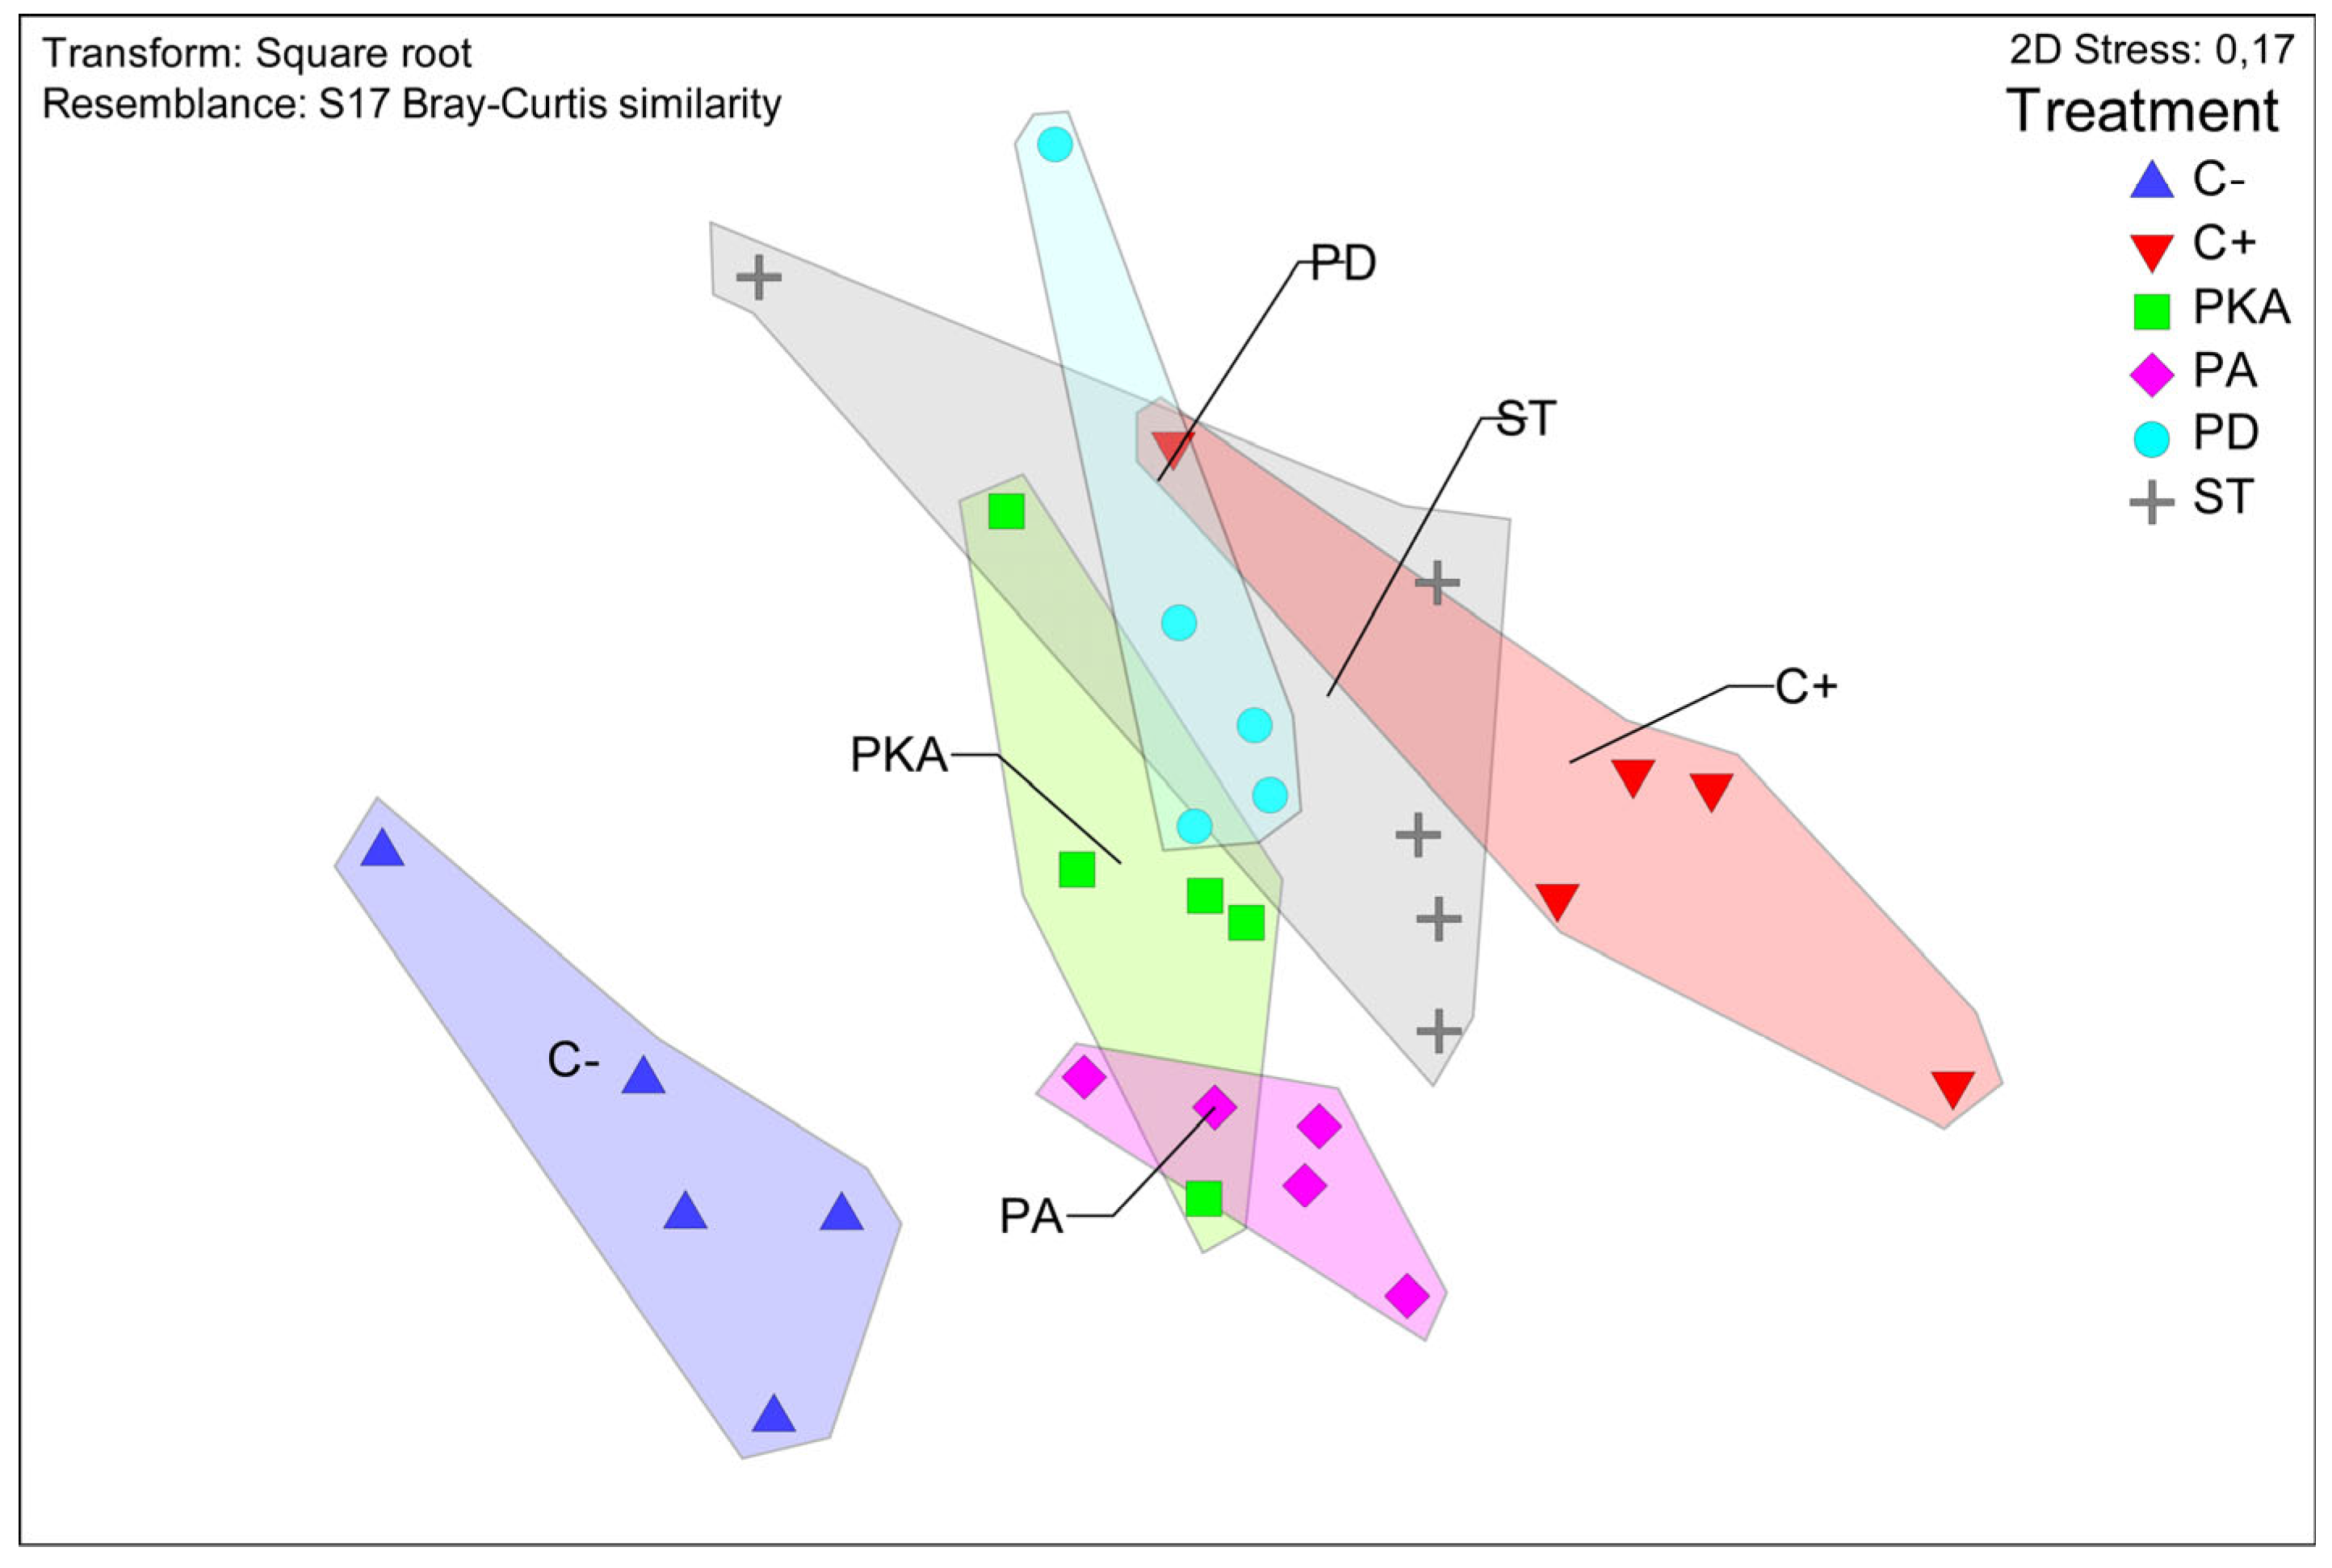
The treatments exerted an influence on the bacterial community structure; the PERMDISP test showed that multivariate dispersion was not significant within the treatments (F = 0.3868, p > 0.9608), and PERMANOVA evidenced significant differences between treatments (p < 0.0001; Table 5). This divergence is prominently evident in the formation of two distinct groups: one comprising the C− treatment, and the other comprising all fertilised treatments. This partition is visually discernible in the nMDS plot (Figure 4) and is further accentuated in the CAP plot (Figure 5).
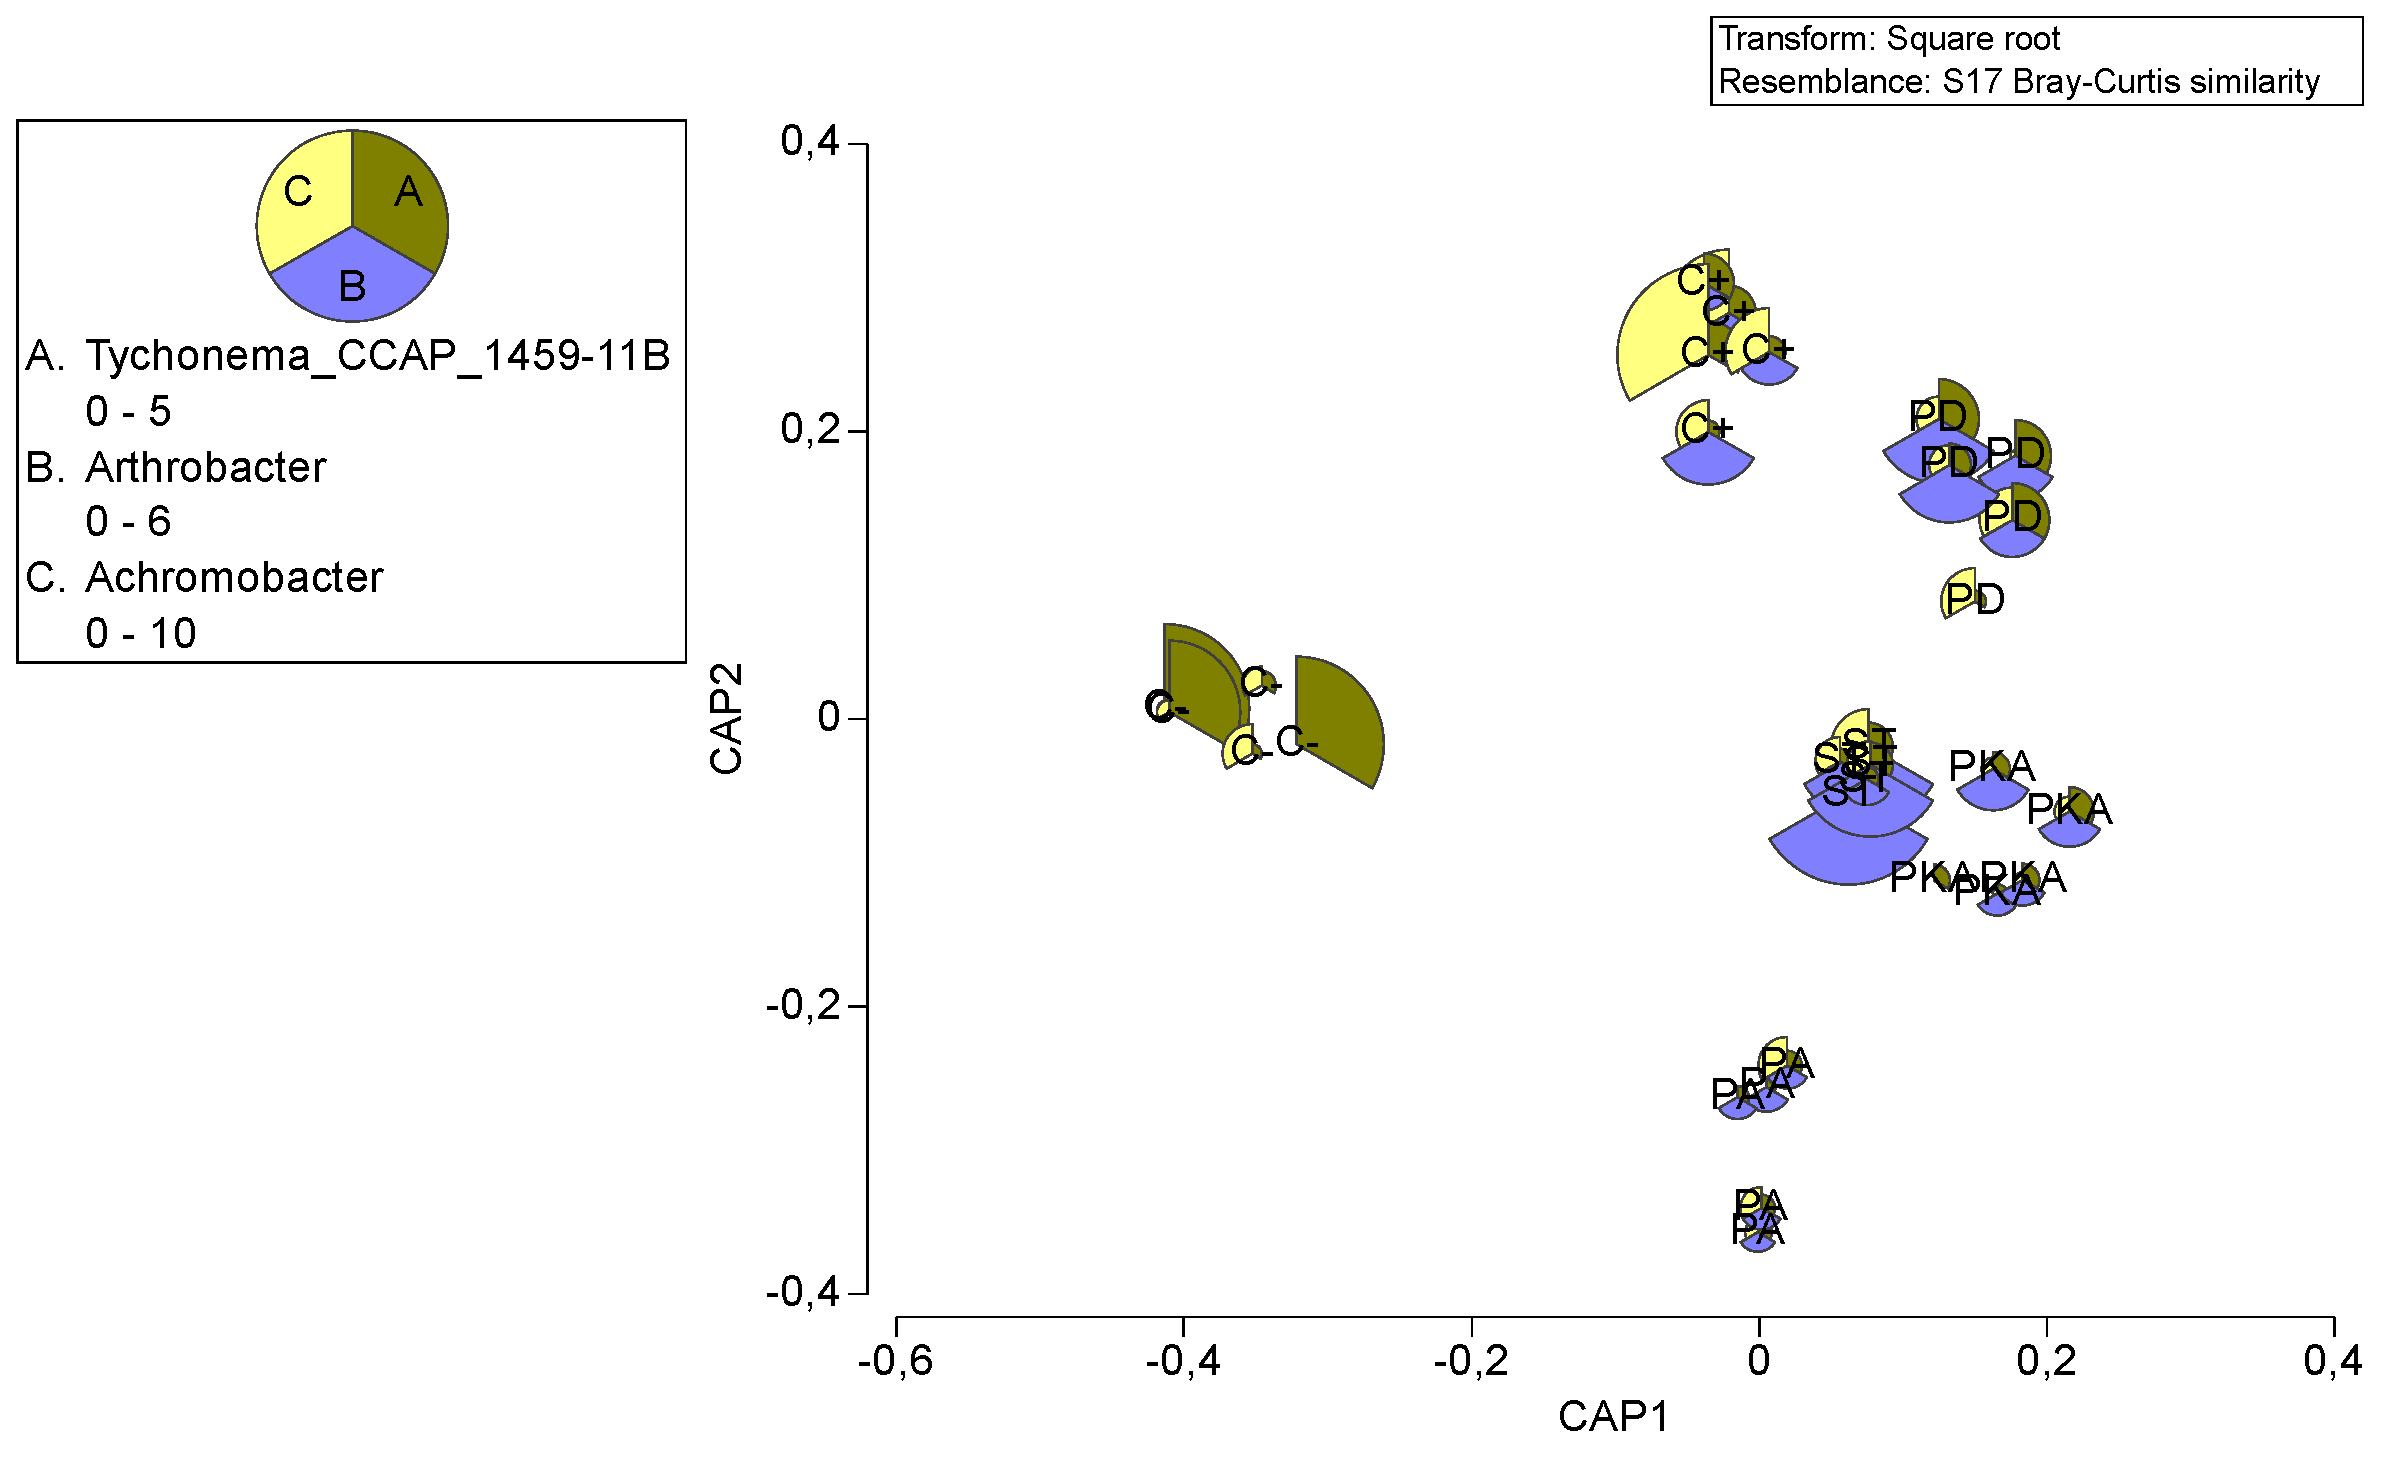
Variations in grouping were attributed to multiple taxa, as explained by both the SIMPER analysis (Table 5) and the heatplot (Figure 6). According to SIMPER, the average dissimilarity percentage ranged from 27.7% (C−/C+) to 20.98% (PKA/PD) (Table 5). The most substantial dissimilarities were observed between the C− and the fertilised treatments, as can be observed in both nMDS and CAP analyses. The bubble plots constructed over CAP illustrate the key genera (Tychonema, Arthrobacter, and Achromobacter) that predominantly contribute to these distinctions (Figure 5). Tychonema had a high presence in C−, but experienced a reduction or disappearance in the fertilised treatments. In contrast, Arthrobacter was absent in C− but consistently present in all fertilised treatments. As for Achromobacter, it showed a minor presence in C− but a higher prevalence in C+; in the remaining BBMFs treatments, its presence resembled that in C−, with the lowest abundance observed in the PKA treatment.
Likewise, Pseudoarthrobacter, Skermanella, Blatococcus, and the Unassigned group presented the highest and constant abundance in all treatments. Other groups presenting constant relative abundance across all the treatments were Flavobacterium, Agromyces, Streptomyces, Bradyrhizobium, Pseudoarthrobacter, Bacillus, and Pseudomonas, among others (Figure 6). In Figure 6 can also be found other genera exclusively present in one or more treatments: such is the case of Nafulsella, present only in PKA treatment; Acidovorax, Phormidium, and Phormidermis in PA treatment; Noviherbaspirillum in PKA, PD, and C+; Olivibacter in PKA, PD, and C+; Bdellovibrio in ST and C+ and in lower abundance in PD; or Kocuria in ST, PD, and C+.
The correlation between the bacterial clusters and the plant biometrics was estimated using the Pearson r coefficient. Obtained clusters differently correlated with the plant biometric parameters (Figure 7); i.e., cluster A correlated negatively with these parameters, while clusters B and E correlated positively. On the other hand, clusters C and D did not correlate with any of the analysed plant characteristics (Figure 7).

4. Discussion

The introduction of BBFs in the EU market faces several challenges. Firstly, policies on their use are still under development [28]; secondly, there are economic concerns due to the influence of individual and social factors on farmers’ intentions to use BBFs [29]. In the third place, there is a lack of comprehensive studies on the impact of BBFs on crop yield and soil quality and health, which adds another layer of complexity to the effective implementation of BBFs in agricultural practices [30]. To date, the majority of previous studies evaluating the fertilising capacity of BBFs in crops have focused predominantly on basic bio-waste valorisation products, such as the application of digestate [31], compost [32], and byproducts resultant from incineration, such as ashes [33]. In contrast, there is a noticeable lack of research focusing on advanced valorisation products [15], which include nutrient recovery for use either as a separate fertiliser or as an integral part of a conventional fertiliser. It is also notable that most of the existing studies have focused on the recovery process itself rather than assessing its effectiveness in improving crop performance [34,35].
In this sense, our study is a pioneer in the evaluation of the effect of mineral BBFs (BBMFs) on plant growth and their environmental impact, i.e., mineral fertilisers that include in their composition nutrients recovered from organic wastes, with a special focus on phosphorus (P) extracted with advanced chemical processes. The results obtained suggest that BBMFs may have a slightly slower nutrient release rate in the early stages of plant growth compared with conventional fertilisers, while maintaining the same rate of nutrient assimilation as the crop progresses. To prove this, at the last sampling, the plants fertilised with BBMFs had the same levels of N, P, and K in their biomass as the control fertilised with a conventional mineral fertiliser (C+). In addition, there was no depletion of soil nutrients, and thus, it appears that BBMFs act as a slow-release fertiliser, modulating nutrient release so that in the early stages, when crop demand is lower, the nutrient release is lower, and as the crop demand increases, nutrient availability increases, which could reduce the risk of nutrient leaching when crop demand is lower. In this regard, the application of slow-release fertilisers, specifically those containing P, plays an important role in enhancing sustainability within crop production systems by promoting the efficient utilization of fertilisers [36]. This application proves instrumental in mitigating the challenges associated with P in soils, such as potential availability loss due to immobilization and runoff-induced losses [37,38].
In spite of the lack of studies in agricultural crops assessing the effectiveness of BBMFs that integrate material of bio-based origin in the fertiliser composition, studies do exist that examine the performance of BBFs from basic bio-waste valorisation [15]. The available works on this topic agree that plant growth and yield potentials with recovered nutrients are either similar or better than those of conventional fertilisers [39]. In this sense, e.g., in a study encompassing various crops, including maize, it was observed that, on the whole, the fertilising effect of P from ashes was similar to that of highly soluble P fertilisers like triple superphosphate (TSP), resulting in an increase in P uptake of cultivated crops as well as in increased soil P pools and P saturation [40]. In another study, the use of struvite in wheat grown in a pot experiment produced very similar rates of total P uptake per plant to those obtained using TSP but with a slow rate of nutrient release [41]. In our study, we did not use BBFs as such, but they were used as a raw material for N, P, and K to be incorporated into the mineral fertiliser, and the conclusion is the same: that ash and struvite, either as such or after chemical processing, are good sources of nutrients for crops, even comparable to the traditional mineral sources.
Before BBMFs can be applied in the field, it is necessary to assess the impact of BBMFs on soil quality and health, which was performed in this work using a microcosms test. The soil microbiome has a direct effect on soil quality and soil health. Although there are subtle differences between the two concepts, soil quality is defined as the ability of a soil to function within the ecosystem and land-use boundaries to sustain biological productivity, maintain environmental quality, and promote plant and animal health [42]. In this context, soil health takes a broader perspective that considers the long-term viability of soil as a living system, taking into account the multiple functions it performs in the ecosystem beyond just crop production [43]. Our approach to soil health includes an analysis of the bacterial community structure.
The biodiversity indices evaluated, including species richness and the Shannon index, showed a sustained stability of soil bacterial richness and an overall increase in soil diversity with the addition of fertiliser products, whether conventional mineral fertiliser or BBMF. It is well known that microorganisms respond to fertilisation, albeit with a strong influence of plant species and soil conditions, especially in terms of carbon (C), N, and P content [44]. Not only organic fertilisers, which provide a readily available C source, but also chemical fertilisers can directly promote the growth of specific microbial populations by providing essential nutrients that subsequently influence and modulate the community structure [45]. This was clearly demonstrated in our analysis, as there was a statistically significant and notable increase in the relative abundance of ASVs in the fertilised treatments compared with the unfertilised control (C−). A key factor contributing to this difference was the reduction or absence of the cyanobacterium Tychonema in the fertilised treatments that we observed. Similar results were obtained by Semenov et al. [46], who reported that the introduction of NPK fertilisers led to a suppression of the relative abundance of Tychonema. Similarly, Santoni et al. [47] reported that Tychonema played a significant role, contributing the most (10.65% of the total dissimilarity) to the differences in bacterial communities between organic and conventional farming systems, with a reduction observed in conventional farming. While several genera of cyanobacteria can improve plant health [48], Tychonema has been reported to be harmful to human and animal health due to toxin production and to be invasive in certain contexts, especially in aquatic environments [49,50]. In addition to Tychonema, Arthrobacter and Achromobacter were also crucial in differentiating C− from the other treatments, but unlike Tychonema, the presence of these other two genera was enhanced by the addition of fertiliser. Both Arthrobacter and Achromobacter contain species known as plant-growth-promoting rhizobacteria (PGPR) [51,52,53], which exhibit plant-growth-promoting (PGP) properties such as P solubilisation, abscisic acid (ABA) and siderophore production, 1-aminocyclopropane-1-carboxylic acid (ACC) deaminase activity, and stress alleviation, among others [54,55,56,57,58].
Furthermore, the relative abundance of Pseudarthrobacter, Skermanella, and Blastococcus remained unaffected by the addition of any type of fertiliser. Notably, these genera exhibited the highest values of relative abundance in the two most abundant phyla (Proteobacteria and Actinobacteria) across all the treatments. These bacteria are often recognised as PGPR or, as in the case of Blastococcus, playing an essential role in sustaining and boosting soil resilience and soil health [59,60,61]. Other genera consistently present but in lesser abundance were Flavobacterium, Agromyces, Streptomyces, Bradyrhizobium, Bacillus, and Pseudomonas. This constitutes a beneficial community because all these genera contain beneficial microorganisms [51,59,62].
The addition of fertiliser has a direct influence on the proliferation of specific microbial populations. In this sense, our study shows that these differences are due to subtle variations between several microbial groups. Interestingly, certain genera seem to be associated with certain treatments. For example, Nafulsella was identified exclusively in the PKA treatment; it is a genus commonly found in soils [63]. Similarly, a cluster comprising Acidovorax, Phormidium, and Phormidesmis was specifically associated with the PA treatment. Acidovorax is known to harbour both PGPR and plant pathogenic species [64,65]; Phormidium and Phormidesmis are ubiquitous cyanobacteria found in various environments and sometimes used for plant growth promotion or soil remediation [66,67,68]. Additionally, we observed other beneficial microorganisms associated with specific treatments; e.g., Novihervaspirillum, a common soil genus, was present in the PKA, PD, and C+ treatments [69,70]; Olivibacter, frequently encountered in rhizosphere soil exhibiting PGPR traits [71,72], displayed elevated relative abundance in the PKA, PD, and C+ treatments; Bdellovibrio, a bacterial predator known to house PGPR and biocontrol species [73,74], was detected in the ST and C+ treatments and in lower proportions in PD; and Kocuria, recognised as a PGPR [75], was observed in the ST, PD, and C+ treatments.
While there is evident modulation of the soil bacterial structure contingent upon fertiliser treatments, the ASVs involved in this study mainly represent genera that harbour beneficial microorganisms. This likely reflects the predominantly healthy composition of the initial soil bacterial community. These findings were further supported by correlation analysis. Broadly, we identified bacterial clusters showing positive correlations with plant growth and nutrient content in the plant biomass, as well as others showing negative correlations. Cluster B, consisting of Skermanella, Flavisolibacter, and Microvirga, exhibited strong positive correlations with fresh weight (FW), dry weight (DW), and nitrogen (N), phosphorus (P), and potassium (K) content. This cluster comprises beneficial microorganisms such as Skermanella, a diazotroph commonly found in soil and reported as a biological control agent [76,77]; Flavisolibacter, a PGPR phosphate solubiliser and indole-3-acetic acid (IAA) producer [78]; and Microvirga, a nitrogen-fixing bacterium [79,80].
Likewise, Cluster E also demonstrated a significant correlation with FW, DW, and K plant content, and a weaker correlation with P and N plant content. This cluster encompasses a broader range of genera, predominantly comprising PGPR species or indicators of soil health. Notable genera in this cluster include Bdellovibrio, Massilia, Phormidium, Phormidesmis, Acidovorax, Flavobacterium, Olivibacter, Arthrobacter, Kocuria, Noviherbaspirillum, and Nafulsella, previously mentioned as beneficial microorganisms; as well as Dyadobacter, known as a PGPR commonly present in the rhizosphere that enhances crop yield [81]; Streptomyces, commonly found in plant microbiomes with PGPR characteristics [82]; Rubrobacter, associated with potassium absorption and soil health [69,83]; Virgibacillus, housing halophytic PGPR species [84,85]; Pseudonocardia, a P-solubilizing bacterium and disease-suppressive bacterial agent [86,87]; Nocardioides, possessing PGPR capabilities to mitigate saline stress conditions [88,89]; and Promicromonospora, a PGPR producing gibberellins and mitigating the adverse effects of salinity and osmotic stress [90,91].
Overall, the cluster that correlates negatively with growth parameters and nutrient content (Cluster A) and those that do not correlate (Clusters C and D) predominantly comprise microorganisms whose relative abundance remains unaffected by fertiliser additions.

5. Conclusions

In conclusion, the metataxonomic analyses indicated a modulation of the bacterial community influenced by the application of fertilisers. In general terms, the genera enhanced by the fertilisers are considered beneficial microorganisms because of their role in promoting plant growth, alleviating stresses such as salinity, or acting as biocontrollers. However, it should be noted that this particular soil naturally contained beneficial bacteria, as was observed in the untreated soil (C−), although the fertilisation significantly increased the presence of beneficial taxa. It is also important to emphasise that BBMFs improve the composition of the soil microbiome in a way similar to conventional mineral fertilisers. While numerous studies suggest that mineral fertilisation reduces microbial diversity and thus the presence of beneficial microbial taxa essential for plant health, such an effect is the consequence of excessive fertiliser use [92,93]; our results show that a rational application of mineral fertilisers, i.e., according to the soil fertility and the expected crop yield, improves soil microbiome composition. It is hypothesised that the slower rate of nutrient release in the BBMFs could be compensated by the increase in PGPR in the rhizosphere of the crop, and this could be the reason for the similar or even better plant growth with BBMFs. Field trials are currently underway to scale up the results to the field level.

Supplementary Materials

The following supporting information can be downloaded at: https://www.mdpi.com/article/10.3390/agronomy14050916/s1, Table S1: Raw material used in the fertilizers’ formulation; Table S2: Results of soil analysis used in the microcosms assay.

Author Contributions

M.B.: Investigation, formal analysis, writing—original draft; C.C.: Investigation, review and editing; N.O.-L.: Formal analysis; M.Z.: Formal analysis, writing—review and editing; J.B.: Writing—review and editing, supervision, funding acquisition; F.G.-A.: Conceptualization, writing—review and editing, supervision, project administration. All authors contributed to the article and approved the submitted version. All authors have read and agreed to the published version of the manuscript.

Funding

This research was funded by European Commission—BBI JU project “Bio-based FERtilising products as the best practice for agricultural management SusTainability (BFERST)”. H2020-BBI-JTI-2018, Grant agreement ID: 837583. NO-L was granted a fellowship from the FPU program by the Spanish Ministry of Education with code (FPU 17/04201).

Data Availability Statement

The data presented in this study are available on request from the corresponding author (accurately indicate status).

Conflicts of Interest

Authors C.C. and J.B. are employed by FERTIBERIA S.A.

Appendix A

Results of the SIMPER analysis corresponding to the metataxonomic analysis.

References

  1. European Union. Directive 2008/98/EC of the European Parliament and the Council of 19 November 2008 on Waste and Repealing Certain Directives. Off. J. Eur. Union 2008, 312, 3–30. Available online: https://eur-lex.europa.eu/legal-content/EN/TXT/?uri=celex%3A32008L0098 (accessed on 15 January 2024).
  2. Van der Linden, A.; Reichel, A. Bio-Waste in Europe—Turning Challenges into Opportunities—European Environment Agency. Available online: https://www.eea.europa.eu/publications/bio-waste-in-europe (accessed on 16 January 2024).
  3. Lin, C.S.K.; Pfaltzgraff, L.A.; Herrero-Davila, L.; Mubofu, E.B.; Abderrahim, S.; Clark, J.H.; Koutinas, A.A.; Kopsahelis, N.; Stamatelatou, K.; Dickson, F.; et al. Food Waste as a Valuable Resource for the Production of Chemicals, Materials and Fuels. Current Situation and Global Perspective. Energy Environ. Sci. 2013, 6, 426–464. [Google Scholar] [CrossRef]
  4. Vea, E.B.; Romeo, D.; Thomsen, M. Biowaste Valorisation in a Future Circular Bioeconomy. Procedia CIRP 2018, 69, 591–596. [Google Scholar] [CrossRef]
  5. Luque, R.; Clark, J.H. Valorisation of Food Residues: Waste to Wealth Using Green Chemical Technologies. Sustain. Chem. Process 2013, 1, 10. [Google Scholar] [CrossRef]
  6. Lee, J.Y.; Lee, S.E.; Lee, D.W. Current Status and Future Prospects of Biological Routes to Bio-Based Products Using Raw Materials, Wastes, and Residues as Renewable Resources. Crit. Rev. Environ. Sci. Technol. 2022, 52, 2453–2509. [Google Scholar] [CrossRef]
  7. Langeveld, J.W.A.; Dixon, J.; Jaworski, J.F. Development Perspectives of The Biobased Economy: A Review. Crop. Sci. 2010, 50, S-142–S-151. [Google Scholar] [CrossRef]
  8. Kyttä, V.; Helenius, J.; Tuomisto, H.L. Carbon Footprint and Energy Use of Recycled Fertilizers in Arable Farming. J. Clean Prod. 2021, 287, 125063. [Google Scholar] [CrossRef]
  9. Wesseler, J. The EU’s Farm-to-Fork Strategy: An Assessment from the Perspective of Agricultural Economics. Appl. Econ. Perspect. Policy 2022, 44, 1826–1843. [Google Scholar] [CrossRef]
  10. Billen, G.; Aguilera, E.; Einarsson, R.; Garnier, J.; Gingrich, S.; Grizzetti, B.; Lassaletta, L.; Le Noë, J.; Sanz-Cobena, A. Beyond the Farm to Fork Strategy: Methodology for Designing a European Agro-Ecological Future. Sci. Total Environ. 2024, 908, 168160. [Google Scholar] [CrossRef]
  11. Jagtap, S.; Trollman, H.; Trollman, F.; Garcia-Garcia, G.; Parra-López, C.; Duong, L.; Martindale, W.; Munekata, P.E.S.; Lorenzo, J.M.; Hdaifeh, A.; et al. The Russia-Ukraine Conflict: Its Implications for the Global Food Supply Chains. Foods 2022, 11, 2098. [Google Scholar] [CrossRef]
  12. Sigurnjak, I.; Brienza, C.; Snauwaert, E.; De Dobbelaere, A.; De Mey, J.; Vaneeckhaute, C.; Michels, E.; Schoumans, O.; Adani, F.; Meers, E. Production and Performance of Bio-Based Mineral Fertilizers from Agricultural Waste Using Ammonia (Stripping-) Scrubbing Technology. Waste Manag. 2019, 89, 265–274. [Google Scholar] [CrossRef] [PubMed]
  13. Vaneeckhaute, C.; Lebuf, V.; Michels, E.; Belia, E.; Vanrolleghem, P.A.; Tack, F.M.G.; Meers, E. Nutrient Recovery from Digestate: Systematic Technology Review and Product Classification. Waste Biomass Valoriz. 2017, 8, 21–40. [Google Scholar] [CrossRef]
  14. Hansen, J. EU Must Get Serious about Promoting the Circular Economy. 2018. Available online: https://www.theparliamentmagazine.eu/articles/partner_article/fertilizers-europe/eu-must-get-serious-about-promoting-circular-economy (accessed on 21 February 2024).
  15. Chojnacka, K.; Moustakas, K.; Witek-Krowiak, A. Bio-Based Fertilizers: A Practical Approach towards Circular Economy. Bioresour. Technol. 2020, 295, 122223. [Google Scholar] [CrossRef] [PubMed]
  16. Chojnacka, K.; Mikula, K.; Skrzypczak, D.; Izydorczyk, G.; Gorazda, K.; Kulczycka, J.; Kominko, H.; Moustakas, K.; Witek-Krowiak, A. Practical aspects of biowastes conversion to fertilizers. Biomass Convers. Biorefin. 2022, 14, 1515–1533. [Google Scholar] [CrossRef]
  17. Tur-Cardona, J.; Bonnichsen, O.; Speelman, S.; Verspecht, A.; Carpentier, L.; Debruyne, L.; Marchand, F.; Jacobsen, B.H.; Buysse, J. Farmers’ Reasons to Accept Bio-Based Fertilizers: A Choice Experiment in Seven Different European Countries. J. Clean Prod. 2018, 197, 406–416. [Google Scholar] [CrossRef]
  18. Hertzberger, A.J.; Cusick, R.D.; Margenot, A.J. A review and meta-analysis of the agricultural potential of struvite as a phosphorus fertilizer. Soil Sci. Soc. Am. J. 2020, 84, 653–671. [Google Scholar] [CrossRef]
  19. Silva, F.C.; Cruz, N.C.; Tarelho, L.A.C.; Rodrigues, S.M. Use of Biomass Ash-Based Materials as Soil Fertilisers: Critical Review of the Existing Regulatory Framework. J. Clean. Prod. 2019, 214, 112–124. [Google Scholar] [CrossRef]
  20. European Union. Regulation (EU) 2019/1009 of the European Parliament and the Council of 5 June 2019 on Biostimulants. Off. J. Eur. Union 2019, 170, 1–114. Available online: https://eur-lex.europa.eu/legal-content/EN/TXT/?uri=celex%3A32019R1009 (accessed on 16 April 2024).
  21. Thomas, R.F.; Booth, R.L. Selective Electrode Measurement of Ammonia in Water and Wastes. Environ. Sci. Technol. 1973, 7, 523–526. [Google Scholar] [CrossRef]
  22. Norman, R.J.; Stucki, J.W. The Determination of Nitrate and Nitrite in Soil Extracts by Ultraviolet Spectrophotometry. Soil Sci. Soc. Am. J. 1981, 45, 347–353. [Google Scholar] [CrossRef]
  23. Klindworth, A.; Pruesse, E.; Schweer, T.; Peplies, J.; Quast, C.; Horn, M.; Glöckner, F.O. Evaluation of General 16S Ribosomal RNA Gene PCR Primers for Classical and Next-Generation Sequencing-Based Diversity Studies. Nucleic Acids Res. 2013, 41, e1. [Google Scholar] [CrossRef] [PubMed]
  24. Schmieder, R.; Edwards, R. Quality Control and Preprocessing of Metagenomic Datasets. Bioinformatics 2011, 27, 863–864. [Google Scholar] [CrossRef] [PubMed]
  25. Magoč, T.; Salzberg, S.L. FLASH: Fast Length Adjustment of Short Reads to Improve Genome Assemblies. Bioinformatics 2011, 27, 2957–2963. [Google Scholar] [CrossRef]
  26. Wang, Q.; Garrity, G.M.; Tiedje, J.M.; Cole, J.R. Naïve Bayesian Classifier for Rapid Assignment of RRNA Sequences into the New Bacterial Taxonomy. Appl. Environ. Microbiol. 2007, 73, 5261–5267. [Google Scholar] [CrossRef] [PubMed]
  27. Clarke, K.R.; Gorley, R.N. Getting Started with PRIMER V7. In PRIMER-E: Plymouth; Plymouth Marine Laboratory: Devon, UK, 2015. [Google Scholar]
  28. Kurniawati, A.; Toth, G.; Ylivainio, K.; Toth, Z. Opportunities and Challenges of Bio-Based Fertilizers Utilization for Improving Soil Health. Org. Agr. 2023, 13, 335–350. [Google Scholar] [CrossRef]
  29. Garmendia-Lemus, S.; Moshkin, E.; Hung, Y.; Tack, J.; Buysse, J. European Farmers’ Perceptions and Intentions to Use Bio-Based Fertilisers: Insights from the Theory of Planned Behaviour and Perceived Utility. J. Clean Prod. 2024, 434, 139755. [Google Scholar] [CrossRef]
  30. Vaneeckhaute, C.; Ghekiere, G.; Michels, E.; Vanrolleghem, P.A.; Tack, F.M.G.; Meers, E. Assessing Nutrient Use Efficiency and Environmental Pressure of Macronutrients in Biobased Mineral Fertilizers: A Review of Recent Advances and Best Practices at Field Scale. Adv. Agron. 2014, 128, 137–180. [Google Scholar] [CrossRef]
  31. Nkoa, R. Agricultural Benefits and Environmental Risks of Soil Fertilization with Anaerobic Digestates: A Review. Agron. Sustain. Dev. 2014, 34, 473–492. [Google Scholar] [CrossRef]
  32. Sayara, T.; Basheer-Salimia, R.; Hawamde, F.; Sánchez, A. Recycling of Organic Wastes through Composting: Process Performance and Compost Application in Agriculture. Agronomy 2020, 10, 1838. [Google Scholar] [CrossRef]
  33. Wierzbowska, J.; Sienkiewicz, S.; Zarczyński, P.; Krzebietke, S. Environmental Application of Ash from Incinerated Biomass. Agronomy 2020, 10, 482. [Google Scholar] [CrossRef]
  34. Sniatala, B.; Kurniawan, T.A.; Sobotka, D.; Makinia, J.; Othman, M.H.D. Macro-Nutrients Recovery from Liquid Waste as a Sustainable Resource for Production of Recovered Mineral Fertilizer: Uncovering Alternative Options to Sustain Global Food Security Cost-Effectively. Sci. Total Environ. 2023, 856, 159283. [Google Scholar] [CrossRef] [PubMed]
  35. Rizzioli, F.; Bertasini, D.; Bolzonella, D.; Frison, N.; Battista, F. A Critical Review on the Techno-Economic Feasibility of Nutrients Recovery from Anaerobic Digestate in the Agricultural Sector. Sep. Purif. Technol. 2023, 306, 122690. [Google Scholar] [CrossRef]
  36. Mclaughlin, M.J.; Mcbeath, T.M.; Smernik, R.; Stacey, S.P.; Ajiboye, B.; Guppy, C.; Mclaughlin, M.J.; Mcbeath, T.M.; Smernik, R.; Stacey, S.P.; et al. The Chemical Nature of P Accumulation in Agricultural Soils—Implications for Fertiliser Management and Design: An Australian Perspective. Plant Soil 2011, 349, 69–87. [Google Scholar] [CrossRef]
  37. Hart, M.R.; Quin, B.F.; Nguyen, M.L. Phosphorus Runoff from Agricultural Land and Direct Fertilizer Effects: A Review. J. Environ. Qual. 2004, 33, 1954–1972. [Google Scholar] [CrossRef] [PubMed]
  38. Arenberg, M.R.; Arai, Y. Uncertainties in Soil Physicochemical Factors Controlling Phosphorus Mineralization and Immobilization Processes. Adv. Agron. 2019, 154, 153–200. [Google Scholar] [CrossRef]
  39. Saliu, T.D.; Oladoja, N.A. Nutrient Recovery from Wastewater and Reuse in Agriculture: A Review. Environ. Chem. Lett. 2021, 19, 2299–2316. [Google Scholar] [CrossRef]
  40. Schiemenz, K.; Kern, J.; Paulsen, H.-M.; Bachmann, S.; Eichler-Löbermann, B. Phosphorus Fertilizing Effects of Biomass Ashes. In Recycling of Biomass Ashes; Insam, H., Knapp, B.A., Eds.; Springer: Berlin/Heidelberg, Germany, 2011; pp. 17–31. [Google Scholar] [CrossRef]
  41. Talboys, P.J.; Heppell, J.; Roose, T.; Healey, J.R.; Jones, D.L.; Withers, P.J.A. Struvite: A Slow-Release Fertiliser for Sustainable Phosphorus Management? Plant Soil 2016, 401, 109–123. [Google Scholar] [CrossRef] [PubMed]
  42. Doran, J.W.; Parkin, T.B. Defining and assessing soil quality. In Defining Soil Quality for a Sustainable Environment; Doran, J.W., Coleman, D.C., Bezdicek, D.F., Stewart, B.A., Eds.; Soil Science Society of America: Madison, WI, USA, 1994; pp. 3–21. [Google Scholar] [CrossRef]
  43. Lehmann, J.; Bossio, D.A.; Kögel-Knabner, I.; Rillig, M.C. The Concept and Future Prospects of Soil Health. Nat. Rev. Earth Environ. 2020, 1, 544–553. [Google Scholar] [CrossRef] [PubMed]
  44. Dincă, L.C.; Grenni, P.; Onet, C.; Onet, A. Fertilization and Soil Microbial Community: A Review. Appl. Sci. 2022, 12, 1198. [Google Scholar] [CrossRef]
  45. Sabir, M.S.; Shahzadi, F.; Ali, F.; Shakeela, Q.; Niaz, Z.; Ahmed, S. Comparative Effect of Fertilization Practices on Soil Microbial Diversity and Activity: An Overview. Curr. Microbiol. 2021, 78, 3644–3655. [Google Scholar] [CrossRef]
  46. Semenov, M.V.; Krasnov, G.S.; Semenov, V.M.; van Bruggen, A.H.C. Long-Term Fertilization Rather than Plant Species Shapes Rhizosphere and Bulk Soil Prokaryotic Communities in Agroecosystems. Appl. Soil Ecol. 2020, 154, 103641. [Google Scholar] [CrossRef]
  47. Santoni, M.; Verdi, L.; Imran Pathan, S.; Napoli, M.; Dalla Marta, A.; Dani, F.R.; Pacini, G.C.; Ceccherini, M.T. Soil Microbiome Biomass, Activity, Composition and CO2 Emissions in a Long-Term Organic and Conventional Farming Systems. Soil Use Manag. 2023, 39, 588–605. [Google Scholar] [CrossRef]
  48. Poveda, J. Cyanobacteria in Plant Health: Biological Strategy against Abiotic and Biotic Stresses. Crop. Prot. 2021, 141, 105450. [Google Scholar] [CrossRef]
  49. Capelli, C.; Cerasino, L.; Boscaini, A.; Salmaso, N. Molecular Tools for the Quantitative Evaluation of Potentially Toxigenic Tychonema Bourrellyi (Cyanobacteria, Oscillatoriales) in Large Lakes. Hydrobiologia 2018, 824, 109–119. [Google Scholar] [CrossRef]
  50. Salmaso, N.; Cerasino, L.; Boscaini, A.; Capelli, C. Planktic Tychonema (Cyanobacteria) in the Large Lakes South of the Alps: Phylogenetic Assessment and Toxigenic Potential. FEMS Microbiol. Ecol. 2016, 92, fiw155. [Google Scholar] [CrossRef]
  51. Oleńska, E.; Małek, W.; Wójcik, M.; Swiecicka, I.; Thijs, S.; Vangronsveld, J. Beneficial Features of Plant Growth-Promoting Rhizobacteria for Improving Plant Growth and Health in Challenging Conditions: A Methodical Review. Sci. Total Environ. 2020, 743, 140682. [Google Scholar] [CrossRef]
  52. Santoyo, G.; Urtis-Flores, C.A.; Loeza-Lara, P.D.; Orozco-Mosqueda, M.D.C.; Glick, B.R. Rhizosphere Colonization Determinants by Plant Growth-Promoting Rhizobacteria (PGPR). Biology 2021, 10, 475. [Google Scholar] [CrossRef] [PubMed]
  53. Glick, B.R. Beneficial Plant-Bacterial Interactions, 2nd ed.; Springer: Berlin/Heidelberg, Germany, 2020; pp. 1–383. [Google Scholar] [CrossRef]
  54. Egamberdieva, D.; Wirth, S.J.; Alqarawi, A.A.; Abd-Allah, E.F.; Hashem, A. Phytohormones and Beneficial Microbes: Essential Components for Plants to Balance Stress and Fitness. Front. Microbiol. 2017, 8, 2104. [Google Scholar] [CrossRef]
  55. Khan, M.A.; Ullah, I.; Waqas, M.; Hamayun, M.; Khan, A.L.; Asaf, S.; Kang, S.M.; Kim, K.M.; Jan, R.; Lee, I.J. Halo-Tolerant Rhizospheric Arthrobacter woluwensis AK1 Mitigates Salt Stress and Induces Physio-Hormonal Changes and Expression of GmST1 and GmLAX3 in Soybean. Symbiosis 2019, 77, 9–21. [Google Scholar] [CrossRef]
  56. Santana, M.M.; Rosa, A.P.; Zamarreño, A.M.; García-Mina, J.M.; Rai, A.; Cruz, C. Achromobacter xylosoxidans and Enteromorpha intestinalis Extract Improve Tomato Growth under Salt Stress. Agronomy 2022, 12, 934. [Google Scholar] [CrossRef]
  57. Singh, P.; Pandey, S.S.; Dubey, B.K.; Raj, R.; Barnawal, D.; Chandran, A.; Rahman, L.U. Salt and Drought Stress Tolerance with Increased Biomass in Transgenic Pelargonium graveolens through Heterologous Expression of ACC Deaminase Gene from Achromobacter xylosoxidans. Plant. Cell. Tiss. Organ. Cult. 2021, 147, 297–311. [Google Scholar] [CrossRef]
  58. Vanissa, T.T.G.; Berger, B.; Patz, S.; Becker, M.; Turečková, V.; Novák, O.; Tarkowská, D.; Henri, F.; Ruppel, S. The Response of Maize to Inoculation with Arthrobacter sp. and Bacillus sp. in Phosphorus-Deficient, Salinity-Affected Soil. Microorganisms 2020, 8, 1005. [Google Scholar] [CrossRef] [PubMed]
  59. Samain, E.; Duclercq, J.; Ait Barka, E.; Eickermann, M.; Ernenwein, C.; Mazoyon, C.; Sarazin, V.; Dubois, F.; Aussenac, T.; Selim, S. PGPR-Soil Microbial Communities’ Interactions and Their Influence on Wheat Growth Promotion and Resistance Induction against Mycosphaerella graminicola. Biology 2023, 12, 1416. [Google Scholar] [CrossRef] [PubMed]
  60. Ham, S.H.; Yoon, A.R.; Oh, H.E.; Park, Y.G. Plant Growth-Promoting Microorganism Pseudarthrobacter sp. NIBRBAC000502770 Enhances the Growth and Flavonoid Content of Geum aleppicum. Microorganisms 2022, 10, 1241. [Google Scholar] [CrossRef] [PubMed]
  61. Jiang, S.; Deng, X.; Ma, L.; Wang, H.; Wang, X.; Feng, L.; Zhu, F.; Xue, S.; Mohammad, A. Standardized Framework for Assessing Soil Quality at Antimony Smelting Site by Considering Microbial-Induced Resilience and Heavy Metal Contamination. J. Environ. Sci. 2024, 148, 306–320. [Google Scholar] [CrossRef]
  62. Wongkiew, S.; Chaikaew, P.; Takrattanasaran, N.; Khamkajorn, T. Evaluation of Nutrient Characteristics and Bacterial Community in Agricultural Soil Groups for Sustainable Land Management. Sci. Rep. 2022, 12, 7368. [Google Scholar] [CrossRef]
  63. Korkar, M.H.; Magdy, M.; Rizk, S.M.; Fiteha, Y.G.; Atta, A.H.; Rashed, M.A.S. Rhizosphere-Associated Microbiome Profile of Agricultural Reclaimed Lands in Egypt. Agronomy 2022, 12, 2543. [Google Scholar] [CrossRef]
  64. Cavite, H.J.M.; Mactal, A.G.; Evangelista, E.V.; Cruz, J.A. Growth and Yield Response of Upland Rice to Application of Plant Growth-Promoting Rhizobacteria. J. Plant Growth Regul. 2021, 40, 494–508. [Google Scholar] [CrossRef]
  65. Koo, Y.M.; Heo, A.Y.; Choi, H.W. Isolation and Identification Antagonistic Bacterium Paenibacillus tianmuensis YM002 against Acidovorax citrulli. Front. Plant Sci. 2023, 14, 1173695. [Google Scholar] [CrossRef]
  66. Davydov, D.; Vilnet, A. Review of the Cyanobacterial Genus Phormidesmis (Leptolyngbyaceae) with the Descrition of Apatinema gen. nov. Diversity 2022, 14, 731. [Google Scholar] [CrossRef]
  67. Múnera-Porras, L.M.; García-Londoño, S.; Ríos-Osorio, L.A. Action Mechanisms of Plant Growth Promoting Cyanobacteria in Crops in Situ: A Systematic Review of Literature. Int. J. Agron. 2020, 2020, 2690410. [Google Scholar] [CrossRef]
  68. Dhawi, F. How Can We Stabilize Soil Using Microbial Communities and Mitigate Desertification? Sustainability 2023, 15, 863. [Google Scholar] [CrossRef]
  69. Do Rêgo Barros, F.M.; Pedrinho, A.; Mendes, L.W.; Freitas, C.C.G.; Andreote, F.D. Interactions between Soil Bacterial Diversity and Plant-Parasitic Nematodes in Soybean Plants. Appl. Environ. Microbiol. 2022, 88, e00963-22. [Google Scholar] [CrossRef]
  70. Rodríguez-Berbel, N.; Ortega, R.; Lucas-Borja, M.E.; Solé-Benet, A.; Miralles, I. Long-Term Effects of Two Organic Amendments on Bacterial Communities of Calcareous Mediterranean Soils Degraded by Mining. J. Environ. Manag. 2020, 271, 110920. [Google Scholar] [CrossRef]
  71. Zotti, M.; Bonanomi, G.; Mancinelli, G.; Barquero, M.; De Filippis, F.; Giannino, F.; Mazzoleni, S.; González-Andrés, F. Riding the Wave: Response of Bacterial and Fungal Microbiota Associated with the Spread of the Fairy Ring Fungus Calocybe Gambosa. Appl. Soil Ecol. 2021, 163, 103963. [Google Scholar] [CrossRef]
  72. Navarro-Noya, Y.E.; Martínez-Romero, E.; Hernández-Rodríguez, C. Potential Plant-Growth-Promoting and Nitrogen-Fixing Bacteria Associated with Pioneer Plants Growing on Mine Tailings. In Molecular Microbial Ecology of the Rhizosphere; John Wiley & Sons, Inc.: Hoboken, NJ, USA, 2013; Volume 2, pp. 1003–1011. [Google Scholar] [CrossRef]
  73. De Tender, C.; Vandecasteele, B.; Verstraeten, B.; Ommeslag, S.; Kyndt, T.; Debode, J. Biochar-Enhanced Resistance to Botrytis cinerea in Strawberry Fruits (But Not Leaves) Is Associated with Changes in the Rhizosphere Microbiome. Front. Plant Sci. 2021, 12, 700479. [Google Scholar] [CrossRef]
  74. Martins, S.J.; Taerum, S.J.; Triplett, L.; Emerson, J.B.; Zasada, I.; de Toledo, B.F.; Kovac, J.; Martin, K.; Bull, C.T. Predators of Soil Bacteria in Plant and Human Health. Phytobiomes J. 2022, 6, 184–200. [Google Scholar] [CrossRef]
  75. Li, X.; Sun, P.; Zhang, Y.; Jin, C.; Guan, C. A Novel PGPR Strain Kocuria rhizophila Y1 Enhances Salt Stress Tolerance in Maize by Regulating Phytohormone Levels, Nutrient Acquisition, Redox Potential, Ion Homeostasis, Photosynthetic Capacity and Stress-Responsive Genes Expression. Environ. Exp. Bot. 2020, 174, 104023. [Google Scholar] [CrossRef]
  76. Renoud, S.; Abrouk, D.; Prigent-Combaret, C.; Wisniewski-Dyé, F.; Legendre, L.; Moënne-Loccoz, Y.; Muller, D. Effect of Inoculation Level on the Impact of the PGPR Azospirillum lipoferum CRT1 on Selected Microbial Functional Groups in the Rhizosphere of Field Maize. Microorganisms 2022, 10, 325. [Google Scholar] [CrossRef]
  77. Wang, L.; Wang, H.; Liu, M.; Xu, J.; Bian, H.; Chen, T.; You, E.; Deng, C.; Wei, Y.; Yang, T.; et al. Effects of Different Fertilization Conditions and Different Geographical Locations on the Diversity and Composition of the Rhizosphere Microbiota of Qingke (Hordeum Vulgare L.) Plants in Different Growth Stages. Front. Microbiol. 2023, 14, 1094034. [Google Scholar] [CrossRef]
  78. Zhou, X.; Zhang, X.; Ma, C.; Wu, F.; Jin, X.; Dini-Andreote, F.; Wei, Z. Biochar Amendment Reduces Cadmium Uptake by Stimulating Cadmium-Resistant PGPR in Tomato Rhizosphere. Chemosphere 2022, 307, 136138. [Google Scholar] [CrossRef]
  79. Andrews, M.; Andrews, M.E. Specificity in Legume-Rhizobia Symbioses. Int. J. Mol. Sci. 2017, 18, 705. [Google Scholar] [CrossRef]
  80. Ardley, J.K.; Parker, M.A.; De Meyer, S.E.; Trengove, R.D.; O’Hara, G.W.; Reeve, W.G.; Yates, R.J.; Dilworth, M.J.; Willems, A.; Howieson, J.G. Microvirga Lupini sp. nov., Microvirga lotononidis sp. nov. and Microvirga zambiensis sp. nov. are Alphaproteobacterial Root-Nodule Bacteria That Specifically Nodulate and Fix Nitrogen with Geographically and Taxonomically Separate Legume Hosts. Int. J. Syst. Evol. Microbiol. 2012, 62, 2579–2588. [Google Scholar] [CrossRef]
  81. Zhang, L.N.; Jiang, C.H.; Si, F.; Song, N.; Yang, W.; Zhu, Y.; Luo, Y.; Guo, J.H. Long-Term Field Application of a Plant Growth-Promoting Rhizobacterial Consortium Suppressed Root-Knot Disease by Shaping the Rhizosphere Microbiota. Plant Dis. 2024, 108, 94–103. [Google Scholar] [CrossRef]
  82. Viaene, T.; Langendries, S.; Beirinckx, S.; Maes, M.; Goormachtig, S. Streptomyces as a Plant’s Best Friend? FEMS Microbiol. Ecol. 2016, 92, fiw119. [Google Scholar] [CrossRef]
  83. Yao, X.; Huang, K.; Zhao, S.; Cheng, Q.; Zhang, S.; Yang, L.; Ding, W.; Zhang, Y. Identification and Verification of Rhizosphere Indicator Microorganisms in Tobacco Root Rot. Agron. J. 2021, 113, 1480–1491. [Google Scholar] [CrossRef]
  84. Essghaier, B.; Mrah, S.; ben Jalloul, A.; Ghazghazi, H.; Ahmed, H. Ben Ability of Virgibacillus marismortui and Salinococcus roseus for Plant Growth Promotion by Evaluating Their Effect on Physiological and Morphological Parameters in Vitro and in Soilless System. Biologia 2022, 77, 2257–2267. [Google Scholar] [CrossRef]
  85. Sharma, A.; Singh, R.N.; Song, X.P.; Singh, R.K.; Guo, D.J.; Singh, P.; Verma, K.K.; Li, Y.R. Genome Analysis of a Halophilic Virgibacillus halodenitrificans ASH15 Revealed Salt Adaptation, Plant Growth Promotion, and Isoprenoid Biosynthetic Machinery. Front. Microbiol. 2023, 14, 1229955. [Google Scholar] [CrossRef]
  86. Zhang, Y.; Gao, X.; Shen, Z.; Zhu, C.; Jiao, Z.; Li, R.; Shen, Q. Pre-Colonization of PGPR Triggers Rhizosphere Microbiota Succession Associated with Crop Yield Enhancement. Plant Soil 2019, 439, 553–567. [Google Scholar] [CrossRef]
  87. Bi, W.X.; Wang, K.; Weng, B.S.; Yan, D.H.; Liu, S.Y. Does the Returning Farmland to Forest Program Improve the Ecosystem Stability of Rhizosphere in Winter in Alpine Regions? Appl. Soil Ecol. 2021, 165, 104011. [Google Scholar] [CrossRef]
  88. Meena, K.K.; Bitla, U.M.; Sorty, A.M.; Singh, D.P.; Gupta, V.K.; Wakchaure, G.C.; Kumar, S. Mitigation of Salinity Stress in Wheat Seedlings Due to the Application of Phytohormone-Rich Culture Filtrate Extract of Methylotrophic Actinobacterium Nocardioides sp. NIMMe6. Front. Microbiol. 2020, 11, 2091. [Google Scholar] [CrossRef]
  89. Amy, C.; Avice, J.C.; Laval, K.; Bressan, M. Are Native Phosphate-Solubilizing Bacteria a Relevant Alternative to Mineral Fertilizations for Crops? Part II: PSB Inoculation Enables a Halving of P Input and Improves the Microbial Community in the Rapeseed Rhizosphere. Rhizosphere 2022, 21, 100480. [Google Scholar] [CrossRef]
  90. Kang, S.M.; Khan, A.L.; Hamayun, M.; Hussain, J.; Joo, G.J.; You, Y.H.; Kim, J.G.; Lee, I.J. Gibberellin-Producing Promicromonospora sp. SE188 Improves Solanum lycopersicum Plant Growth and Influences Endogenous Plant Hormones. J. Microbiol. 2012, 50, 902–909. [Google Scholar] [CrossRef]
  91. Kang, S.M.; Khan, A.L.; Waqas, M.; You, Y.H.; Kim, J.H.; Kim, J.G.; Hamayun, M.; Lee, I.J. Plant Growth-Promoting Rhizobacteria Reduce Adverse Effects of Salinity and Osmotic Stress by Regulating Phytohormones and Antioxidants in Cucumis sativus. J. Plant Int. 2014, 9, 673–682. [Google Scholar] [CrossRef]
  92. Francioli, D.; Schulz, E.; Lentendu, G.; Wubet, T.; Buscot, F.; Reitz, T. Mineral vs. Organic Amendments: Microbial Community Structure, Activity and Abundance of Agriculturally Relevant Microbes Are Driven by Long-Term Fertilization Strategies. Front. Microbiol. 2016, 7, 1446. [Google Scholar] [CrossRef]
  93. Beltran-Garcia, M.J.; Martínez-Rodríguez, A.; Olmos-Arriaga, I.; Valdes-Salas, B.; Di Mascio, P.; White, J.F. Nitrogen Fertilization and Stress Factors Drive Shifts in Microbial Diversity in Soils and Plants. Symbiosis 2021, 84, 379–390. [Google Scholar] [CrossRef]
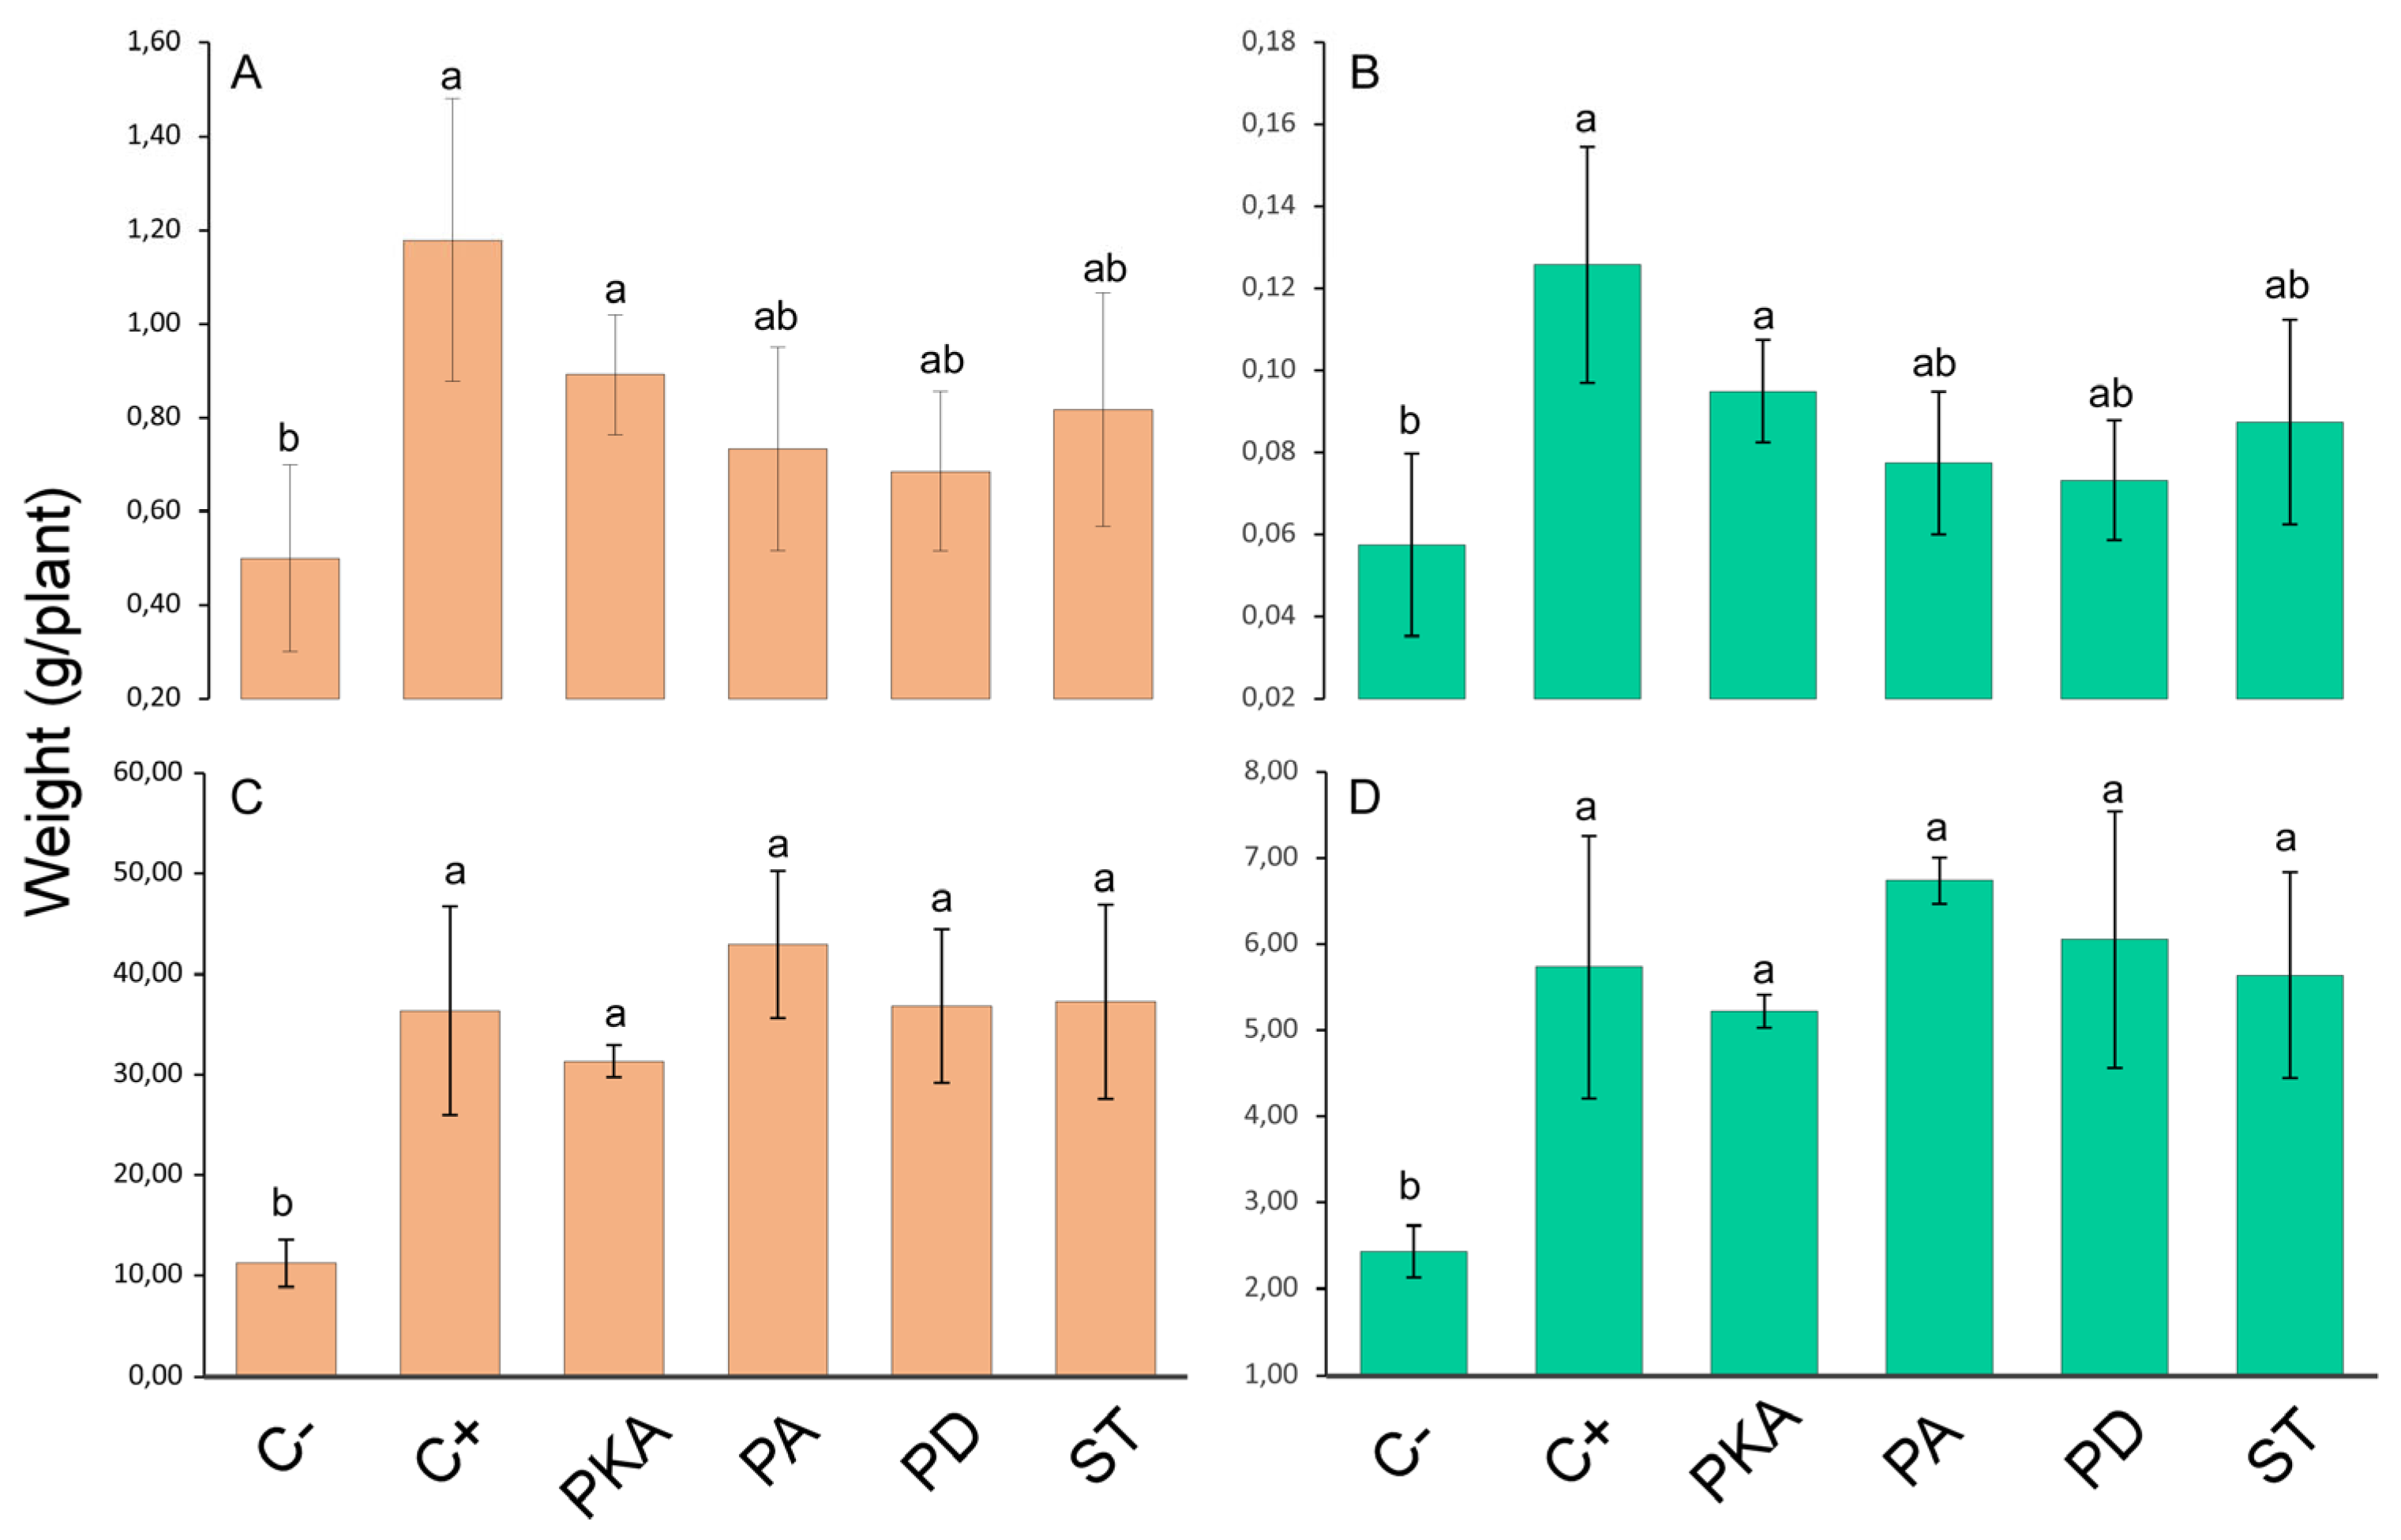
Figure 1. Bar plot showing mean aerial biomass (g/plant) of maize fertilised with new BBMFs compared with the non-fertilised control (C−) and the control with conventional fertilisation (C+). Fresh (A) and dry (B) biomass taken at 60 DAS. Fresh (C) and dry (D) biomass taken at 90 DAS. Black bars indicate standard deviation of six replicates for the samples taken at 60 DAS and of twelve replicates for samples taken at 90 DAS. Different letters indicate significant differences among treatments assessed with Tukey’s test with a significance level fixed for p ≤ 0.05.
Agronomy 14 00916 g001
Figure 2. Box plots showing the distribution of diversity indices for each treatment. S: Number of ASV (A); H′: Shannon index (B). Different letters indicate significant differences for p-values below 0.05. Significance was assessed through PERMANOVA (No. of permutations = 9999). The lower and upper bounds of the boxplots show the first and third quartiles (the 25th and 75th percentiles), the middle line shows the median, and whiskers above and below the boxplot indicate inter-quartile ranges. Letters indicate significant differences for p < 0.05.
Agronomy 14 00916 g002
Figure 3. Stacked bar plot of bacterial taxa grouped according to phyla. Data are shown as relative abundance.
Agronomy 14 00916 g003
Figure 4. Non-metric multidimensional scaling (nMDS) of bacterial communities formed by application of new BBMFs compared with non-fertilised control (C−) and control with conventional fertilization (C+). The nMDSs were originated with a contingency matrix calculated on the basis of Bray–Curtis similarity from Hellinger transformed data (square root of relative abundance).
Agronomy 14 00916 g004
Figure 5. Segmented bubble plots showing segments whose sizes are directly proportional to the average relative abundance per treatment for each of the different size/genus categories (as different colours).
Agronomy 14 00916 g005
Figure 6. Heatplot of the 50 most frequent bacterial taxa in the experimental design, comparing new BBMF treatments, non-fertilised (C−), and conventional fertilised control (C+). Scale bar represents Hellinger transformed data (square root of relative abundance), and symbols represent bacterial phyla. Bacterial taxa are ordered according to index of association.
Agronomy 14 00916 g006
Figure 7. Network of interaction based on Pearson r correlation coefficient between bacterial consortia and plant biometrics measured in the experiment. Bacterial taxa are ordered according to complete linkage clustering of Pearson r coefficient. Clusters A, B, C, D, and E defined according to results obtained with Simprof test (999 permutations) for level of p < 0.05. Positive and negative interactions are indicated with red and blue colours, respectively. Grey lines represent no interaction. The strength of interactions is represented by different line thicknesses proportional to the Pearson r values.
Agronomy 14 00916 g007
Table 1. Chemical description of fertilisers (conventional fertiliser and BBMFs) used in the microcosms assay.
FertiliserTotal Nutrients ContentNutrients Content
from Renewable Bio-Based Origin
Bio-Based SourceNutrients Content
from Mineral Conventional Origin
N (% w:w)P2O5 (% w:w)K2O (% w:w)N (% w:w)P2O5 (% w:w)K2O (% w:w) N (% w:w)P2O5 (% w:w)K2O (% w:w)
Control (C+)815150.000.000.00-8.0015.0015.00
PKA815150.003.163.33Ash8.0011.8411.67
PA815150.003.910.00Ash8.0011.0915.00
PD815150.005.350.00CaHPO4 from the patented process DMPhos (EP17382535)8.009.6515.00
ST815150.225.000.00Struvite7.7810.0015.00
Table 2. Mean values and standard deviation of aerial nutrient content (N, P, and K) of maize plants grown in microcosmos conditions fertilised with new BBMFs compared with a non-fertilised control (C−) and a control with conventional fertilisation (C+). (Significance level: *** p ≤ 0.001; ** 0.001 < p ≤ 0.01; * 0.01 < p ≤ 0.05; ns not significant). A Tukey’s test was used to compare mean values; the means followed by the same letter did not significantly differ for p ≤ 0.05.
TreatmentN (%)P (mg/kg)K (cmol(+)/kg)
60 Days90 Days60 Days90 Days60 Days90 Days
C−3.24 ± 0.24 b1.40 ± 0.32 b4278.95 ± 342.37 c721.25 ± 79.13 c42,332.08 ± 939.8517,106.51 ± 161.71 b
C+4.16 ± 0.50 a2.19 ± 0.37 a5286.88 ± 433.75 bc1268.67 ± 87.98 a44,682.54 ± 4383.4520,352.58 ± 701.28 a
PKA4.55 ± 0.22 a2.13 ± 0.06 a6052.44 ± 106.39 ab1079.36 ± 12.18 ab44,988.06 ± 1336.8519,168.08 ± 1963.77 ab
PA4.18 ± 0.10 a1.94 ± 0.13 ab6346.77 ± 624.66 ab1092.45 ± 42.94 ab45,517.50 ± 2913.0218,433.63 ± 1207.63 ab
PD4.03 ± 0.20 ab2.17 ± 0.05 a6630.11 ± 190.03 a1133.62 ± 22.57 ab44,159.85 ± 6904.3619,020.83 ± 139.28 ab
ST3.96 ± 0.33 ab1.87 ± 0.26 ab6685.29 ± 435.16 a1218.19 ± 99.55 ab45,875.72 ± 4835.0119,038.87 ± 794.80 ab
ANOVA Mean square0.560.272,624,348.291416.674,778,125.480.10
F value6.604.9016.8925.380.283.13
Significance*********ns**
Table 3. Mean values and standard deviation of nutrient soil content (N-NH4+, N-NO3, P, and K) from maize plants grown in microcosmos conditions fertilised with new BBMFs compared with non-fertilised control (C−) and control with conventional fertilisation (C+). (Significance level: *** p ≤ 0.001; ns not significant). A Tukey’s test was used to compare mean values; the means followed by the same letter did not significantly differ for p ≤ 0.05.
TreatmentN-NH4+ (mg/kg)N-NO3 (mg/kg)P (mg/kg)K (mg/kg)
60 Days90 Days60 Days90 Days60 Days90 Days60 Days90 Days
C−0.38 ± 0.200.25 ± 0.0614.05 ± 1.67 b5.68 ± 0.54 b13.95 ± 2.98 b11.29 ± 1.49 c1.15 ± 0.051.05 ± 0.03
C+0.41 ± 0.110.25 ± 0.0641.18 ± 0.71 a40.48 ± 0.10 a19.28 ± 4.12 b48.58 ± 4.35 b1.67 ± 0.381.38 ± 0.21
PKA0.70 ± 0.360.32 ± 0.0141.32 ± 0.76 a35.18 ± 3.2 a32.35 ± 6.91 b76.84 ± 6.74 a1.80 ± 0.361.47 ± 0.20
PA0.56 ± 0.300.32 ± 0.0740.58 ± 0.92 a35.81 ± 0.18 a64.16 ± 13.70 a52.91 ± 6.36 b1.80 ± 0.331.52 ± 0.17
PD0.68 ± 0.330.31 ± 0.0740.53 ± 0.80 a37.41 ± 2.16 a81.11 ± 17.32 a47.65 ± 11.52 b1.93 ± 0.221.37 ± 0.23
ST0.63 ± 0.320.27 ± 0.0740.13 ± 1.43 a39.65 ± 1.55 a31.22 ± 6.67 b61.26 ± 9.82 ab1.97 ± 0.421.56 ± 0.26
ANOVA mean square0.060.003356.85525.752109.711416.670.270.10
F value0.710.98290.25176.9720.9025.292.662.61
Significancensns************nsns
Table 4. Result of permutation analysis of variance (PERMANOVA) on changes in the alpha diversity indexes of the bacterial community within treatment and results of PERMANOVA tests on pairwise comparisons between treatments. Pseudo-F and t values of effect sizes are reported; p-values < 0.05 are indicated in bold.
GroupsNumber of ASVH’
Pseudo-F/tp-ValuesPseudo-F/tp-Values
Comparisons between groups0.4060.83653.16560.0194
C−, C+--2.3830.0469
C−, PKA--0.986710.3699
C−, PA--1.82280.0779
C−, PD--2.84060.0153
C−, ST--2.12370.0485
C+, PKA--1.80450.0925
C+, PA--1.06180.3164
C+, PD--0.0978950.9131
C+, ST--0.821970.4327
PKA, PA--1.03730.3519
PKA, PD--2.42780.0179
PKA, ST--1.43780.1907
PA, PD--1.59950.1178
PA, ST--0.399190.7048
PD, ST--1.33910.2205
Table 5. Results of permutation analysis of variance (PERMANOVA) on changes in bacterial community structure (phylum level) between treatments and results of PERMANOVA tests on pairwise comparisons between treatments. Pseudo-F and t-values of effect sizes are given; all the pairwise comparisons were significant at p-values < 0.05. Percentages correspond to the mean dissimilarity in pairwise comparisons between treatments as extracted from SIMPER analysis (Appendix A).
GroupsPERMANOVADissimilarity Percentages (SIMPER Analysis)
Pseudo-F/tp-Values
Comparison between groups4.84550.0001
C−/C+2.5850.007627.71
C−/PA2.52670.009524.97
C−/PD2.62870.008326.12
C−/PKA2.57290.006625.74
C−/ST2.33970.007227.04
C+/PA2.30170.008824.59
C+/PD2.01960.008423.18
C+/PKA2.14650.007723.98
C+/ST1.87220.008724.69
PA/PD2.42630.007923.37
PA/ST1.86390.006822.82
PD/ST1.80120.009322.84
PKA/PA2.10370.007521.57
PKA/PD1.92880.007520.98
PKA/ST1.780.007722.74
Disclaimer/Publisher’s Note: The statements, opinions and data contained in all publications are solely those of the individual author(s) and contributor(s) and not of MDPI and/or the editor(s). MDPI and/or the editor(s) disclaim responsibility for any injury to people or property resulting from any ideas, methods, instructions or products referred to in the content.