Article

Impacts of Farming Activities on Nitrogen Degradability under a Temperate Continental Monsoon Climate

1
Heilongjiang Provincial Key Laboratory of Soil Environment and Plant Nutrition, Heilongjiang Academy of Agricultural Sciences, Harbin 150086, China
2
Agricultural College, Heilongjiang Bayi Agricultural University, Daqing 163319, China
3
Animal Husbandry Research Institute, Heilongjiang Academy of Agricultural Sciences, Harbin 150086, China
*
Authors to whom correspondence should be addressed.
Agronomy 2024, 14(6), 1094; https://doi.org/10.3390/agronomy14061094
Submission received: 12 March 2024 / Revised: 26 April 2024 / Accepted: 20 May 2024 / Published: 21 May 2024
(This article belongs to the Section Agricultural Biosystem and Biological Engineering)

Abstract

:
Nutrient fertilizer application to agricultural land has led to greenhouse gas emissions and has altered soil nitrogen (N) deposition. In soil, N can be degraded in four ways: entering surface water through water flow, absorption by plants and microorganisms, decomposition into gas, and deposition as minerals. This study proposes the concept of N degradability and aims to clarify how farming activities affect N degradability in soil. Over 260 soil profiles were excavated, and the effective soil depth, coordinates, soil types, and vegetation were recorded at each measurement point. The following characteristics were determined in the soil samples: pH, organic matter, total N, total phosphorus, total potassium, total soluble N, available phosphorus, and available potassium. The sample characteristics were subjected to Pearson correlation analysis, principal component analysis, and one-way analysis of variance. The 260 samples included four soil types: dark brown soil, black soil, albic black soil, and meadow soil. Black soil exhibited more stable N levels compared with the other three soil types, showing a tendency towards N accumulation. Ground vegetation was categorized into seven types: forest, rice, maize, red adzuki bean, grassland, soybean, and others. Forests contributed the most to N deposition. Conversely, planting maize led to a tendency for N loss compared with forests. This study can provide a reference for the sustainable development of agriculture and the balance of ecological protection.

1. Introduction

Global greenhouse gas (GHG) emissions have become a major threat to the entire biosphere [1,2,3,4,5]. Carbon dioxide (CO2), methane (CH4), and nitrous oxide (N2O) from farmland are the main contributors to global warming [2]. Fertilizer application to agricultural land has led to GHG emissions [5]. Nitrogen (N) fertilizers are mainly derived from fossil fuels through the synthesis of ammonia, ultimately producing urea [6]. This has resulted in changes in atmospheric N levels, leading to a focus on the impact of soil N deposition in forests [7,8], grasslands [9], and coastal ecosystems [10,11] in recent years.
Soil N pools participate in plant, microbial, and N-transformation-related biological processes that influence GHG emissions [12]. After the application of fertilizers to the soil, N may also enter groundwater, leading to eutrophication [13]. Globally, the top 1 m of the soil contains approximately 95 Pg of N; this layer plays a crucial role in the global N balance and serves as a key node for N deposition [12]. Researchers have found that farming activities on uncultivated land almost always lead to a significant decrease in soil N storage [14,15,16]. Land-use practices determine the total nitrogen (TN) content in the soil, and after agricultural cultivation is abandoned, natural vegetation restoration leads to a significant increase in TN. Specifically, in 0–10 cm of soil, TN is 1.77 mg/g for cropland and 3.01 mg/g for forest; in 10–20 cm, it is 1.24 mg/g and 1.75 mg/g, respectively [12]. There are similar reports, such as the conversion of agricultural land into grassland in Minnesota, USA, which resulted in a 27% increase in TN over a period of 10 years [17].
N deposition can be seen as a passive regulatory response of the soil ecosystem. After N fertilizer is applied, N can be degraded in four ways. These pathways include mineralization and deposition in the soil [18], absorption by plants and microorganisms [1,19,20,21], entering surface water bodies [22], and release into the atmosphere [3,4,5,23]. The amount of N fertilizer needed by the soil ecosystem depends on several factors. On the one hand, appropriate N deposition is a crucial component in stimulating plant growth. N is a key nutrient element for plant growth [24]. N deposition increases N availability in the soil, enhancing plant productivity [13,24,25,26,27]. On the other hand, excessive N deposition can lead to soil acidification [6], salinization [28], and soil compaction [29], all of which negatively impact the ecosystem [6]. Continuous agricultural cultivation and the use of fertilizers can result in the aforementioned problems. Each plant has distinct GHG emissions, and there are variations in these emissions among different types of field crops. These differences are related to their growth environment and root characteristics [30,31], with rice emitting over three times more GHGs than maize [3]. Therefore, this study compared rice and maize. Importantly, N deposition can significantly enhance terrestrial carbon sequestration, contributing to climate change mitigation [7,32].
With reference to the analysis of soil organic carbon (SOC) biodegradability [33], this study proposes N degradability to clarify how farming activities affect N degradability in soil. Total soluble nitrogen (TSN) is the N that plants and microorganisms can directly absorb and utilize [34,35]. The degradability rate is measured by considering the percentage of TSN in TN. A smaller value indicates that N is more likely to be deposited in the soil [7]. This study provides an important reference for the balance between sustainable agricultural development and ecological protection.

2. Materials and Methods

2.1. The Effective Soil Depth and Sample Collection

Two hundred sixty soil profiles were excavated. The effective soil depth, slope, coordinates, soil type, and vegetation of each measurement point were recorded. The effective soil depth is the thickness of the dark surface soil with a high organic matter content. The longitude range for sample collection was 127.0–130.0° E, and the latitude range was 44.0–46.0° N. The sample collection sites are shown in Figure 1. This area has a typical temperate continental monsoon climate with an annual average temperature of 3 °C, an annual effective accumulated temperature of 2300 °C, an annual average precipitation of 570 mm, and a frost-free period of 123 days [36].
At each sampling site, a random location was selected to excavate a soil profile with a width of 1.2 m and a depth of 1.2 m. The excavated profiles were first trimmed, divided according to the soil horizons, and photographed with a scale. Subsequently, soil drilling sampling was conducted within a 50 m radius of the profile point, with 3–5 points sampled to determine the depth of the soil layer. More than 260 soil profiles were excavated, with over 1000 soil drilling sampling points collected. Satellite remote sensing technology was used to create a map of sampling points for each soil layer thickness within the area. Soil cultivation layer samples were collected at a depth of 5–15 cm, while the subsurface horizon layer and parent material layer were not sampled. For fertility measurements, samples were collected by mixing material from five points to obtain 1.50 kg, which was then placed in sample collection bags, dried, sieved through 2 and 0.25 mm sieves, and stored for further analysis.
Based on the soil profile, the soil types were distinguished as dark brown soil, black soil, albic black soil, and meadow soil. The ground vegetation was classified into seven types: forest, rice, red adzuki bean, grassland, soybean, maize, and others. The last category represents land used for growing fruits and vegetables. The fertilization rates were as follows: for maize, 150–180 kg N/ha, 75–90 kg P2O5/ha, and 60–75 kg K2O/ha; for soybean, 40–60 kg N/ha, 50–60 kg P2O5/ha, and 50–60 kg K2O/ha; and for rice, 100–140 kg N/ha, 60–75 kg P2O5/ha, and 60–75 kg K2O/ha.

2.2. Soil Fertility Measurement

For 260 samples, the pH, organic matter, TN, total phosphorus (TP), total potassium (TK), TSN (water-soluble N), available phosphorus, and available potassium were measured. The specific methods followed the agricultural industry standards of the People’s Republic of China (NYT889-2004, NYT1121.2-2006, NYT1121.6-2006, NYT1121.7-2014, and NYT1121.24-2012, LYT228-2015). Specifically, ‘water soluble N’ is quantified as ‘TSN’. For example, according to NYT1121.2-2006, soil pH was determined by weighing 10 g of a soil sample and placing it in a 50 mL beaker. Then, 25 mL of water distilled three times was added and stirred with a stirrer for 1 min, and the pH was measured after standing for 30 min. Additionally, based on research on SOC biodegradability [33], N degradability was determined using the following formula:
N i t r o g e n   d e g r a d a b i l i t y = 100 × T S N T N %

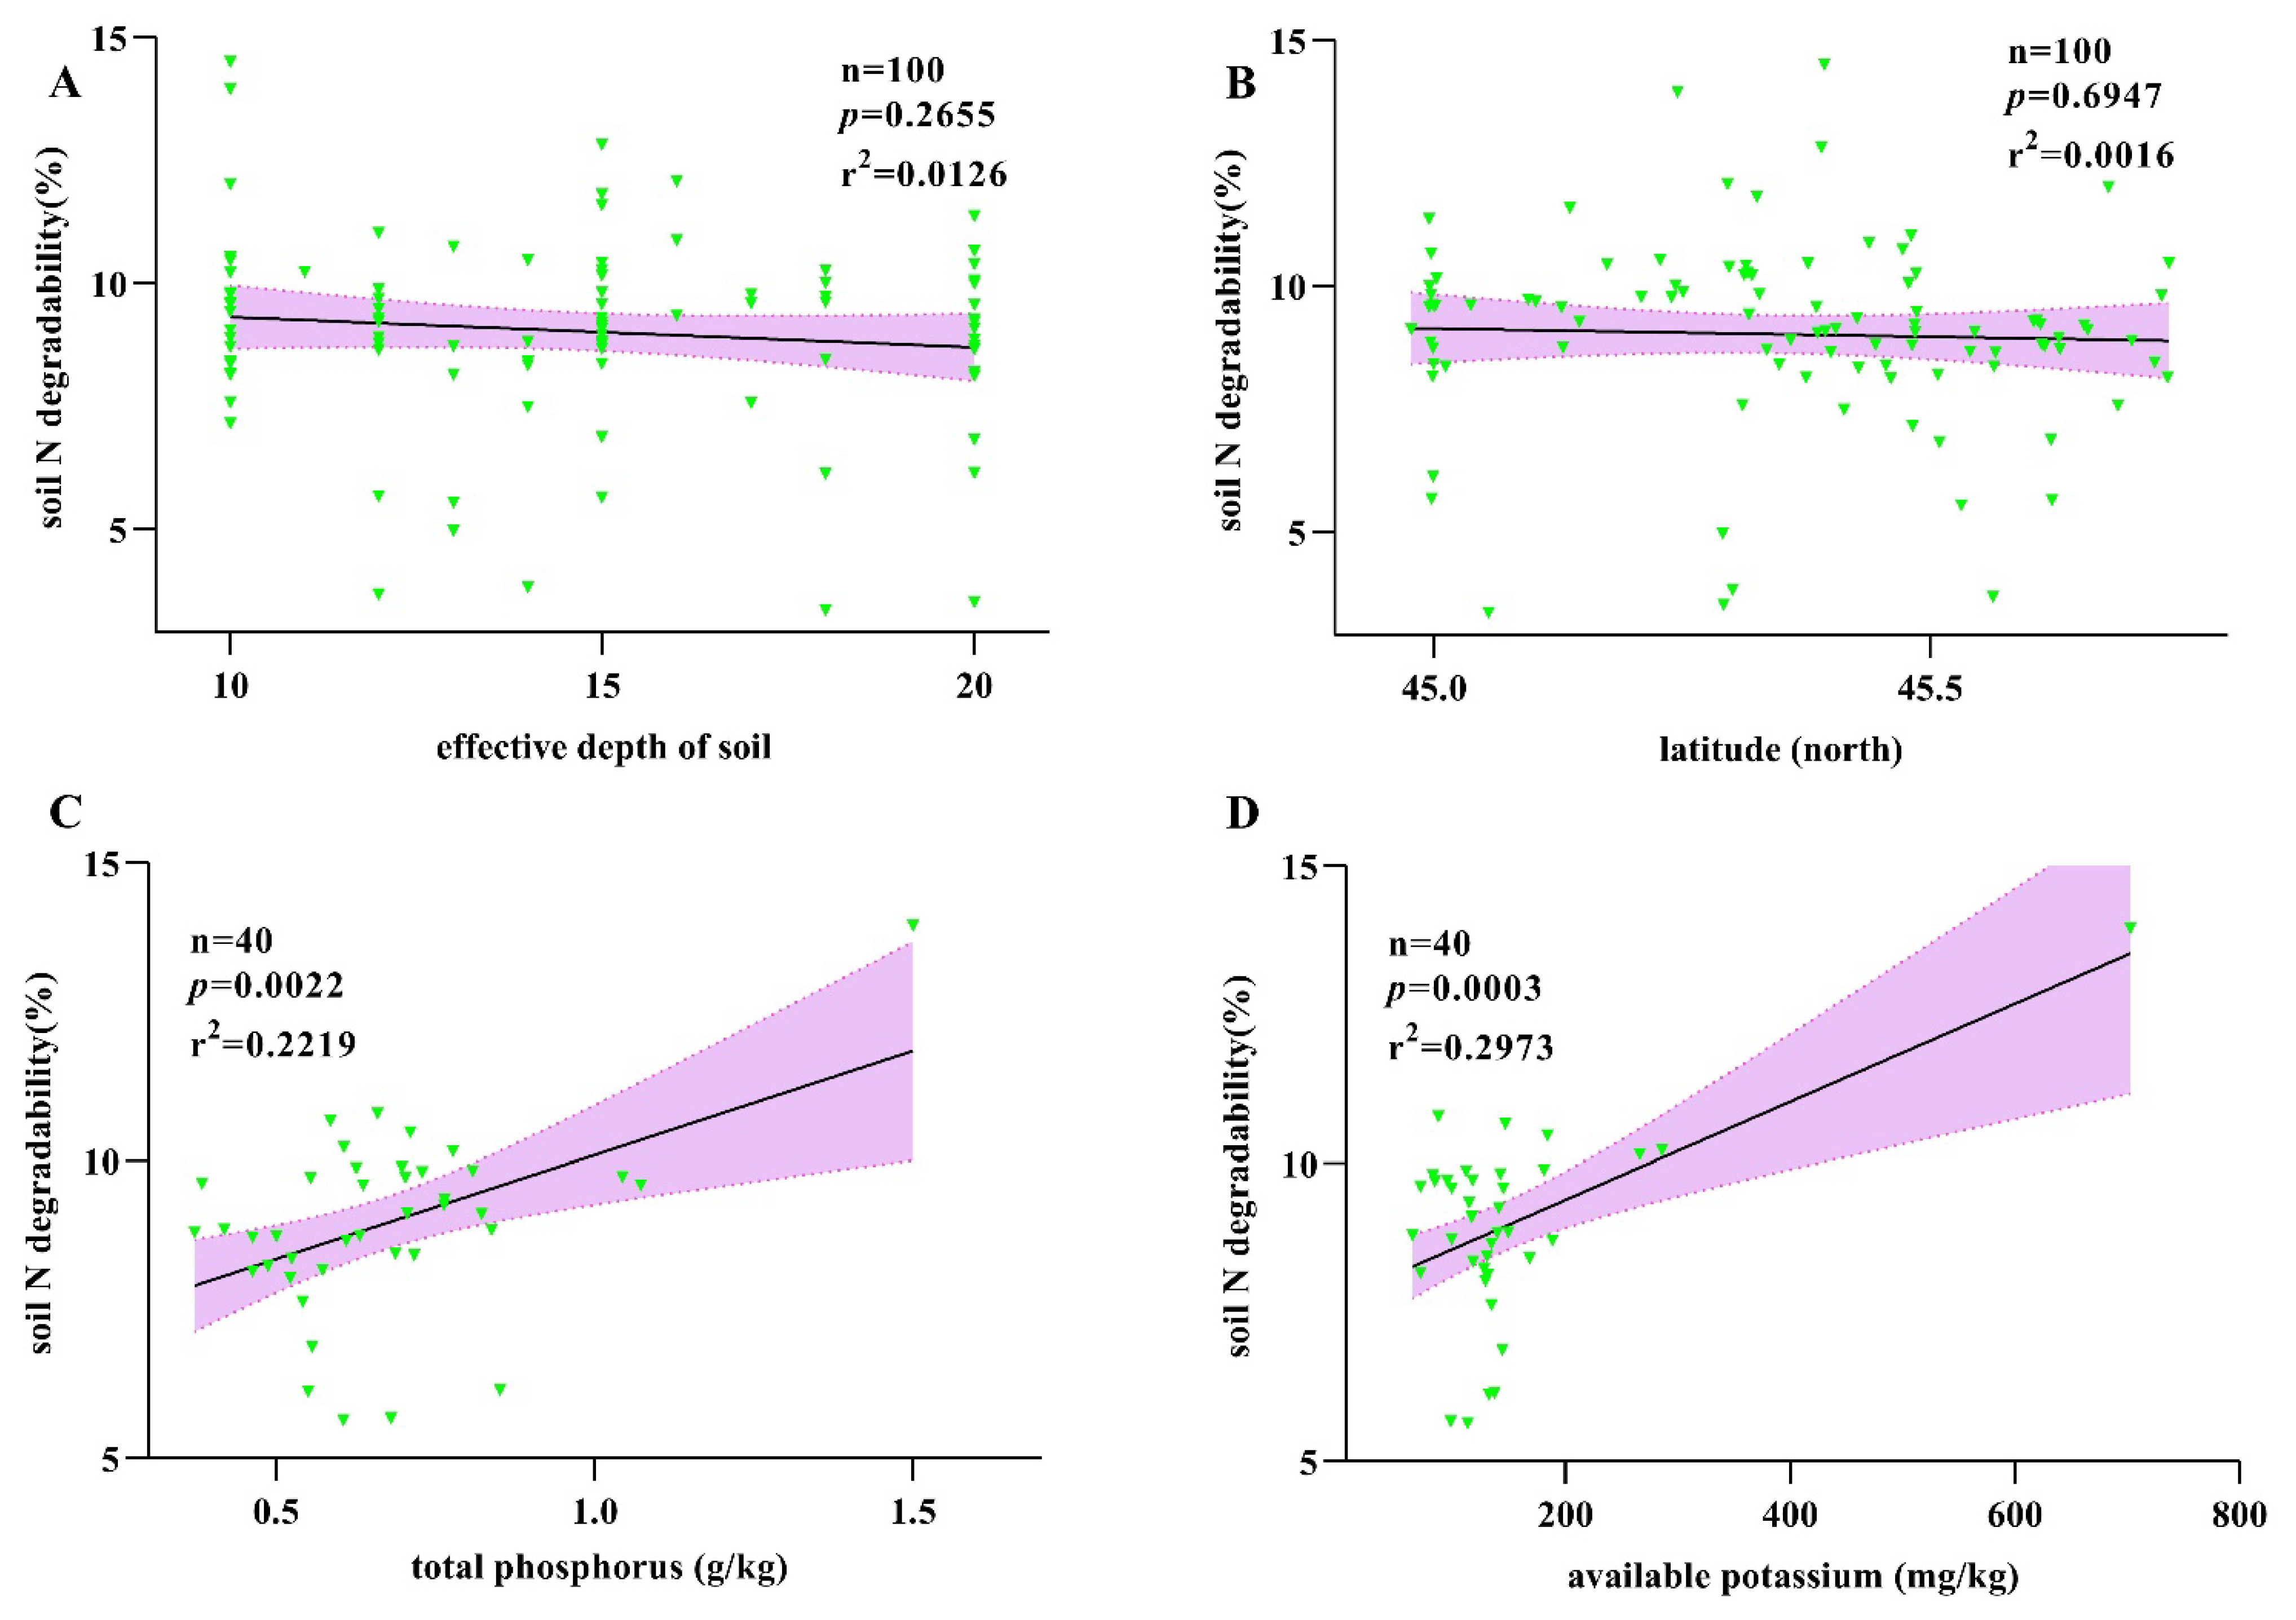
2.3. Correlation Analysis of Soil N Degradability

To minimize the influence of the sample background and for finer classification, 100 soil samples with a thickness of 10–20 cm of albic black soil were selected. The N degradability data were subjected to Pearson correlation analysis with the effective soil depth, latitude, and longitude. Among these 100 samples, 40 were from rice cultivation. For these 40 samples, N degradability was subjected to Pearson correlation analysis with pH, organic matter, TP, TK, available phosphorus, and available potassium. The results are presented with simple linear regression plots, where the R2 value represents the Pearson coefficient.

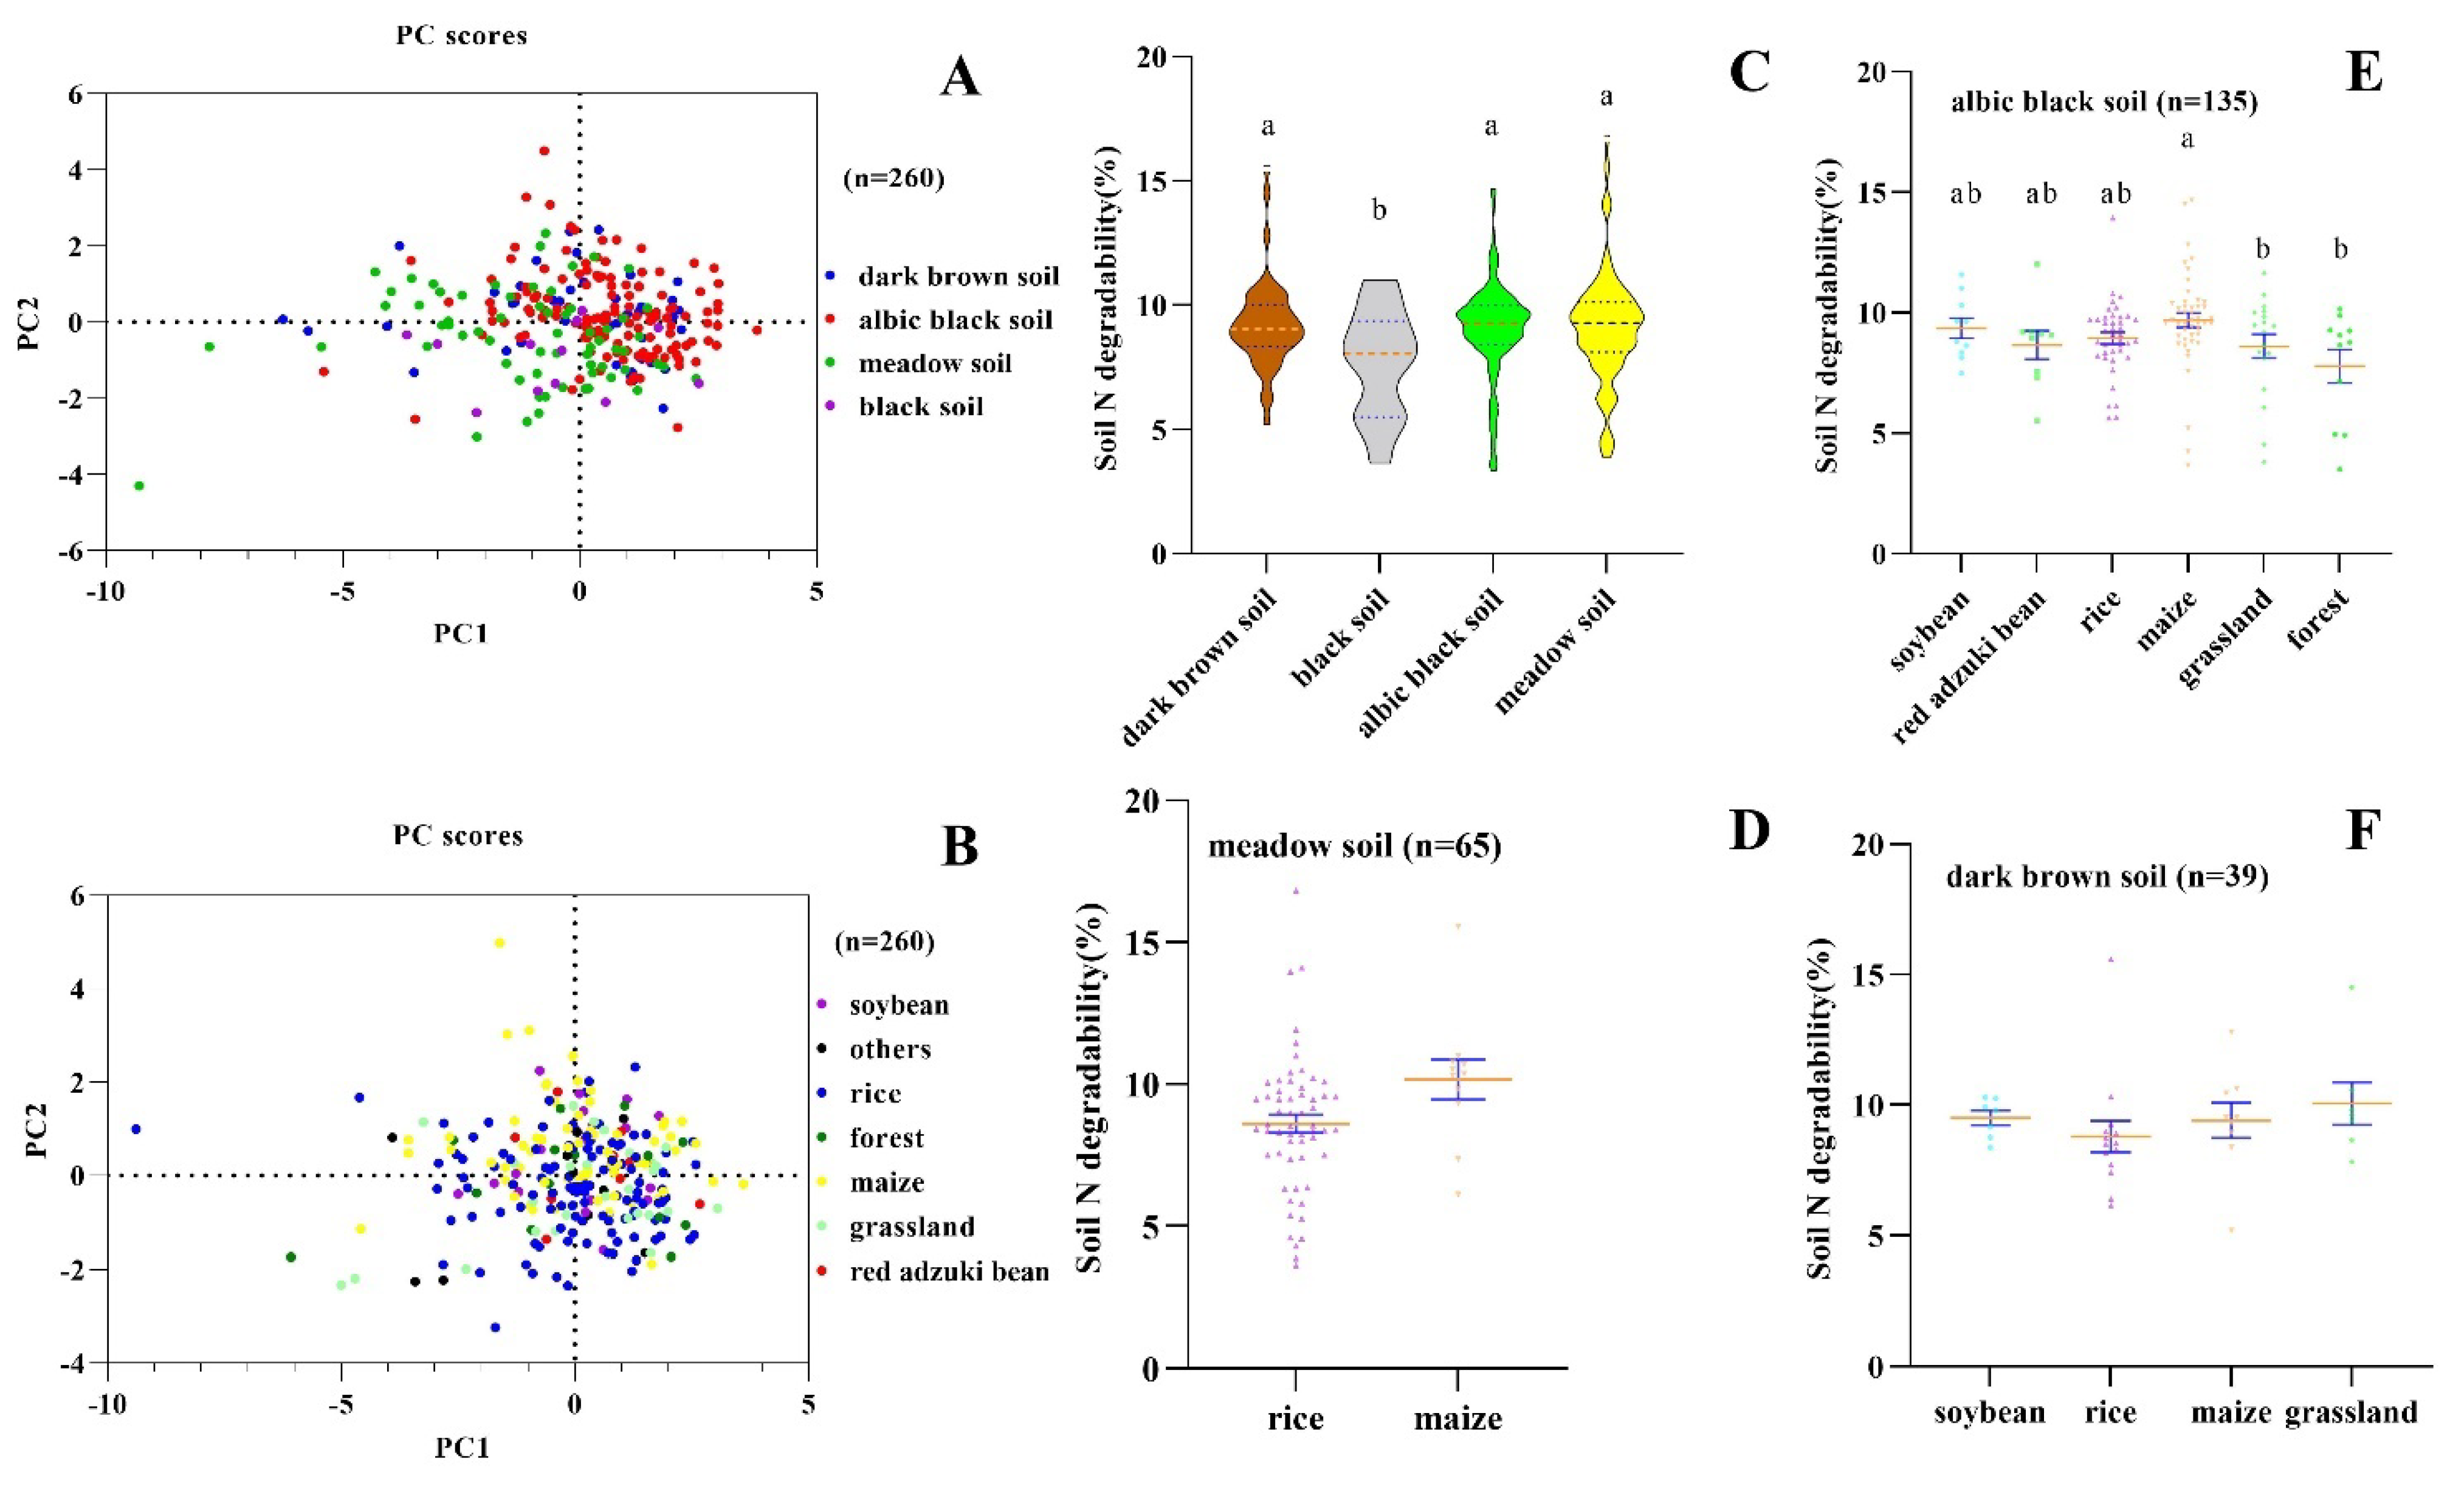
2.4. Principal Component Analysis (PCA) of Soil N Degradability

PCA was performed based on the soil types (dark brown soil, black soil, albic black soil, and meadow soil), with the continuous variables being N degradability, soil depth, latitude, longitude, pH, organic matter, TN, TP, TK, TSN, available phosphorus, and available potassium. PCA was also performed to classify the vegetation types (forest, rice, others, red adzuki bean, grassland, soybean, and maize). The analysis failed to distinguish the categories based on these variables, indicating that the degree of association among the variables could not be detected. Therefore, one-way analysis of variance (ANOVA) was used for comparisons.

2.5. One-Way ANOVA of Soil N Degradability

One-way ANOVA was performed on N degradability based on the soil types (dark brown soil, black soil, albic black soil, and meadow soil). Significant differences in the organic matter content were expected among the different soil types under the same farming conditions. One-way ANOVA was conducted separately for the seven vegetation types (forest, rice, others, red adzuki bean, grassland, soybean, and maize) in different soil types. Prior to the analysis, the N degradability values were arcsine transformed because they were all below 20%. One-way ANOVA analysis was repeated based on the soil depth.

2.6. Statistical Analysis

The effective soil depth was analyzed using ArcGIS (ESRI ArcMap version 10.8). PCA was performed using GraphPad Prism (version 9.3.1). One-way ANOVA was carried out using SPSS Statistics (version 17.0). The figures were prepared using 360 Photo Editor (version 1.0.0).

3. Results

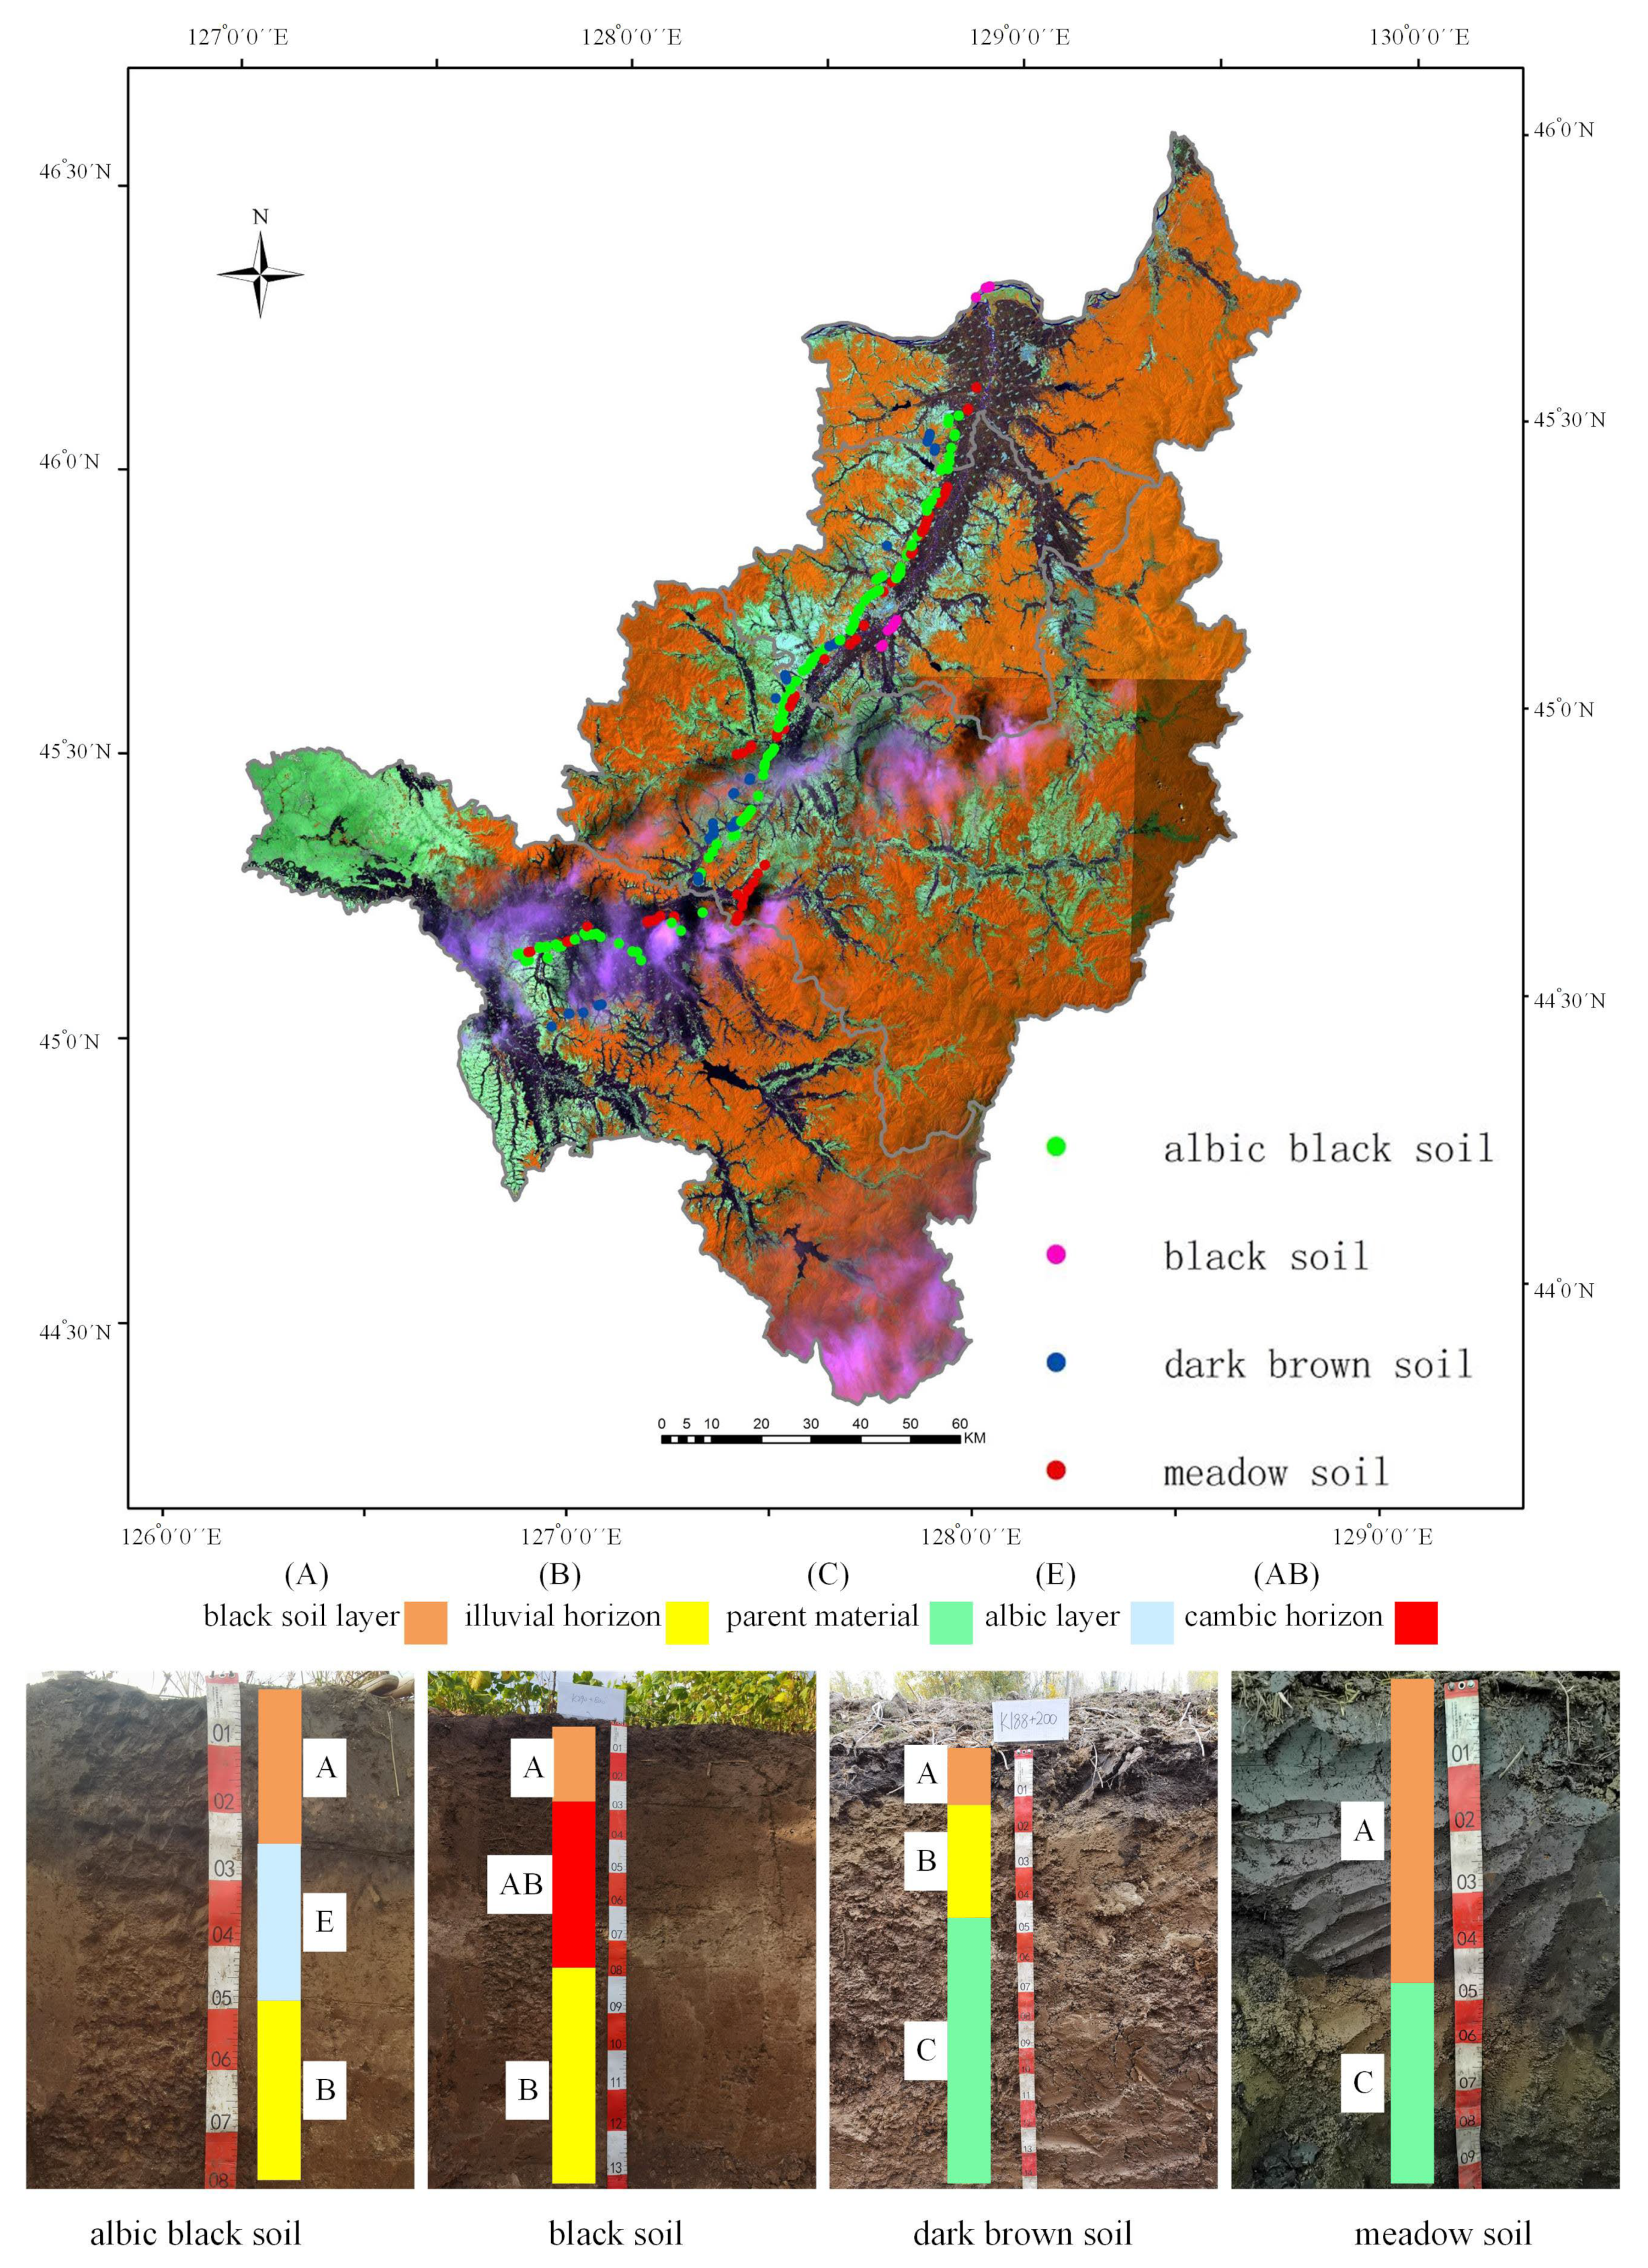
3.1. Recognition of Four Soil Types and the Effective Soil Depth

Table 1 shows the soil properties, including the pH, organic matter, TN, TP, TK, TSN, available phosphorus, and available potassium, for the four soil types. Figure 1 displays the soil profiles, based on which four soil types were identified: dark brown soil, black soil, albic black soil, and meadow soil. Albic black soil was divided into the black soil layer, albic layer, and illuvial horizon layer. Black soil was divided into the black soil layer, cambic horizon layer, and illuvial horizon layer. Dark brown soil was divided into the black soil layer, illuvial horizon layer, and parent material layer. Meadow soil was divided into the black soil layer and the parent material layer. Within the sampling range, the spatial distribution of the effective soil depth and N degradability is shown in Figure 2A and Figure 2B, respectively. The effective soil depth was concentrated in the range of 10–25 cm (Figure 2C), while N degradability was 7.5–12.5% (Figure 2D).
N degradability was analyzed in relation to the effective soil depth, latitude, pH, organic matter, TP, TK, available phosphorus, and available potassium. The effective soil depth (Figure 3A, p = 0.27) and latitude (Figure 3B, p = 0.69) did not correlate with N degradability. Additionally, there was no correlation between N degradability and pH or organic matter. However, soil N degradability correlated with TP (Figure 3C, p = 0.002) and available potassium (Figure 3D, p = 0.0003) in the soil.

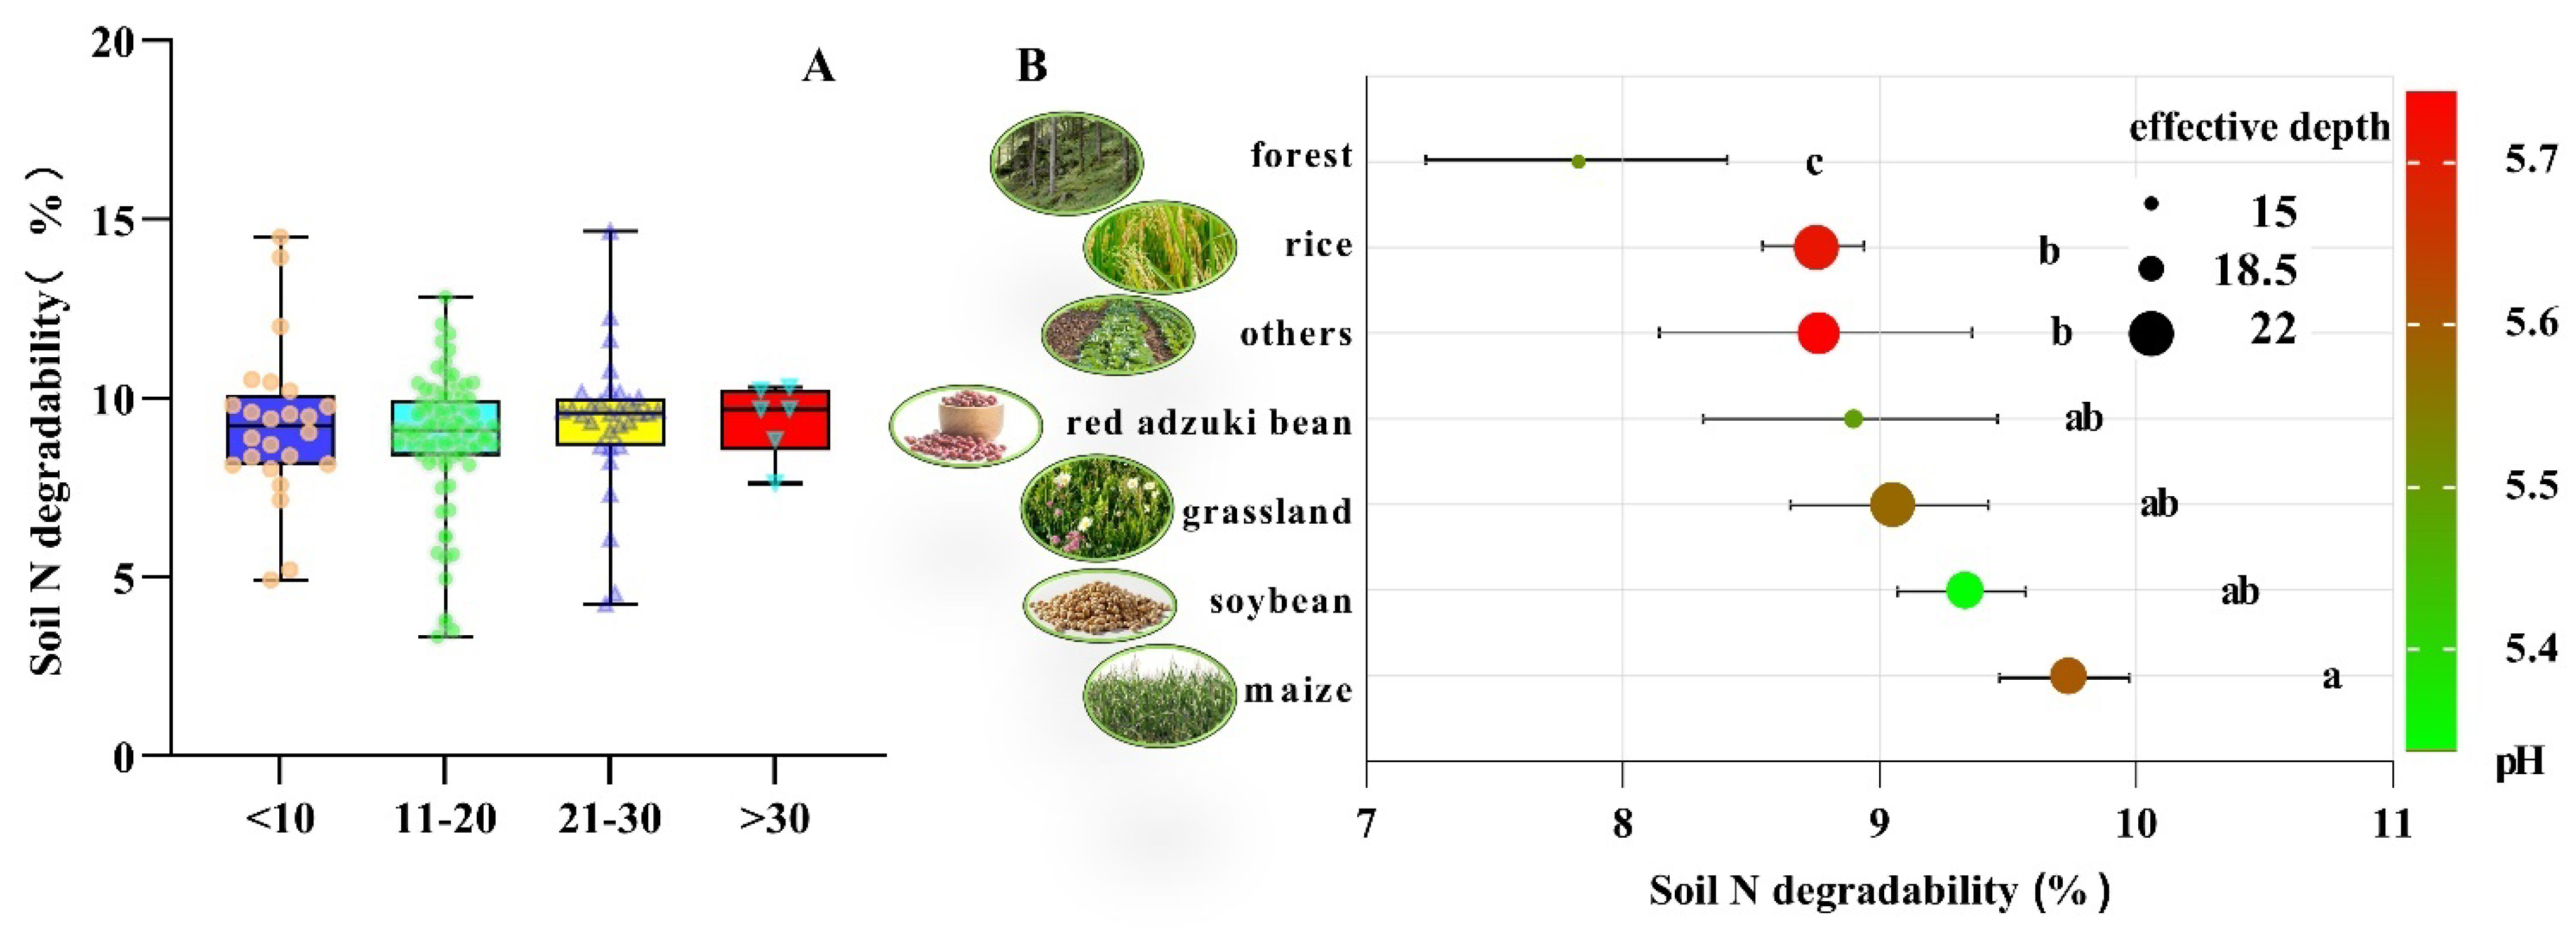
3.2. The Effect of Tillage Activities on Soil N Degradability

The PCAs for different soil and vegetation types are shown in Figure 4A,B, respectively. The soil N degradability did not cluster based on the soil or vegetation type, so the 260 samples cannot be grouped by soil or vegetation type. Only black soil showed significant differences compared with the other soil types (Figure 4C). This finding supports the reason why PCA was unable to group the samples by soil or vegetation type. Interestingly, the analysis of different soil types in Figure 4C revealed that the N degradability of black soil was significantly lower than the other three soil types. This suggests that N in black soil is more stable and shows a tendency towards deposition. The results comparing different plant types in dark brown soil, albic black soil, and meadow soil are described in Figure 4D–F. In albic black soil, after maize was planted, N degradability was significantly higher than in grassland and forest. This indicates that planting maize in albic black soil, relative to uncultivated land, causes N loss.
There were no significant differences in N degradability among the different effective soil depths (Figure 5A). However, the one-way ANOVA for the 260 surface plant samples (Figure 5B) showed that forests had the lowest N degradability, significantly lower than the other vegetation types, suggesting that forests contribute the most to N deposition. Conversely, planting maize caused N to leave the soil cycle.

4. Discussion

For many years, researchers posited that the global N deposition rate has increased continuously [38]. However, with the enhancement of human environmental awareness and the implementation of laws, this is no longer true [39]. Persistent N deposition has led to soil acidification and eutrophication [40]. The soil N cycle includes two main components: N inputs (N deposition, biological N fixation, and litter N return) and N outputs (plant N uptake, gaseous N losses, and hydrological N leaching) [8].

4.1. Ground Vegetation Affects Soil N

The soil N cycle includes soil N deposits in the form of litter on the soil surface, part of which returns to the N cycle in the biosphere, while the other part decomposes and remains stable in the soil matrix over time [41]. These N deposits are ultimately mineralized by soil microbes and deposited in the soil. The N deposition between organic soil and mineral soil is also different under the same vegetation conditions [13]. The results of the present study also indicate that the N degradability of forested soils, based on the analysis of 260 samples, is significantly lower than that of grassland (Figure 5B). However, there was no significant difference in N degradability among dark brown soil, black soil, albic black soil, and meadow soil (Figure 4A,C), which may be due to the high similarity in organic matter content among these four soil types.
In a natural state, vegetation can directly impact N cycling through the absorption, utilization, and loss of N [42]. Depending on the fertility of the soil, vegetation adapts to the environment by regulating its own growth and photosynthetic rates [43]. Plants take atmospheric N, excrete it into the soil through root secretion, and deposit it in the soil in the form of mineral N under the action of N-fixing bacteria. Then, nitrifying bacteria decompose the mineral N into NH4+, which enters the atmosphere or plants [42]. To obtain more N, plants must invest more resources in the production of extracellular enzymes, which in turn leads to slower growth [44]. Different plant species show significant differences in the rate of soil N element mineralization [42]. Interestingly, plants that cannot acquire N in large quantities tend to mobilize rhizosphere microorganisms to obtain more N [45]. In return, microorganisms can access plant roots and secreted enzymes [46]. The present study revealed significant differences in N degradability, with maize having the highest value (Figure 4E and Figure 5B).

4.2. Farming Activities Affect N

During domestication processes, crops may exhibit characteristics of coevolution [21,43,47]. They evolve to meet human demands for yields, often overlooking their own natural fertilizer requirements. Human agricultural cultivation requires the provision of crops with sufficient water and nutrients through cultivation techniques and field management [47]. Not all field management practices are appropriate, as farming activities involve the use of chemical fertilizers, which not only meet the needs of plant growth, but also enter the atmosphere or surface waterbodies. According to the microbial N mining hypothesis, under low soil N conditions, plants and soil microbes use unstable carbon to produce extracellular enzymes, catalyzing the decomposition of soil organic matter to obtain N [42,45,48]. Conversely, the heavy use of N fertilizers makes it easier for plants and microbes to access N sources, potentially accelerating N deposition. The results of the present study indicate that in forests and grasslands that have not been fertilized with N, forest soils have lower N degradability and are more inclined to N deposition (Figure 5B). However, fertilized crops did not show reduced N degradability, meaning that the soils of cultivated crops did not exhibit stronger N deposition, possibly due to appropriate fertilizer use.
Wild leguminous plants have the ability to fix N, possibly because N absorption from the air enhances their photosynthetic capacity and N rhizodeposition [49,50]. Although over 50% of the N requirements of soybeans are met through symbiotic N fixation with rhizobia [51], the present study still applied 40–60 kg N/ha when planting soybeans. There were no significant differences in the N degradability of red adzuki beans and soybeans compared with the other crops (Figure 4E and Figure 5B), which can be attributed to the application of different N fertilizers.
Farming activities also involve tillage methods [52], mixing soil [27,53], and altering soil porosity and permeability [54]. Among the various factors that influence soil N cycling, soil types with higher pH levels are positively correlated with microbial N mineralization and nitrification processes [8]. In this study, N degradability did not correlate with pH; N degradability showed weak correlations with TP and available potassium (Figure 3C,D). This could be because the surface soils of the four soil types used in this study were all similar to black soils.

4.3. Limitations

Rice soils may contain higher levels of gaseous soluble N [5,55]. Some of this N may have been lost during sample transportation, which poses a certain limitation to the accuracy of this experiment. However, N emissions from rice are reported to be less than 6 kg/ha for N2O and less than 300 kg/ha for CH4 [5]. Based on an estimated soil depth of 20 cm during the 130-day rice-growing period, when converted to soil samples, these emissions were much lower than the TSN measured in this experiment. Such experimental errors are acceptable and thus did not affect the overall credibility of the results.
The levels of soluble N are not static; rather, they can vary widely throughout the year. In climatic conditions like those in Heilongjiang Province, the period from November to mid-April of the following year is the frozen period, during which soil samples cannot be obtained. After the temperature rises in the spring each year, entering the sowing period, although sampling is possible, there will be several fertilization and tillage processes to meet the growth needs of the crops from the beginning of sowing to the mid-late stage of crop growth, causing significant soil disturbance. Additionally, to meet the needs of crop growth, fertilization at different times will also affect the soil nutrient levels, leading to large fluctuations in soil nutrients, masking the natural characteristics of the soil, and making the soil unsuitable for on-site soil analysis and sampling. During the autumn crop maturity period, there is no disturbance from fertilization and tillage, the surface returns to its natural state, and the soil’s own nutrients are relatively stable, making it a scientifically reasonable sampling period for soil analysis.

5. Conclusions

There is currently no clear method for measuring N stability in soil. This study referenced the calculation method for SOC biodegradability to propose N degradability as an effective method for assessing N stability in soil. The lower the value of N degradability, the more N tends to be retained in the soil. Additionally, N in black soil was more stable compared with dark brown soil, albic black soil, and meadow soil, indicating a tendency towards N deposition. Agricultural activities lead to the loss of N from the soil system. It is currently unknown whether this lost N enters the atmosphere or the water system. This could be a potential direction for future research.

Author Contributions

Conceptualization, Z.G.; Methodology, Q.W.; Data curation, Q.W., J.Z., Y.L., J.L., X.L., H.Z., F.J. and Q.M.; Writing—original draft, Q.W. and Z.G.; Writing—review & editing, Z.G. All authors have read and agreed to the published version of the manuscript.

Funding

This work was supported by the National Key Research and Development Program of China (grant number 2022YFD1500800) and the Heilongjiang Provincial Scientific Research Business Fund Project (grant number CZKYF2023-1-C004).

Data Availability Statement

Please contact the author for data requests.

Conflicts of Interest

The authors declare no conflicts of interest.

References

  1. Flores, B.M.; Montoya, E.; Sakschewski, B.; Nascimento, N.; Staal, A.; Betts, R.A.; Levis, C.; Lapola, D.M.; Esquivel-Muelbert, A.; Jakovac, C.; et al. Critical transitions in the Amazon forest system. Nature 2024, 626, 555–564. [Google Scholar] [CrossRef] [PubMed]
  2. Shakoor, A.; Shakoor, S.; Rehman, A.; Ashraf, F.; Abdullah, M.; Shahzad, S.M.; Farooq, T.H.; Ashraf, M.; Manzoor, M.A.; Altaf, M.M.; et al. Effect of animal manure, crop type, climate zone, and soil attributes on greenhouse gas emissions from agricultural soils—A global meta-analysis. J. Clean. Prod. 2021, 278, 124019. [Google Scholar] [CrossRef]
  3. Xu, Q.; Dai, L.; Zhou, Y.; Dou, Z.; Gao, W.; Yuan, X.; Gao, H.; Zhang, H. Effect of nitrogen application on greenhouse gas emissions and nitrogen uptake by plants in integrated rice-crayfish farming. Sci. Total Environ. 2023, 905, 167629. [Google Scholar] [CrossRef]
  4. Li, M.; Li, S.; Meng, Q.; Chen, S.; Wang, J.; Guo, X.; Ding, F.; Shi, L. Feedstock optimization with rice husk chicken manure and mature compost during chicken manure composting: Quality and gaseous emissions. Bioresour. Technol. 2023, 387, 129694. [Google Scholar] [CrossRef]
  5. Iboko, M.P.; Dossou-Yovo, E.R.; Obalum, S.E.; Oraegbunam, C.J.; Diedhiou, S.; Brummer, C.; Teme, N. Paddy rice yield and greenhouse gas emissions: Any trade-off due to co-application of biochar and nitrogen fertilizer? A systematic review. Heliyon 2023, 9, e22132. [Google Scholar] [CrossRef]
  6. Wang, Z.; Zhang, X.; Liu, L.; Wang, S.; Wu, X.; Zhang, W.; Zhao, L.; Lu, X.; Zhao, X. Evaluating the effects of nitrogen deposition on rice ecosystems across China. Agric. Ecosyst. Environ. 2019, 285, 106617. [Google Scholar] [CrossRef]
  7. Wang, T.; Zhang, L.; Li, P.; He, H.; Ren, X. Effects of atmospheric nitrogen deposition on carbon allocation and vegetation carbon turnover time of forest ecosystems in China. Agric. For. Meteorol. 2024, 345, 109853. [Google Scholar] [CrossRef]
  8. Ma, T.-Y.; Liu, X.-Y.; Xu, S.-Q.; Guo, H.-R.; Huang, H.; Hu, C.-C.; Wu, D.; Sun, Z.-C.; Chen, C.-J.; Song, W. Levels and variations of soil organic carbon and total nitrogen among forests in a hotspot region of high nitrogen deposition. Sci. Total Environ. 2020, 713, 136620. [Google Scholar] [CrossRef]
  9. Storkey, J.; Macdonald, A.J.; Poulton, P.R.; Scott, T.; Kohler, I.H.; Schnyder, H.; Goulding, K.W.; Crawley, M.J. Grassland biodiversity bounces back from long-term nitrogen addition. Nature 2015, 528, 401–404. [Google Scholar] [CrossRef]
  10. Xie, L.; Gao, X.; Liu, Y.; Yang, B.; Yuan, H.; Li, X.; Song, J.; Zhao, J.; Xing, Q. Atmospheric deposition as a direct source of particulate organic carbon in region coastal surface seawater: Evidence from stable carbon and nitrogen isotope analysis. Sci. Total Environ. 2023, 854, 158540. [Google Scholar] [CrossRef]
  11. Fernandez-Martinez, M.; Penuelas, J.; Chevallier, F.; Ciais, P.; Obersteiner, M.; Rodenbeck, C.; Sardans, J.; Vicca, S.; Yang, H.; Sitch, S.; et al. Diagnosing destabilization risk in global land carbon sinks. Nature 2023, 615, 848–853. [Google Scholar] [CrossRef] [PubMed]
  12. You, Y.; Li, W.; Chen, Y.; Zhang, Q.; Zhang, K. Soil carbon and nitrogen accumulation during long-term natural vegetation restoration following agricultural abandonment in Qingling Mountains. Ecol. Eng. 2024, 201, 107212. [Google Scholar] [CrossRef]
  13. Walton, C.R.; Zak, D.; Audet, J.; Petersen, R.J.; Lange, J.; Oehmke, C.; Wichtmann, W.; Kreyling, J.; Grygoruk, M.; Jabłońska, E.; et al. Wetland buffer zones for nitrogen and phosphorus retention: Impacts of soil type, hydrology and vegetation. Sci. Total Environ. 2020, 727, 138709. [Google Scholar] [CrossRef] [PubMed]
  14. Sheng, W.; Yu, G.; Jiang, C.; Yan, J.; Liu, Y.; Wang, S.; Wang, B.; Zhang, J.; Wang, C.; Zhou, M.; et al. Monitoring nitrogen deposition in typical forest ecosystems along a large transect in China. Environ. Monit. Assess. 2013, 185, 833–844. [Google Scholar] [CrossRef] [PubMed]
  15. Guerrieri, R.; Vanguelova, E.I.; Michalski, G.; Heaton, T.H.; Mencuccini, M. Isotopic evidence for the occurrence of biological nitrification and nitrogen deposition processing in forest canopies. Glob. Chang. Biol. 2015, 21, 4613–4626. [Google Scholar] [CrossRef]
  16. Kosonen, Z.; Thimonier, A.; Schnyder, E.; Thoni, L. Nitrogen concentration in moss compared with N load in precipitation and with total N deposition in Switzerland. Environ. Pollut. 2018, 239, 169–178. [Google Scholar] [CrossRef] [PubMed]
  17. Hernández, D.; Esch, E.; Alster, C.; McKone, M.; Camill, P. Rapid accumulation of soil carbon and nitrogen in restored prairie is not predicted using a chronosequence approach. Soil Sci. Soc. Am. J. 2012, 77, 2029. [Google Scholar] [CrossRef]
  18. McDonough, A.M.; Watmough, S.A. Interactive effects of precipitation and above canopy nitrogen deposition on understorey vascular plants in a jack pine (Pinus banksiana) forest in northern Alberta, Canada. Sci. Total Environ. 2023, 855, 158708. [Google Scholar] [CrossRef] [PubMed]
  19. Ye, H.; Zhao, Y.; He, S.; Wu, Z.; Yue, M.; Hong, M. Metagenomics reveals the response of desert steppe microbial communities and carbon-nitrogen cycling functional genes to nitrogen deposition. Front. Microbiol. 2024, 15, 1369196. [Google Scholar] [CrossRef]
  20. Ochoa-Hueso, R. Nonlinear disruption of ecological interactions in response to nitrogen deposition. Ecology 2016, 97, 2802–2814. [Google Scholar] [CrossRef]
  21. Abdullaeva, Y.; Ratering, S.; Rosado-Porto, D.; Ambika Manirajan, B.; Glatt, A.; Schnell, S.; Cardinale, M. Domestication caused taxonomical and functional shifts in the wheat rhizosphere microbiota, and weakened the natural bacterial biocontrol against fungal pathogens. Microbiol. Res. 2024, 281, 127601. [Google Scholar] [CrossRef] [PubMed]
  22. Lu, G.; Xie, B.; Cagle, G.A.; Wang, X.; Han, G.; Wang, X.; Hou, A.; Guan, B. Effects of simulated nitrogen deposition on soil microbial community diversity in coastal wetland of the Yellow River Delta. Sci. Total Environ. 2021, 757, 143825. [Google Scholar] [CrossRef]
  23. Lafuente, A.; Recio, J.; Ochoa-Hueso, R.; Gallardo, A.; Perez-Corona, M.E.; Manrique, E.; Duran, J. Simulated nitrogen deposition influences soil greenhouse gas fluxes in a Mediterranean dryland. Sci. Total Environ. 2020, 737, 139610. [Google Scholar] [CrossRef] [PubMed]
  24. Renau-Morata, B.; Jimenez-Benavente, E.; Gil-Villar, D.; Cebolla-Cornejo, J.; Romero-Hernandez, G.; Carrillo, L.; Vicente-Carbajosa, J.; Medina, J.; Molina, R.V.; Nebauer, S.G. Arabidopsis CDF3 transcription factor increases carbon and nitrogen assimilation and yield in trans-grafted tomato plants. Plant Physiol. Biochem. 2024, 210, 108607. [Google Scholar] [CrossRef] [PubMed]
  25. Djalovic, I.; Prasad, P.V.V.; Akhtar, K.; Paunovic, A.; Riaz, M.; Dugalic, M.; Katanski, S.; Zaheer, S. Nitrogen Fertilization and Cultivar Interactions Determine Maize Yield and Grain Mineral Composition in Calcareous Soil under Semiarid Conditions. Plants 2024, 13, 844. [Google Scholar] [CrossRef]
  26. Biradar, S.S.; Patil, M.K.; Desai, S.A.; Singh, S.K.; Naik, V.R.; Lamani, K.; Joshi, A.K. Nitrogen use efficiency in bread wheat: Genetic variation and prospects for improvement. PLoS ONE 2024, 19, e0294755. [Google Scholar] [CrossRef] [PubMed]
  27. Gupta, R.K.; Sraw, P.K.; Kang, J.S.; Kaur, J.; Sharma, V.; Pathania, N.; Kalia, A.; Al-Ansari, N.; Alataway, A.; Dewidar, A.Z.; et al. Interactive effects of long-term management of crop residue and phosphorus fertilization on wheat productivity and soil health in the rice-wheat. Sci. Rep. 2024, 14, 1399. [Google Scholar] [CrossRef] [PubMed]
  28. Zhou, M.; Butterbach-Bahl, K.; Vereecken, H.; Bruggemann, N. A meta-analysis of soil salinization effects on nitrogen pools, cycles and fluxes in coastal ecosystems. Glob. Chang. Biol. 2017, 23, 1338–1352. [Google Scholar] [CrossRef]
  29. Yang, L.; Wu, Q.; Liang, H.; Yin, L.; Shen, P. Integrated analyses of transcriptome and metabolome provides new insights into the primary and secondary metabolism in response to nitrogen deficiency and soil compaction stress in peanut roots. Front. Plant Sci. 2022, 13, 948742. [Google Scholar] [CrossRef]
  30. Maier, R.; Hortnagl, L.; Buchmann, N. Greenhouse gas fluxes (CO(2), N(2)O and CH(4)) of pea and maize during two cropping seasons: Drivers, budgets, and emission factors for nitrous oxide. Sci. Total Environ. 2022, 849, 157541. [Google Scholar] [CrossRef]
  31. Saud, S.; Wang, D.; Fahad, S. Improved Nitrogen Use Efficiency and Greenhouse Gas Emissions in Agricultural Soils as Producers of Biological Nitrification Inhibitors. Front. Plant Sci. 2022, 13, 854195. [Google Scholar] [CrossRef] [PubMed]
  32. Fornara, D.; Tilman, D. Soil carbon sequestration in prairie grasslands increased by chronic nitrogen addition. Ecology 2012, 93, 2030–2036. [Google Scholar] [PubMed]
  33. Liu, H.; Wang, J.; Sun, X.; McLaughlin, N.B.; Jia, S.; Liang, A.; Zhang, S. The driving mechanism of soil organic carbon biodegradability in the black soil region of Northeast China. Sci. Total Environ. 2023, 884, 163835. [Google Scholar] [CrossRef] [PubMed]
  34. Hosogoe, Y.; Nguyen-Sy, T.; Tang, S.; Bimantara, P.O.; Sekikawa, Y.; Kautsar, V.; Kimani, S.M.; Xu, X.; Tawaraya, K.; Cheng, W. Five-year vegetation conversion from pasture to C(3) and C(4) plants affects dynamics of SOC and TN and their natural stable C and N isotopes via mediating C input and N leaching. Sci. Total Environ. 2024, 912, 169481. [Google Scholar] [CrossRef] [PubMed]
  35. Fontaine, S.; Abbadie, L.; Aubert, M.; Barot, S.; Bloor, J.M.G.; Derrien, D.; Duchene, O.; Gross, N.; Henneron, L.; Le Roux, X.; et al. Plant-soil synchrony in nutrient cycles: Learning from ecosystems to design sustainable agrosystems. Glob. Chang. Biol. 2024, 30, e17034. [Google Scholar] [CrossRef] [PubMed]
  36. Wang, Q.; Liu, X.; Li, J.; Li, P.; Zuo, X.; Chang, B.; Liu, Y.; Zhang, N.; Yu, H.; Miao, L.; et al. Temporal variation in soil carbon in various paddy soil types in a cold temperate continental monsoon climate. Soil Use Manag. 2023, 39, 122–133. [Google Scholar] [CrossRef]
  37. Shi, X.; Yang, G.; Yu, D.; Xu, S.; Warner, E.D.; Petersen, G.W.; Sun, W.; Zhao, Y.; Easterling, W.E.; Wang, H. A WebGIS system for relating genetic soil classification of China to soil taxonomy. Comput. Geosci. 2010, 36, 768–775. [Google Scholar] [CrossRef]
  38. Peng, Y.; Wang, T.; Chang, R. An increasing trend of inorganic nitrogen deposition across montane regions of China. Atmos. Environ. 2023, 304, 119780. [Google Scholar] [CrossRef]
  39. Gilliam, F.S.; Burns, D.A.; Driscoll, C.T.; Frey, S.D.; Lovett, G.M.; Watmough, S.A. Chapter 12—Responses of forest ecosystems to decreasing nitrogen deposition in eastern North America. In Atmospheric Nitrogen Deposition to Global Forests; Du, E., de Vries, W., Eds.; Academic Press: Cambridge, MA, USA, 2024; pp. 205–225. [Google Scholar]
  40. Liu, X.J.; Xu, W.; Du, E.Z.; Tang, A.H.; Zhang, Y.; Zhang, Y.Y.; Wen, Z.; Hao, T.X.; Pan, Y.P.; Zhang, L.; et al. Environmental impacts of nitrogen emissions in China and the role of policies in emission reduction. Philos. Trans. A Math. Phys. Eng. Sci. 2020, 378, 20190324. [Google Scholar] [CrossRef]
  41. VanZomeren, C.M.; Bhomia, R.K.; Tfaily, M.M.; Inglett, K.S.; Cooper, W.T.; White, J.R.; Reddy, K.R. Influence of vegetation on soil organic nitrogen composition and mineralization in a subtropical wetland. Ecol. Eng. 2024, 200, 107186. [Google Scholar] [CrossRef]
  42. Henneron, L.; Kardol, P.; Wardle, D.A.; Cros, C.; Fontaine, S. Rhizosphere control of soil nitrogen cycling: A key component of plant economic strategies. New Phytol. 2020, 228, 1269–1282. [Google Scholar] [CrossRef] [PubMed]
  43. Maire, V.; Wright, I.J.; Prentice, I.C.; Batjes, N.H.; Bhaskar, R.; van Bodegom, P.M.; Cornwell, W.K.; Ellsworth, D.; Niinemets, Ü.; Ordonez, A.; et al. Global effects of soil and climate on leaf photosynthetic traits and rates. Glob. Ecol. Biogeogr. 2015, 24, 706–717. [Google Scholar] [CrossRef]
  44. Shahzad, T.; Chenu, C.; Genet, P.; Barot, S.; Perveen, N.; Mougin, C.; Fontaine, S. Contribution of exudates, arbuscular mycorrhizal fungi and litter depositions to the rhizosphere priming effect induced by grassland species. Soil Biol. Biochem. 2015, 80, 146–155. [Google Scholar] [CrossRef]
  45. Trap, J.; Bonkowski, M.; Plassard, C.; Villenave, C.; Blanchart, E. Ecological importance of soil bacterivores for ecosystem functions. Plant Soil 2016, 398, 1–24. [Google Scholar] [CrossRef]
  46. Lu, J.; Dijkstra, F.A.; Wang, P.; Cheng, W. Roots of non-woody perennials accelerated long-term soil organic matter decomposition through biological and physical mechanisms. Soil Biol. Biochem. 2019, 134, 42–53. [Google Scholar] [CrossRef]
  47. Fuller, D.Q.; Denham, T.; Allaby, R. Plant domestication and agricultural ecologies. Curr. Biol. 2023, 33, R636–R649. [Google Scholar] [CrossRef]
  48. Fontaine, S.; Barot, S. Size and functional diversity of microbe populations control plant persistence and long-term soil carbon accumulation. Ecol. Lett. 2005, 8, 1075–1087. [Google Scholar] [CrossRef]
  49. Henneron, L.; Cros, C.; Picon-Cochard, C.; Rahimian, V.; Fontaine, S. Plant economic strategies of grassland species control soil carbon dynamics through rhizodeposition. J. Ecol. 2020, 108, 528–545. [Google Scholar] [CrossRef]
  50. Fukudome, M.; Uchiumi, T. Regulation of nitric oxide by phytoglobins in Lotus japonicus is involved in mycorrhizal symbiosis with Rhizophagus irregularis. Plant Sci. 2024, 340, 111984. [Google Scholar] [CrossRef]
  51. Tang, Z.; Wang, X.; Xiang, Y.; Liang, J.; Guo, J.; Li, W.; Lu, J.; Du, R.; Li, Z.; Zhang, F. Application of hyperspectral technology for leaf function monitoring and nitrogen nutrient diagnosis in soybean (Glycine max L.) production systems on the Loess Plateau of China. Eur. J. Agron. 2024, 154, 127098. [Google Scholar] [CrossRef]
  52. Atta-Darkwa, T.; Asare, A.; Asampana, K.A.; Budu, M.; Amerh, A.A.; Kwesi, S.A.; Bessah, E.; Owusu, P.A.; Quansah, A.; Kwasi, E.N.; et al. Effects of varying tillage practices and weed control methods on the efficacy of infiltration models. PLoS ONE 2024, 19, e0293507. [Google Scholar] [CrossRef] [PubMed]
  53. Yin, L.; Lv, Q.; Wang, P.; Xie, H. Changes in the degree of lateral root trait plasticity and trade-offs of maize under long-term no tillage. Front. Plant Sci. 2024, 15, 1345189. [Google Scholar] [CrossRef] [PubMed]
  54. Shiono, K.; Matsuura, H. Exogenous abscisic acid induces the formation of a suberized barrier to radial oxygen loss in adventitious roots of barley (Hordeum vulgare). Ann. Bot. 2024, 133, 931–940. [Google Scholar] [CrossRef] [PubMed]
  55. Matsumoto, K.; Sakata, K.; Watanabe, Y. Water-soluble and water-insoluble organic nitrogen in the dry and wet deposition. Atmos. Environ. 2019, 218, 117022. [Google Scholar] [CrossRef]
Figure 1. Location of the soil samples. The soil sample point is located in the black soil area of Heilongjiang. Soil was collected along a line. There were 260 sampling points. The longitude range for sample collection was 127.0–130.0° E, and the latitude range was 44.0–46.0° N. According to the Genetic Soil Classification of China (GSCC) [37], the samples comprised four soil types: dark brown soil, black soil, albic black soil, and meadow soil. In total, more than 260 soil profiles and over 1000 soil drilling sampling points were excavated.
Agronomy 14 01094 g001
Figure 2. The effective soil depth and spatial distribution of nitrogen (N) degradability. (A) Two hundred sixty samples representing the spatial distribution of the effective soil depth in the area. (B) Two hundred sixty samples representing the spatial distribution of soil N degradability in the area. (C) Histogram of the effective soil depth statistics. (D) Histogram of the soil N degradability statistics. The 260 samples were from four soil types: dark brown soil, black soil, albic black soil, and meadow soil. Satellite remote sensing technology was used to create a map of the sampling points for each soil depth in the area.
Agronomy 14 01094 g002
Figure 3. Correlation analysis of soil nitrogen (N) degradability. (A) Correlation between the effective soil depth and soil N degradability (n = 100). (B) Correlation between latitude and soil N degradability (n = 100). There were 100 samples from land with albic black soil with a soil depth of 10–20 cm. Among these 100 samples, 40 were used to cultivate rice. (C) Correlation between total phosphorus (TP) and soil N degradability (n = 40). (D) Correlation between available potassium and soil N degradability (n = 40). In each graph, the pink area represents the 95% confidence interval.
Agronomy 14 01094 g003
Figure 4. The effects of agricultural tillage on soil nitrogen (N) degradability. (A) Principal component analysis (PCA) of the soil types based on soil fertility. (B) PCA of the vegetation types based on soil fertility. Soil fertility includes soil depth, latitude, longitude, pH, organic matter, total nitrogen, total phosphorus, total potassium, total soluble nitrogen, available phosphorus, and available potassium. (C) Comparative analysis of soil N degradability in dark brown soil, black soil, albic black soil, and meadow soil. Comparative analysis of soil N degradability of different plants in (D) meadow soil, (E) albic black soil, and (F) dark brown soil. Different letters in the graphs indicate significant differences (p < 0.05). The bars represent the standard errors.
Agronomy 14 01094 g004
Figure 5. The effects of the effective soil depth and vegetation on soil nitrogen (N) degradability. (A) Comparative analysis of soil N degradability at different effective soil depths, namely <10, 11–20, 21–30, and >30 cm (n = 100). There were no significant differences. (B) Bubble plot of soil N degradability comparative analysis for different vegetation types (n = 260). The dot colors represent the pH, and the dot sizes represent the effective depth. The black bars represent the standard errors. Different letters in the graph indicate significant differences (p < 0.05). ‘Others’ represents land used to cultivate fruits and vegetables.
Agronomy 14 01094 g005
Table 1. The soil properties.
pHOM (%)TN (g/kg)TP (g/kg)TK (g/kg)TSN (mg/kg)AP (mg/kg)AK (mg/kg)
Dark brown soilMean5.533.311.920.7215.53178.6726.71127.51
SD0.331.841.080.231.38106.4326.3436.82
Albic black soilMean5.592.881.620.6716.25145.6530.80119.80
SD0.381.260.680.191.0062.4722.5665.68
Meadow soilMean5.744.312.190.9415.80201.0028.68168.56
SD0.391.830.840.321.3092.7223.23111.91
Black soilMean5.703.961.981.0315.33155.5518.51136.45
SD0.351.240.590.321.4771.9017.4735.11
AK, available potassium; AP, available phosphorus; OM, organic matter; SD, standard deviation; TK, total potassium; TN, total nitrogen; TP, total phosphorus; TSN, total soluble nitrogen.
Disclaimer/Publisher’s Note: The statements, opinions and data contained in all publications are solely those of the individual author(s) and contributor(s) and not of MDPI and/or the editor(s). MDPI and/or the editor(s) disclaim responsibility for any injury to people or property resulting from any ideas, methods, instructions or products referred to in the content.

