Article

Nanoparticles of Zinc Oxides Mitigated N2O Emissions in Tea Plantation Soil

1
College of Soil and Water Conservation, Nanjing Forestry University, Nanjing 210037, China
2
Tea Research Institute, Chinese Academy of Agricultural Sciences, Hangzhou 310008, China
*
Authors to whom correspondence should be addressed.
Agronomy 2024, 14(6), 1113; https://doi.org/10.3390/agronomy14061113
Submission received: 22 April 2024 / Revised: 13 May 2024 / Accepted: 22 May 2024 / Published: 23 May 2024
(This article belongs to the Special Issue Advances in Soil Fertility, Plant Nutrition and Nutrient Management)

Abstract

:
The excessive application of nitrogen in tea plantations leads to severe soil acidification and N2O emission boosting. To promote sustainable agriculture, nanoparticles (NPs) have emerged as alternative fertilizers, but their effects on soil nitrification and greenhouse gas emissions in tea plantations remain unclear. In this study, the effects of NP type (ZnO-NPs and Fe2O3-NPs) and dose (0, 1, 10, and 100 mg·kg−1) on soil N2O emissions were investigated via a lab incubation trial. Soil pH, ammonium, and nitrate changes were also monitored during the incubation period. The abundance of functional genes related to nitrification and denitrification processes was analyzed as well. The results showed that ZnO-NPs led to a decrease in N2O emissions. The reduction effect was stronger with increasing dose and resulted in a 33% reduction at an addition rate of 100 mg·kg−1. The cumulative N2O emissions had significantly positive correlations with NH4+-N and NO3-N. ZnO-NP addition showed a significantly negative effect on Ammonia-Oxidizing Archaea (AOA) but a positive effect on Ammonia-Oxidizing Bacteria (AOB) gene abundance. In contrast, Fe2O3-NPs showed an insignificant impact on N2O emissions and soil N content, as well as nitrification–denitrification gene abundance, regardless of different doses. These results imply that the application of ZnO-NPs may inhibit nitrification through the retarding of AOA activity. This study provided us with a potential practice to reduce N2O emissions in tea plantations by applying ZnO-NPs, but the efficiency of this reduction needs further examination under ambient conditions before field application.

1. Introduction

Nitrous oxide (N2O) stands out as a potential greenhouse gas, with a long lifespan and a warming potential 273 times higher than that of CO2 and serves as a significant contributor to ozone layer depletion [1]. Average N2O emissions were 17.0 Tg N yr−1 globally during 2007–2016, and human-induced activities accounted for about 43% of the total N2O emissions, while nitrogen fertilization in agriculture contributed 52% of the anthropogenic source strength [2]. Tea plantations always receive a large amount of synthetic N fertilizers to meet yield and quality requirements. N input rates have ranged from 450 to 1200 kg N ha−1 yr−1 during the last decade, which are much higher than those used in cereal crops and commonly cause soil acidification by decreasing the pH by up to 0.45 units [3]. Tea plantations only cover about 0.3% of global crop land, but they were estimated to contribute 46.5 Gg N yr−1 to direct global fertilizer-induced N2O emissions during the last decade [4]. The index describing fertilizer-induced N2O emission intensity, direct N2O emission factor (EFd, %), linearly increased with the N application rate (increased by 0.3% per 100 kg N ha−1), which is estimated to be 2.31% on average, much larger than 1%, which is the IPCC default value, making tea plantations hotspots of agricultural N2O emissions [5]. This highlights the urgent need for measures to mitigate N2O emissions in tea plantations.
Nanoparticles (NPs), e.g., oxides of Zn and Fe, have emerged as novel fertilizers that can increase N use efficiency via synergistic interactions. They have attracted considerable attention and have been widely used across various fields due to their unique properties and efficient nutrient release mechanisms related to their nanoscale dimensions, e.g., they are slow-releasing and have higher infiltration capacity and strong antimicrobial properties [6,7]. N2O emissions from soils are primarily produced via the processes of nitrification and denitrification [8,9]. It has been reported that the presence of metal NPs, e.g., Cu and Ag, in soil environments affects the activity of both nitrifying and denitrifying bacteria [10,11], but whether nanoparticles of Zn or Fe oxides could affect nitrification is still unclear. Exposure to ZnO-NPs can diminish soil microbial activity associated with N cycling and N mineralization efficiency, which may ultimately indirectly reduce N2O emissions via the inhibition of the denitrification process, especially in anaerobic environments, like in wastewater treatment plants [12]. In biological N removal systems, N2O emissions crease due to the reduction in the ratio of NO2/NO and the expressions of denitrification-related genes, e.g., copper-containing nitrite reductase (nirK), cytochrome cd1-containing nitrite reductase (nirS), cytochrome c-dependent nitric oxide reductase (norB), and nitrous oxide reductase (nosZ) after a short exposure to ZnO-NPs [13]. Although the above studies demonstrated the negative effect of NPs on soil N2O emissions concerning the toxicity to associated microbes in anaerobic environments, whether NPs can take effect in tea plantations is still unknown since nitrification is considered to be the main pathway in tea plantation soil [14].
In the present study, we investigate the effects of nanoparticle type and dose on soil N2O emissions on tea plantation soils. The objective is to verify whether ZnO and Fe2O3 NPs can both reduce N2O production in acidic soils. According to the previous literature, two hypotheses were generated: (1) nanoparticles of zinc and iron oxides have the same effect in regulating soil N2O emissions since they have similar toxicities in relation to soil microbes; (2) nanoparticles may not have an effect on reducing N2O emissions since the greatest reduction was found in an anaerobic environment, but it was dominated by nitrification rather than denitrification in tea plantation soil.

2. Materials and Methods

2.1. Study Site and Soil Sampling

The soil used for the experiment was collected from a typical tea plantation field located in the Experimental Station of the Tea Research Institute of the Chinese Academy of Agricultural Sciences (TRI-CAAS) in the Zhejiang Province of China (120°49′ E, 29°45′ N). This region falls within the subtropical monsoon region, characterized by a mild climate with distinct seasons and abundant rainfall. The annual average temperature in Shengzhou City ranges from 12.6 to 17.6 °C, with an annual precipitation of 1446.8 mm. The area receives an average of 1987.9 h of sunlight annually, has a frost-free period lasting 235 days per year, and the soil type is clay red soil.
In the tea plantation, three pots of soil from the same type of tea tree were randomly selected, with random locations representing three replicates. For each pot of soil, after removing the roots, stones, and other impurities, the three soil samples were mixed evenly to form a composite sample. The fresh soil samples were passed through a 2 mm sieve and stored in plastic bags at 4 °C for less than two weeks before the incubation experiment. The soil collected before the experiment had a loam texture, with 10.7% sand, 40.8% silt, and 46.5% clay. The soil properties were as follows: 3.85 pH, 5.59 g·kg−1 of soil organic carbon (SOC), 1.26 g·kg−1 of total nitrogen (TN), 1.35 g·kg−1 of total phosphorus (TP), 7.26 g·kg−1 of total potassium (TK), 6.35 mg·kg−1 of available nitrogen (AN), 1.04 mg·kg−1 of available phosphorus (AP), and 208 mg·kg−1 of available potassium (AK).

2.2. Aerobic Incubation Trial

The experiment was conducted using 7 different treatments, including two different NP types and three doses. The studied NPs were ZnO and Fe2O3, and each were studied at 3 different doses, namely 1, 10, and 100 mg kg−1, representing low, medium, and high concentrations, respectively. There was also a treatment without any NP addition as a control (CK). Each treatment was conducted with 28 replicates, of which 4 were assigned to gas sampling and 24 to six soil analyses during the incubation.
The aerobic incubation was conducted using 250 mL flasks. Each flask contained 20 g of soil (oven-dried basis), which was then pre-incubated for seven days at 25 °C with a 60% water-holding capacity (WHC). After pre-incubation, 1 mL of (NH4)2SO4 with 100 mg N L−1 in concentration, amounting to 40 kg N ha−1 (lower than the N rates found in field practice; about half of the top-dressing rate found in the field), was added to each flask via surface spreading and then evenly mixed. Then, different NPs were evenly added to the soil surface in the flasks according to the experiment design. The final soil moisture was adjusted to a 60% water-holding capacity (WHC) via the addition of deionized water. After that, all flasks were put in an incubator with an inner temperature of 25 °C for 28 days in the dark. During the incubation, the soil moisture was maintained by adding deionized water every 3 or 4 days according to the weight loss determined after weighing the flasks.
The ZnO-NPs and Fe2O3-NPs (maghemite) used in this study had pH of 7.69 and 8.15 and contained 80.8% Zn and 68.5% Fe, respectively. All of the NP products were purchased from Shanghai Aladdin Bio-Chem Technology Co., Ltd. (Shanghai, China) The shape and size of the NPs were determined using transmission electron microscopy (TEM) before further incubation trials. According to TEM, most NPs exhibited a spherical morphology, with an average particle size of 50 nm.

2.3. Sampling

At 3, 5, 7, 10, 14, and 28 days after the addition of NPs, 4 replicates from each treatment were taken out and all soil (~20 g) in the flasks was extracted with 100 mL of 2 mol L−1 KCl by shaking at 250 rpm for 1 h at 25 °C. The extracts were filtered through quantitative filter papers and stored at 4 °C before determining the soil pH and contents of NH4+ and NO3.
Gas samples were collected at 1, 3, 5, 7, 10, 14, 21, and 28 days after the beginning of incubation. Before each gas sampling, the flasks were equilibrated with the ambient conditions using a vacuum pump. Afterward, the flasks were sealed for 24 h with a septum, and then ~20 mL of gas was collected into an 18 mL glass vial using a 50 mL syringe.

2.4. Soil Analysis and N2O Measurement

Soil sand, silt, and clay fractions were determined using a particle analyzer (Mastersizer 3000, Malvern, UK). Soil total N and total C contents were measured using a C/N elemental analyzer (Vario MACRO Cube, Elementar, Langenselbold, Germany).
Soil pH was measured using a digital pH meter (Orion Star A211, ThermoFisher, Waltham, MA, USA). The concentrations of NH4+-N and NO3-N in the soil extracts were determined using an automatic chemistry analyzer (SmartChem 140, Westco Scientific Instruments, Brookfield, CT, USA).
Soil total P and total K were digested using a microwave disintegrator (MARS 6, CEM, Matthews, NC, USA) and then determined using an inductively coupled plasma atomic emission spectroscopy analyzer (ICP-AES). Available P and K were extracted via Mehlich 3 and then determined using ICP-AES (iCAP 6000, ThermoFisher, Waltham, MA, USA).
The nitrous oxide concentration was determined via gas chromatography (GC7890B, Agilent, Santa Clara, CA, USA). The gas in the glass vial was injected into the gas chromatograph by the autosampler (CA-6, Jiangbo Corp., Laiyang, China) with program-controlled switches and electromagnetic valves. The N2O in the gas samples was separated from other compounds by using a 2 mm (inner diameter) stainless steel column that was 3 m in length and packed with Porapak Q (80/100 mesh). The column temperature was maintained at 55 °C, and the carrier gas was pure nitrogen gas (99.999%) at a flow rate of 30 mL min−1, which was used to ensure robust separation. The signal strength of the N2O component in the gas flow was detected using an electron capture detector (ECD) at 300 °C. The concentration of N2O in the gas sample was determined by scaling the signal using pre-mixed reference gases with known concentrations.

2.5. Soil DNA Extraction and Gene Abundance Quantification

On day 28, when the incubation was complete, soil samples were also collected for soil DNA extraction using a DNA isolation Kit (PowerSoil, MoBio, Beijing, China). The DNA content in the extracts was determined using a UV-VIS spectrophotometer (NanoDrop 2000, ThermoFisher, Waltham, MA, USA).
The abundance of genes encoding Ammonia monooxygenase (amoA), nitrite reductase (nirK and nirS), and N2O reductase (nosZ) was amplified using different primers and PCR conditions (Table 1). qPCR amplification was performed on a fluorescent quantitative PCR instrument (ABI 7500, ThermoFisher, Waltham, MA, USA). The total volume of the reaction system was 20 μL, including 10 μL of Go Taq qPCR master mix, 0.4 μL of forward and reverse primers (10 μM), and 1 μL of template DNA.

2.6. Emission Calculation and Statistical Analysis

The N2O emission rate was calculated as follows:
F = C t C 0 t × M × P R × ( T + 273.15 ) × V W × 24 × 10 3
where F is the gas emission rate (N2O, μg·N·kg−1·day−1), Ct and C0 are the N2O concentration (ppbv) after and before the sealing of the flask, t is the sealing duration (hours), M is the molecular weight of N2O (28 g N mol−1), P is the atmospheric pressure (10,135 Pa), R is the universal gas constant (8.314 Pa·m3 mol−1 K−1), V is the effective volume of the flask (mL), T is the incubation temperature (°C), and W represents the mass of incubated soil (kg). The number 24 and 10−3 are the conversion factors for units.
The cumulative N2O emission was calculated by integrating daily N2O emission rates by intervals.
Two-way ANOVAs were used to compare the effects of NP type, dose, and their interactions on N2O emissions, as well as soil pH, NH4+, and NO3. Multi-comparison post hoc tests were carried out using Tukey’s honest significant difference (HSD) test, at a significance level of p < 0.05 after the ANOVA. Regression analysis was used to examine the relations between accumulated soil N2O emissions and pH, NH4+, and NO3. All of the statistical analyses were performed using IBM SPSS Statistics 24.0 statistic software.

3. Results

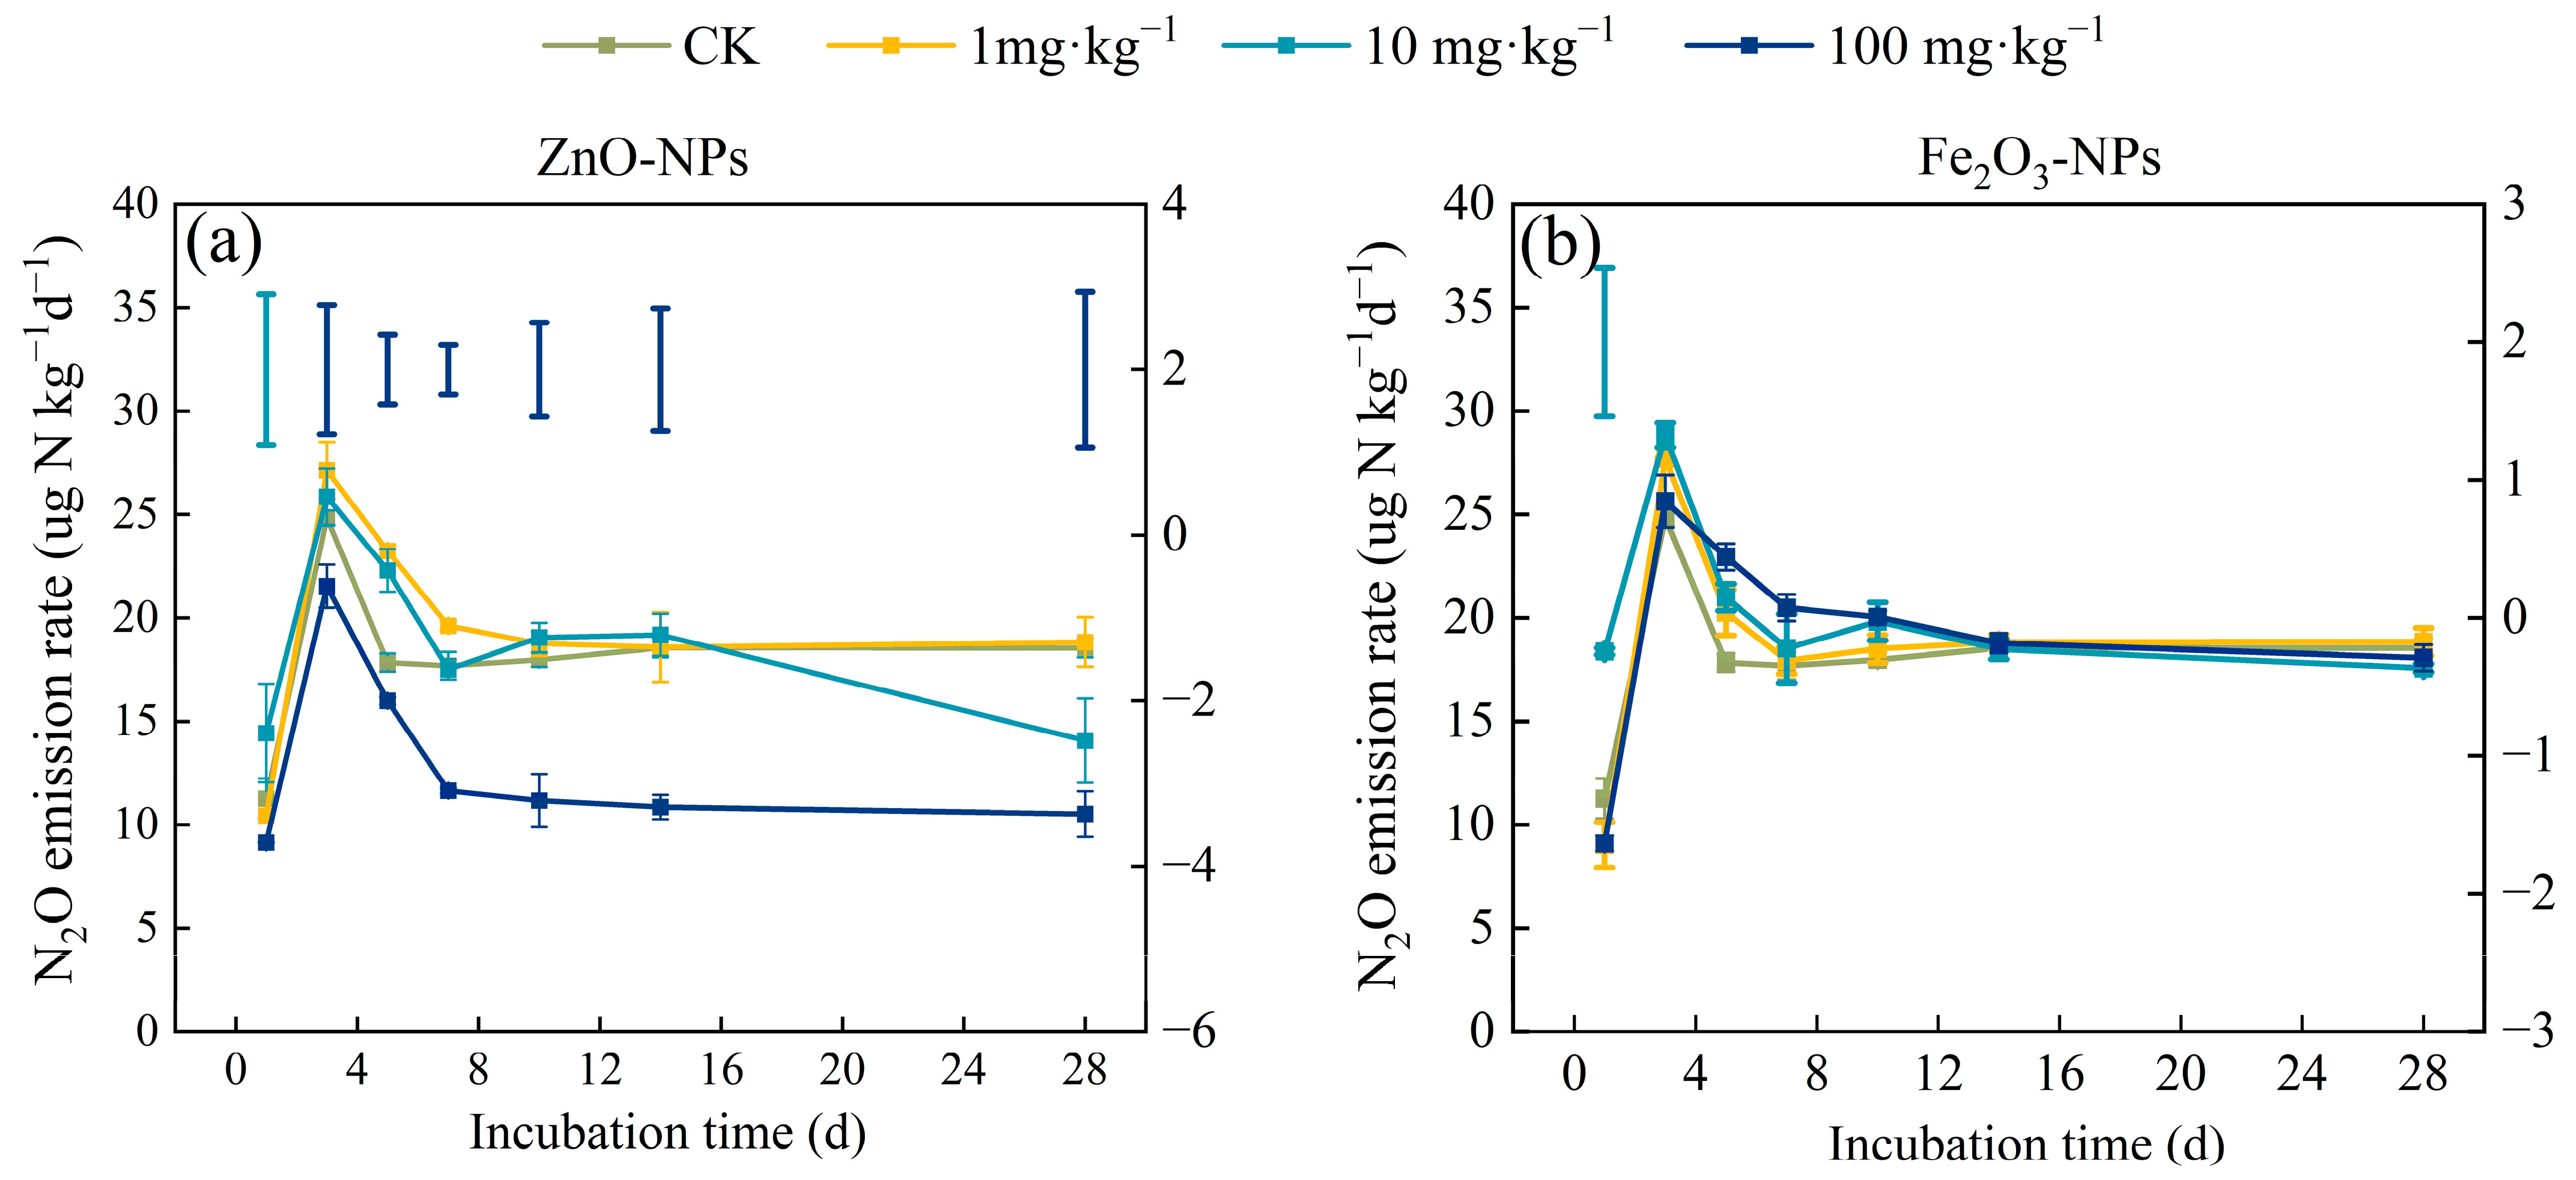
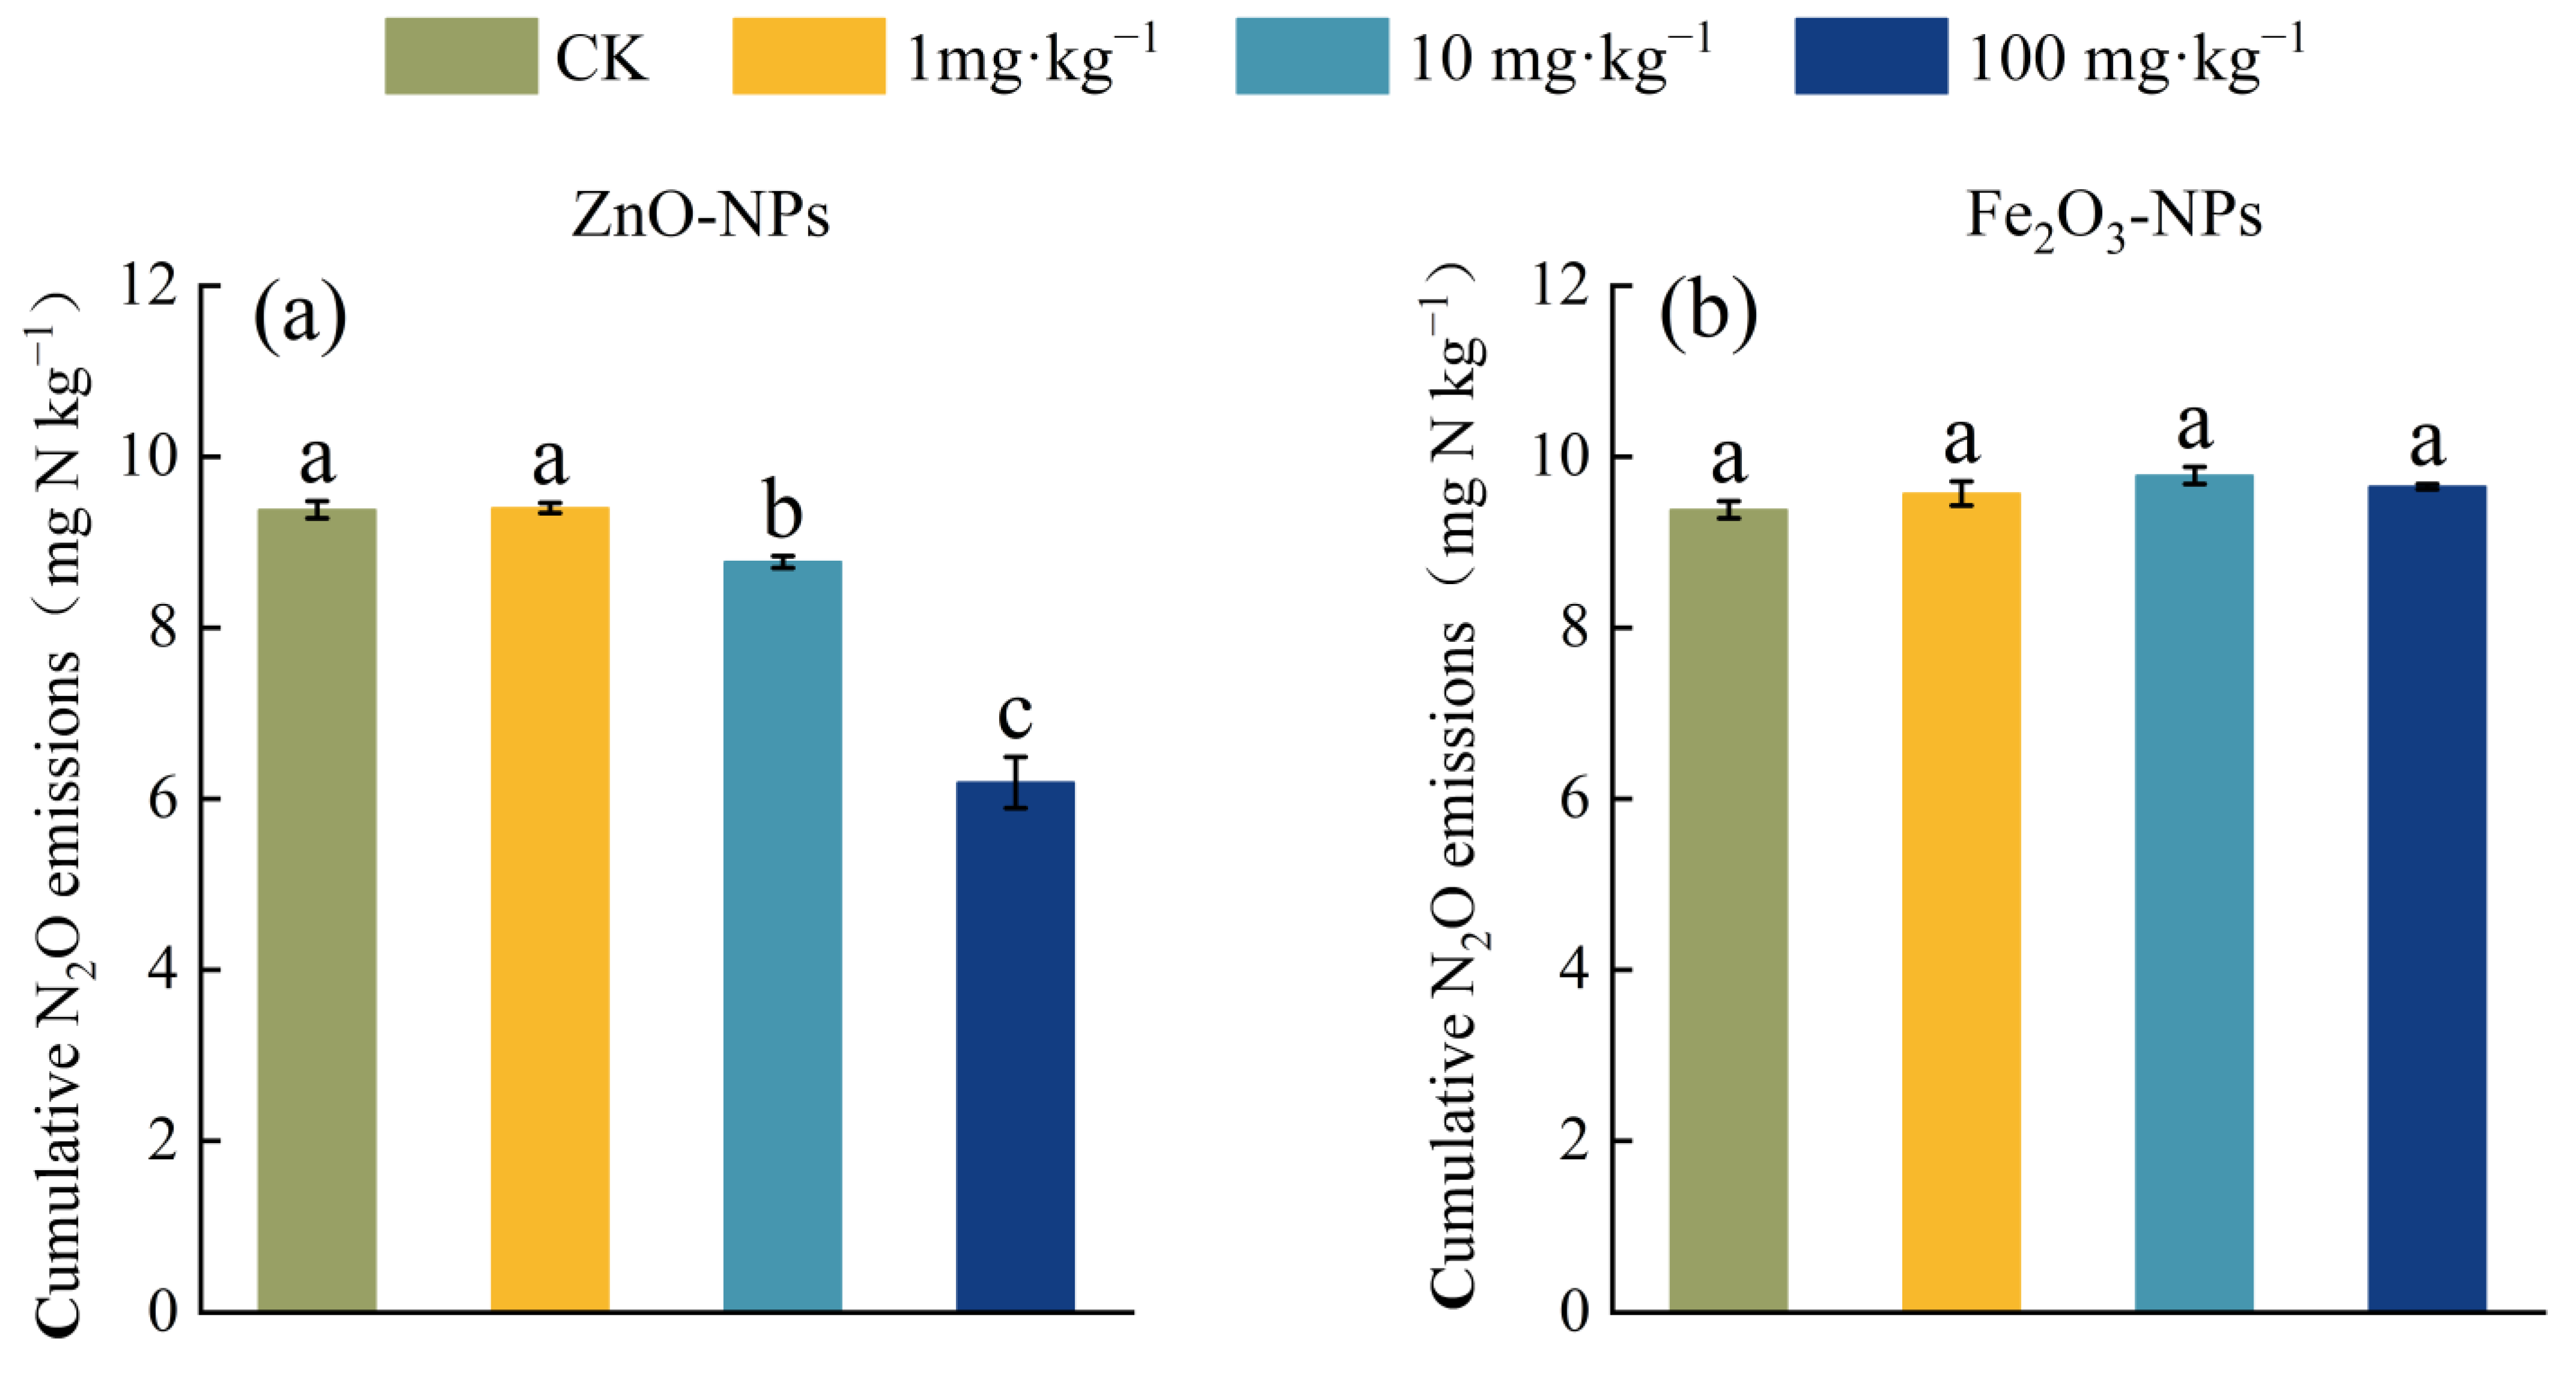
3.1. Soil N2O Emission

Under aerobic conditions, all of the treatments showed that the N2O emission rate peaked on the 3rd day and thereafter decreased during the 28-day incubation period (Figure 1). Compared with CK, the addition of 1 mg·kg−1 of ZnO-NPs showed an insignificant difference during the incubation period. However, the addition of 100 mg·kg−1 of ZnO-NPs exhibited significantly lower emission rates throughout the whole incubation period, except for day 1 (Figure 1a). The addition of 10 mg·kg−1 of ZnO-NPs only showed a significant difference with CK on day 1, 7, and 28. In the Fe2O3-NPs treatment, a significant difference between CK and NPs was only observed on day 1 in the treatment of 10 mg·kg−1 Fe2O3-NPs, which increased the N2O emission rate from 11 to 18 μg N kg−1 d−1. Thereafter, the difference in the emission rates between the treatments was small (Figure 1b).
During the 28-day incubation period, the cumulative N2O emission without the addition of NPs in CK was 9.38 mg N kg−1. Compared with CK, the addition of 1 mg kg−1 of ZnO-NPs showed an insignificant difference in cumulative N2O emissions, while 10 and 100 mg kg−1 ZnO-NPs significantly decreased the cumulative N2O emissions by 4% and 33%, respectively (Figure 2a). It seems that the inhibitory effect became stronger with higher ZnO-NPs concentration. On the contrary, despite the changes in concentration, the addition of Fe2O3-NPs did not show a significant effect on the cumulative N2O emissions, even if it showed a slight increase with higher Fe2O3-NPs concentrations (Figure 2b).

3.2. Changes in Soil pH and Inorganic N

Soil pH in CK gradually decreased from 3.62 to 3.45 during the 28-day incubation period, while it showed an increasing trend at first and then decreased gradually in the treatments where NPs were added (Figure 3). The highest pH of 3.69 was observed in the high-concentration treatment of ZnO-NPs (100 mg kg−1) on day 7 (Figure 3a). A similar pH change pattern could also be found in the case of Fe2O3-NPs (Figure 3b). However, the differences between Fe2O3-NPs and CK were much smaller than those seen in the ZnO-NP treatment. With NP concentrations from 0 to 100 mg kg−1, soil pH also tended to increase, regardless of NP type.
In all treatments, the contents of soil NH4+-N and NO3-N showed decreasing and increasing patterns during the incubation period. Significantly higher contents of soil NH4+-N were observed, with the ZnO-NP concentration increasing from 0 to 100 mg kg−1 throughout the entire incubation period (Figure 3c). Simultaneously, the contents of soil NO3-N became lower with increasing ZnO-NPs concentration (Figure 3e). In contrast, the contents of soil NH4+-N and NO3-N did not exhibit significant changes with the addition of Fe2O3-NPs during the incubation period (Figure 3d,f).

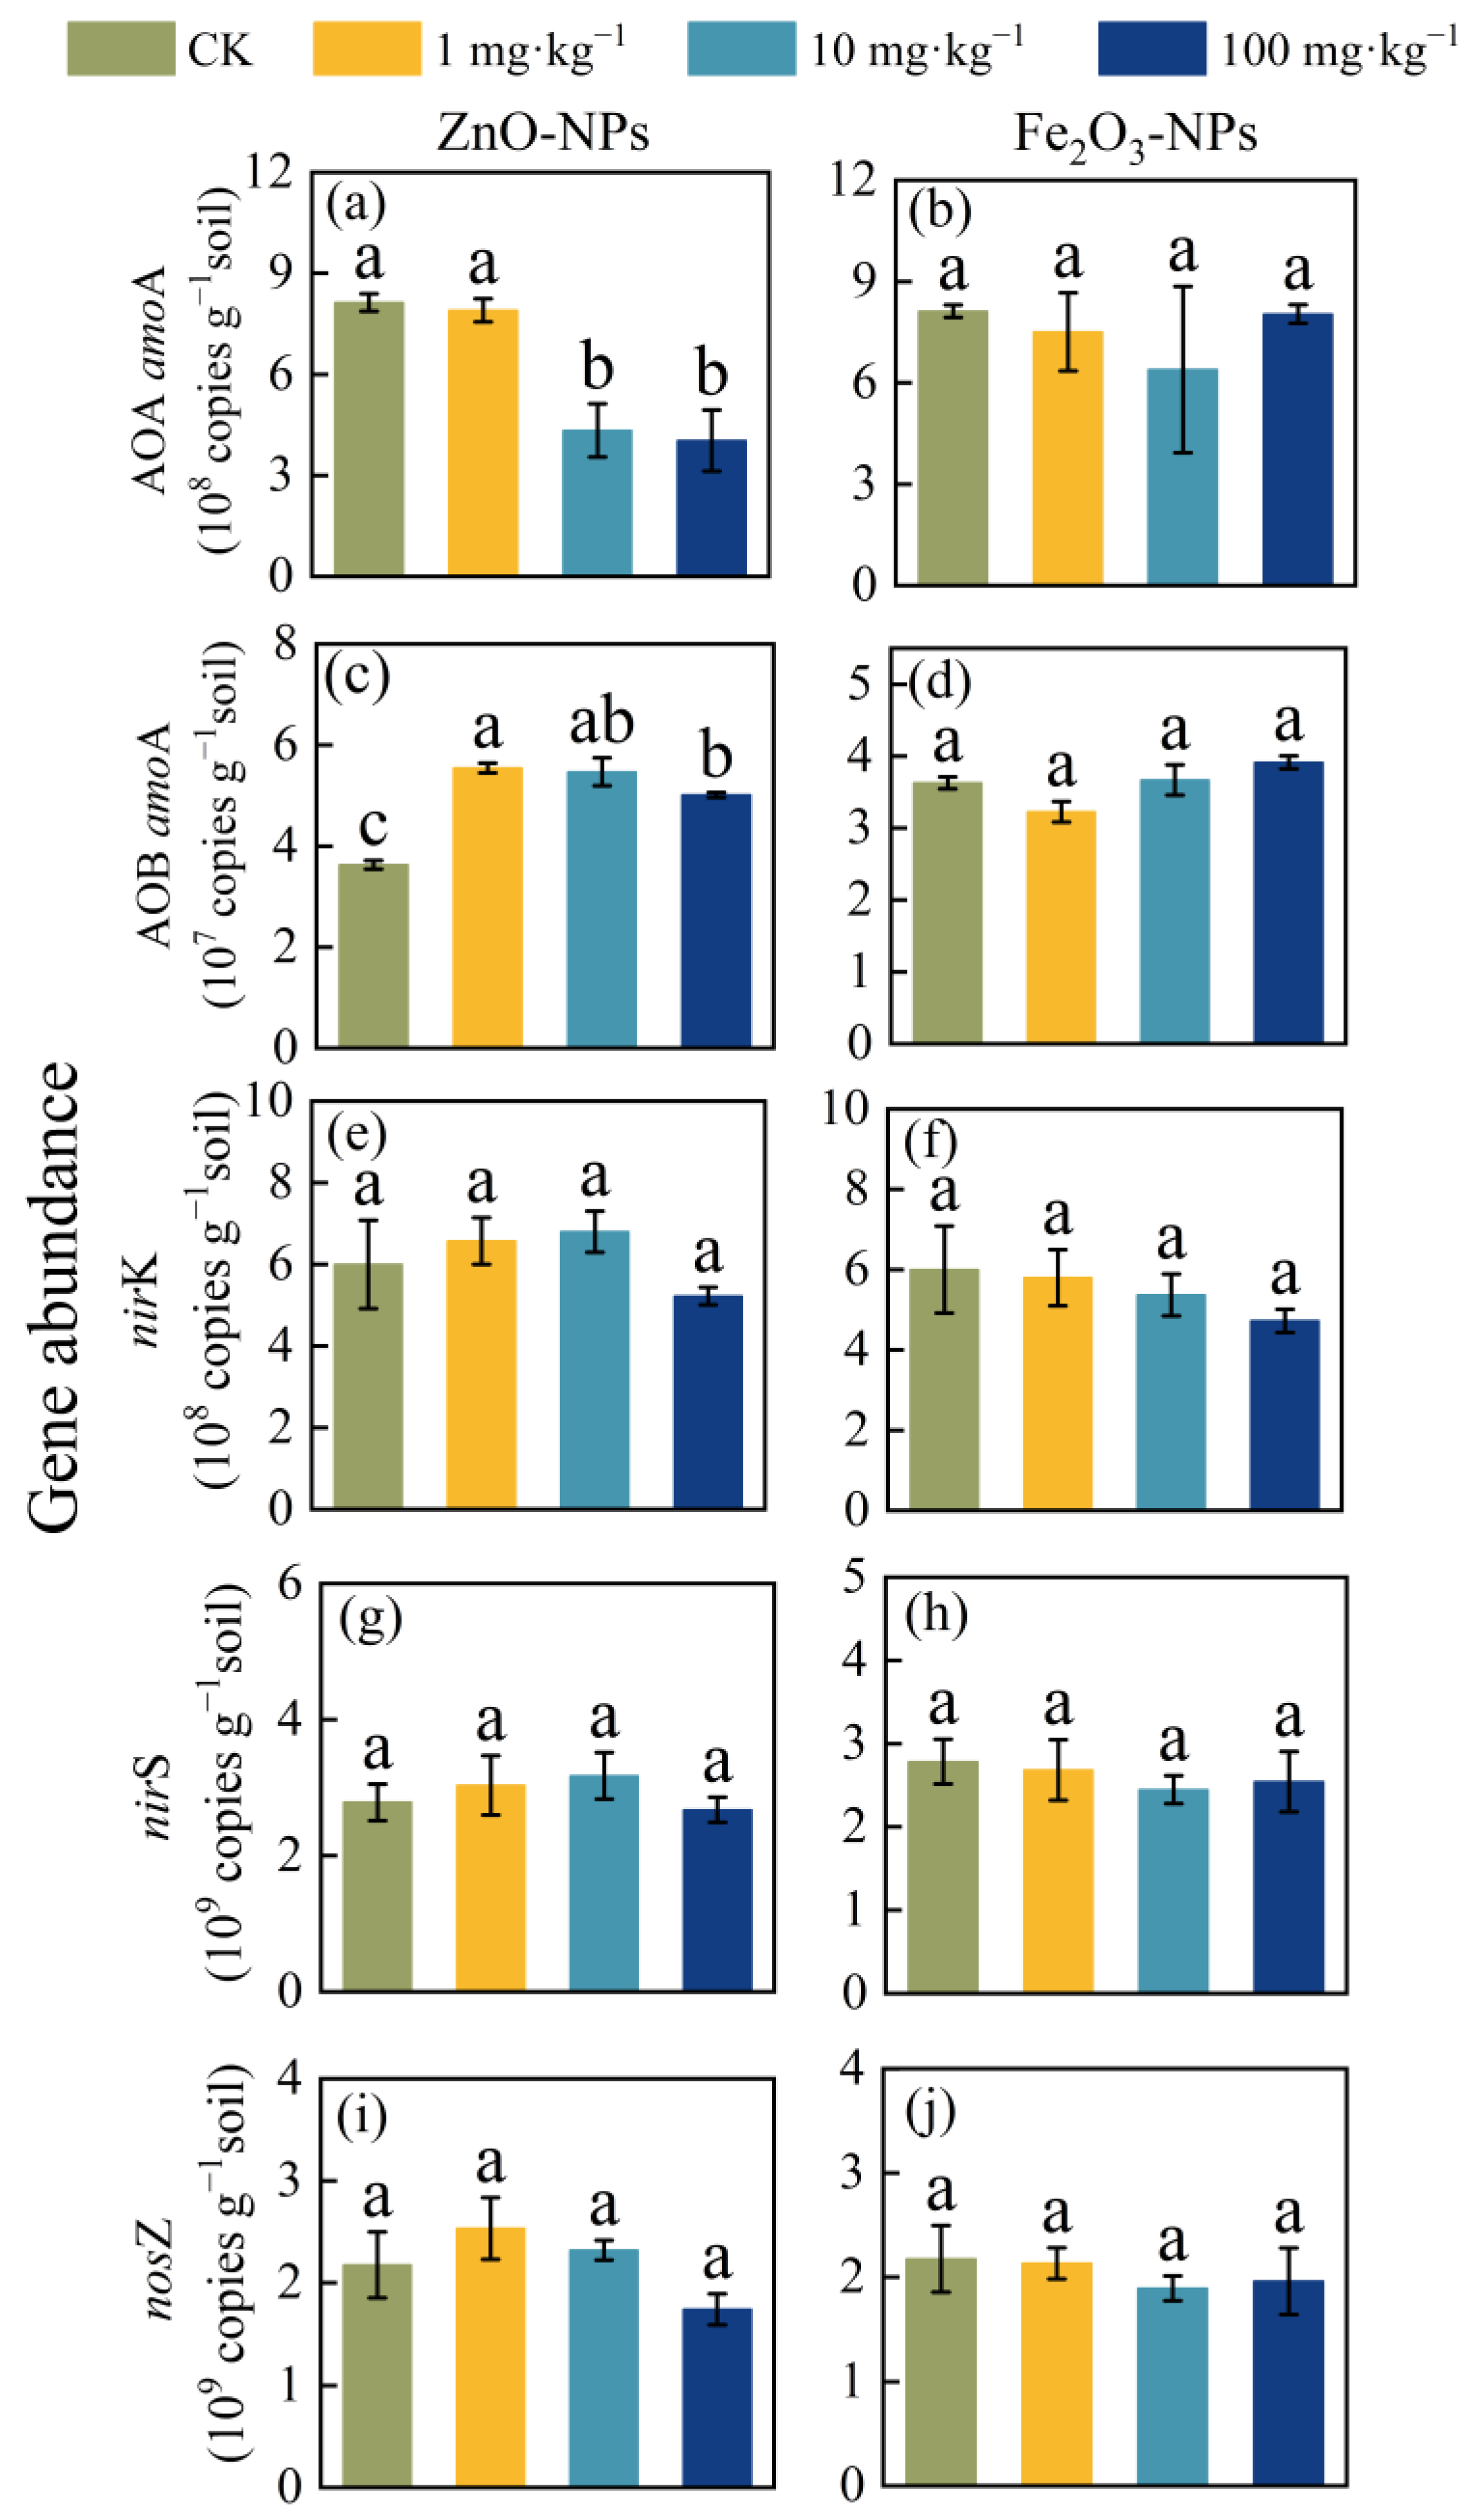
3.3. Expression of Soil Microbial Functional Genes

The abundance of AOA amoA was ~10 times higher than that of AOB amoA, with 8.07 × 10⁸ and 3.60 × 10⁷ copies g−1 soil, respectively, in CK. In the ZnO-NP treatment after incubation, soil amoA abundance became lower in AOA (Figure 4a) and higher in AOB, with increasing concentration (Figure 4c). However, in the Fe2O3-NPs treatment, concentration change did not show a significant effect on the amoA abundance of AOA or AOB (Figure 4b,d).
The gene abundance of nirK, nirS, and nosZ genes in tea plantation soil without nanoparticle addition were 6 × 10⁸, 2.78 × 10⁹, and 2.65 × 10⁹ copies g−1 soil, respectively. ZnO-NPs showed stimulation, except at high concentration (100 mg kg−1), while Fe2O3-NPs showed an inhibitory effect in terms of nirK (Figure 4e,f). The gene abundance of nirS and nosZ exhibited a similar pattern to nirK but with a much greater magnitude (Figure 4g–j). Nevertheless, neither NP type nor addition rate had a significant effect on the abundance of functional genes related to soil denitrification after incubation at a significance level of p < 0.05.

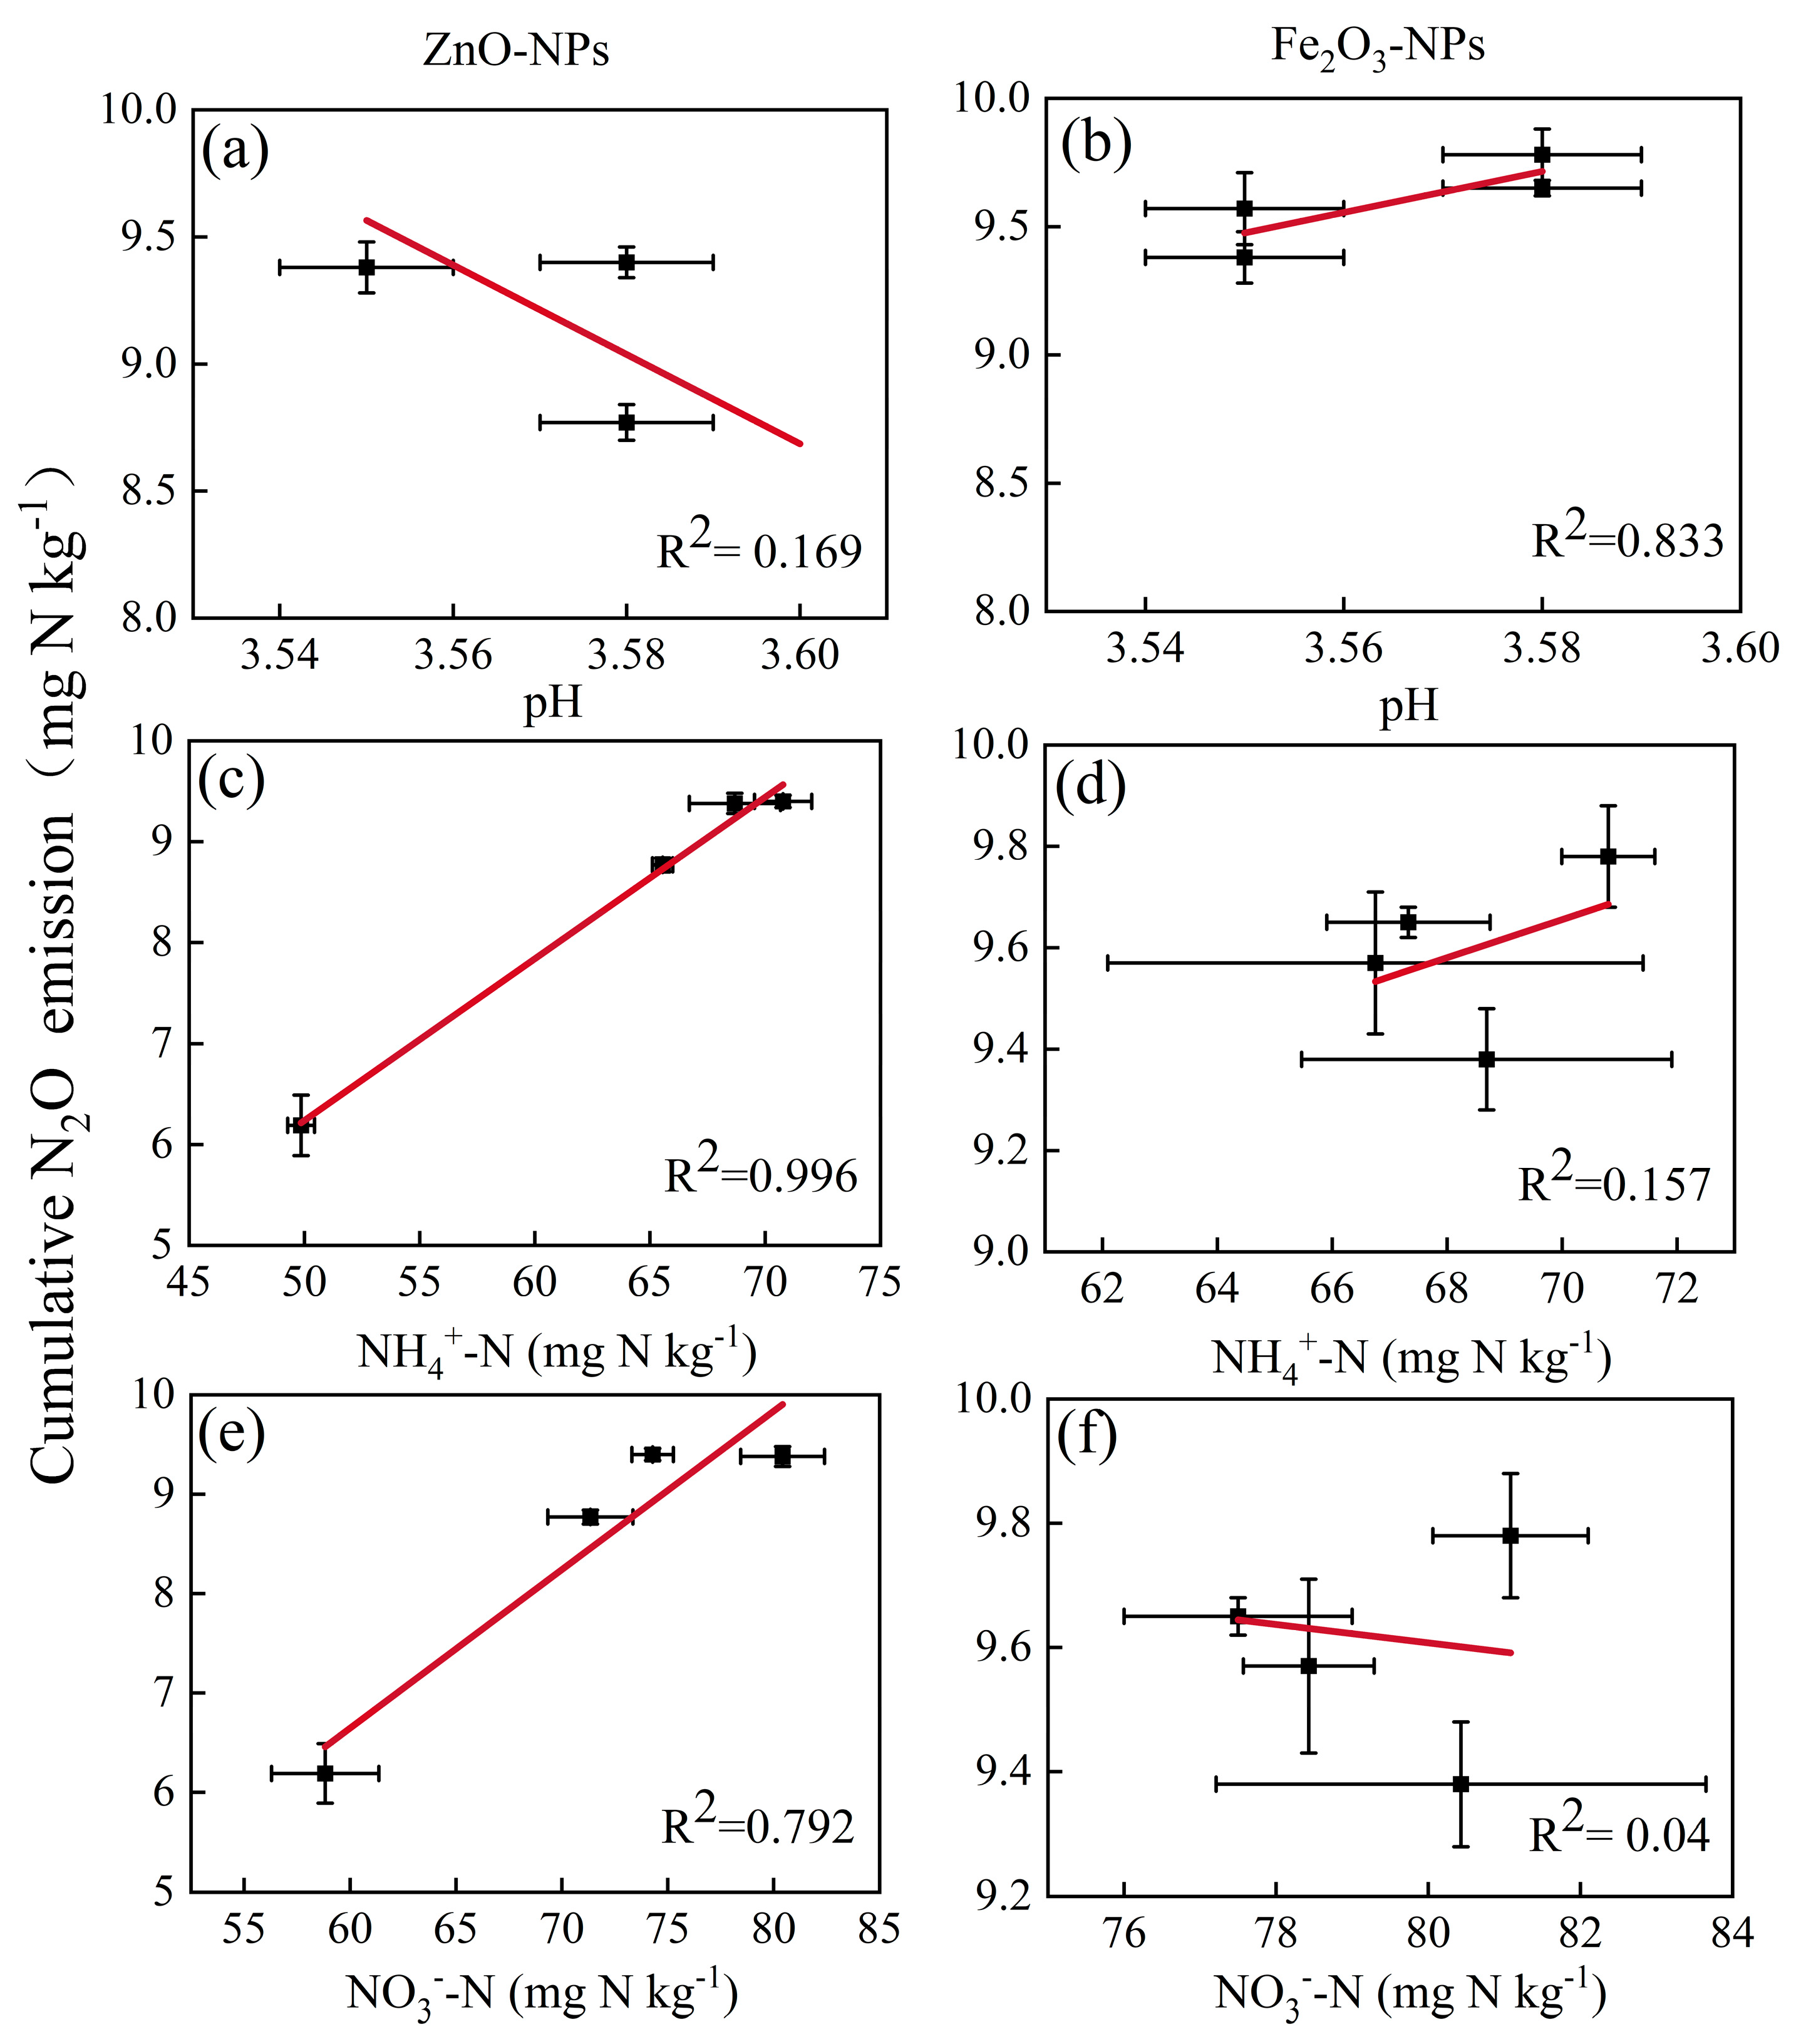
3.4. Relationships between Factors and Cumulative N2O Emissions

NP type (T) and dose (R) showed significant single and interacting effects on cumulative N2O emissions, as well as soil pH, NH4+-N and NO3-N contents, and AOB, but they had an insignificant impact on denitrification-related functional gene abundance (Table 2).
The gene abundance of AOA amoA did not show a significant influence in terms of NP type, but it was significantly influenced by dose and interaction (Table 2). In treatments with the addition of ZnO-NPs, the cumulative N2O emissions were significantly linear fitted by soil pH and NH4+-N and NO3-N contents, which did not show a significant linear relationship in the Fe2O3-NPs treatments (Figure 5).

4. Discussion

This incubation trial demonstrated the significant N2O reduction effect achieved via the addition of ZnO nanoparticles (Figure 2a), which is inconsistent with a previous study that reported the stimulatory effect of adding 100–1000 mg kg−1ZnO-NPs [18]. Soil N2O production is mostly associated with nitrification and denitrification processes, whose rates are related to aeration and substrate availability [8]. Soil N2O emissions are mainly produced via nitrification in tea plantations using 15N tracing techniques [14]. In this study, incubation was conducted at 60% WHC with additional ammonium N supply; therefore, nitrification could be more dominant than denitrification. The higher NH4+-N and lower NO3-N contents in the ZnO-NP treatments (Figure 3) suggested that it inhibited nitrification during incubation, which may have reduced N2O production.
Ammonia oxidation, a time-limiting step for nitrification, is mainly driven by AOA and AOB [19]. The abundance of AOA in this study was ~10 times greater than that of AOB in the present study (Figure 4a,c), which is consistent with a previous study [20] that found AOA to be much more dominant than AOB in acidic soil. The addition of ZnO-NPs significantly reduced AOA (Figure 4a), implying that AOA suppression could be attributed to the nitrification inhibition effect induced by the addition of ZnO-NPs. The mechanism of ZnO-NP toxicity to AOA could be attributed to the production of reactive oxygen species (ROS), the release of Zn2+, and cell membrane damage [21]. These results implied that the suppression of AOA contributes more to N2O reduction through the inhibition of nitrification after the addition of ZnO-NPs. This could also be found in the linear regression between cumulative N2O emissions and soil NH4+-N and NO3-N (Figure 5b,c).
In contrast to AOA, AOB did not show a negative response to ZnO-NPs (Figure 4c), which was consistent with the finding of a former study [18] but inconsistent with some other previous studies [22,23,24]. This difference may be partly due to the diversity of metabolic pathways since the respiratory chain in AOA is copper-based, while the respiratory chain and key enzymes in AOB are iron-based [25]. Zn2+ released from ZnO-NPs may be more competitive in terms of active sites of copper in AOA [26], which then induces toxicity. With the retarding of AOA by ZnO-NPs, AOB may become more competitive since they can obtain more substrates, e.g., carbon and NH4+-N. On the other hand, sustaining more NH4+-N via the inhibition of nitrification may be more favorable for AOB since AOB is more suitable than AOA in a substrate-rich environment [27]. Nevertheless, increasing AOB abundance should induce greater N2O production, which may eventually be offset due to the retarding of AOA. This difference could explain why ZnO-NPs increased N2O emissions with the same patterns as seen in AOA and AOB abundance in the former study [18] since their studied soil may be AOB-dominated in terms of nitrification.
ZnO-NPs may not directly reduce denitrification-related functional gene abundance, but indirectly influence them through substrate (NO3-) supply [18]. This study was carried out under aerobic conditions, and denitrification may not be a negligible pathway for N2O production. However, the addition of ZnO-NPs seemed not to affect denitrification, according to the linear increase in soil NO3-N and the insignificant difference in denitrification-related functional genes abundance of nirK, nirS, and nosZ (Figure 4). This response was different from that found in a previous study concerning a biological N removal system in a wastewater treatment plant [13]. This difference could be due to the aerobic conditions and less labile carbon in this study. Denitrification, as a heterotrophic metabolism, mostly occurs in cases of oxygen deficit, with soil moisture higher than 85% WHC and labile carbon supply [8,14]. In similar research using ZnO-NPs, the addition of glucose (labile carbon) caused greater N2O emissions and significant changes in the gene expressions of nirK, nirS, and nosZ [15].
The addition of Fe2O3-NPs did not significantly affect the cumulative N2O emissions from tea plantation soils despite the dose increasing from 0 to 100 mg kg−1 (Figure 2b). Furthermore, there was no significant difference in soil mineral N or nitrification–denitrification-related functional gene abundance. It was observed that the pH increased after the addition of NPs and became higher with greater NP addition but gradually decreased after 7 days (Figure 3a,b). The initial pH increase may be due to the high pH in the NP solution (7.69 and 8.15) because soluble metal oxides react with water to form alkaline solutions. That is why the initial pH was higher in Fe2O3 NPs, and the pH increased with the further addition of NPs. The decrease in pH was always observed in incubation studies with N addition. It was mainly related to nitrification processes, which could produce four protons through the transformation from NH4N to NO3-N [14].
The insignificant effect of Fe2O3-NPs could be due to the difference in ion charges since released Fe3+ may not compete for Cu2+ or Fe2+ in AOA and AOB, like released Zn2+ in the case of ZnO-NP addition [26]. Another possibility may be due to the reaction of Fe2O3-NPs with soil organic carbon or aggregates, which may be beneficial in terms of protecting soil organic carbon but increases the formation of larger aggregates and then reduces the concentration of nanoparticles in the soil [28,29]. Thus, the toxicity of Fe2O3-NPs to nitrification was lower than ZnO-NPs in this study. Nevertheless, some reports have shown that Fe2O3-NPs have positive effects in terms of denitrification [30] and released Fe (III) could stimulate soil N2O emissions [31]. Therefore, the effect of Fe2O3-NPs may be underestimated due to the low denitrification potential in this study, indicating the necessity of investigating denitrification.
The addition of ZnO-NPs by 100 mg kg−1 significantly decreased cumulative N2O emissions by 33% (Figure 2). This efficiency was higher than ~26.7% when using the commonly used nitrification inhibitor [32]. This value was obtained under lab incubation, which created a suitable environment for aerobic microorganisms in terms of temperature, moisture, and substrate. However, under field conditions, N2O emissions are influenced by various factors, e.g., application rate, soil water, temperature, and the presence of root, since crop roots may compete for N. Therefore, the reduction efficiency of ZnO-NPs in this study may be overestimated due to other environmental factors, implying the requirement for further studies and field tests related to tea plant growth in the future.

5. Conclusions

This study tested the effects of nanoparticles of Zn and Fe oxides on soil N2O emissions using a short-term lab incubation trial. Our results demonstrated the positive effect of ZnO-NPs on reducing soil N2O emissions; however, Fe2O3-NPs do not work. Since tea plantations are hotspots of N2O emissions in agriculture, this study provides a potential way of mitigating N2O emissions in tea plantations. However, field tests concerning reduction efficiency under various ambient conditions are required in the future to make this feasible in practice.

Author Contributions

Conceptualization, J.W., L.L. and K.N.; methodology, K.N.; software, J.W. and L.G.; validation, F.Y. and J.X.; formal analysis, J.W. and L.G.; investigation, L.G. and L.L.; data curation, K.N. and L.L.; writing—original draft preparation, J.W.; writing—review and editing, L.G. and K.N.; supervision, L.L. and K.N. All authors have read and agreed to the published version of the manuscript.

Funding

This study was funded by the national Key R&D program of China (2021YFD1601101), Zhejiang Provincial Department of Agriculture and Rural Affairs (2023SNJF037), Chinese Academy of Agricultural Sciences (CAAS-ASTIP-2021-TRICAAS), Ministry of Agriculture and Rural Affairs of the China (CARS-19).

Data Availability Statement

Dataset available on request from the authors. The raw data supporting the conclusions of this article will be made available by the authors on request.

Conflicts of Interest

The authors declare no conflicts of interest.

References

  1. Ravishankara, A.R.; Daniel, J.S.; Portmann, R.W. Nitrous Oxide (N2O): The Dominant Ozone-Depleting Substance Emitted in the 21st Century. Science 2009, 326, 123–125. [Google Scholar] [CrossRef] [PubMed]
  2. Tian, H.; Xu, R.; Canadell, J.G.; Thompson, R.L.; Winiwarter, W.; Suntharalingam, P.; Davidson, E.A.; Ciais, P.; Jackson, R.B.; Janssens-Maenhout, G.; et al. A Comprehensive Quantification of Global Nitrous Oxide Sources and Sinks. Nature 2020, 586, 248–256. [Google Scholar] [CrossRef] [PubMed]
  3. Qiao, C.; Xu, B.; Han, Y.; Wang, J.; Wang, X.; Liu, L.; Liu, W.; Wan, S.; Tan, H.; Liu, Y.; et al. Synthetic Nitrogen Fertilizers Alter the Soil Chemistry, Production and Quality of Tea. A Meta-Analysis. Agron. Sustain. Dev. 2018, 38, 10. [Google Scholar] [CrossRef]
  4. Wang, J.; Smith, P.; Hergoualc’h, K.; Zou, J. Direct N2O Emissions from Global Tea Plantations and Mitigation Potential by Climate-Smart Practices. Resour. Conserv. Recycl. 2022, 185, 106501. [Google Scholar] [CrossRef]
  5. Wang, Y.; Yao, Z.; Pan, Z.; Wang, R.; Yan, G.; Liu, C.; Su, Y.; Zheng, X.; Butterbach-Bahl, K. Tea-Planted Soils as Global Hotspots for N2O Emissions from Croplands. Environ. Res. Lett. 2020, 15, 104018. [Google Scholar] [CrossRef]
  6. Preetha, P.S.; Balakrishnan, N. A Review of Nano Fertilizers and Their Use and Functions in Soil. Int. J. Curr. Microbiol. Appl. Sci. 2017, 6, 3117–3133. [Google Scholar] [CrossRef]
  7. Kah, M.; Kookana, R.S.; Gogos, A.; Bucheli, T.D. A Critical Evaluation of Nanopesticides and Nanofertilizers against Their Conventional Analogues. Nat. Nanotechnol. 2018, 13, 677–684. [Google Scholar] [CrossRef] [PubMed]
  8. Baggs, E.M. Soil Microbial Sources of Nitrous Oxide: Recent Advances in Knowledge, Emerging Challenges and Future Direction. Curr. Opin. Environ. Sustain. 2011, 3, 321–327. [Google Scholar] [CrossRef]
  9. Smith, K.A. Changing Views of Nitrous Oxide Emissions from Agricultural Soil: Key Controlling Processes and Assessment at Different Spatial Scales. Eur. J. Soil Sci. 2017, 68, 137–155. [Google Scholar] [CrossRef]
  10. Parada, J.; Rubilar, O.; Sousa, D.Z.; Martínez, M.; Fernández-Baldo, M.A.; Tortella, G.R. Short Term Changes in the Abundance of Nitrifying Microorganisms in a Soil-Plant System Simultaneously Exposed to Copper Nanoparticles and Atrazine. Sci. Total Environ. 2019, 670, 1068–1074. [Google Scholar] [CrossRef]
  11. Chen, Y.; Zhang, X.; Liu, W. Effect of Metal and Metal Oxide Engineered Nano Particles on Nitrogen Bio-Conversion and Its Mechanism: A Review. Chemosphere 2022, 287, 132097. [Google Scholar] [CrossRef] [PubMed]
  12. Rashid, M.I.; Shahzad, T.; Shahid, M.; Ismail, I.M.I.; Shah, G.M.; Almeelbi, T. Zinc Oxide Nanoparticles Affect Carbon and Nitrogen Mineralization of Phoenix Dactylifera Leaf Litter in a Sandy Soil. J. Hazard. Mater. 2017, 324, 298–305. [Google Scholar] [CrossRef] [PubMed]
  13. Ye, J.; Gao, H.; Wu, J.; Chang, Y.; Chen, Z.; Yu, R. Responses of Nitrogen Transformation Processes and N2O Emissions in Biological Nitrogen Removal System to Short-Term ZnO Nanoparticle Stress. Sci. Total Environ. 2020, 705, 135916. [Google Scholar] [CrossRef] [PubMed]
  14. Cheng, Y.; Wang, J.; Zhang, J.-B.; Müller, C.; Wang, S.-Q. Mechanistic Insights into the Effects of N Fertilizer Application on N2O-Emission Pathways in Acidic Soil of a Tea Plantation. Plant Soil 2015, 389, 45–57. [Google Scholar] [CrossRef]
  15. Beddow, J.; Stolpe, B.; Cole, P.A.; Lead, J.R.; Sapp, M.; Lyons, B.P.; Colbeck, I.; Whitby, C. Nanosilver Inhibits Nitrification and Reduces Ammonia-Oxidising Bacterial but Not Archaeal amoA Gene Abundance in Estuarine Sediments. Environ. Microbiol. 2017, 19, 500–510. [Google Scholar] [CrossRef] [PubMed]
  16. Huang, R.; Zeng, J.; Zhao, D.; Yong, B.; Yu, Z. Co-Association of Two Nir Denitrifiers Under the Influence of Emergent Macrophytes. Microb. Ecol. 2020, 80, 809–821. [Google Scholar] [CrossRef]
  17. Throbäck, I.N.; Enwall, K.; Jarvis, Å.; Hallin, S. Reassessing PCR Primers Targeting nirS, nirK and nosZ Genes for Community Surveys of Denitrifying Bacteria with DGGE. FEMS Microbiol. Ecol. 2004, 49, 401–417. [Google Scholar] [CrossRef] [PubMed]
  18. Feng, Z.; Yu, Y.; Yao, H.; Ge, C. Effect of Zinc Oxide Nanoparticles on Nitrous Oxide Emissions in Agricultural Soil. Agriculture 2021, 11, 730. [Google Scholar] [CrossRef]
  19. Guo, J.; Peng, Y.; Wang, S.; Ma, B.; Ge, S.; Wang, Z.; Huang, H.; Zhang, J.; Zhang, L. Pathways and Organisms Involved in Ammonia Oxidation and Nitrous Oxide Emission. Crit. Rev. Environ. Sci. Technol. 2013, 43, 2213–2296. [Google Scholar] [CrossRef]
  20. Prosser, J.I.; Nicol, G.W. Archaeal and Bacterial Ammonia-Oxidisers in Soil: The Quest for Niche Specialisation and Differentiation. Trends Microbiol. 2012, 20, 523–531. [Google Scholar] [CrossRef]
  21. Sirelkhatim, A.; Mahmud, S.; Seeni, A.; Kaus, N.H.M.; Ann, L.C.; Bakhori, S.K.M.; Hasan, H.; Mohamad, D. Review on Zinc Oxide Nanoparticles: Antibacterial Activity and Toxicity Mechanism. Nano-Micro Lett. 2015, 7, 219–242. [Google Scholar] [CrossRef] [PubMed]
  22. Zhang, X.; Zhang, N.; Fu, H.; Chen, T.; Liu, S.; Zheng, S.; Zhang, J. Effect of Zinc Oxide Nanoparticles on Nitrogen Removal, Microbial Activity and Microbial Community of CANON Process in a Membrane Bioreactor. Bioresour. Technol. 2017, 243, 93–99. [Google Scholar] [CrossRef]
  23. Wu, Q.; Huang, K.; Sun, H.; Ren, H.; Zhang, X.; Ye, L. Comparison of the Impacts of Zinc Ions and Zinc Nanoparticles on Nitrifying Microbial Community. J. Hazard. Mater. 2018, 343, 166–175. [Google Scholar] [CrossRef] [PubMed]
  24. Phan, D.C.; Pasha, A.B.M.T.; Carwile, N.; Kapoor, V. Effect of Zinc Oxide Nanoparticles on Physiological Activities and Gene Expression of Wastewater Nitrifying Bacteria. Environ. Eng. Sci. 2020, 37, 328–336. [Google Scholar] [CrossRef]
  25. Wright, C.L.; Lehtovirta-Morley, L.E. Nitrification and beyond: Metabolic Versatility of Ammonia Oxidising Archaea. ISME J. 2023, 17, 1358–1368. [Google Scholar] [CrossRef] [PubMed]
  26. Tolar, B.B.; Herrmann, J.; Bargar, J.R.; van den Bedem, H.; Wakatsuki, S.; Francis, C.A. Integrated Structural Biology and Molecular Ecology of N-Cycling Enzymes from Ammonia-Oxidizing Archaea. Environ. Microbiol. Rep. 2017, 9, 484–491. [Google Scholar] [CrossRef]
  27. French, E.; Kozlowski, J.A.; Mukherjee, M.; Bullerjahn, G.; Bollmann, A. Ecophysiological Characterization of Ammonia-Oxidizing Archaea and Bacteria from Freshwater. Appl. Environ. Microbiol. 2012, 78, 5773–5780. [Google Scholar] [CrossRef] [PubMed]
  28. Li, Q.; Hu, W.; Li, L.; Li, Y. Interactions between Organic Matter and Fe Oxides at Soil Micro-Interfaces: Quantification, Associations, and Influencing Factors. Sci. Total Environ. 2023, 855, 158710. [Google Scholar] [CrossRef] [PubMed]
  29. Tao, Z.; Zhou, Q.; Zheng, T.; Mo, F.; Ouyang, S. Iron Oxide Nanoparticles in the Soil Environment: Adsorption, Transformation, and Environmental Risk. J. Hazard. Mater. 2023, 459, 132107. [Google Scholar] [CrossRef]
  30. Wang, S.; Yang, X.; Meng, H.; Zhang, Y.; Li, X.; Xu, J. Enhanced Denitrification by Nano α-Fe2O3 Induced Self-Assembled Hybrid Biofilm on Particle Electrodes of Three-Dimensional Biofilm Electrode Reactors. Environ. Int. 2019, 125, 142–151. [Google Scholar] [CrossRef]
  31. Zhang, L.; Jiang, M.; Ding, K.; Zhou, S. Iron Oxides Affect Denitrifying Bacterial Communities with the NirS and NirK Genes and Potential N2O Emission Rates from Paddy Soil. Eur. J. Soil Biol. 2019, 93, 103093. [Google Scholar] [CrossRef]
  32. Gurung, R.B.; Ogle, S.M.; Breidt, F.J.; Parton, W.J.; Del Grosso, S.J.; Zhang, Y.; Hartman, M.D.; Williams, S.A.; Venterea, R.T. Modeling Nitrous Oxide Mitigation Potential of Enhanced Efficiency Nitrogen Fertilizers from Agricultural Systems. Sci. Total Environ. 2021, 801, 149342. [Google Scholar] [CrossRef] [PubMed]
Figure 1. Changes in soil N2O emission rate after adding different doses with nano particles of ZnO (a) and Fe2O3 (b). The error bars in the lines represent the standard deviations (n = 4). The bars on the top represent the Tukey’s honest significant difference (HSD) values used to indicate the differences between treatments.
Agronomy 14 01113 g001
Figure 2. Accumulated soil N2O emissions after different doses addition with nano particles of ZnO (a) and Fe2O3 (b) during the 28-day incubation. Different letters indicate significant differences among treatments (p < 0.05). The error bars represent the standard deviations (n = 4).
Agronomy 14 01113 g002
Figure 3. Changes in soil pH (a,d); contents of NH4+-N (b,e) and NO3-N (c,f) during the 28-day incubation. The error bars represent the standard deviations (n = 4).
Agronomy 14 01113 g003
Figure 4. Abundance of functional genes of AOA-amoA (a,b), AOB-amoA (c,d), nirK (e,f), nirS (g,h), and nosZ (i,j) in the soil after the incubation. Different letters indicate statistically significant differences (p < 0.05). Error bars indicate the standard error of the mean (n = 4).
Agronomy 14 01113 g004
Figure 5. Relationships between cumulative N2O emissions and changes in soil pH (a,b) and contents of NH4+ (c,d) and NO3 (e,f). Error bars indicate the standard error of the mean (n = 4).
Agronomy 14 01113 g005
Table 1. Primers for nitrification–denitrification functional genes and thermocycling conditions for qPCR.
GenePrimersSequencesPCR ConditionsReference
AOACrenamoA23fATGGTCTGGCTWAGACG95 °C 5 min 1 cycle, 95 °C-15 s, 55 °C 30 s, 72 °C-30 s[15]
CrenamoA616rGCCATCCATCTGTATGTCCA45 cycles, melt curve (95 °C, 60 °C, 95 °C) 15 s
AOBamoA-1F GGGGTTTCTACTGGTGGT95 °C 5 min 1 cycle, 95 °C-15 s, 55 °C 30 s, 72 °C-30 s[15]
amoA-2RCCCCTCKGSAAAGCCTTCTTC45 cycles, melt curve (95 °C, 60 °C, 95 °C) 15 s
nirKCopper583FTCATGGTGCTGCCGCGYGANGG95 °C 5 min 1 cycle, 95 °C-15 s, 55 °C 30 s, 72 °C-30 s[16]
Copper909RGAACTTGCCGGTKGCCCAGAC45 cycles, melt curve (95 °C, 60 °C, 95 °C) 15 s
nirSnirS-Cd3aFGTSAACGTSAAGGARACSGG95 °C 5 min 1 cycle, 95 °C-15 s, 37 °C 45 s, 72 °C-60 s[17]
nirS-R3cdGASTTCGGRTGSGTCTTGA45 cycles, melt curve (95 °C, 60 °C, 95 °C) 15 s
nosZnosZ-FCGYTGTTCMTCGACAGCCAG95 °C 5 min 1 cycle, 95 °C-15 s, 55 °C 30 s, 72 °C-30 s[17]
nosZ-1662RCGSACCTTSTTGCCSTYGCG45 cycles, melt curve (95 °C, 60 °C, 95 °C) 15 s
Table 2. The effects of NP type (T) and dose (D) on cumulative N2O emissions, soil pH, N, and functional gene abundance.
Response VariableN2OpHNH4+NO3AOA amoAAOB amoAnirKnirSnosZ
T<0.001<0.001<0.001<0.0010.061<0.0010.0670.8140.066
D<0.001<0.001<0.001<0.001<0.001<0.0010.0840.9970.212
T × D<0.001<0.001<0.001<0.001<0.001<0.0010.7400.2620.134
Numbers in the tables are the p values of two-way ANOVA.
Disclaimer/Publisher’s Note: The statements, opinions and data contained in all publications are solely those of the individual author(s) and contributor(s) and not of MDPI and/or the editor(s). MDPI and/or the editor(s) disclaim responsibility for any injury to people or property resulting from any ideas, methods, instructions or products referred to in the content.

