Abstract
Traditional DeepLabV3+ image semantic segmentation methods face challenges in pitaya orchard environments characterized by multiple interference factors, complex image backgrounds, high computational complexity, and extensive memory consumption. This paper introduces an improved visual navigation path recognition method for pitaya orchards. Initially, DeepLabV3+ utilizes a lightweight MobileNetV2 as its primary feature extraction backbone, which is augmented with a Pyramid Split Attention (PSA) module placed after the Atrous Spatial Pyramid Pooling (ASPP) module. This improvement enhances the spatial feature representation of feature maps, thereby sharpening the segmentation boundaries. Additionally, an Efficient Channel Attention Network (ECANet) mechanism is integrated with the lower-level features of MobileNetV2 to reduce computational complexity and refine the clarity of target boundaries. The paper also designs a navigation path extraction algorithm, which fits the road mask regions segmented by the model to achieve precise navigation path recognition. Experimental findings show that the enhanced DeepLabV3+ model achieved a Mean Intersection over Union (MIoU) and average pixel accuracy of 95.79% and 97.81%, respectively. These figures represent increases of 0.59 and 0.41 percentage points when contrasted with the original model. Furthermore, the model’s memory consumption is reduced by 85.64%, 84.70%, and 85.06% when contrasted with the Pyramid Scene Parsing Network (PSPNet), U-Net, and Fully Convolutional Network (FCN) models, respectively. This reduction makes the proposed model more efficient while maintaining high segmentation accuracy, thus supporting enhanced operational efficiency in practical applications. The test results for navigation path recognition accuracy reveal that the angle error between the navigation centerline extracted using the least squares method and the manually fitted centerline is less than 5°. Additionally, the average deviation between the road centerlines extracted under three different lighting conditions and the actual road centerline is only 2.66 pixels, with an average image recognition time of 0.10 s. This performance suggests that the study can provide an effective reference for visual navigation in smart agriculture.
1. Introduction
In China’s agricultural sector, fruit planting is among the top three industries [1]. However, the mechanization level in fruit harvesting remains relatively low, primarily relying on manual labor, which significantly lags behind that of developed countries. In the semi-structured environments of orchards, the deployment of large machinery is limited. Traditional machine vision algorithms often struggle with various challenges such as changes in lighting, occlusion, and the presence of weeds, leading to inaccurate navigation road segmentation results. This inaccuracy impedes the progression of intelligent orchard mechanization. Consequently, there is an urgent need in China to enhance the mechanization and intelligence of orchards to boost production efficiency. Visual navigation, a key technology for advancing the intelligence levels of orchard machinery, offers low-cost, information-rich solutions suitable for irregular plots. It effectively compensates for the challenges posed by tree leaf occlusion and weak satellite signals [2,3]. Studies on visual navigation in environments such as apple orchards [4], cucumber fields [5], orange groves [6], wolfberry plantations [7], peach orchards [8], and jujube orchards [9] have been conducted. The precise and instantaneous identification of navigation paths is a significant area of interest in global research [10,11].
The evolution of deep learning technology [12] has prompted numerous researchers to apply these techniques to navigation path recognition, leading to the development of various semantic segmentation algorithms. These include conventional approaches like watershed segmentation (Cao W et al.) [13], k-means clustering (Ikotun AM et al.) [14], histogram-based clustering (Dhalet KG et al.) [15], and Otsu threshold segmentation algorithm (Pei Yang et al.) [16], as well as more advanced methods. Han J et al. [17] proposed the automatic driving control algorithm of tracked agricultural vehicles based on low-cost multi-sensor fusion positioning. Huang H et al. [18] utilized an adaptive control robot system, while Kim WS et al. [19] developed a technique for extracting crop height and harvesting boundary data using binocular vision. These studies on navigation path recognition using deep learning algorithms and the application of semantic segmentation in road scenes provide valuable references for this research.
The DeepLabv3+ network is heralded as the latest pinnacle in semantic segmentation networks, and researchers are consistently endeavoring to enhance its performance. This involves optimizing the network structure, augmenting both its depth and breadth, and refining the loss function. These enhancements are directed towards ameliorating the model’s precision in delineating details and boundaries, as well as bolstering its ability to generalize across diverse scenes and objects. Furthermore, DeepLabv3+ has been successfully applied in numerous domains, including autonomous driving, medical image analysis, and agriculture. Researchers are actively exploring its potential in additional fields and endeavoring to address specific challenges within those domains. However, the network does have its limitations. In the pursuit of segmentation accuracy, Xception, a network with a high number of layers and parameters, is selected as the feature extraction network. This choice increases the model’s complexity and, consequently, imposes greater hardware requirements [20].
Traditional convolutional neural networks improve network model accuracy by increasing the depth and width of the network, but they often suffer from high complexity and slow running speeds. MobileNetV2, on the other hand, is a lightweight neural network architecture specifically crafted for efficient computation on embedded devices, ensuring lightweight performance. It belongs to the MobileNet series, an evolution and enhancement of MobileNetV1, offering higher accuracy and a smaller model size compared to its predecessor [21].
In the task of detecting and recognizing navigation paths in pitaya orchards, the presence of weeds and fallen branches on the paths blurs the boundary information, thereby increasing the difficulty of path recognition. Moreover, most studies have not sufficiently focused on model deployment [22]. The proposed network structures are often complex, resulting in large models that are not suitable for deployment in orchard visual navigation systems with limited hardware capabilities. Therefore, to address the interference from various factors, the complexity of image backgrounds, and the challenges of deploying complex models in orchard environments, this paper focuses on the natural environment of pitaya orchards. We propose an improved orchard visual navigation path recognition method based on the DeepLabV3+ network. This approach adopts the lightweight MobileNetv2 as the feature extraction backbone for DeepLabV3+ and incorporates the Efficient Channel Attention Network (ECANet) for clarifying target boundaries and reducing computational complexity [23]. Additionally, a Pyramid Split Attention (PSA) mechanism is introduced after the Atrous Spatial Pyramid Pooling (ASPP) module to enhance the spatial feature representation of feature maps. Lastly, the navigation path is recognized by fitting the road mask region segmented by the network model using the least squares method.
2. Materials and Methods
2.1. Preparation of Pitaya Orchard Road DataPreparation of Pitaya Orchard Road Data
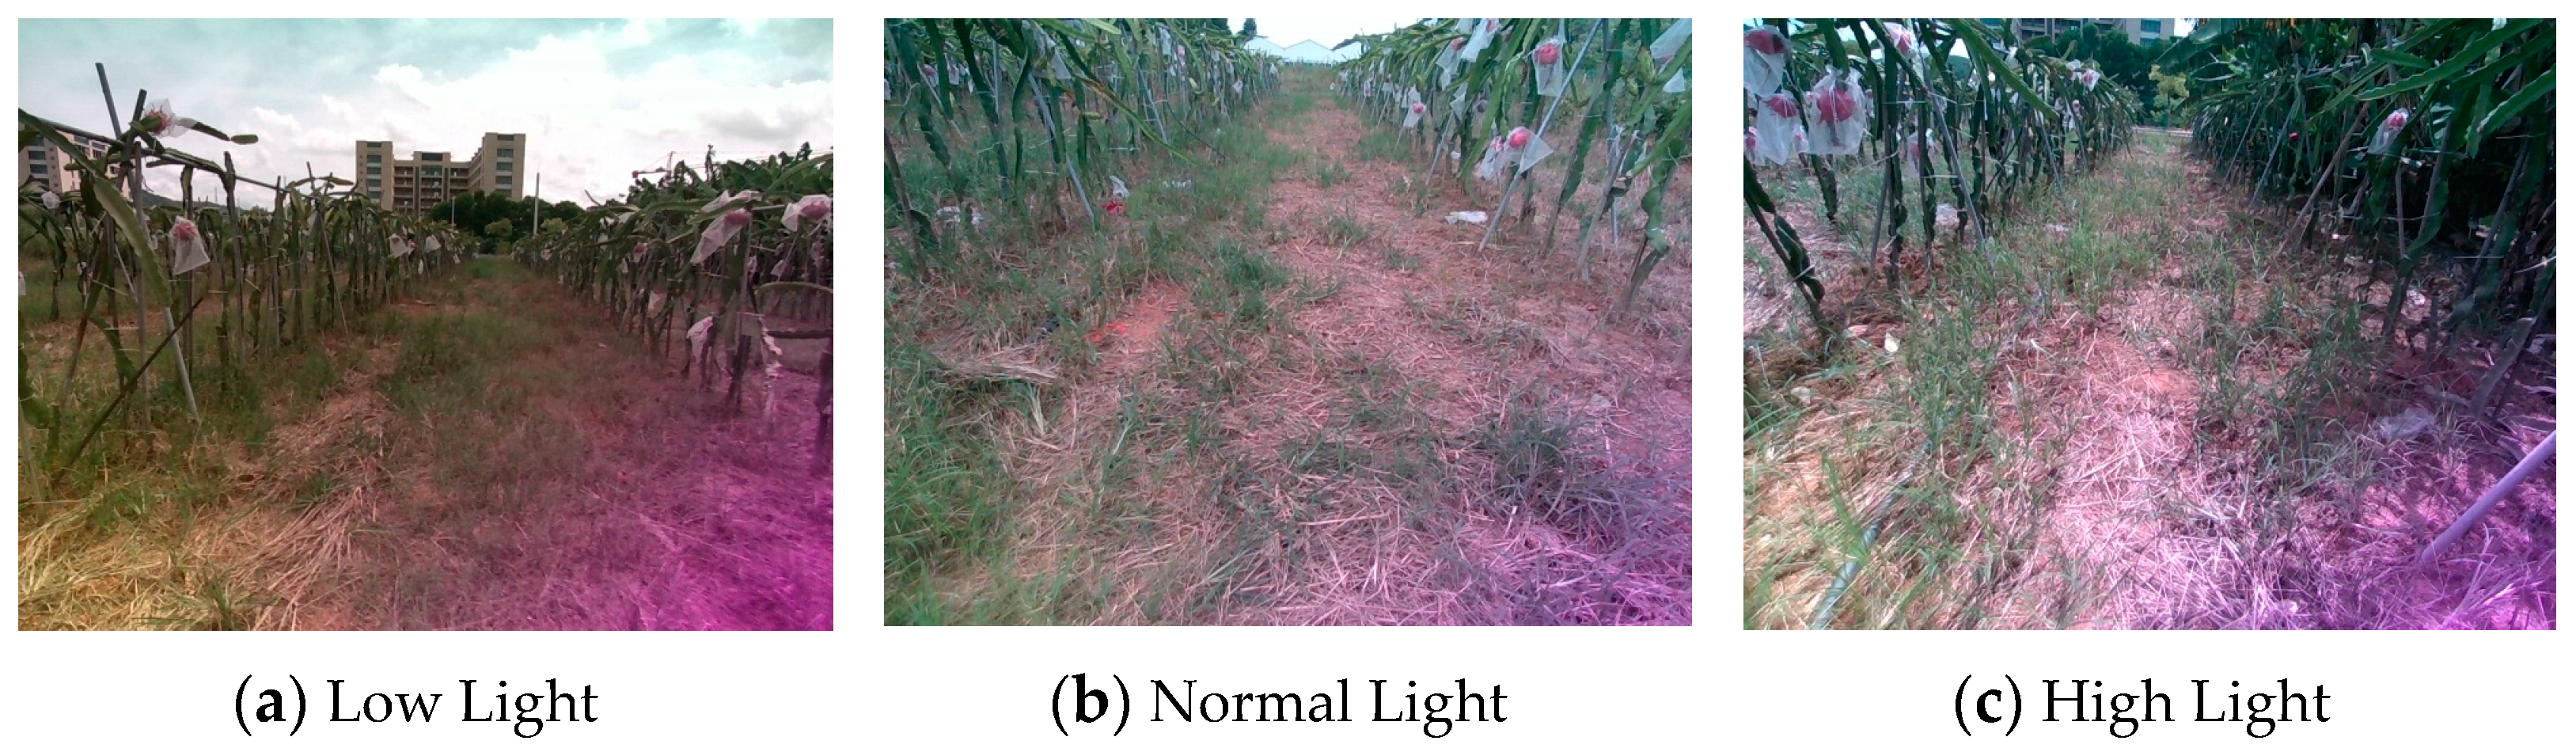
In this paper, images of pitaya orchard roads were captured in late August 2023 (clear weather) and mid-September 2023 (overcast weather) at a pitaya plantation in Baiyun District, Guangzhou City, Guangdong Province, China. The capturing device used was the REALSENSE D455 camera by Intel Corporation, with an image resolution of 640 × 480. During data collection, the depth camera was tilted downward by 10–15° at a height of 0.5 m–0.8 m, with the shooting direction facing directly ahead of the road. Images were saved in JPEG format in RGB. A total of 2000 pitaya orchard road images were collected and categorized into three types: sunny with direct light, sunny with backlight, and overcast (refer to Figure 1). In dragon fruit orchards, the road spacing is typically 2 m–2.5 m wide, with straight paths and the occasional presence of weeds. The ground soil has a moderate hardness. To enhance the robustness of model training, 1120 appropriate images were selected through manual filtering from the original collection. These images were then manually labeled using Labelme software (Version number 4.5.13). Subsequently, the dataset was divided randomly into training, testing, and validation sets, maintaining an 8:1:1 ratio. The training set was predominantly utilized to train the parameters of the DeepLabV3+ network model, the validation set was used for parameter fine-tuning during training, and the testing set served to assess the model’s ability to generalize.
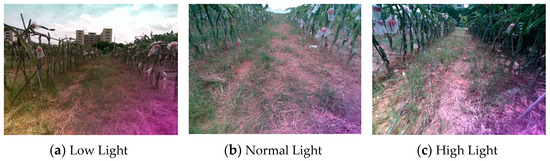
Figure 1.
Image Data.
2.2. Construction of Improved DeepLabV3+ Network Model
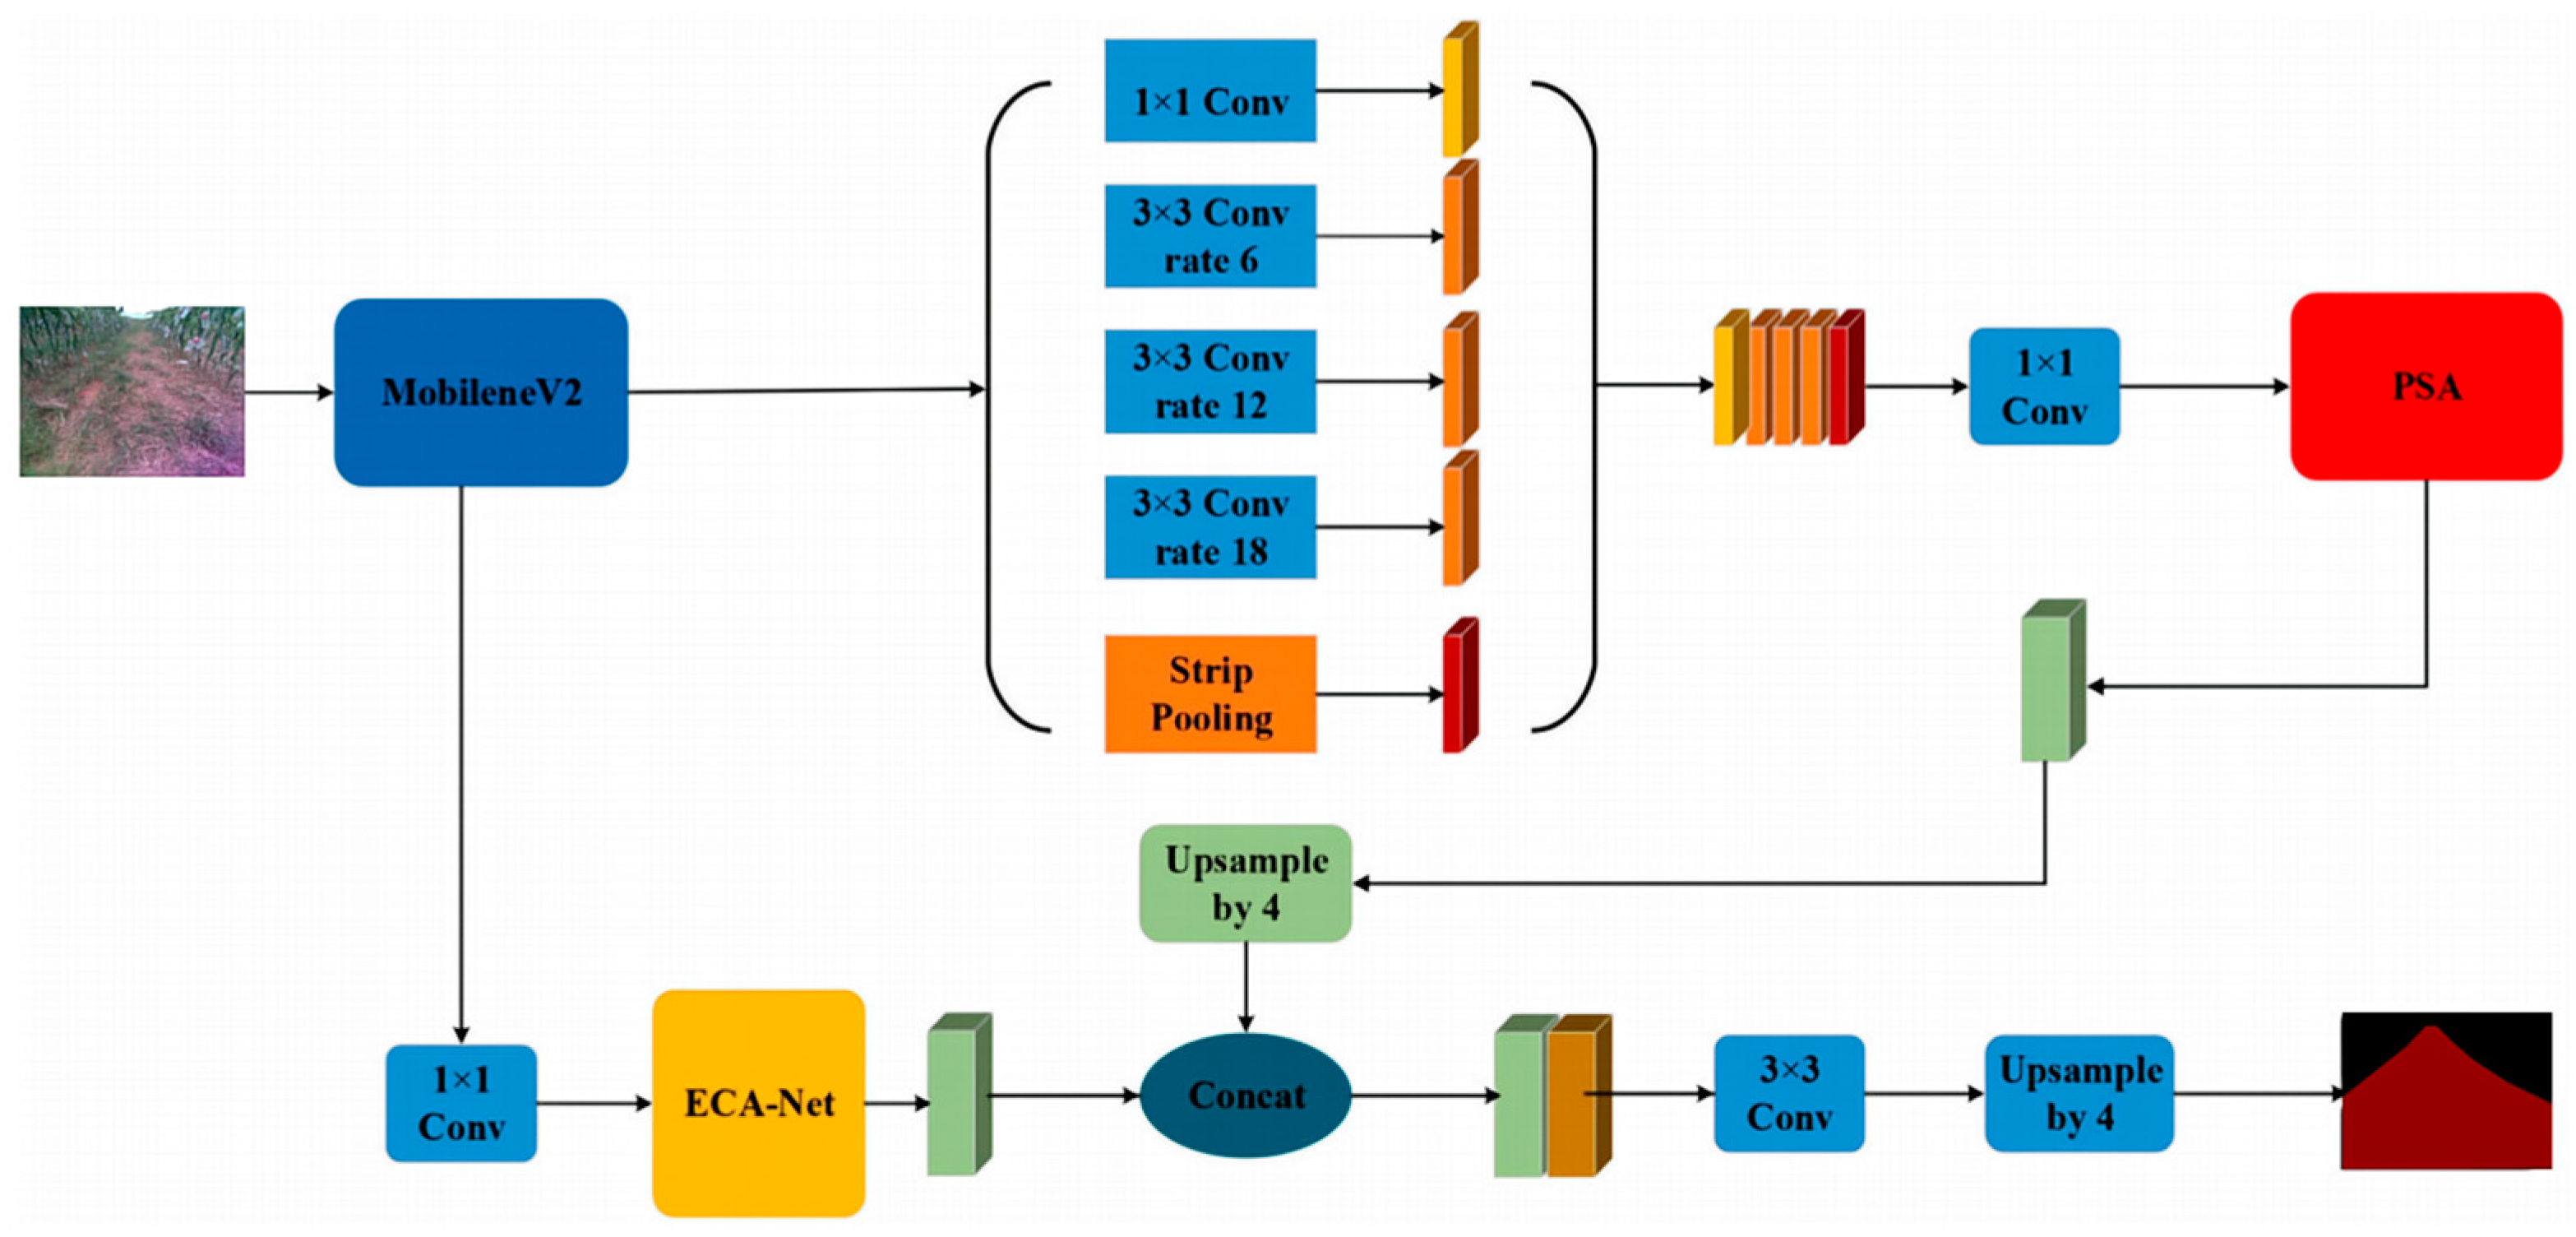
This paper aims to segment roads from their backgrounds into input images. However, the original DeepLabV3+ network model, to improve segmentation accuracy, chose the Xception network, which has a large number of layers and parameters. This paper proposes improvements to the traditional DeepLabV3+ network to address these issues. Initially, to address the issue of excessive parameters in the original feature extraction network, this paper employs the lightweight MobileNetV2 as a replacement backbone network and further enhances it to mitigate problems related to the loss of spatial details and inadequate feature extraction. Secondly, a PSA module is incorporated following the ASPP module to bolster the spatial feature representation of the feature maps, thereby improving the accuracy of semantic segmentation. Lastly, the ECANet channel attention mechanism is integrated following the lower-level features of MobileNetV2 to refine the clarity of segmentation boundaries. The enhancements made to the DeepLabV3+ network structure are depicted in Figure 2.
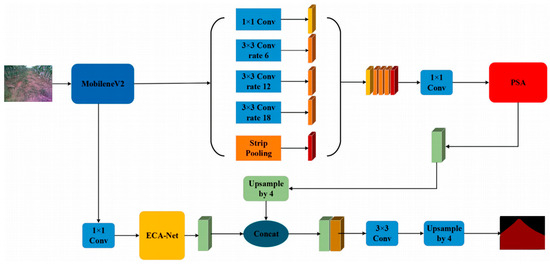
Figure 2.
Structure diagram of the improved DeepLabv3+ network.
2.2.1. PSA Network Structure
In response to the complex environment of pitaya orchards, this paper presents an attention mechanism designed to enable the model to concentrate on and extract effective information from complex scenes. To emphasize the importance of the spatial characteristics of orchard road information, a PSA module is introduced after the ASPP module. This PSA module is designed for extracting multiscale spatial information from road images at a finer level and for establishing long-distance channel dependencies.
The PSA module primarily consists of a Split and Concat (SPC) module and a Squeeze-and-Excitation (SE) module. The SPC module’s structure, depicted in Figure 3, enables feature splitting and merging. The input feature X with C channels is divided evenly into n parts, and each part is convolved with convolution kernels of different sizes to achieve various scales of receptive fields, thus capturing target information at multiple scales.
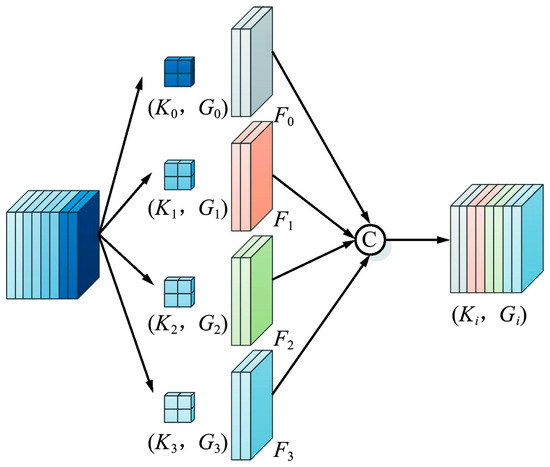
Figure 3.
Structural diagram of the SPC module.
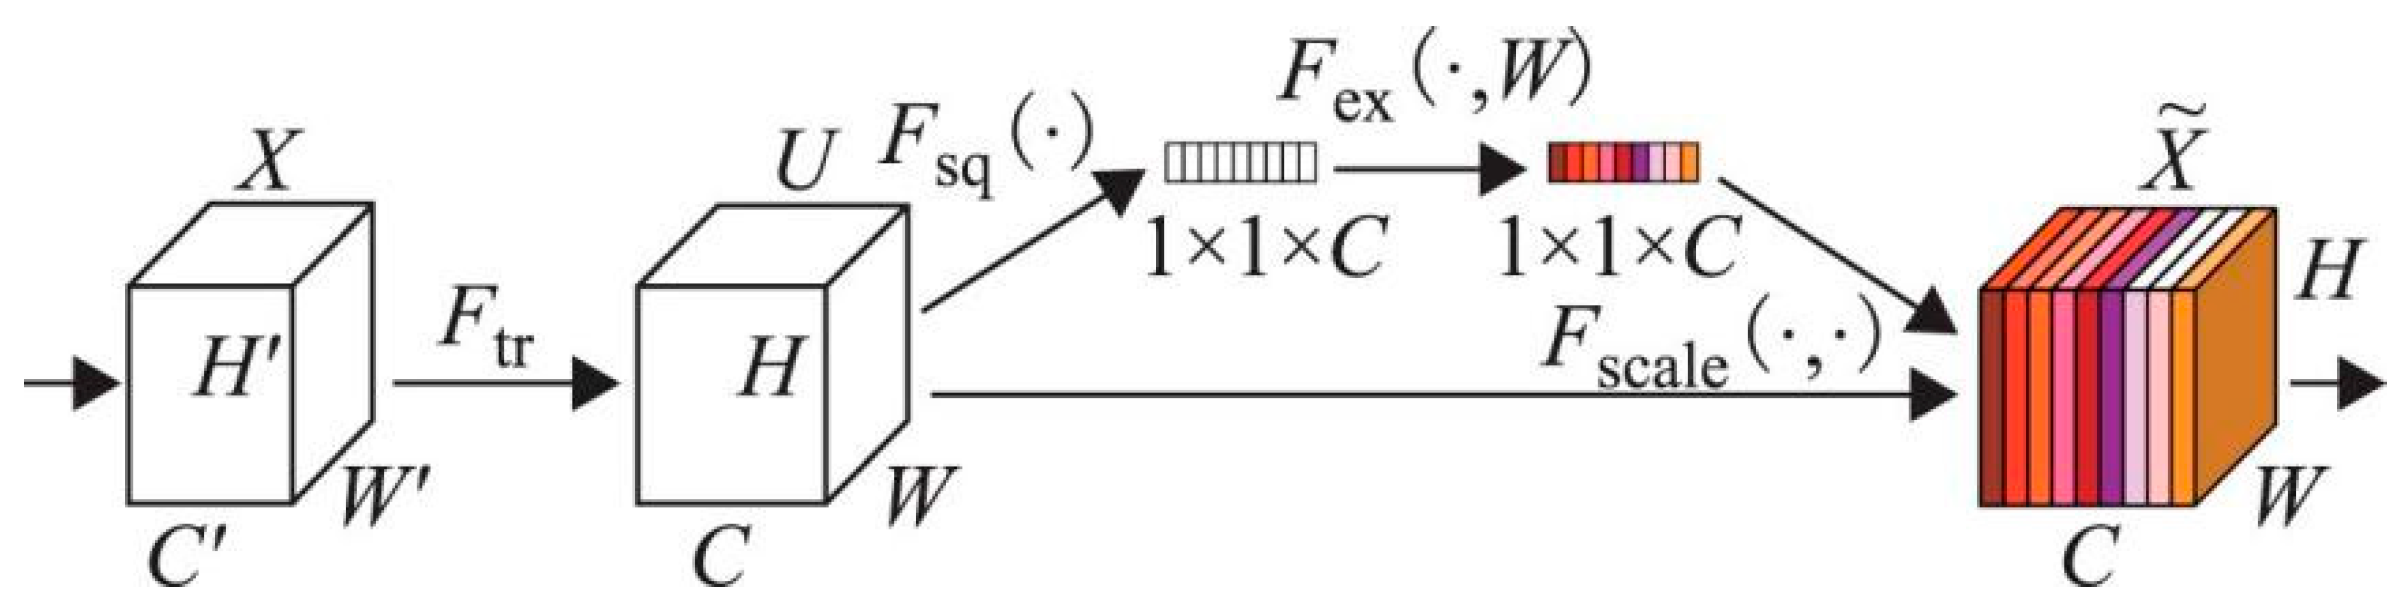
The SE module, shown in Figure 4, includes three main steps. Initially, the feature map of size H × W × C is compressed into global features of size 1 × 1 × C through global average pooling. Subsequently, these global features are rescaled based on a sigmoid activation function to learn all channels’ weight relationships, resulting in weights of size 1 × 1 × C. Finally, these weights are multiplied by the original feature map to enhance the accuracy of orchard road segmentation effectively.

Figure 4.
Structural diagram of the SE module.
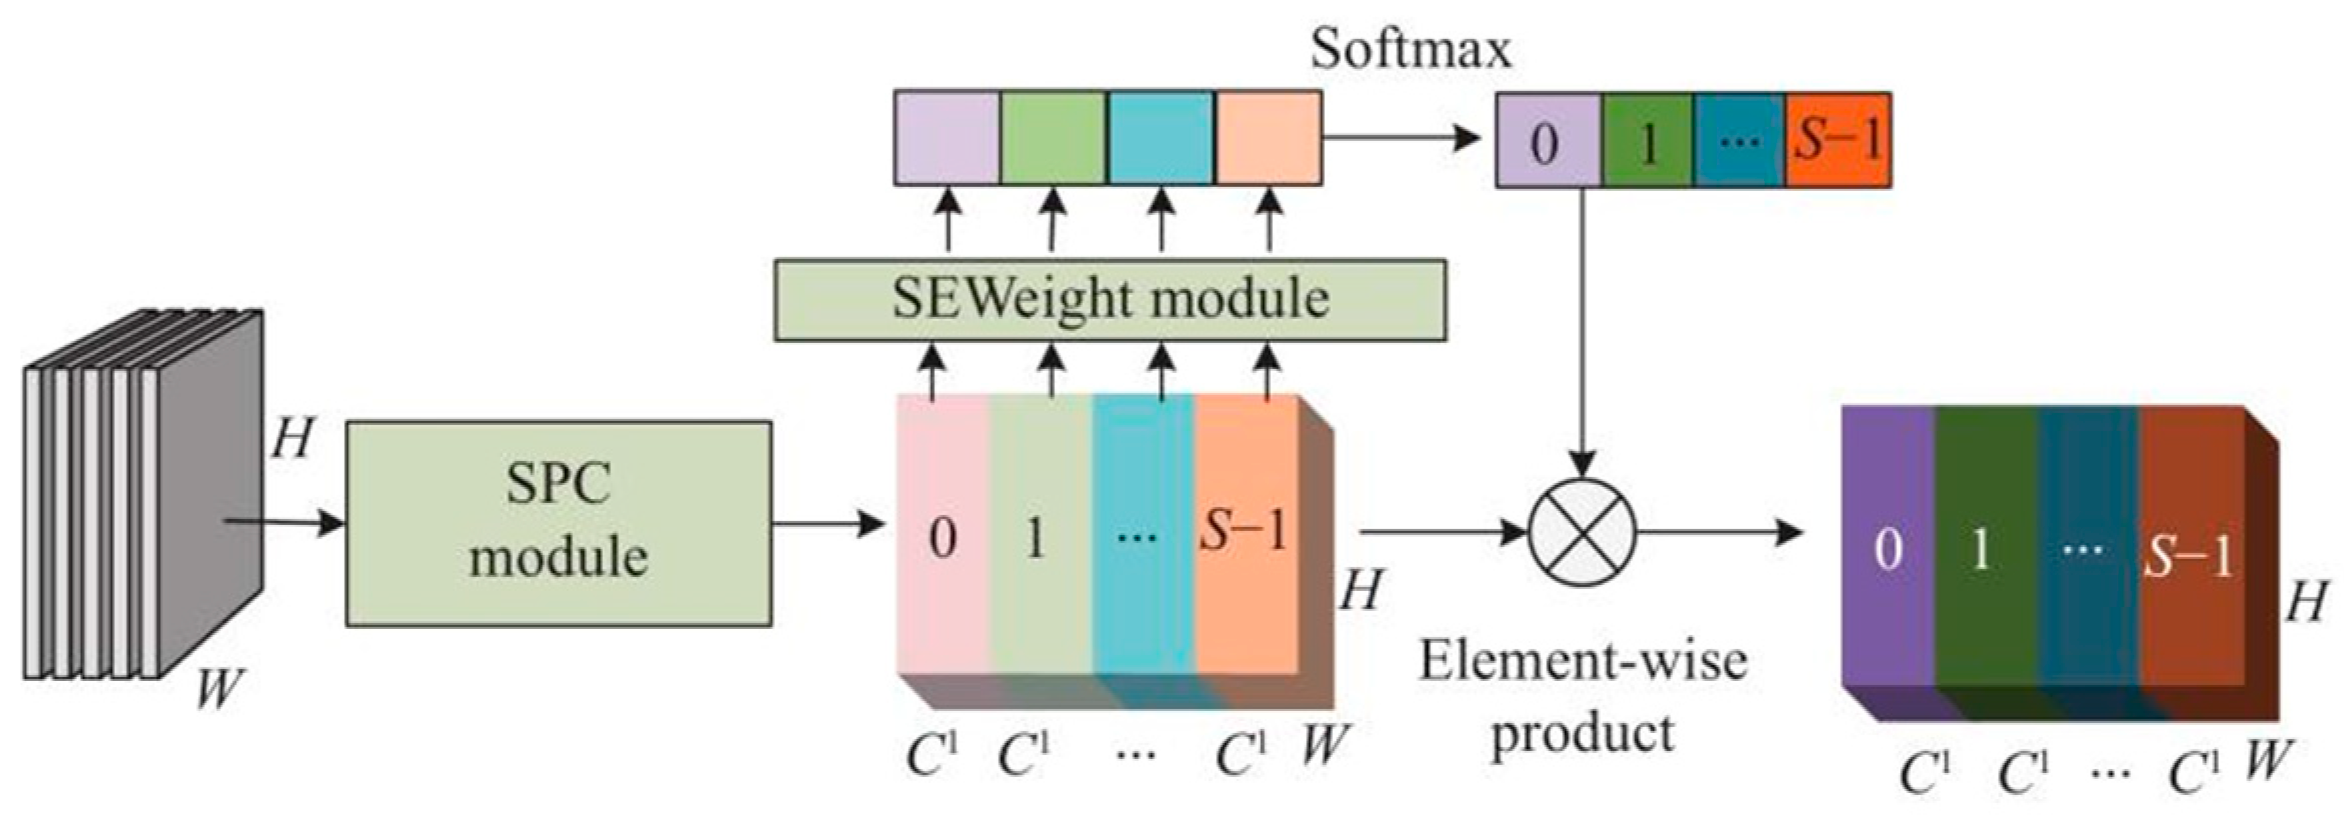
The PSA module, as illustrated in Figure 5, first decomposes the H × W × C feature vector into S blocks using the SPC module, obtaining multiscale feature maps in the channel dimension through a pyramid structure. The merged feature map U is then processed by the SE module to calculate the multiscale feature map channel attention weights (Zi). This approach allows the PSA module to combine multiscale spatial data and cross-channel attention, thereby producing more precise pixel-level attention in high-level feature maps. To facilitate interaction between local and global channel attention, softmax is used to recalibrate the multiscale feature map channel attention weights, and the final result ATTi includes both spatial position information and channel attention weights. These recalibrated weights are then multiplied by the feature map to produce the final segmentation result. In the context of image semantic segmentation, the PSA module merges multiscale spatial information with cross-channel attention to extract details at a finer resolution and create more extensive channel dependencies.
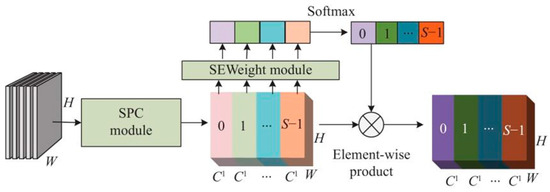
Figure 5.
Structural diagram of the PSA module.
2.2.2. ECAnet Module Network Structure
To enhance the perception ability of the DeepLabV3+ model for orchard roads and improve overall segmentation accuracy, this paper adopts the ECAnet attention mechanism. However, simple dimension concatenation does not provide rich contextual information. Given that the network uses a pre-training approach for the backbone network, inserting ECAnet is strategically carried out after the lower-level features of MobileNetV2 to enhance segmentation results without disrupting the network structure.
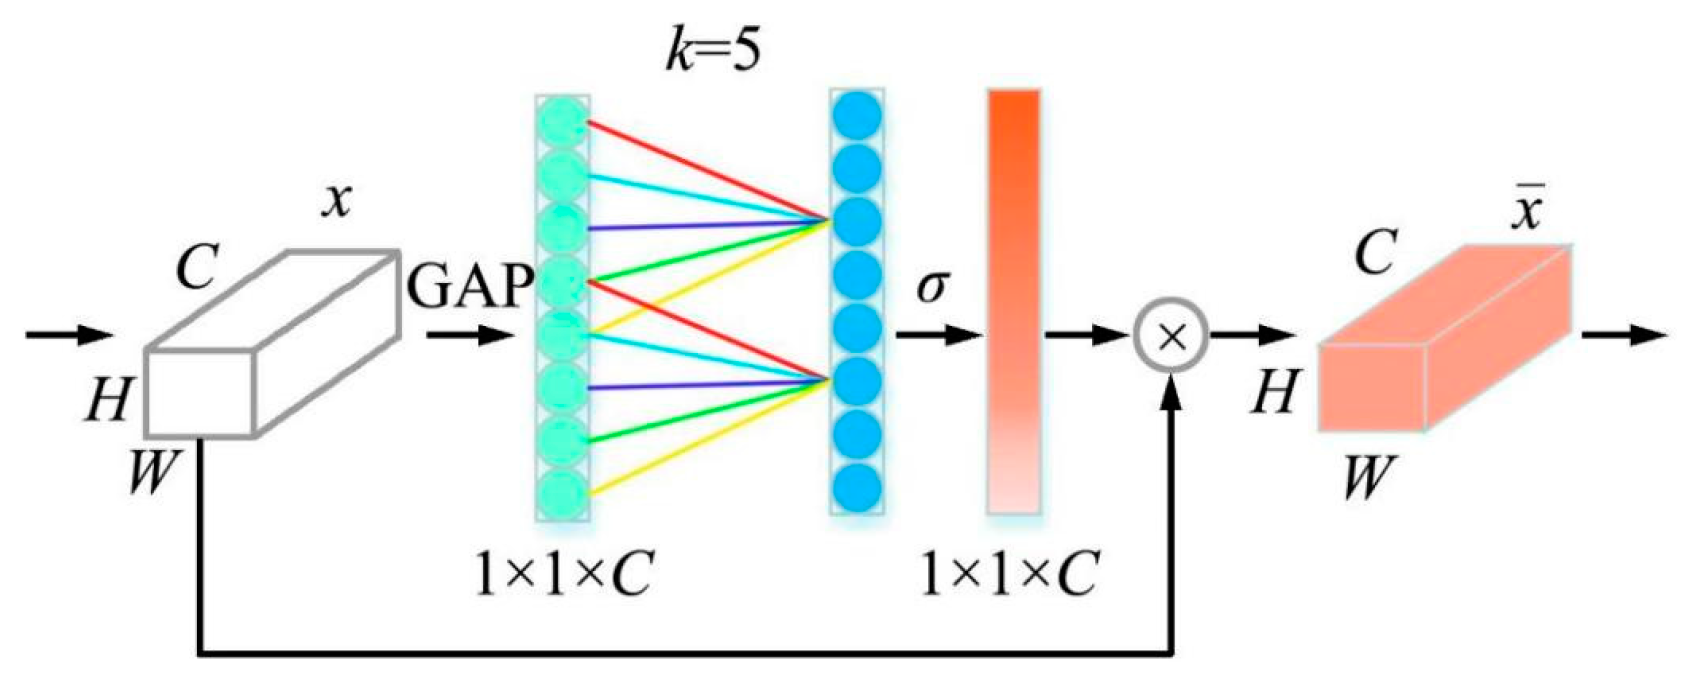
The ECAnet module (Figure 6) enhances the SE-Net by introducing a channel-focused attention mechanism that achieves notable performance improvements with only a slight increase in parameters. This module modifies the SE module by substituting its original fully connected layer with a one-dimensional convolution that features a variable kernel size. Its forward propagation process involves the input feature matrix passing through average pooling to produce a feature matrix of size 1 × 1 × C, which is then processed by sliding a one-dimensional convolution and nonlinearized using the sigmoid function. The relationship between the channel dimension C and the kernel size k is determined as follows:
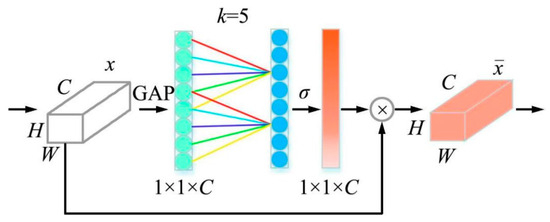
Figure 6.
Structural diagram of the ECAnet module. (ECA generates channel weights by performing a fast 1D convolution of size k).
By embedding ECAnet at different depths of the model, convolution kernels of various sizes are adaptively selected according to the channel dimension C. This design enables the network to achieve better feature fusion effects in the channel dimension and reduce computational complexity.
2.3. Experimental Setup and Evaluation Metrics
The training of the network model was conducted using a PyTorch-based deep learning framework. The proposed algorithm was implemented on a system running the Windows 10 64-bit operating system with Python 3.7 as the programming language. The hardware configuration included an Intel® Xeon® E7-12700H CPU at 2.30 GHz, 64 GB RAM, and an NVIDIA GeForce RTX 3060 GPU. The versions of CUDA and CUDNN used were 10.1 and 7.6.5, respectively.
In this experiment, the evaluation metrics adopted were mean intersection over union (MIoU), mean pixel accuracy (MPA), model memory usage, parameters (Params), and detection rate. Both ablation experiments and comparative experiments were designed to further verify the performance of the dragon fruit orchard road segmentation model.
where TP is the true positive; FP is the false positive; FN is the false negative; and k is the total number of classes including background.
Network Training and Parameter Settings
The model training process consists of two key stages: the freezing stage and the thawing stage. In the freezing stage, the parameters of the model’s backbone are set to be non-trainable, while only the parameters outside the backbone network are fine-tuned. This approach accelerates the network’s training speed and effectively maintains the stability of the weight parameters during the early stage of training. In the thawing stage, all model parameters become adjustable, allowing the model to adapt more flexibly to the training data.
Prior to initiating training, the collection of 1120 images was meticulously divided into training, validation, and test sets, maintaining an 8:1:1 distribution. Specifically, the training set included 896 images, with the validation and test set each holding 112 images. The DeepLabv3+ model demonstrated strong segmentation performance on the Pascal VOC 2012 and Cityscapes datasets with a batch size of 16 and a learning rate set at 0.007 [24]. These partitioning schemes functioned as hyperparameters for the model training. The training was then conducted using a batch size of 16 images over 300 epochs. The Stochastic Gradient Descent (SGD) optimizer was selected, with a momentum factor set at 0.9. To prevent overfitting, a weight decay technique was implemented with a decay coefficient of 0.0001, and the learning rate was adaptively adjusted based on the number of iterations per training epoch. To enhance model performance, pre-trained weights from MobileNetV2 provided by PyTorch were utilized. Given that the task of this paper was to segment roads and backgrounds, the number of model classes was set to 2.
2.4. Navigation Path Fitting
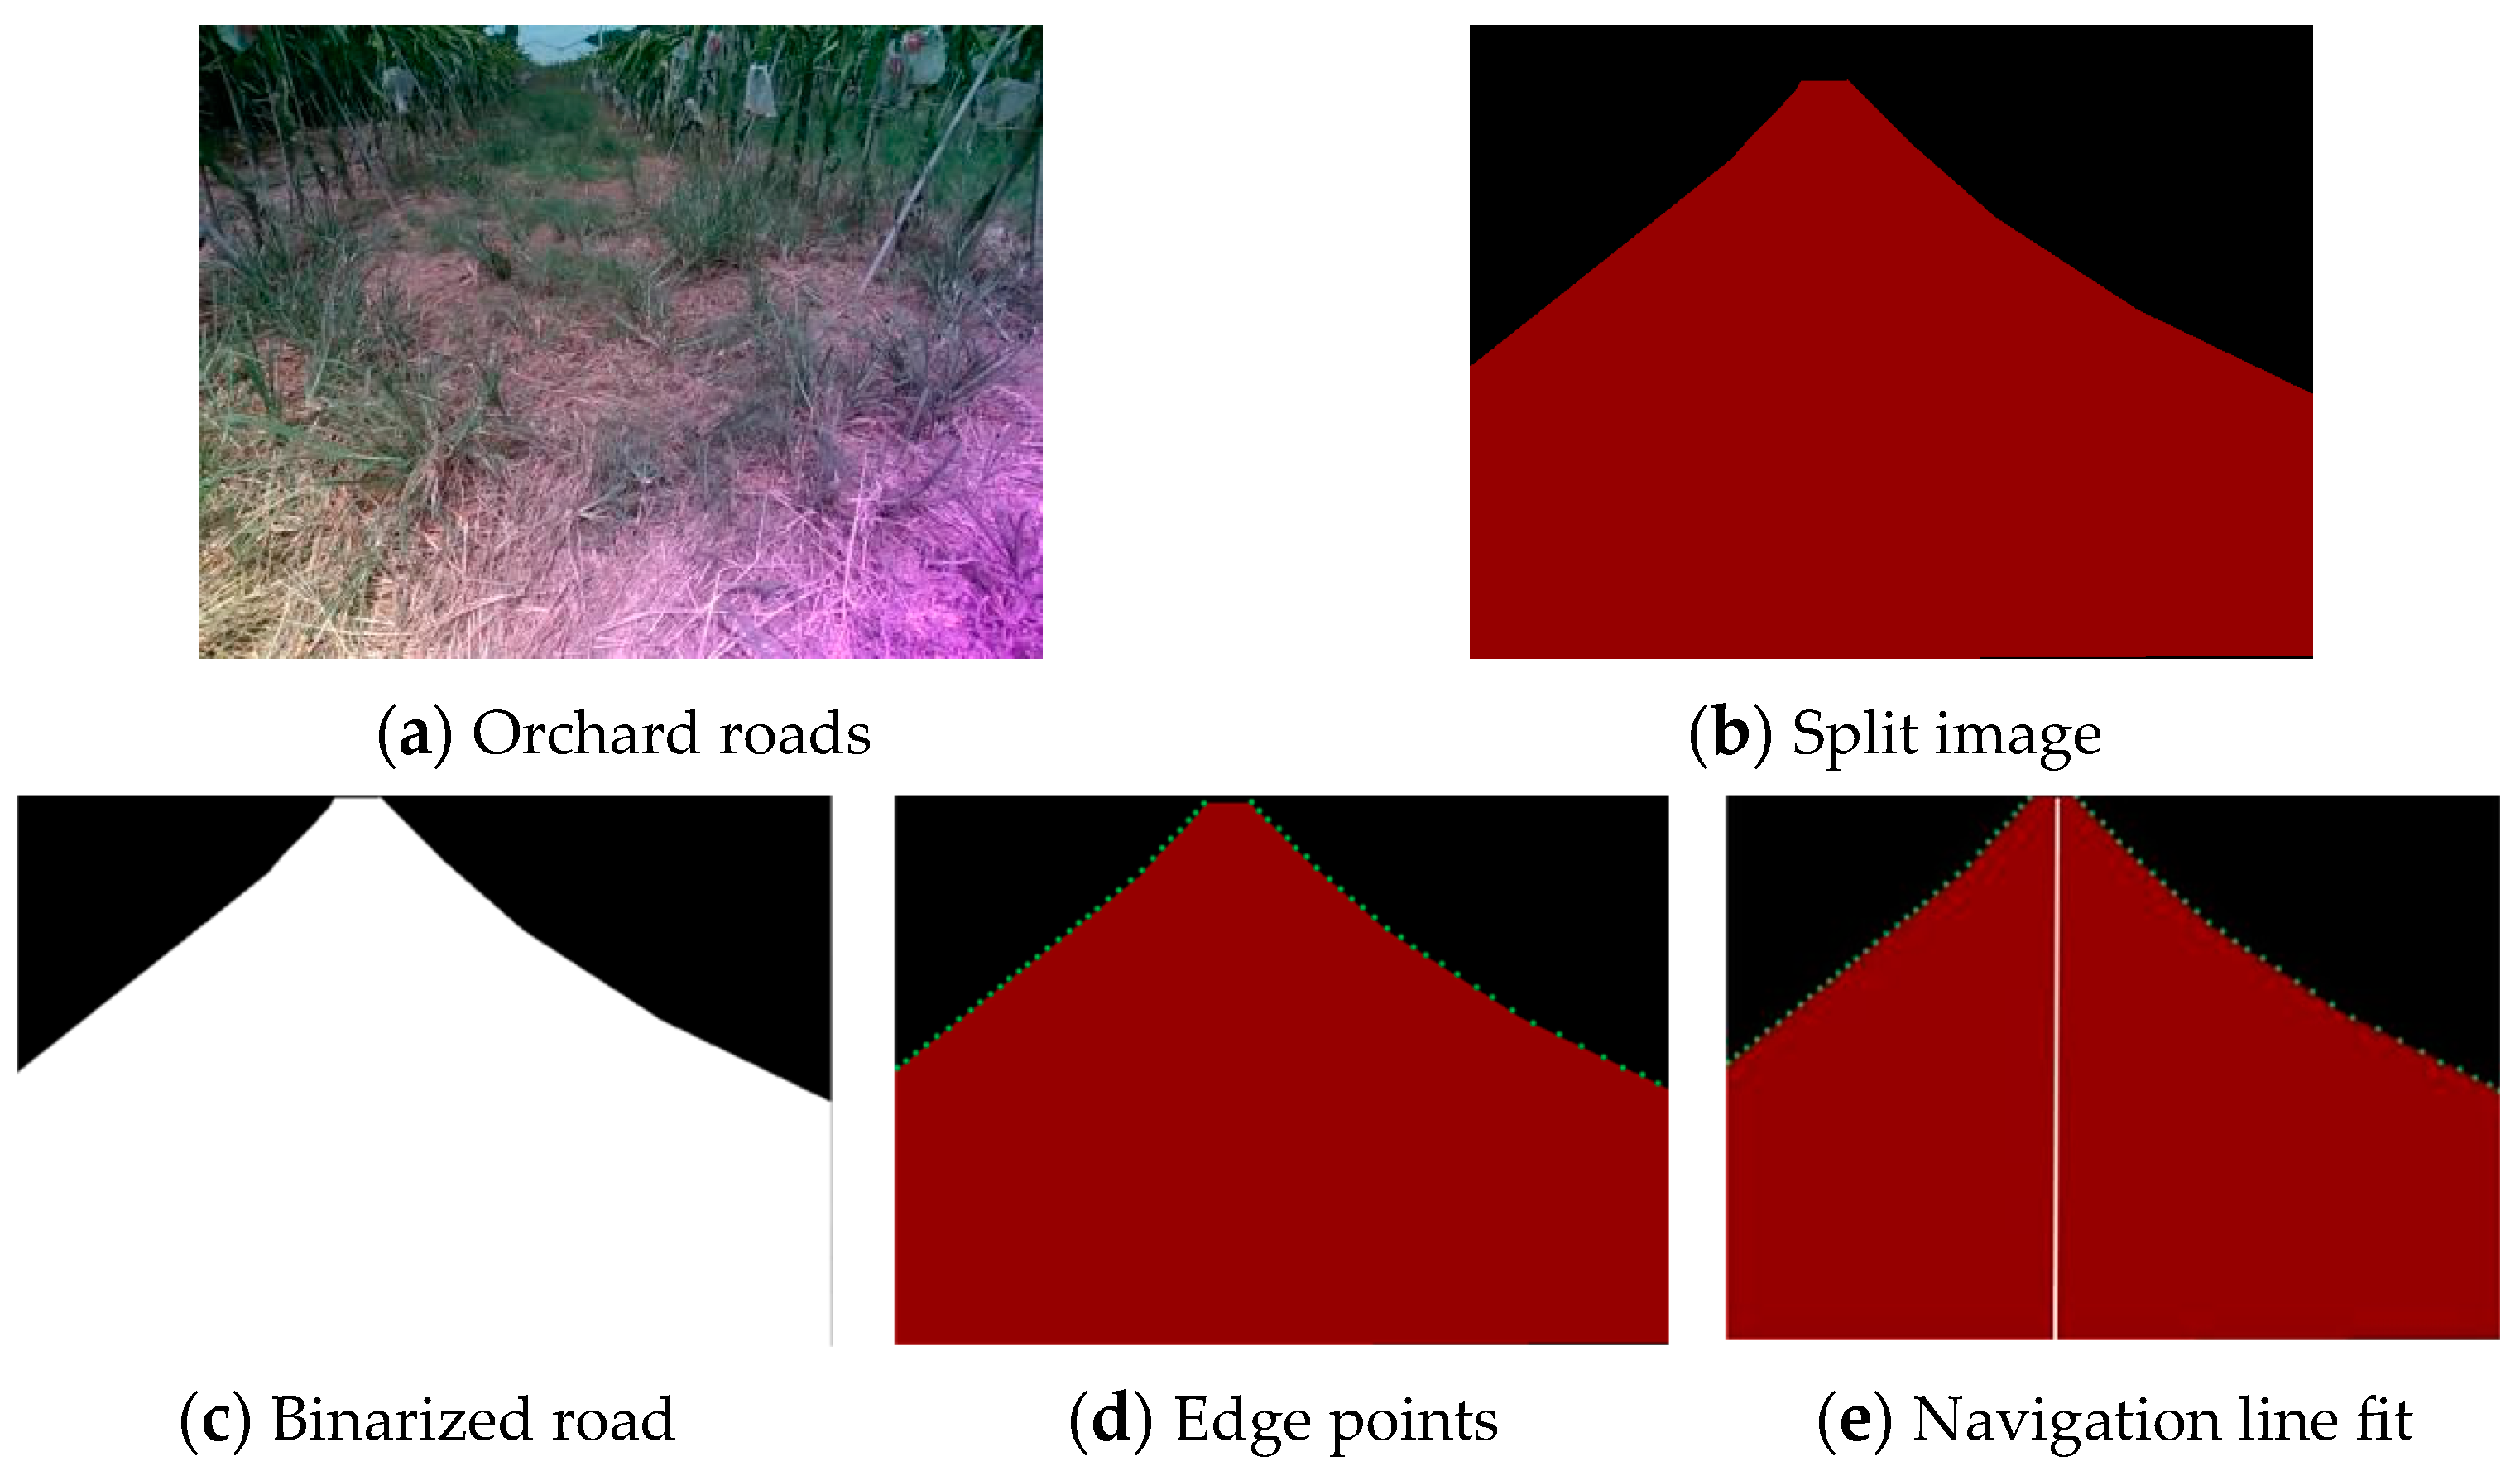
Based on the feasible driving area determined by the segmentation model, navigation lines can be further extracted. The pitaya orchard discussed in this paper follows a standardized planting pattern, and the orchard roads are relatively straight, which allows the road centerline to serve as the navigation path for the harvesting robot. Common algorithms used for line fitting include the Hough transform, random sample consensus, and the least squares method. Due to the unstructured nature of the orchard roads and the irregularity of road edge information, this paper utilizes road masks generated by the network model and applies a row-by-row scanning method to the input orchard images. This method detects the left and right edge points of pitaya orchard roads, determining the positions of pixels that correspond to these edges. Subsequently, the least squares method is employed to fit these edge information points to derive the navigation line.
2.4.1. Extraction of Left and Right Edge Information of Roads
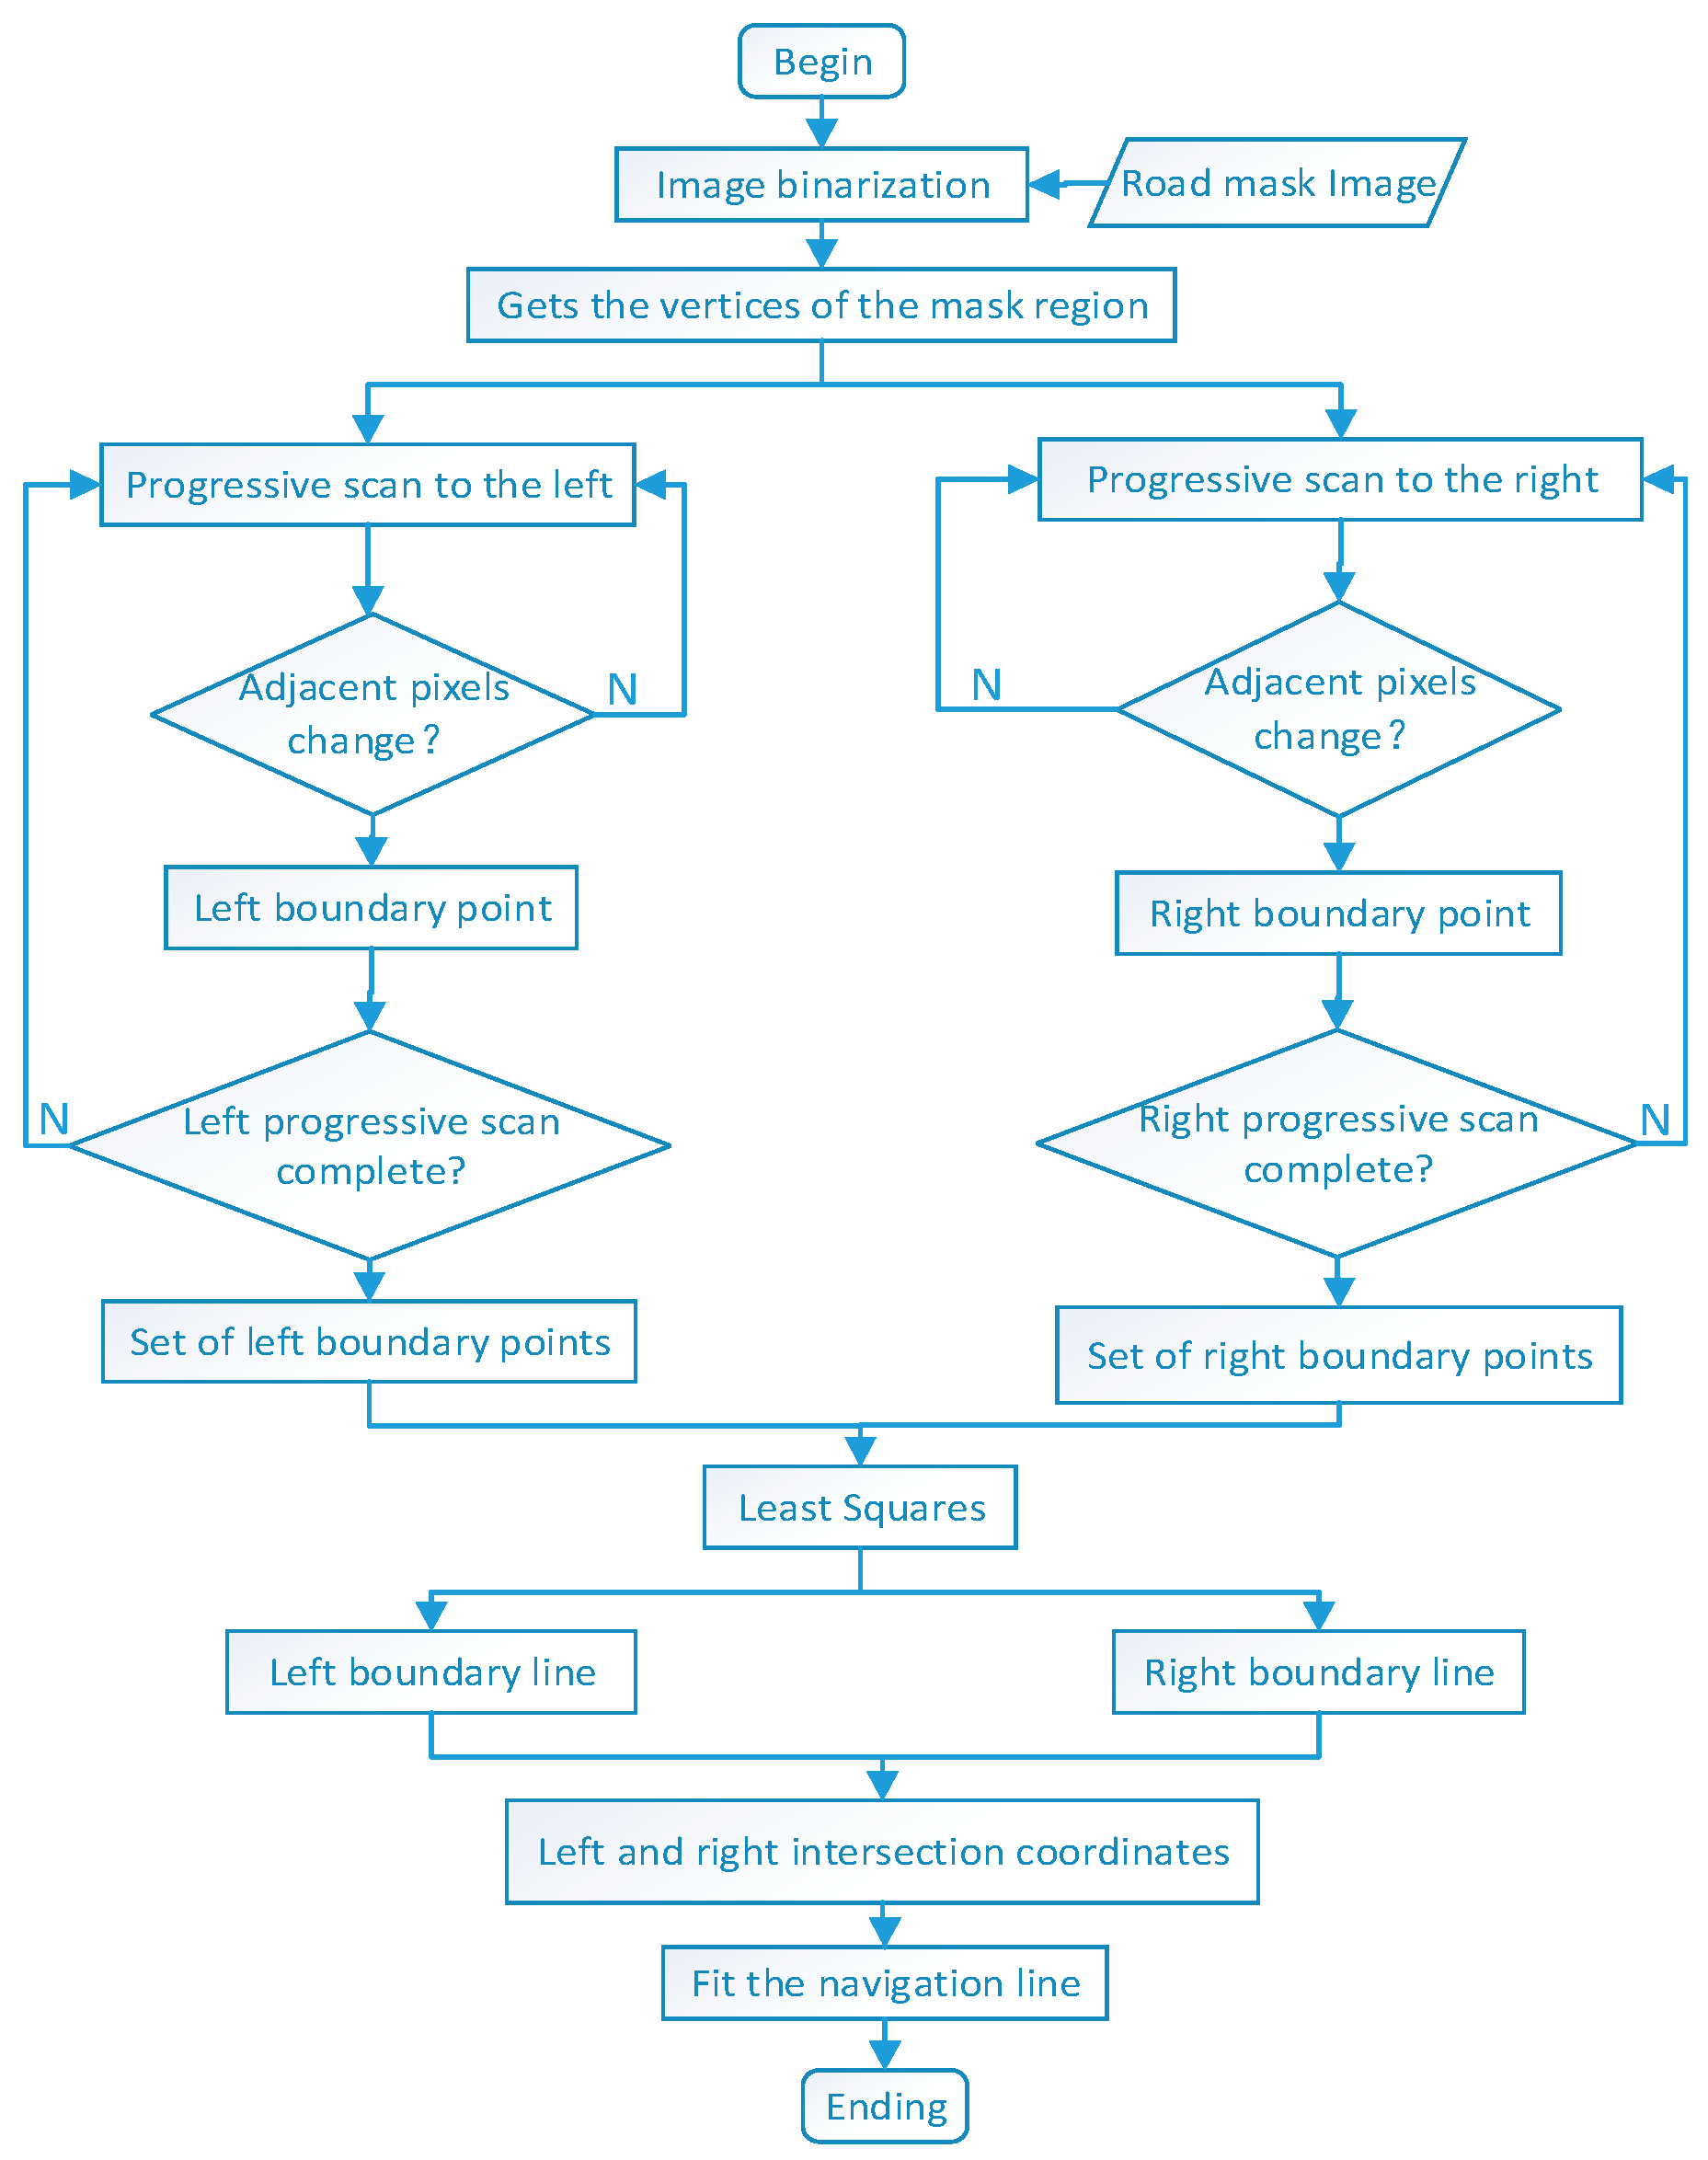
Firstly, the pitaya orchard road mask area generated by the model undergoes binarization processing to convert it into a binary image, ensuring that the pixel values of the road parts in the mask area are 255, while the background pixel values are 0. The road mask area is then treated as a trapezoidal area with a raised top edge. To extract the geometric information of road edges, it is necessary to determine the vertex positions of the mask area. This paper employs a method of scanning pixels row by row, starting from the left vertex of the image and scanning from left to right. When a pixel in the scan shows different pixel values in adjacent columns, this point is marked as a left boundary point. Similarly, starting from the right vertex of the image, scanning is performed from right to left. When a pixel shows different pixel values in adjacent columns, it is marked as a right boundary point. This process continues until all the pixels in the entire image are scanned. The final result provides the edge information of the mask area, including both left and right edge information. For each pixel (x, y), if the pixel values of its left adjacent pixel (x, y − 1) and right adjacent pixel (x, y + 1) differ from the current pixel value, the following conditions apply: if (x, y) = 255 and (x, y − 1) = 0, the current pixel (x, y) is marked as a left boundary point. Conversely, if (x, y) = 255 and (x, y + 1) = 0, the current pixel (x, y) is marked as a right boundary point. The entire process is illustrated in Figure 7.
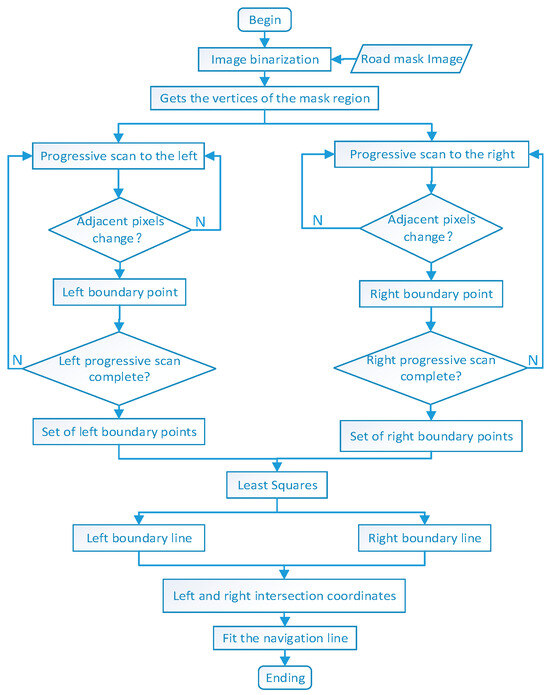
Figure 7.
Flow chart of the fitted navigation lines.
2.4.2. Fitting Navigation Paths Based on the Least Squares Method
The least squares method is a classic parameter estimation technique used to fit linear relationships in data. Its fundamental concept is to minimize the sum of squared residuals between known data points and the fitted line, thereby determining the parameters of the line. This method is noted for its mathematical rigor and computational efficiency. In this paper, using the coordinates of the left and right edge points of orchard roads, navigation points are selected in a certain proportion, and then the least squares method is applied to fit the navigation line of the vehicle chassis. According to the principles of the least squares method, to achieve a better fitting effect, the correlation coefficient R of the fitted line should be close to 1. Therefore, during the fitting process, it is crucial to adjust the parameters of the line to ensure that the fitting result aligns more closely with the actual data [25].
2.4.3. Fitting Left and Right Boundary Lines
The least squares method is employed to fit the left and right boundary lines. The goal of this method is to find a line that minimizes the sum of the squares of the distances from the line to all boundary points. The general equation of a line is represented as y = ax + b, where a is the slope and b is the intercept. The fitting process involves calculating the slope a and the intercept b using the coordinates (xi, yi) of the boundary points, where n is the number of boundary points.
The slope a is calculated using the following formula:
The intercept b is calculated using the following formula:
Using the calculated slope and intercept, the equations of the left and right boundary lines are determined.
2.4.4. Fitting Navigation Lines
Assume that the equation of the left boundary line is y = m1x + bl and the equation of the right boundary line is y = mrx + b, where ml and mr are the slopes of the left and right boundary lines, respectively, and bl and br are their intercepts.
The intersection points of the left and right boundary lines are obtained by combining their equations and solving for the coordinates (xi, yi) of the intersection points.
The navigation line is fitted through these intersection points. The equation of the navigation line is y = mnx + bn, where mn is the slope and bn is the intercept. The least squares method is employed to find the optimal slope mn and intercept bn that minimize the sum of the squares of the distances from the navigation line to all intersection points. For each intersection point (xi, yi), the distance from the navigation line to this point can be represented as follows:
The goal is to minimize the sum of the squares of all di, which is to minimize the following loss function:
By zeroing out the partial derivatives of the loss function, the optimal values for l mn and bn are determined, thereby deriving the slope and intercept of the navigation line. Subsequently, by merging the equations of the left and right boundary lines to determine the coordinates of their intersection points, the best-fit equation of the navigation line is established, effectively achieving the line fitting.
Evaluate the fitting effect of the navigation line based on the correlation coefficient R. The closer R is to 1, the higher the navigation accuracy, which can be expressed as follows:
where , , and are a set of the fitting point data. The overall segmentation effect of the navigation line is illustrated in Figure 8.
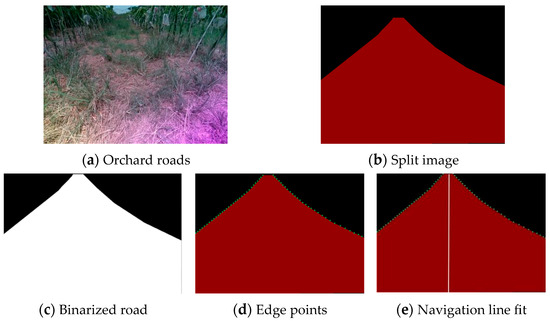
Figure 8.
Fitting navigation lines. (The green dot is the edge point of the split, The white line is the navigation line).
3. Results
3.1. Analysis of Different Module Ablation
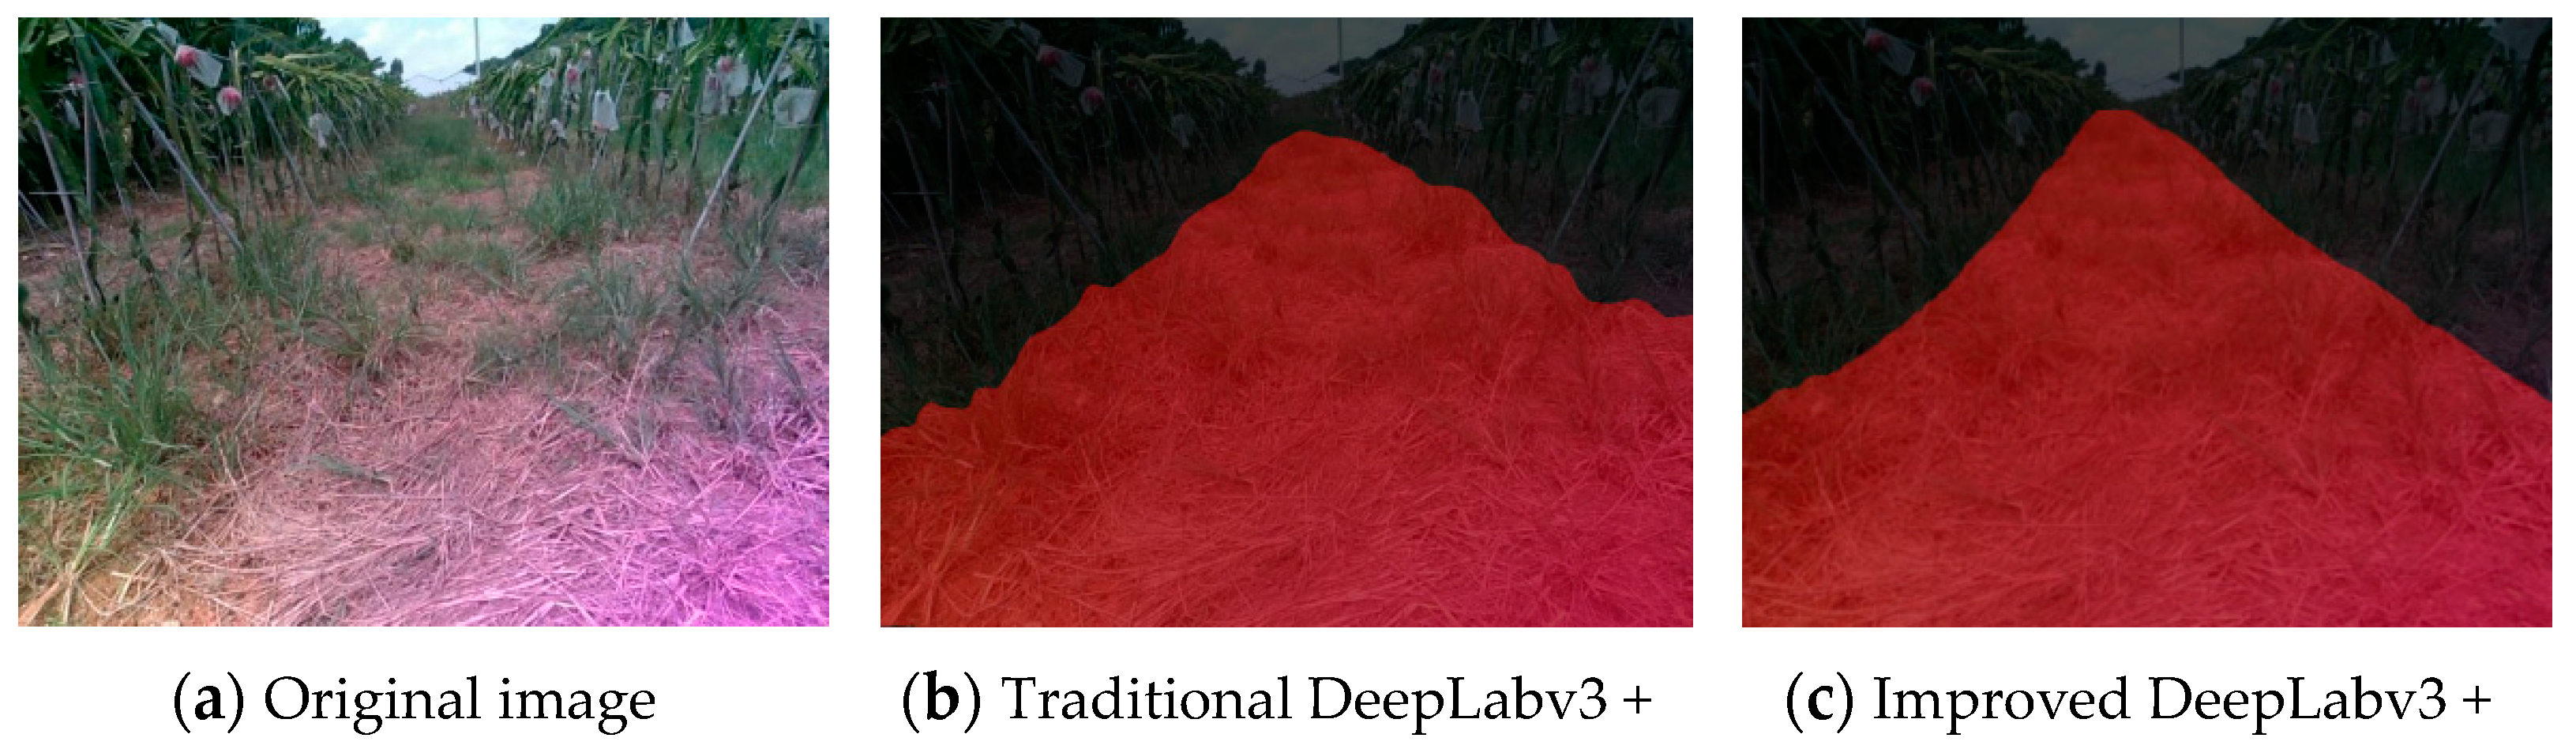
To demonstrate the effectiveness of incorporating the PSA and ECAnet attention mechanism modules into the traditional DeepLabV3+ network, a complex orchard road image was selected from the validation set for comparative validation (see Figure 9). The traditional DeepLabV3+ network struggled with weeds when extracting road edge information, resulting in a less smooth fit of road edge information. However, the improved network more effectively extracted road edge information, thereby making it more complete and enhancing the network model’s feature extraction capability.

Figure 9.
Comparison of orchard road segmentation. (The red area is the road).
To further explore the impact exerted by adding these modules on the model’s segmentation results, this paper conducted ablation experiments with five different improvement schemes based on semantic segmentation evaluation metrics. Table 1 lists the experimental results.

Table 1.
Results of the ablation experiments.
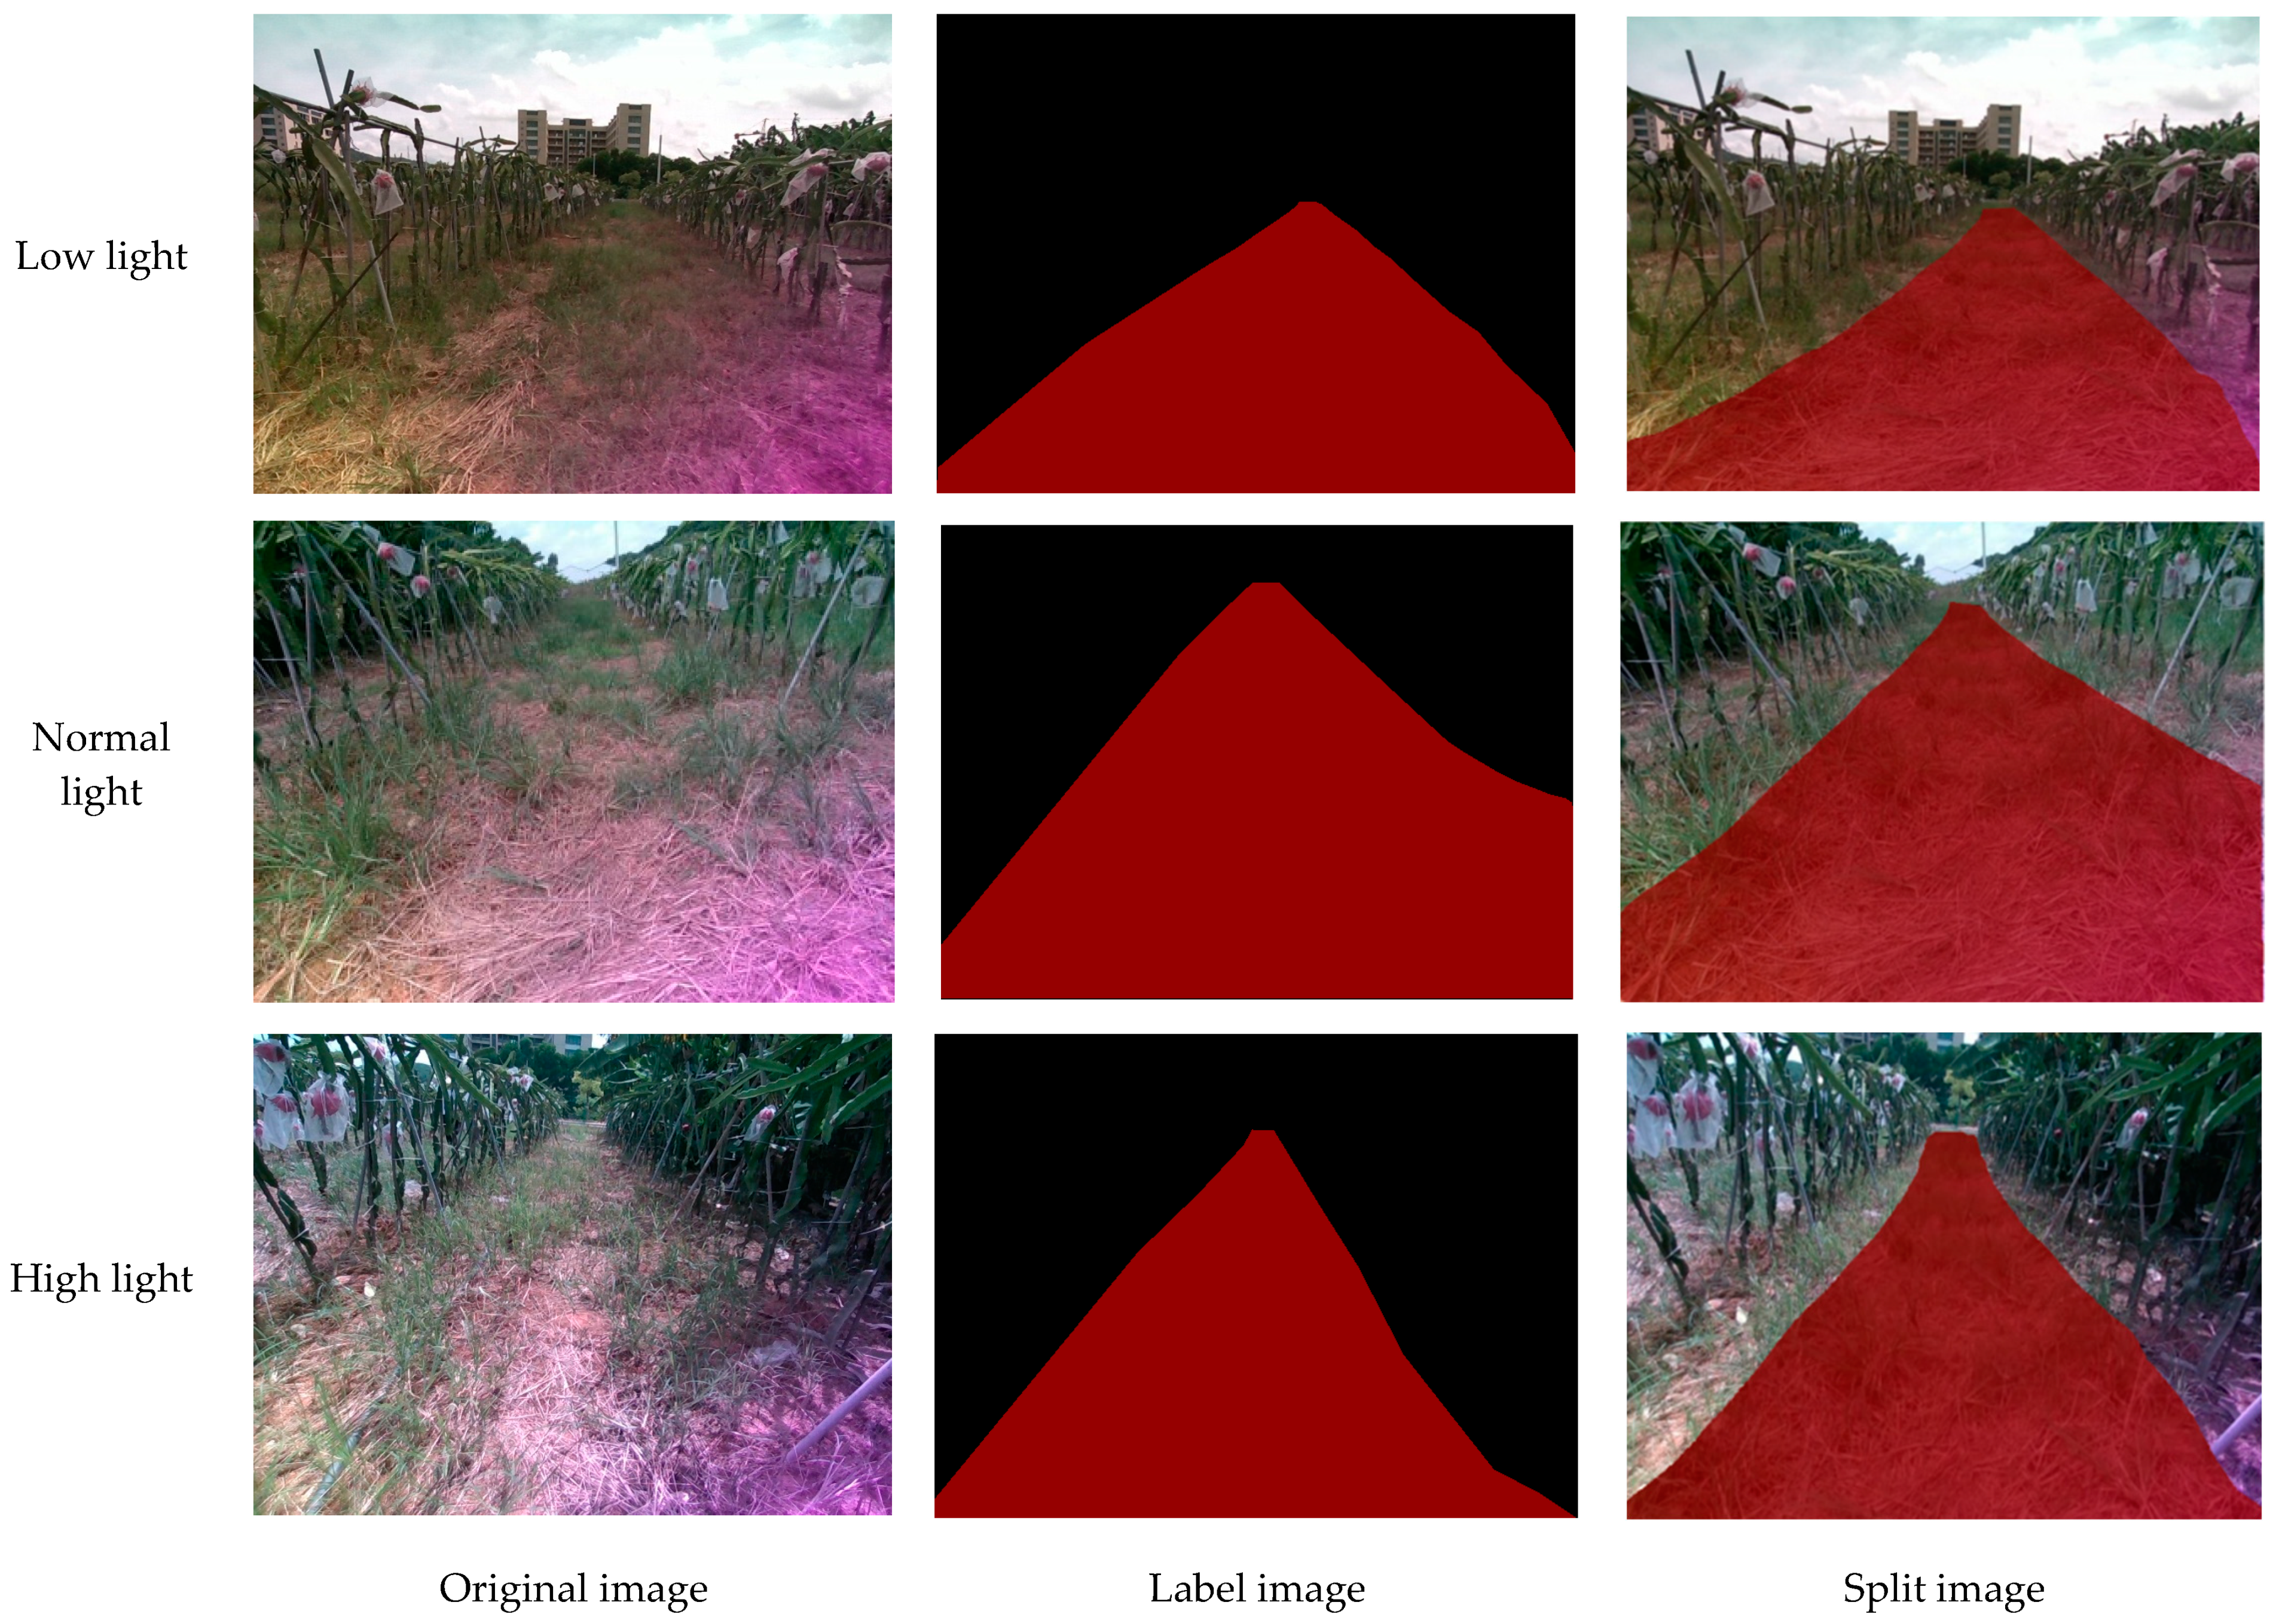
From Table 1, it is evident that replacing the backbone network of DeepLabV3+ from Xception to MobileNetV2 increased the detection rate by 22.36 frames per second while significantly reducing the number of parameters and model memory usage. The parameter count was only 11% of that of the original model, and the model memory usage decreased by 88%. Additionally, after integrating the PSA module into the MobileNetV2 backbone network, although the parameter count and model memory usage slightly increased by 7.7% and 1.9 MB, respectively, the MIoU and MPA increased by 0.11 and 0.03 percentage points, respectively, suggesting that the PSA module can improve the segmentation accuracy of the model to a certain extent. Moreover, after adding the ECAnet module, the MIoU and MPA increased by 0.07 and 0.12 percentage points, respectively, while the changes in parameter count and model memory usage were minimal, increasing by only 0.5% and 0.2 MB, respectively. This suggests that the ECAnet module can improve the model’s segmentation accuracy without significantly increasing the complexity of the model. When contrasted with the original model, the improved DeepLabV3+ network model demonstrated enhancements in both segmentation accuracy and detection rate. It is noteworthy that the parameter count and model memory usage of the improved network model increased by only 2.3 MB when contrasted with the original model. Therefore, the enhanced DeepLabV3+ model is more suitable for orchard road detection and is easily deployable on embedded and mobile devices. The segmentation effect of the improved network under various environmental conditions of the orchard road scene is illustrated in Figure 10 and Table 2.
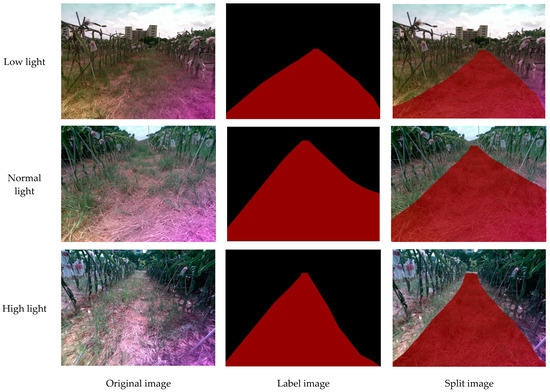
Figure 10.
The segmentation results of road scenes under different environmental conditions. (The red area is the road).
Table 2.
Performance comparison of different network models.
3.2. Performance Comparison of Different Models
This paper conducted comparisons with other high-accuracy segmentation networks, namely Pyramid Scene Parsing Network (PSPNet) [26], U-Net [27], and Fully Convolutional Network (FCN) [28], for further evaluating the segmentation performance of the improved DeepLabV3+ model. These models were trained using the dragon fruit orchard road dataset, and their training outcomes are presented in Table 2. The improved DeepLabV3+ model surpassed PSPNet in terms of segmentation accuracy and detection rate, as presented in the data in Table 2. Specifically, MIoU and MPA increased by 0.45 and 0.16 percentage points, respectively, while the detection rate improved by 10.35 frames per second. Additionally, the parameter count and model memory usage decreased by 85.64%.
When contrasted with U-Net and FCN, the improved model demonstrated a slight decrease in segmentation accuracy, but it significantly outperformed in detection rate, number of parameters, and memory usage of the model. Specifically, the detection rate increased by 11.40 frames per second and 12.32 frames per second when contrasted with U-Net and FCN, respectively. The parameter count and model memory usage decreased by 84.70% and 85.06%, respectively. This model achieves higher segmentation efficiency while being more lightweight, thereby enhancing its practical application efficiency.
3.3. Evaluation of Navigation Line Extraction Results
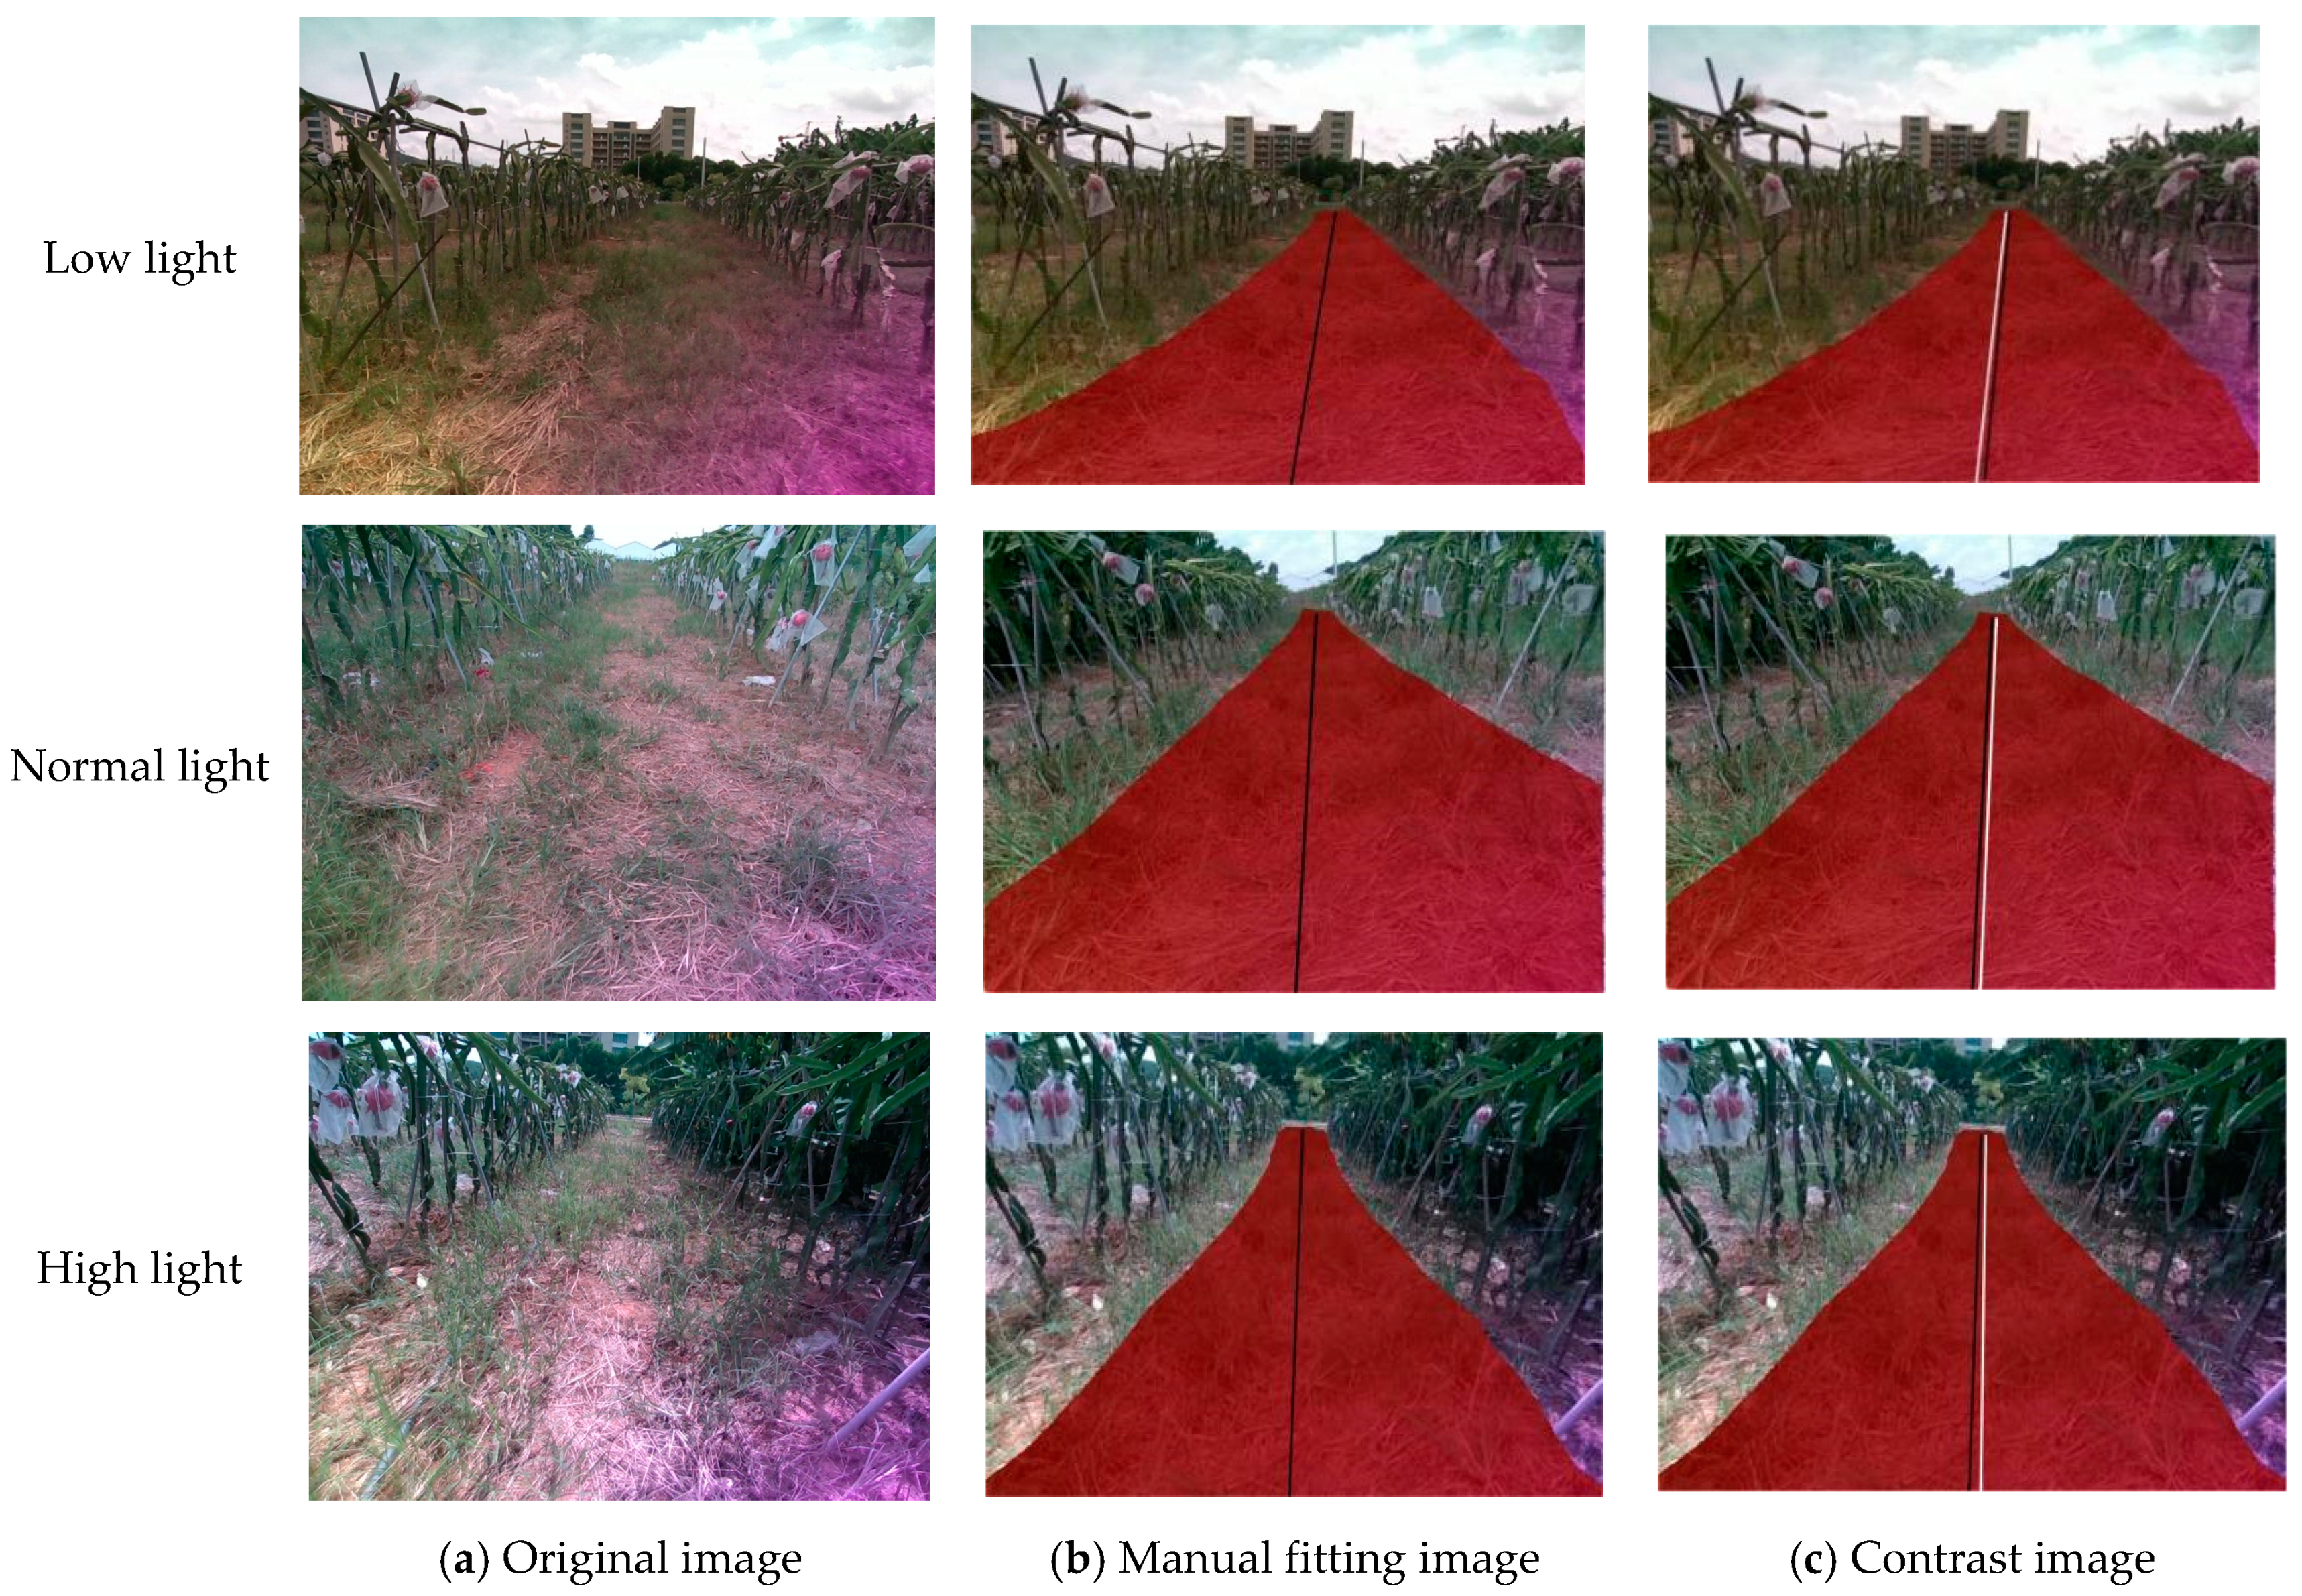
This paper assessed the accuracy of the navigation lines extracted by comparing them with manually fitted orchard road centerlines. An angle error of less than 5° between the extracted centerline and the manually fitted centerline was considered effective. In the centerline segmentation comparison chart, 10 equidistant pixel detection points were selected vertically. The horizontal pixel difference between the least squares method linear fit and the manually fitted centerline at the same vertical coordinates was used to measure the navigation line pixel error. The table below summarizes the experimental findings, showing that the angle deviation θ of the navigation line, determined using the least squares method, is under 5°.Navigation path accuracy test is illustrated in Figure 11.The relevant data is shown in the Table 3 and Figure 12.

Figure 11.
Navigation path accuracy test.
Table 3.
Average accuracy and average processing time test for the navigation path.
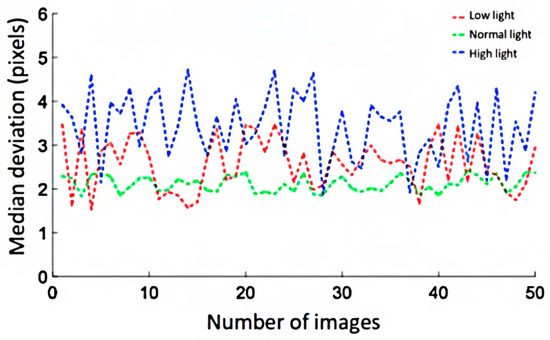
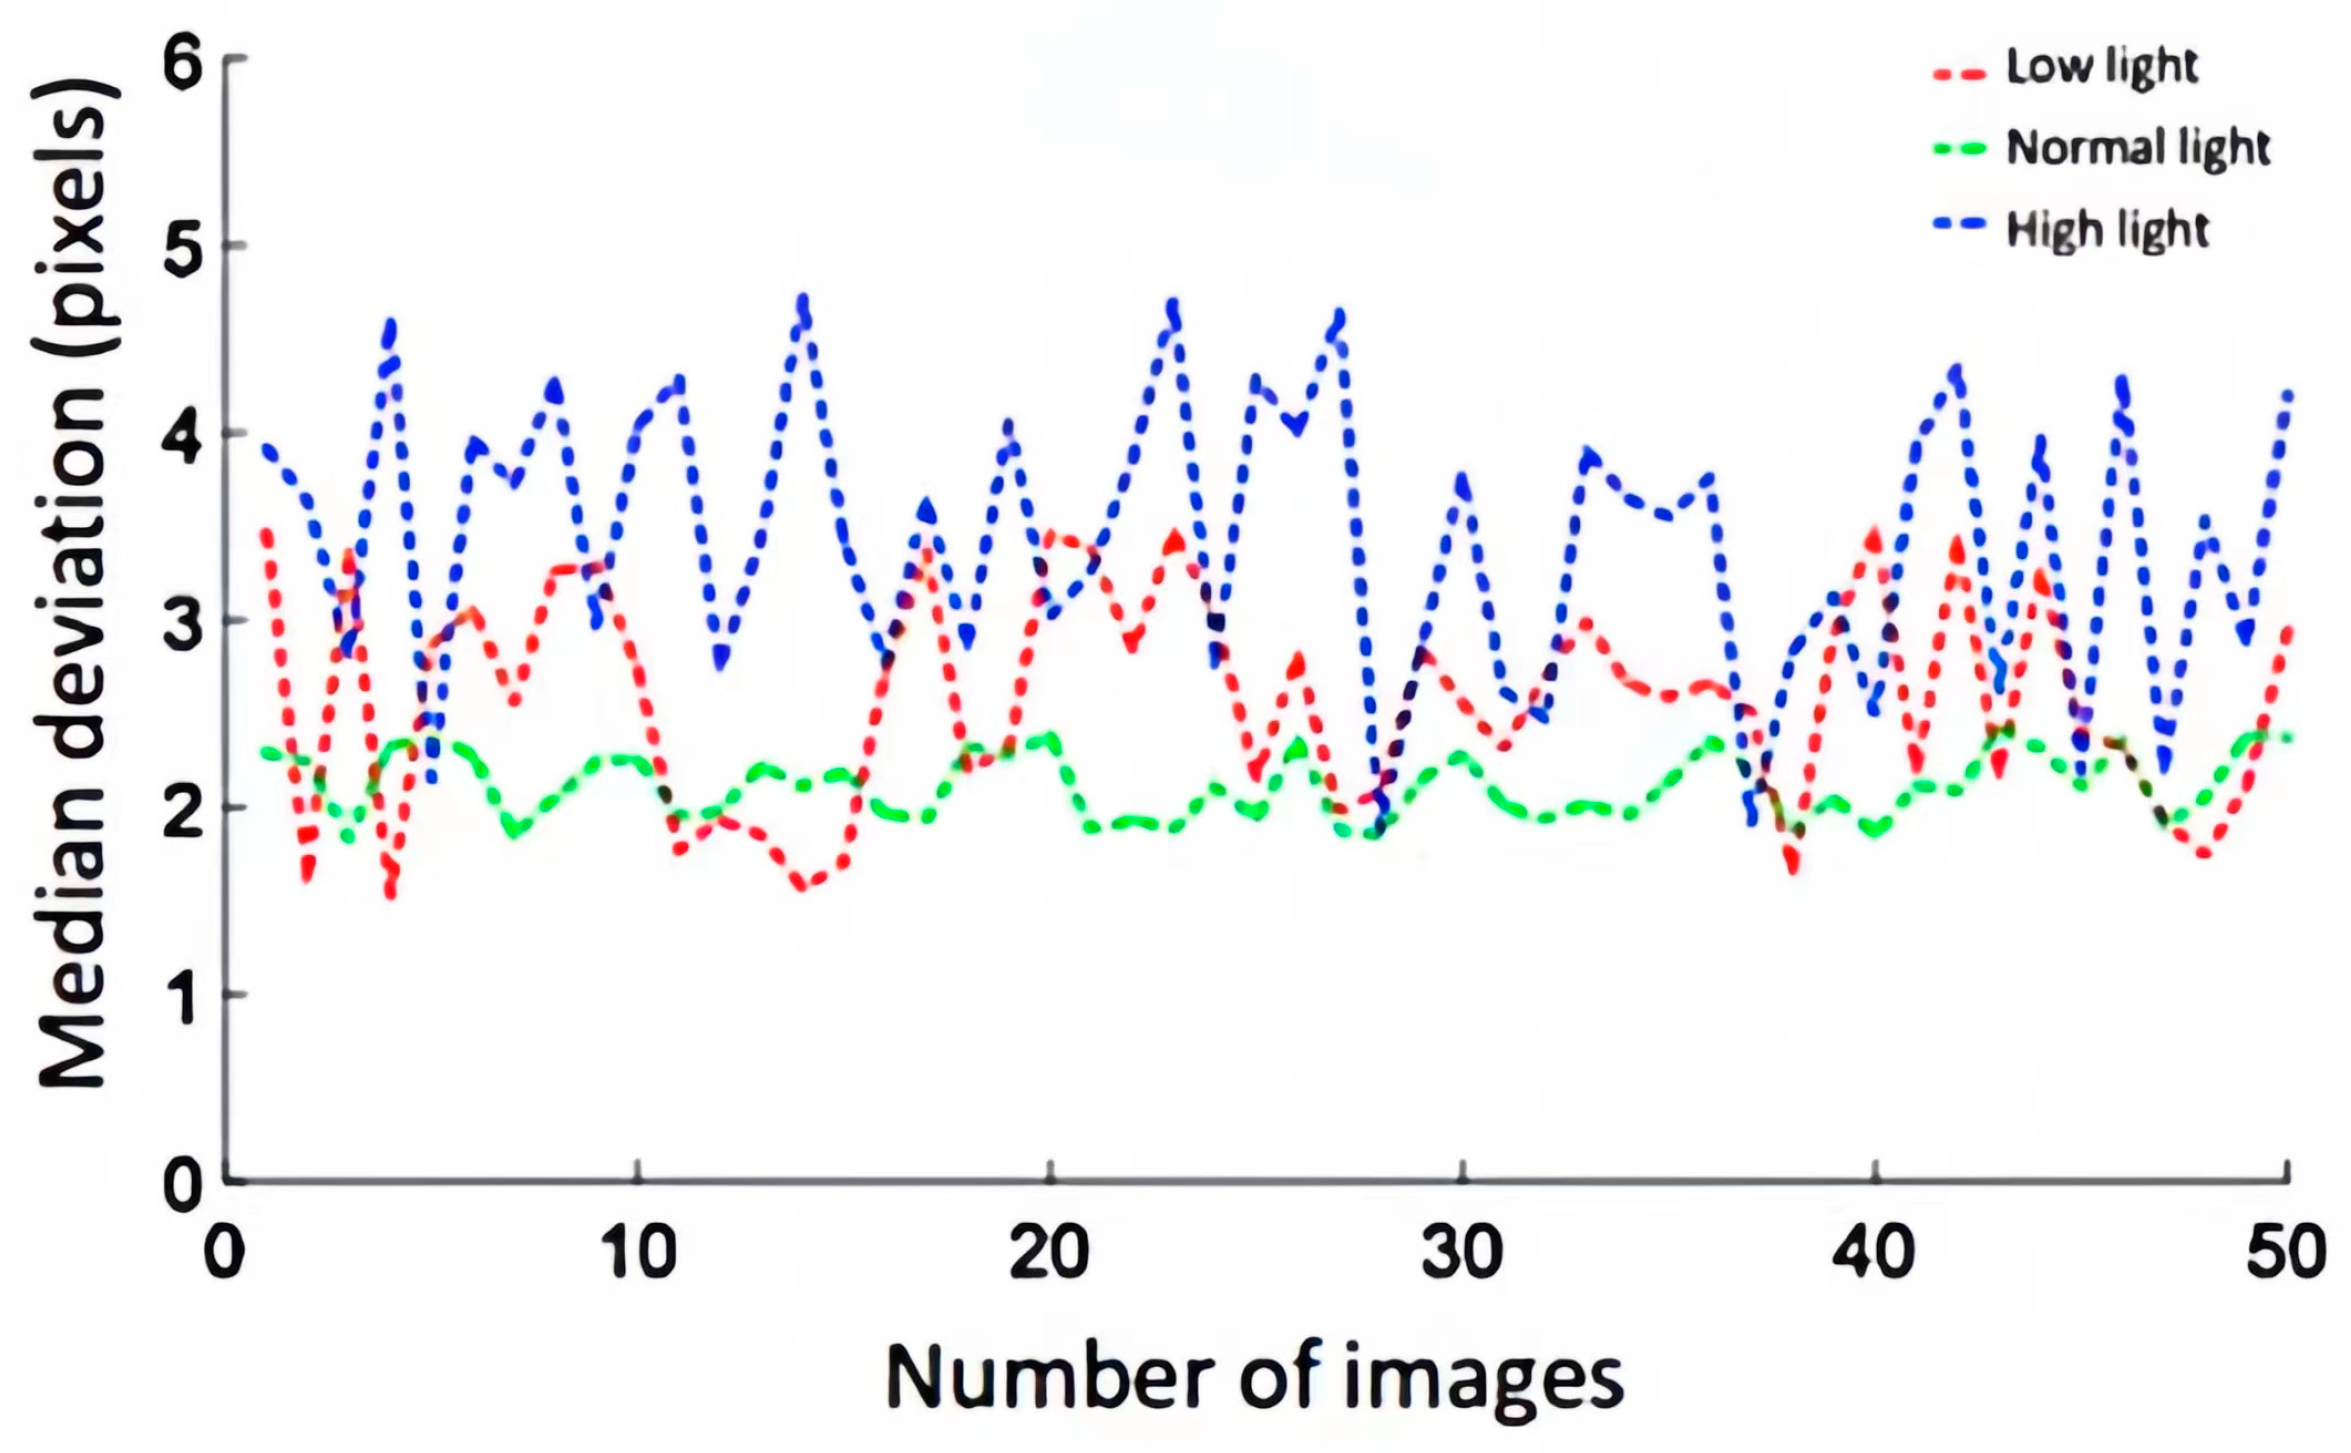
Figure 12.
The deviation statistical curve.
The equation for calculating the pixel error is expressed as follows:
where is the direction vector of the manually fitted centerline; is the direction vector of the least squares fitted centerline; is the dot product of vectors and ; and and are the norms (lengths) of vectors and .
Under three different lighting conditions, the deviation of the extracted road centerline was minimal under normal lighting, maximal under bright conditions, and intermediate under low lighting conditions. This suggests that overly dark or bright lighting can impair the accuracy of centerline extraction. Additionally, the average deviation from the actual road centerline under these lighting conditions was only 2.66 pixels. The average recognition time for image identification under different lighting conditions was 0.10 s. Thus, this research method demonstrates good adaptability and real-time performance under varying lighting intensities, and the extracted road centerlines are highly accurate.
4. Discussion
While the model proposed in this paper successfully achieves precise and swift road segmentation within dragon fruit orchards, it still exhibits certain limitations. (1) The terrain of dragon fruit orchards may encompass undulations, slopes, and irregular shapes, potentially hindering the model’s adaptability to terrain fluctuations. In particular, in intricate terrains, the model may generate omissions or false detections, leading to inaccurate road identification and suboptimal navigation paths. (2) A model trained solely on a dataset from one dragon fruit orchard may struggle to generalize effectively to other orchards due to variances in terrain, lighting conditions, and other factors. In forthcoming research endeavors, we intend to integrate supplementary sensors and combine visual data, including Inertial Navigation Systems (IMU) and Global Positioning Systems (GPS), to further fortify the robustness and precision of the navigation system. Furthermore, we will employ transfer learning methodologies to apply models trained in one dragon fruit orchard to the road recognition task in diverse orchards, thus enhancing the model’s applicability across various orchard environments.
5. Conclusions
This paper introduces an enhanced DeepLabV3+ model for dragon fruit orchard road recognition by integrating a PSA module to improve spatial feature representation and replacing the original backbone with MobileNetV2 to reduce model memory usage. Following this, an ECAnet module was integrated to decrease computational complexity and enhance the clarity of target boundaries. When contrasted with the original model, PSPNet, U-Net, and FCN, the improved model’s memory usage is reduced by 85.64%, 84.70%, and 85.06%, respectively. Furthermore, MIoU and MPA reached 95.79% and 97.81%, respectively, representing increases of 0.59 and 0.41 percentage points when contrasted with the original model. Thus, the proposed model becomes more lightweight and high segmentation accuracy can be maintained, ensuring efficiency improvements in practical applications.
Precision testing experiments were conducted on the navigation path fitting under different lighting conditions on dragon fruit orchard roads, including front light, backlight, and weak light environments. The experimental results show that the angle error between the navigation centerline extracted by the least squares method and the manually fitted centerline is less than 5°, with an average deviation of only 2.66 pixels and an average recognition time of 0.10 s under different lighting conditions. This indicates that the proposed navigation path fitting method exhibits good adaptability under various lighting conditions, providing an effective reference for dragon fruit orchard visual navigation.
Author Contributions
Writing—review and editing, L.Z.; writing—original draft preparation, W.D.; investigation, Y.L.; formal analysis, X.G.; funding acquisition, S.Z. All authors have read and agreed to the published version of the manuscript.
Funding
This research was funded by the “14th Five-Year Plan” “Top Ten Main Directions of Agricultural Science and Technology Innovation in Guangdong Province” “Open bidding for selecting the best candidates Project”, grant number 2022SDZG03-5.
Data Availability Statement
Data are contained within the article.
Conflicts of Interest
The authors declare no conflict of interest.
References
- Hu, Y.; Chen, X.; Qi, C. Research on the Changes of China’s Fruit Planting Distribution and Its Influence Effect: Based on the Perspective of Price Changes of Rural Labor. World Reg. Stud. 2023, 32, 93. [Google Scholar]
- Li, X.; Qiu, Q. Autonomous Navigation for Orchard Mobile Robots: A Rough Review. In Proceedings of the 2021 36th Youth Academic Annual Conference of Chinese Association of Automation (YAC), Nanchang, China, 28–30 May 2021; pp. 552–557. [Google Scholar]
- Li, Z.; Guo, R.; Li, M.; Chen, Y.; Li, G. A Review of Computer Vision Technologies for Plant Phenotyping. Comput. Electron. Agric. 2020, 176, 105672. [Google Scholar] [CrossRef]
- Opiyo, S.; Okinda, C.; Zhou, J.; Mwangi, E.; Makange, N. Medial Axis-Based Machine-Vision System for Orchard Robot Navigation. Comput. Electron. Agric. 2021, 185, 106153. [Google Scholar] [CrossRef]
- Chen, J.; Qiang, H.; Wu, J.; Xu, G.; Wang, Z. Navigation Path Extraction for Greenhouse Cucumber-Picking Robots Using the Prediction-Point Hough Transform. Comput. Electron. Agric. 2021, 180, 105911. [Google Scholar] [CrossRef]
- Chen, X.; Wang, S.; Zhang, B.; Luo, L. Multi-Feature Fusion Tree Trunk Detection and Orchard Mobile Robot Localization Using Camera/Ultrasonic Sensors. Comput. Electron. Agric. 2018, 147, 91–108. [Google Scholar] [CrossRef]
- Ma, Y.; Zhang, W.; Qureshi, W.S.; Gao, C.; Zhang, C.; Li, W. Autonomous Navigation for a Wolfberry Picking Robot Using Visual Cues and Fuzzy Control. Inf. Process. Agric. 2021, 8, 15–26. [Google Scholar] [CrossRef]
- Gao, G.; Xiao, K.; Jia, Y. A Spraying Path Planning Algorithm Based on Colour-Depth Fusion Segmentation in Peach Orchards. Comput. Electron. Agric. 2020, 173, 105412. [Google Scholar] [CrossRef]
- Li, Y.; Li, J.; Zhou, W.; Yao, Q.; Nie, J.; Qi, X. Robot Path Planning Navigation for Dense Planting Red Jujube Orchards Based on the Joint Improved A* and DWA Algorithms under Laser SLAM. Agriculture 2022, 12, 1445. [Google Scholar] [CrossRef]
- Mao, W.; Liu, H.; Hao, W.; Yang, F.; Liu, Z. Development of a Combined Orchard Harvesting Robot Navigation System. Remote Sens. 2022, 14, 675. [Google Scholar] [CrossRef]
- Chen, L.-B.; Huang, X.-R.; Chen, W.-H. Design and Implementation of an Artificial Intelligence of Things-Based Autonomous Mobile Robot System for Pitaya Harvesting. IEEE Sens. J. 2023, 23, 13220–13235. [Google Scholar] [CrossRef]
- Dang, T.-V.; Bui, N.-T. Multi-Scale Fully Convolutional Network-Based Semantic Segmentation for Mobile Robot Navigation. Electronics 2023, 12, 533. [Google Scholar] [CrossRef]
- Cao, W.; Qiao, Z.; Gao, Z.; Lu, S.; Tian, F. Use of Unmanned Aerial Vehicle Imagery and a Hybrid Algorithm Combining a Watershed Algorithm and Adaptive Threshold Segmentation to Extract Wheat Lodging. Phys. Chem. Earth Parts ABC 2021, 123, 103016. [Google Scholar] [CrossRef]
- Ikotun, A.M.; Ezugwu, A.E.; Abualigah, L.; Abuhaija, B.; Heming, J. K-Means Clustering Algorithms: A Comprehensive Review, Variants Analysis, and Advances in the Era of Big Data. Inf. Sci. 2023, 622, 178–210. [Google Scholar] [CrossRef]
- Dhal, K.G.; Das, A.; Ray, S.; Gálvez, J. Randomly Attracted Rough Firefly Algorithm for Histogram Based Fuzzy Image Clustering. Knowl. Based Syst. 2021, 216, 106814. [Google Scholar] [CrossRef]
- Yang, P.; Song, W.; Zhao, X.; Zheng, R.; Qingge, L. An Improved Otsu Threshold Segmentation Algorithm. Int. J. Comput. Sci. Eng. 2020, 22, 146. [Google Scholar] [CrossRef]
- Han, J.; Park, C.; Kwon, J.H.; Lee, J.; Kim, T.S.; Jang, Y.Y. Performance Evaluation of Autonomous Driving Control Algorithm for a Crawler-Type Agricultural Vehicle Based on Low-Cost Multi-Sensor Fusion Positioning. Appl. Sci. 2020, 10, 4667. [Google Scholar] [CrossRef]
- Huang, H.; Yang, C.; Chen, C.L.P. Optimal Robot–Environment Interaction Under Broad Fuzzy Neural Adaptive Control. IEEE Trans. Cybern. 2021, 51, 3824–3835. [Google Scholar] [CrossRef] [PubMed]
- Kim, W.-S.; Lee, D.-H.; Kim, Y.-J.; Kim, T.; Lee, W.-S.; Choi, C.-H. Stereo-Vision-Based Crop Height Estimation for Agricultural Robots. Comput. Electron. Agric. 2021, 181, 105937. [Google Scholar] [CrossRef]
- Chollet, F. Xception: Deep Learning with Depthwise Separable Convolutions. In Proceedings of the 2017 IEEE Conference on Computer Vision and Pattern Recognition (CVPR), Honolulu, HI, USA, 21–26 July 2017; IEEE: Honolulu, HI, USA, 2017; pp. 1800–1807. [Google Scholar]
- He, Y.; Zhang, X.; Zhang, Z.; Fang, H. Automated Detection of Boundary Line in Paddy Field Using MobileV2-UNet and RANSAC. Comput. Electron. Agric. 2022, 194, 106697. [Google Scholar] [CrossRef]
- Mo, Y.; Wu, Y.; Yang, X.; Liu, F.; Liao, Y. Review the State-of-the-Art Technologies of Semantic Segmentation Based on Deep Learning. Neurocomputing 2022, 493, 626–646. [Google Scholar] [CrossRef]
- Zhang, B.; Wang, R.; Zhang, H.; Yin, C.; Xia, Y.; Fu, M.; Fu, W. Dragon Fruit Detection in Natural Orchard Environment by Integrating Lightweight Network and Attention Mechanism. Front. Plant Sci. 2022, 13, 1040923. [Google Scholar] [CrossRef] [PubMed]
- Chen, L.-C.; Zhu, Y.; Papandreou, G.; Schroff, F.; Adam, H. Encoder-Decoder with Atrous Separable Convolution for Semantic Image Segmentation. In Proceedings of the European Conference on Computer Vision (ECCV), Munich, Germany, 8–14 September 2018; pp. 801–818. [Google Scholar]
- Menke, W. Review of the Generalized Least Squares Method. Surv. Geophys. 2015, 36, 1–25. [Google Scholar] [CrossRef]
- Zhao, H.; Shi, J.; Qi, X.; Wang, X.; Jia, J. Pyramid Scene Parsing Network. In Proceedings of the IEEE Conference on Computer Vision and Pattern Recognition, Honolulu, HI, USA, 21–26 July 2017; pp. 2881–2890. [Google Scholar]
- Oktay, O.; Schlemper, J.; Folgoc, L.L.; Lee, M.; Heinrich, M.; Misawa, K.; Mori, K.; McDonagh, S.; Hammerla, N.Y.; Kainz, B.; et al. Attention U-Net: Learning Where to Look for the Pancreas. arXiv 2018, arXiv:180403999. [Google Scholar]
- Long, J.; Shelhamer, E.; Darrell, T. Fully Convolutional Networks for Semantic Segmentation. In Proceedings of the IEEE Conference on Computer Vision and Pattern Recognition (CVPR), Boston, MA, USA, 7–12 June 2015. [Google Scholar]

Disclaimer/Publisher’s Note: The statements, opinions and data contained in all publications are solely those of the individual author(s) and contributor(s) and not of MDPI and/or the editor(s). MDPI and/or the editor(s) disclaim responsibility for any injury to people or property resulting from any ideas, methods, instructions or products referred to in the content. |
© 2024 by the authors. Licensee MDPI, Basel, Switzerland. This article is an open access article distributed under the terms and conditions of the Creative Commons Attribution (CC BY) license (https://creativecommons.org/licenses/by/4.0/).