Article

Effect of Biochar on Apple Yield and Quality in Aged Apple Orchards on the Loess Plateau (China)

1
School of Civil and Transportation Engineering, Qinghai Minzu University, Xining 810007, China
2
Institute of Soil and Water Conservation, Northwest Agriculture and Forestry University, Yangling District, Xianyang 712100, China
3
Water and Soil Conservation Ecological Engineering Technology Research Center, Ministry of Water Resources, Yangling District, Xianyang 712100, China
4
Pingluo County Water Affairs Bureau, Pingluo, Shizuishan 753400, China
*
Author to whom correspondence should be addressed.
Agronomy 2024, 14(6), 1125; https://doi.org/10.3390/agronomy14061125
Submission received: 10 April 2024 / Revised: 20 May 2024 / Accepted: 23 May 2024 / Published: 24 May 2024

Abstract

:
Apples are not only a foodstuff, but also a raw material for many industrial production fields, and the market demand is constantly increasing. The Loess Plateau is one of the world’s largest apple-producing areas, with about 85% are aged orchards (more than 20 years old), facing problems such as poor soil water retention, degradation of tree strength, and declining yield and quality, etc., so do aged orchards in other regions of the world, and study on improving quality and increasing yield of aged orchards is of great significance to the sustainable development of the apple industry. Here, 6 treatments (2, 4, 6, 8, 10 and 12 kg/plant) were designed in the experiment to study the effects of biochar on yield and quality in aged apple orchards. The study showed that: biochar could improve soil water retention, but caused the soil alkalization; biochar could improve apple quality and increase yield, T3 and T4 were of better quality, and T3 had the highest yield. Comprehensive analysis, T3 is the optimal scheme. The results not only provide a reference for aged orchards worldwide, but also have great significance for the sustainable development of the apple industry.

1. Introduction

Apples are not only a foodstuff, but also a raw material for many industrial production fields, such as household chemicals, pharmaceutical production, paint field, etc. Apple products for industrial applications are attracting attention in the market due to the bioactive components they bring, and the market demand is constantly increasing [1]. As a cash crop, apples have been planted to 495 ha worldwide (FAOSTAT, 2021) and play an extremely important role in the global fruit industry. China has become the world’s largest producer and consumer of apples [2]. In recent years, the production of apples in the Loess Plateau region has been increasing year by year, and it has become the largest apple-producing region in China and even in the world [3], with 1.22 million ha of apple planted area, accounting for 58% of the planted area in China and 25% of the global planted area, ((FAOSTAT, 2021, China Statistical Yearbook).
However, about 85% of apple orchards on the Loess Plateau are more than 20 years old, and apple trees show degradation and decline in yield and quality with increasing growth age [4,5], and other major apple-producing areas in the world also face the same problem. How to scientifically and rationally improve the soil, improve quality and increase production has become the focus of fruit tree experts [6,7,8,9]. Therefore, it is of great significance for the sustainable development of the apple industry to carry out research on quality improvement and yield increase of aged orchards.
Biochar is a new type of soil conditioner, which is attracting the attention of scientists at home and abroad, and biochar technology is gradually becoming a research hotspot in the fields of agricultural production and ecological protection [10,11]. Waste generated during agricultural production could be prepared into biochar, which is then used as a soil conditioner and applied back to farmland to repair contaminated soil, thereby improving soil productivity, crop yield and quality [12], a cyclical production model that promotes the sustainable development of agriculture by “what is taken from the farm is used in the farm” [13]. Biochar has a high specific surface area, and the application of biochar to soil could directly affect the physical properties of soil, such as reducing soil bulk weight and soil density, improving water use efficiency [14,15], and increasing soil water retention and soil pH [16]. Biochar increases the exchange sites for soil ions and enhances soil ion adsorption capacity, which in turn leads to an increase in effective nutrients in the soil [17]. For example, biochar could increase the effective phosphorus content, organic carbon content, nitrogen effectiveness, organic matter and humus content in the soil, which in turn increases crop yields [18,19,20,21].
Numerous studies [10,11,12,13,14,15,16,17,18,19,20,21] have been conducted on biochar for soil improvement, but few for quality improvement and yield enhancement in aged apple orchards. In this study, We tried to mix biochar with soil to study the effect on the yield and quality of aged apple orchards, and the purpose of the study was to find a suitable application rate for the Loess Plateau, which would provide a reference for the aged orchards to improve the quality and increase the yield.

2. Materials and Methods

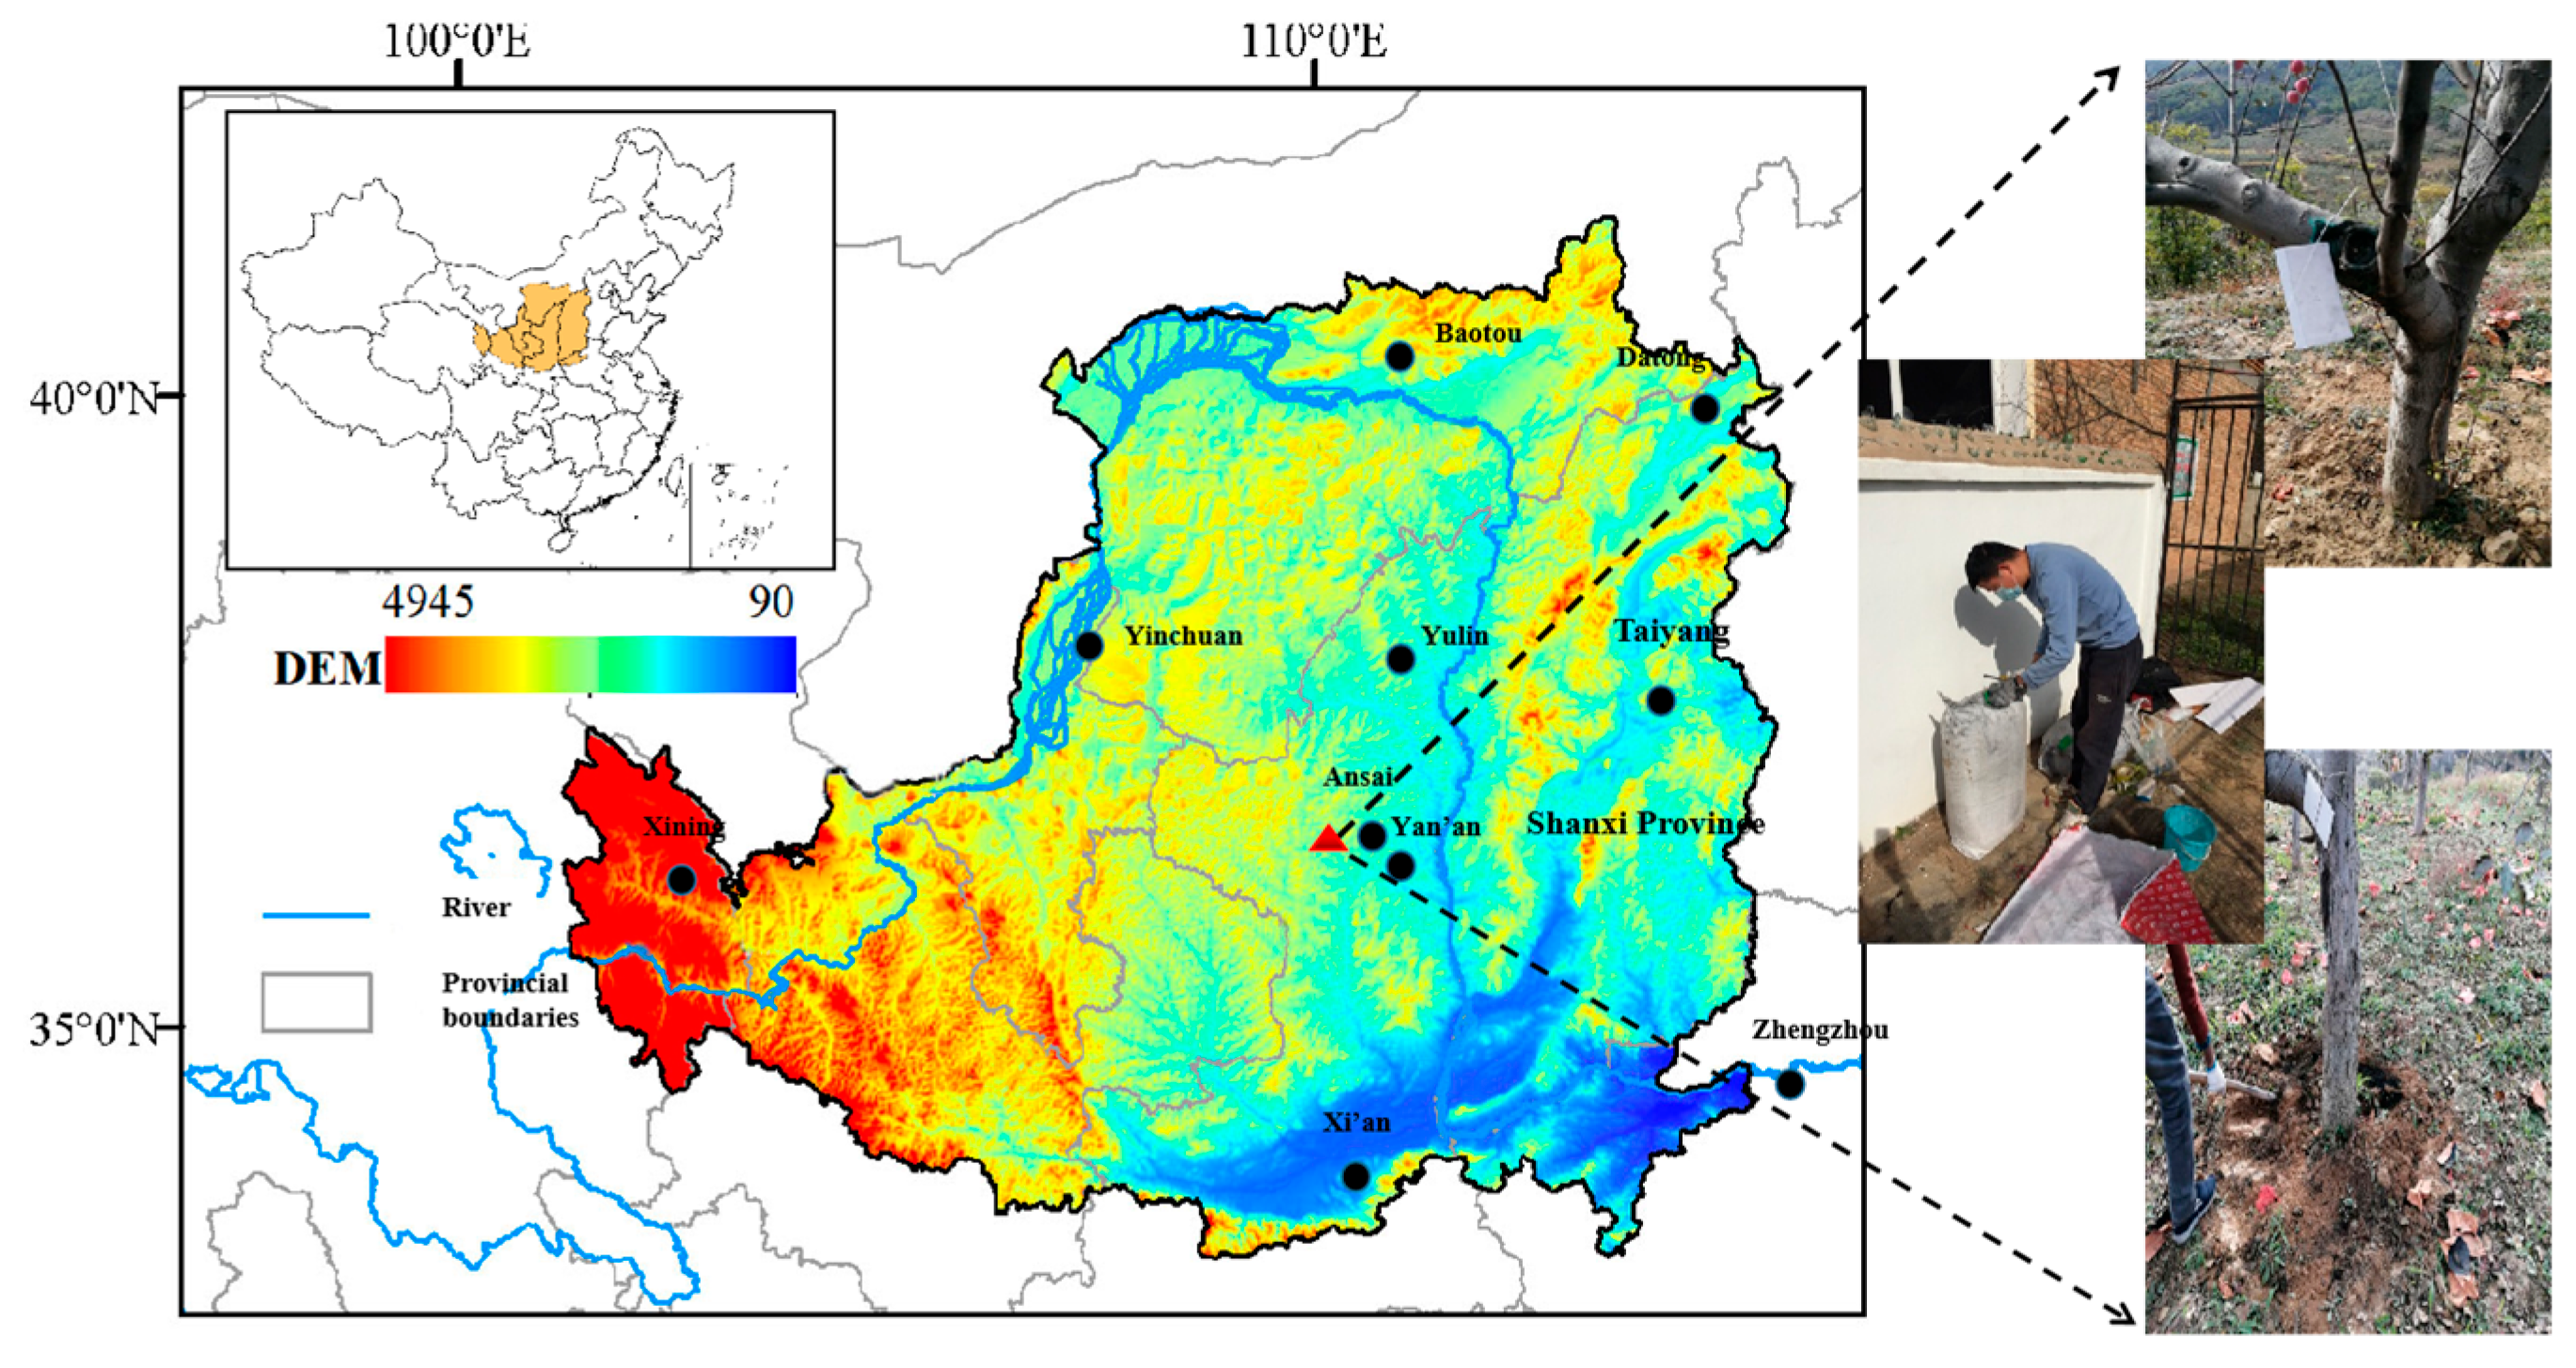
2.1. Experiment Area

The Experiment area is located in Ansai County, Yan’an City, in the middle of Loess Plateau (108°50′–109°26′ E, 36°30′–37°19′ N) (Figure 1). According to National Center for Earth System Science Data, China, the landscape belongs to the Loess Hills and Gullies area, with an elevation of 1012.1~1731.7 m, an average temperature of 8.8 °C, an average annual rainfall of about 480 mm, and a medium temperate zone. Continental semi-arid monsoon climate, the length of the four seasons varies, dry and wet, rainfall is concentrated, more rain from July to September, spring and autumn temperature changes quickly, less rainfall, dry in winter. In the study area, apples have been planted for more than 20 years with fruit trees spaced at 4 m × 4 m and 625 trees per hectare. The aging of the orchard has resulted in a decline in apple yield and quality.

2.2. Experiment Design

The experiment was carried out from November 2020 to November 2022 in Gao Shishi Village, Fangta Watershed, Ansai County, the type of apple tree used for the experiment was Red Fuji. The experiment was designed with six different treatments with labeled sample plants, three replications were set up for each treatment for a total of 18 apple trees, and the control group was left unmarked and untreated. The levels of implementation of biochar in different treatments are shown in Table 1. Fruit trees with the same plot and similar growth were selected as sample plants, about 3.5 m high and 70 cm thick, with little difference in yield between the 2020 samples.
Biochar was applied uniformly at once in November 2020 in a 2 m-wide ring centered on the fruit trees and mixed with the upper 30 cm of soil to implement the scope. Water and fertilizer management of the experimental samples remained the same as before. Commonly used fertilizers by farmers in the area were selected: urea (46% N), calcium superphosphate (15% P2O5), and potassium sulfate (51% K2O). Each treatment was fertilized with 15 kg/plant per year (N:P2O5:K2O = 3:2:3) and tilled once a year in spring. Fertilizer was applied during tilling, which is commonly adopted in the study area. In order to ensure the reliability of the experiment, except for the biochar addition, all other farm operations were according to traditional farming methods.

2.3. Experiment Material

The experiment area is located in the hinterland of Loess Plateau, and the experiment soil is loess soil, and the basic physical and chemical properties of soil were as follows: soil bulk weight 1.38 g/cm3, pH 8.56, conductivity 1.15 mS/cm, organic matter 4.6 g/kg, total nitrogen 1.26 g/kg, total phosphorus 1.64 g/kg, and total potassium 15.65 g/kg. Particle composition: clay grain 16.82%, powder 63.04, sand 20.14%. The biochar used in the experiment was carbonized from apple branches, provided by Shaanxi Yixin Bioenergy Science and Technology Development Co, Ltd. Xian’an China, with a production date of May 2019. The carbonization process was: apple branches were crushed and washed to remove the impurities and pollutants, the crushed apple branches were placed in an airtight container and high temperature (450 °C) was applied to carry out pyrolysis, and a certain amount of water vapor was added during the pyrolysis period to help the carbonization process, and after the end of the carbonization, natural cooling was used to reduce the temperature of the carbonized material to room temperature, dried at 60 °C and milled, and then passed through 100 mesh nylon sieve for storage. The basic physical and chemical properties of the test biochar were as follows: pH 9.23, conductivity 9.14 mS/cm, total nitrogen 14.53 g/kg, total carbon 564.89 g/kg, ash 12%, and the specific surface area of single point BET 2.492 m2/g. The specific surface area was determined by “gas adsorption BET method of solid material specific surface area” [22], and the adsorption gas was nitrogen.

2.4. Indicator Measurement

Yield measurement: fruits were sorted and harvested according to the different treatments, weighed and calculated the yield per plant for each treatment, and analyzed the effect of different treatments on apple yield.
Quality measurement: apple quality assessing include appearance and internal qualities, and in this study, fruit appearance qualities include the fruit vertical and transverse diameters, fruit pigmentation degree, fruit shape index, and single fruit weight of apples, while internal qualities include the fruit hardness, fruit soluble solids, fruit sweetness, and fruit acidity of apples. Mature apples were harvested in mid-October, the total number of fruits from a single plant was counted, and five apples were collected from each plant in five directions: east, west, south, north, and center of the tree, for a total of 15 per treatment, and the fruits were fully mixed for quality monitoring. The pigmentation degree was measured using a colorimeter CR-410; the weight of single fruit was measured by electronic balance (precision: 0.01 g); the vertical and transverse diameters were measured by digital vernier calipers; the hardness was measured by FTA Fruit Texture Analyzer GS-15 (Umweltanalytische Produkte GmbH, Cottbus, Germany); the sweetness was measured by Atago Digital Sugar Meter PLA-a (ATAGO Co., Ltd., Toko, Japan); and the acidity was measured by CLEAN PH30 (CLEAN Instruments Co., Ltd., West Chester, PA, USA).
Soil moisture content was monitored using Time Domain Reflectometry (TDR) Each sample plant was arranged with three pre-drilled holes at a depth of 2 m. Soil water content was measured at 20 cm, 40 cm, 80 cm, 120 cm, 160 cm and 200 cm respectively, and the measured values were averaged to represent the soil water content level. and measured once a month on the 10th day of the month. Soil pH was measured after apple picking by sampling the 0–50 cm soil layer with an earth auger at a distance of 50 cm from the trunk of the tree, four points were taken from each treatment, the sample soil was mixed well, and remove other non-soil debris such as grass roots, gravel, put into a clean plastic bag, mark the date and sampling location and position, bring back to the laboratory, spread evenly on neat paper, thickness of about 2 cm with the appropriate, natural ventilation and drying, to avoid direct sunlight and dust and other volatile chemical contamination, soil samples air-drying completely after the sieve through the 0.149 mm ready to measure soil pH.

2.5. Data Analysis and Statistics

Basic statistical processing of the data was performed using Excel 2019, and one-way ANOVA was performed using SPSS 26.0 on soil indicators from different sites and profiles, and Origin 2024 was used for mapping.

3. Results

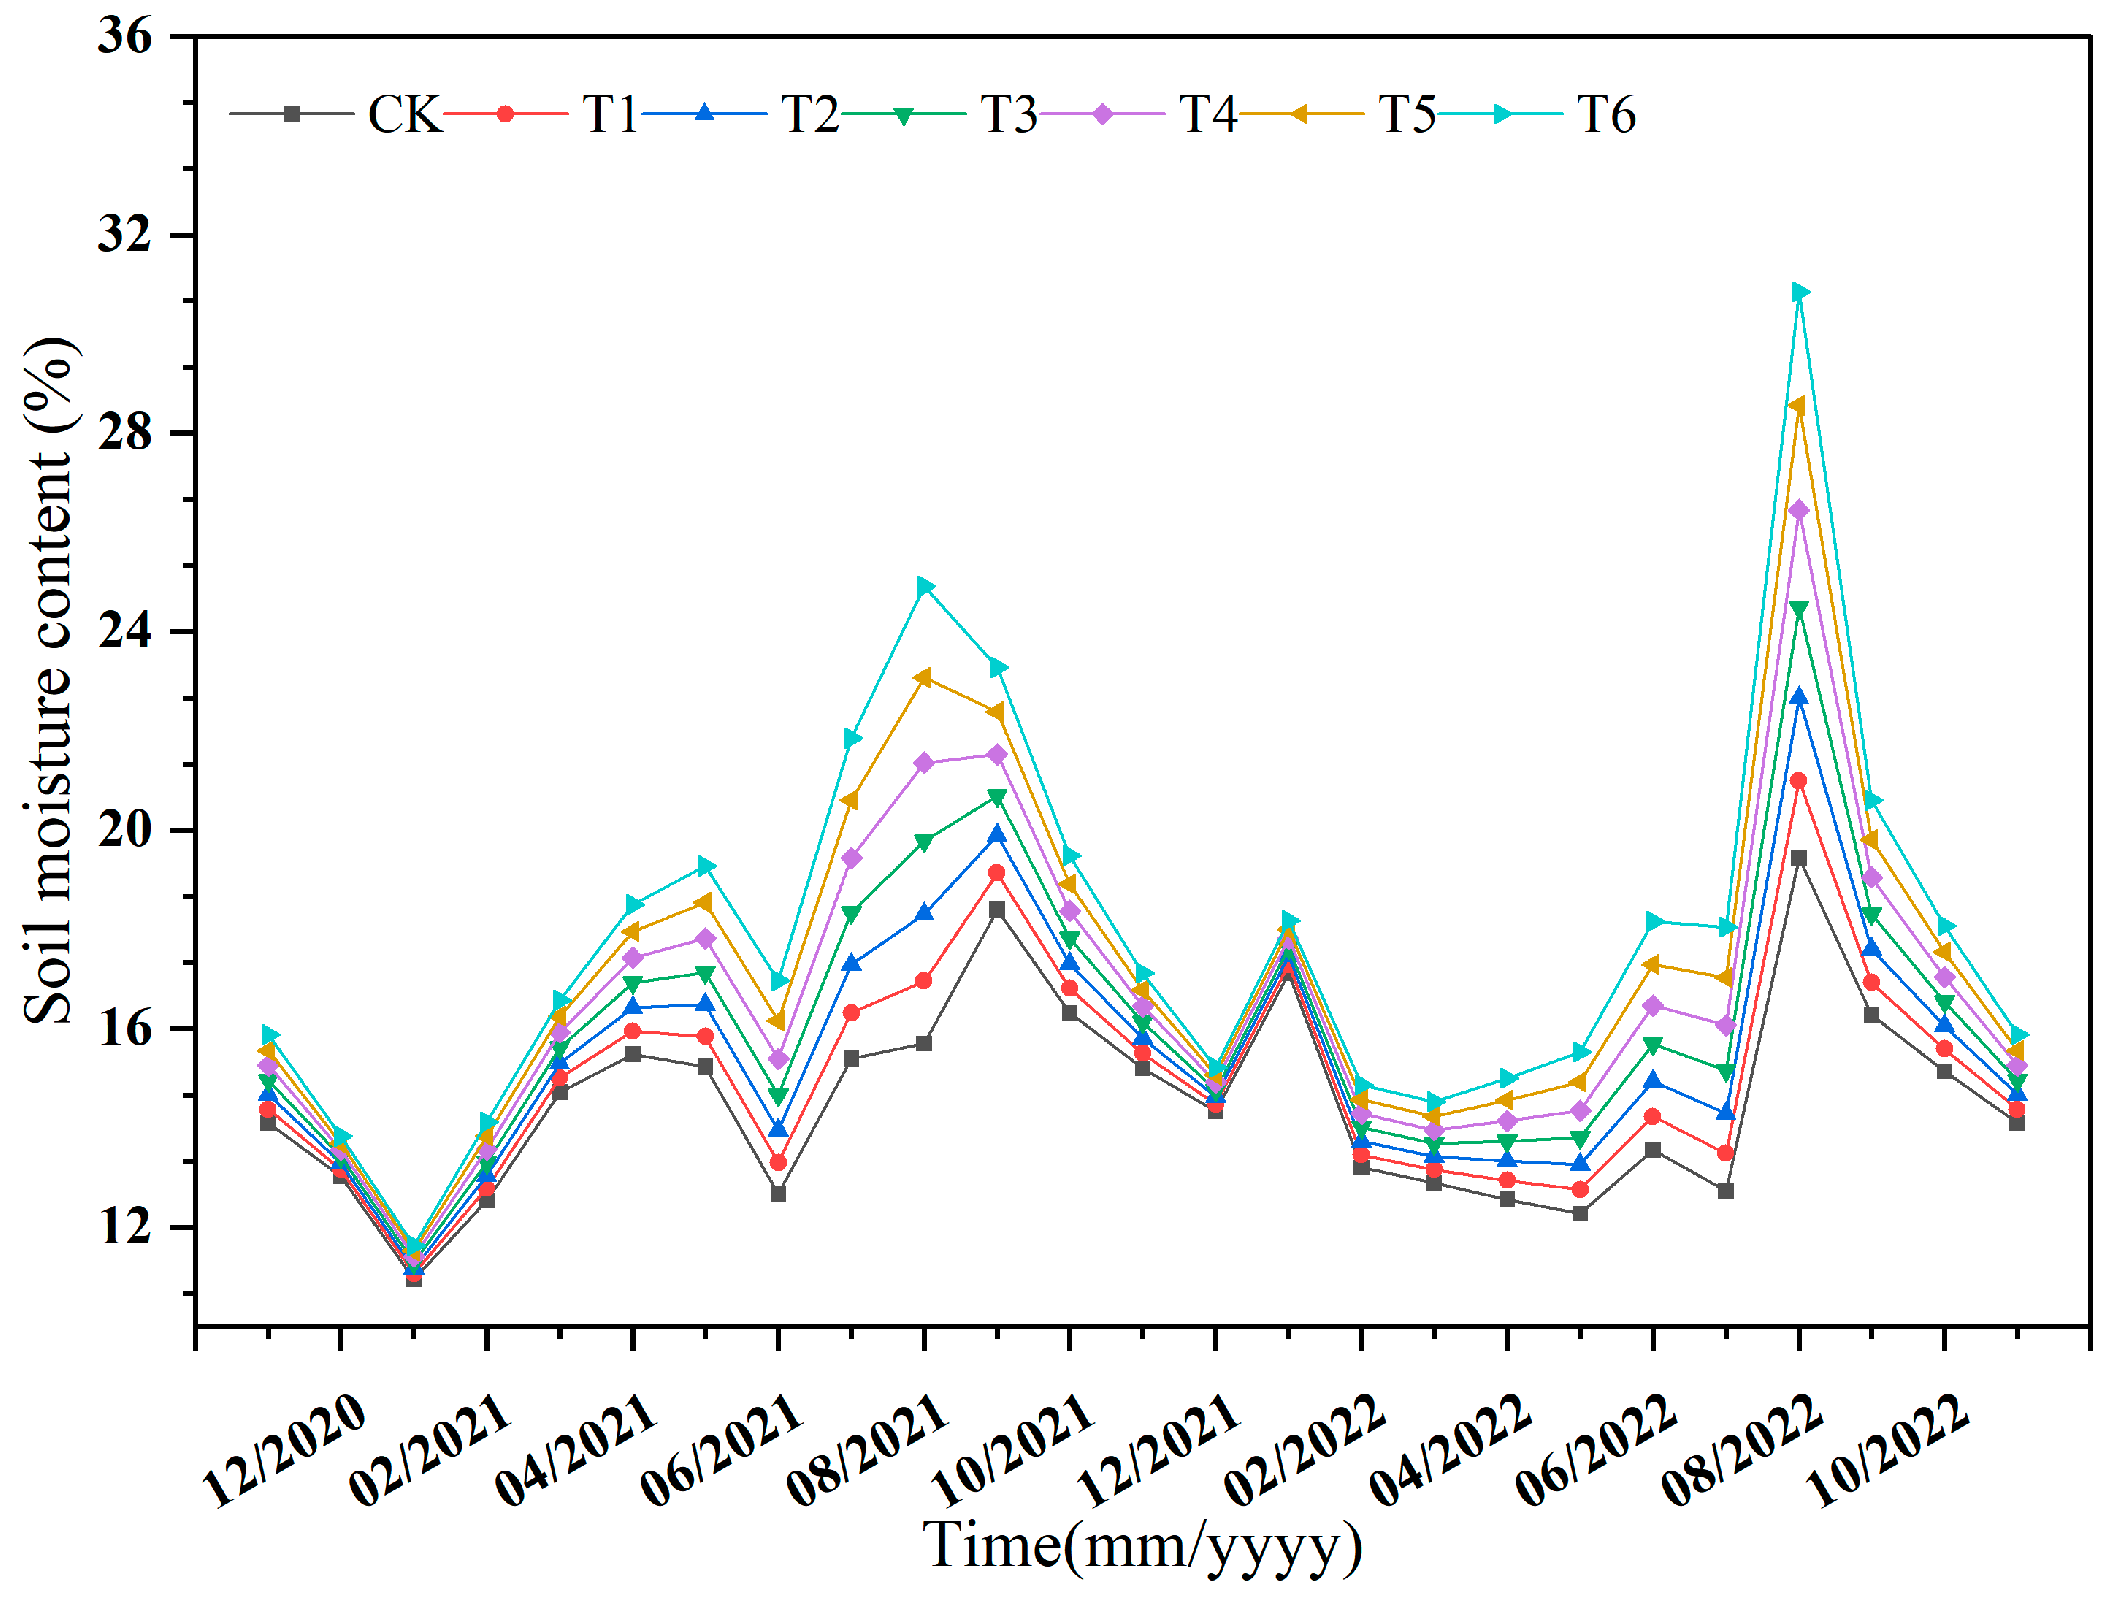
3.1. Effect of Biochar on Soil Moisture Content

Monthly changes in soil moisture content for different planting practices in November 2020–November 2022 are shown in Figure 2. The integration of water content over time reflects the average magnitude of the soil moisture content for each treatments. In the 0–100 cm soil profile, the soil moisture content magnitudes were ranked as T6 > T5 > T4 > T3 > T2 > T1 > CK. The average water content of the treatments with biochar was greater than CK, and the greater the amount of biochar added, the greater the average water content was, and the water retention effect of biochar was more obvious during the rainy season from June to August. Soil moisture content ranged from 10.9 to 19.4% for CK, 11.1 to 21.0% for T1, 11.2 to 22.7% for T2, 11.3 to 24.4.0% for T3, 11.4 to 26.4% for T4, 11.5 to 28.6% for T5 and 11.6 to 30.8% for T6. The main reason is that biochar has small density, large specific surface area and good structure, which could effectively improve the infiltration characteristics of the soil and reduce the evaporation of the soil, which is conducive to the growth of apple trees, this is consistent with Karhu [14] and Dugan et al. [23].

3.2. Effect of Biochar on Soil pH

The soils in the study area were generally alkaline, and the soil pH of different treatments is shown in Table 2. It shows that biochar addition leads to an increase in soil pH, with the increase being greater with higher additions. The greatest increase in soil pH was observed in T6, which increased from 8.54 in November 2020 to 9.11 in November 2022. Compared to CK, the treatments increased by 2.84, 3.29, 3.62, 4.18, 4.63 and 6.56%, respectively. The main reason is that biochar is alkaline (pH = 9.23) and biochar causes the soil to become alkaline, which is consistent with the findings of Chintala [16] and Bu et al. [24] Therefore, excess biochar is detrimental to apple tree growth.

3.3. Effect of Biochar on Apple Quality

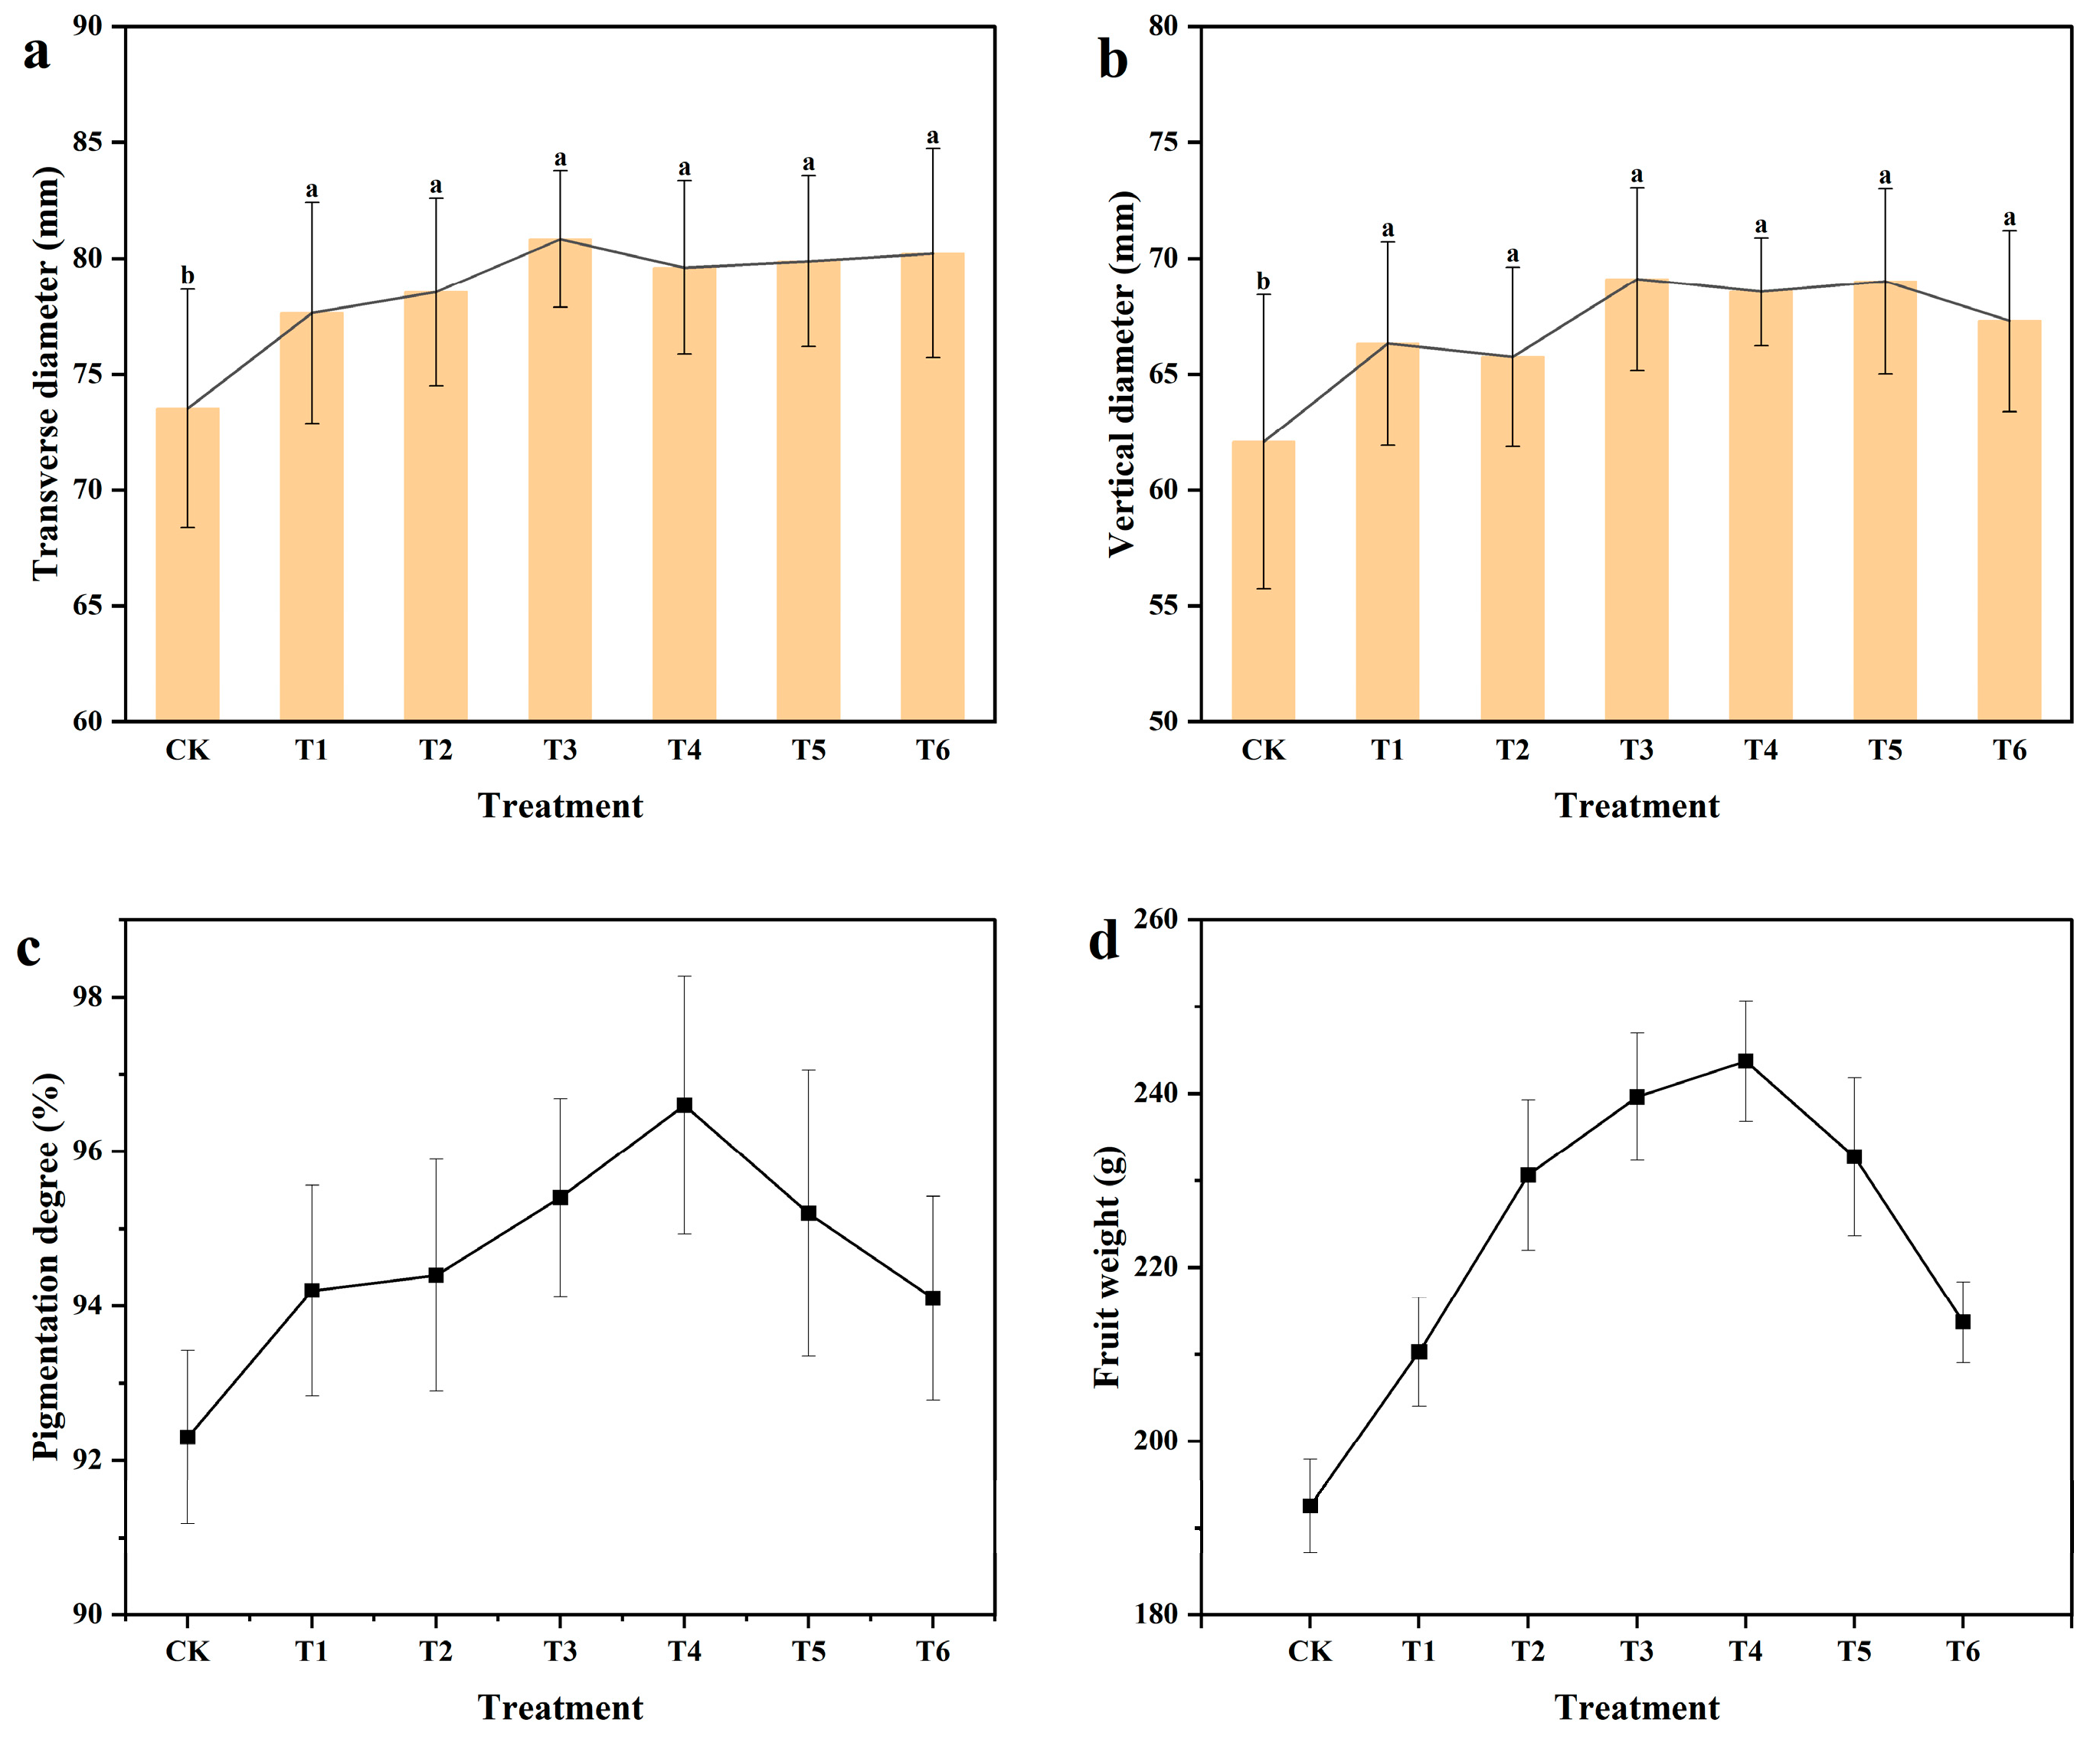
3.3.1. Effect of Biochar on Fruit Appearance Quality

In this study, fruit appearance qualities include the fruit vertical and transverse diameters, fruit pigmentation degree, fruit shape index, and single fruit weight of apples. The effect of biochar on them was analyzed as follows.
The effect of biochar on fruit vertical and transverse diameters are shown in Figure 3a,b. Compared with CK, both vertical and transverse diameters of fruits increased in all treatments, the transverse diameters of fruits increased by 5.6, 6.8, 9.9, 8.3, 8.6 and 9.1%, respectively, and the T3 treatment had the highest increase with an increase of 7.29 mm. the vertical diameters of fruits increased by 6.8, 5.9, 11.3, 10.4, 11.2 and 8.4%, respectively, and the T3 and T5 had the highest increase with an increase of 7.03 mm, 6.93 mm. The effect of biochar on fruit shape index is shown in Table 3. Compared to CK, fruit index increased in all treatments, with T4 and T5 showing the greatest increase of 0.02, while the rest of the treatments showed insignificant improvement. The effect of biochar on fruit pigmentation degree is shown in Figure 3c. Compared to CK, fruit pigmentation degree increased in all treatments by 1.9, 2.1, 3.1, 4.3, 2.9 and 1.8%, with the greatest increase in T4. The effect of biochar on single fruit weight is shown in Figure 3d. Compared to CK, single fruit weight increased in all treatments by 17.73, 38.08, 47.09, 51.21, 40.18 and 21.16 g, respectively. With the increase of biochar, the single fruit weight increased and then decreased, and there were extreme values. In the experiment, T4 had the greatest increase in single fruit weight, which was 26%. Based on the analysis of fruit appearance quality, T4 was optimal, and the indicators of T3 treatment did not differ much from T4.

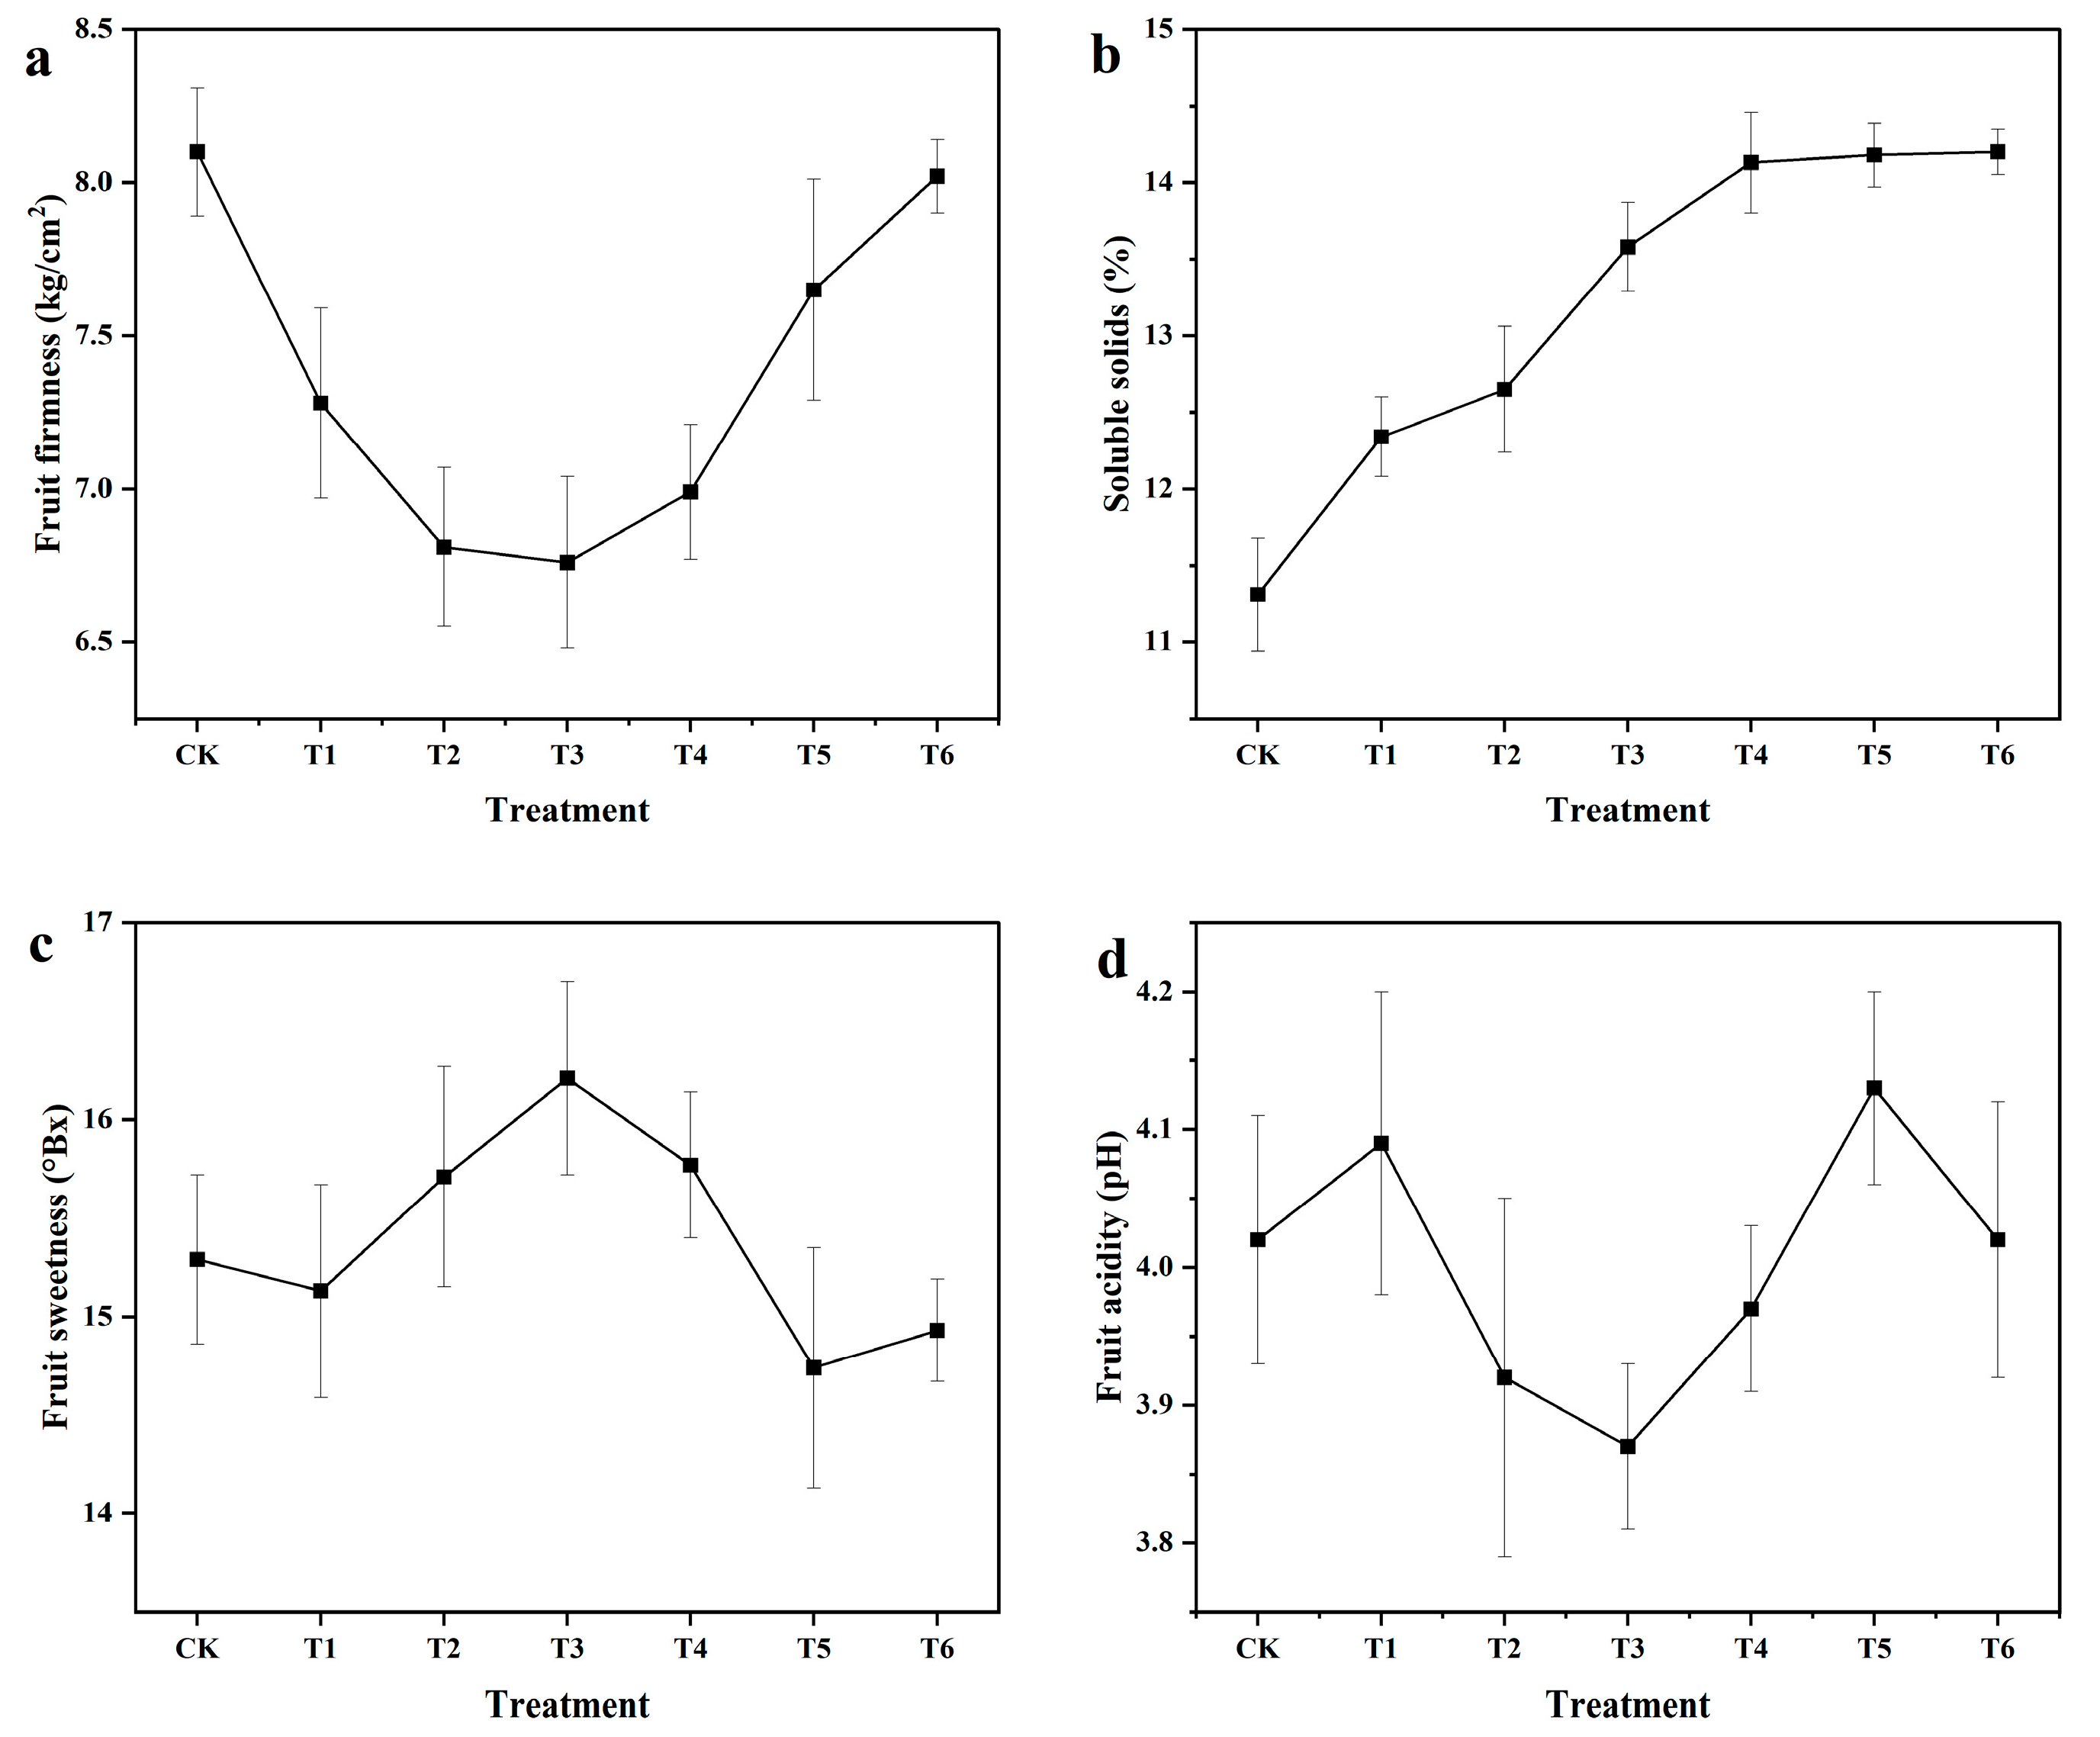
3.3.2. Effect of Biochar on Fruit Intrinsic Quality

In this study, the fruit internal qualities include fruit hardness, fruit soluble solids, fruit sweetness, and fruit acidity of apples. The effect of biochar on them was analyzed as follows.
The effect of biochar on fruit hardness is shown in Figure 4a. Compared to CK, fruit hardness was reduced in all treatments, by 0.82, 1.29, 1.34, 1.11, 0.45 and 0.08 kg/cm2 respectively. Fruit hardness decreased and then increased with increasing biochar, and there were extremes. In the experiment, T3 had the least fruit hardness with 16.5% decrease in fruit hardness. The effect of biochar on fruit soluble solids is shown in Figure 4b. Compared to CK, fruit soluble solids increased in all treatments by 1.03, 1.34, 2.27, 2.82, 2.87 and 2.89%, respectively. Moreover, the rate of increase became slower with the increase of biochar, T4 increased by 0.55% compared to T3, T5 increased by 0.05% compared to T4, and T6 increased by 0.02% compared to T5. The effect of biochar on fruit sweetness is shown in Figure 4c. Compared with CK, the fruit sweetness of T2, T3 and T4 increased by 0.41, 0.92 and 0.48 °Bx, respectively, of which T3 had the largest increase of 6%, and the fruit sweetness of T5 and T6 decreased. This is related to the water retention effect of biochar, fruit sweetness is not only related to fruit growth, but also with the late stage of the fruit is water supply, too much soil moisture in the late stage will affect fruit sweetness. The effect of biochar on fruit acidity is shown in Figure 4d. Compared to CK, ph decreased by 0.10, 0.15 and 0.05, but sugar-acid ratio of fruit increased in T2, T3 and T4 treated fruits. In a comprehensive analysis, the apples of T3 and T4 were of better quality.

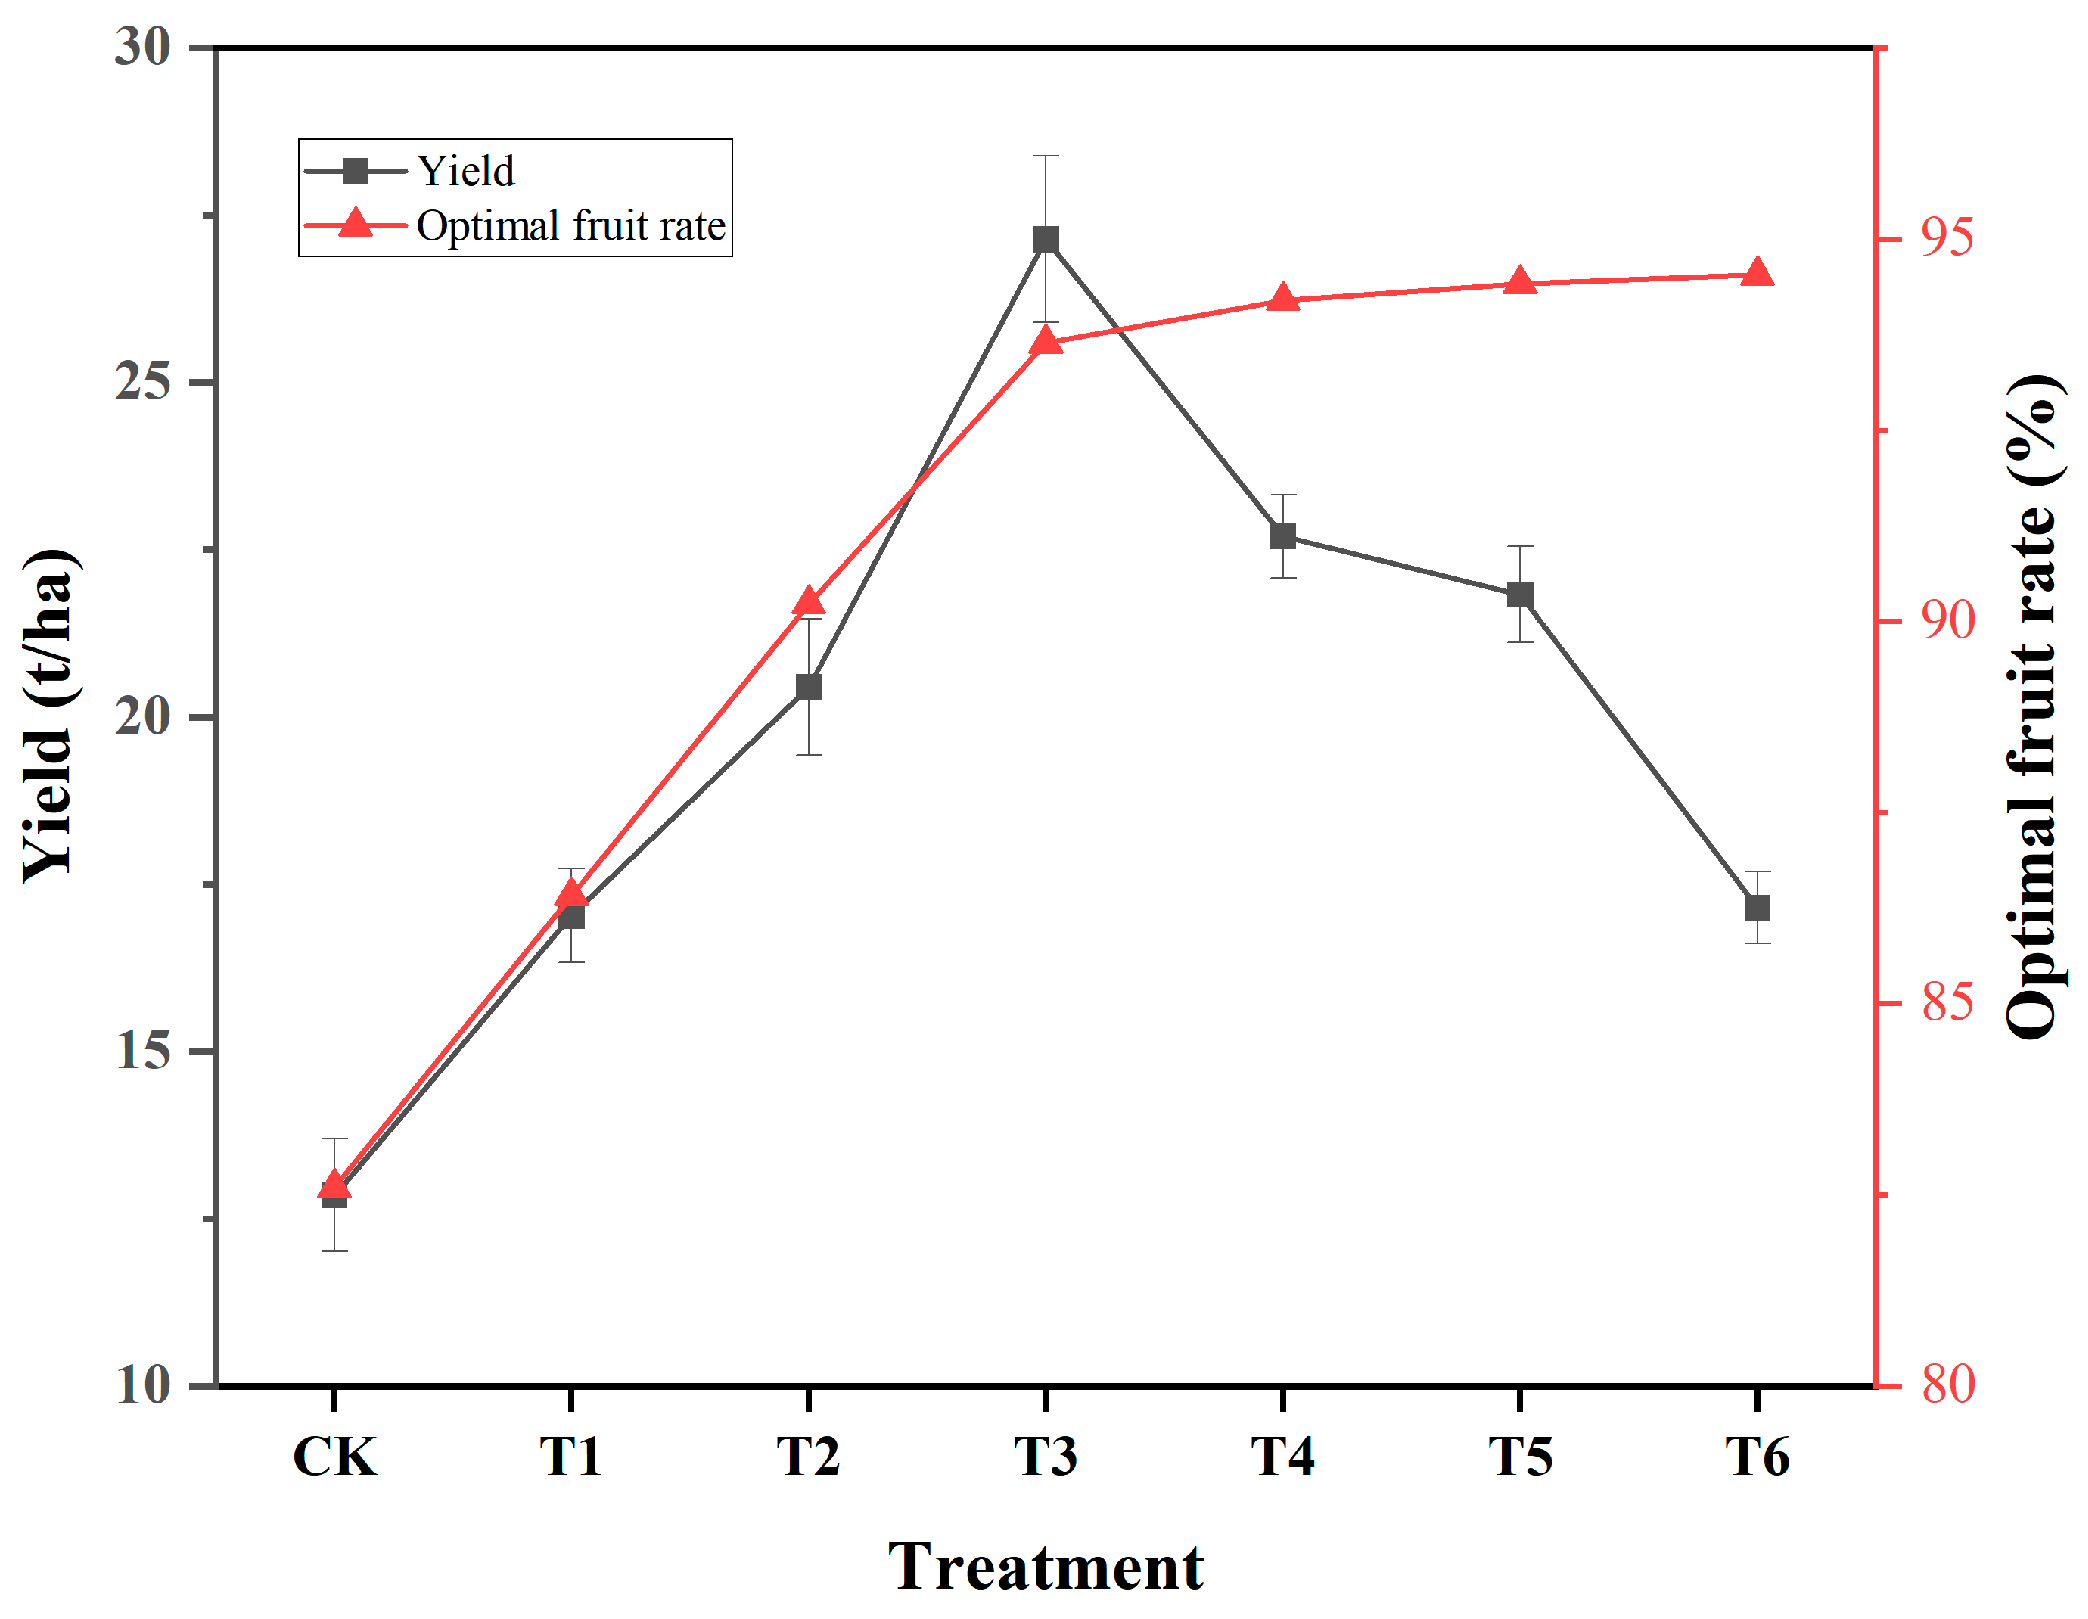
3.4. Effect of Biochar on Apple Yield

The yield of apples is the indicator of most concern to fruit farmers, directly related to their income, and is the indicator with the highest priority in the study.
The effect of biochar on apple yield and optimal fruit rate is shown in Figure 5. Compared with CK, the effect of biochar on yield increase was significant, and the yields of all treatments were increased by 4.18, 7.6, 14.29, 9.85, 8.98 and 4.3 t/ha, respectively. The yield increased firstly and then decreased with the increase of biochar, and it was highest in T3, with the increase of more than one time. Compared to CK, the optimal fruit rate (75 mm) increased with increasing biochar by 3.81, 7.63, 11.04, 11.82 and 11.93% for each treatment. Figure 5 shows that the effect of increasing optimal fruit rate by continuing to add biochar at T4, T5 and T6 is not significant, and there is no point in continuing to increase biochar, instead it will lead to a decline in production. Based on the analysis of yield and optimal fruit rate, the T3 optimal.

4. Discussion

4.1. Effect of Biochar on Soil Water Content and pH

The application of biochar to the soil could directly affect the physical properties of the main soil, such as reducing soil bulk weight and soil density, and increasing water use efficiency [14]. Different application rates of biochar have different effects on soil properties [25]. This study showed that biochar could increase soil water content and soil ph, which is consistent with the findings of Zwieten [19], Kimetu [20] and Dugan et al. [23].
Biochar has a high specific surface area, when the biochar is added to the soil, the specific surface area of the soil will increase, the adsorption capacity of the soil will be enhanced, which will improve the water retention characteristics of the soil and increase the soil water content [15]. In addition, biochar could increase soil organic carbon [19], soil organic matter [20] and humus content, thereby increasing the water holding capacity of the soil [23]. The mechanism by which biochar raises soil pH is as follows: firstly, biochar itself contains alkaline groups that neutralize the protons in the soil, thus increasing the pH of the soil; secondly, the carbonates formed during the formation of biochar, the carbonate content of which increases with the pyrolysis temperature at which it is produced [16]. The change of soil pH depends on the cracking temperature of added biochar, the type of biochar and the amount applied. Some scholars increased soil pH by 1.5 by adding biochar to the soil [24].

4.2. Effect of Biochar on Apple Yield and Quality

This study showed that the right amount of biochar could improve apple quality, considering all qualities of apples, the apples of T3 and T4 were of better quality, and the right biochar could increase apple yield, with the T3 treatment having the highest apple yield, which is consistent with the findings of Huang and Partey et al. [26,27]. Biochar is effective in ameliorating soil, which in turn improves soil productivity, crop yield and quality [12]. The reason is that the right amount of biochar could not only increase soil water content and effectively improve soil nutrients, but also promote the development of the root system of fruit trees and improve the effective absorption of soil nutrients, which in turn improves apple yield and quality.
Effective nutrients in the soil would increase due to the addition of biochar, which increases the exchange sites for soil ions and enhances soil ion adsorption capacity [17], correspondingly soil nitrate nitrogen content increased [28]. On the one hand biochar could increase soil mineral nitrogen content by increasing soil C/N and enhancing microbial activity, while promoting the slow release of ammonium nitrogen and nitrate nitrogen from the soil [29], and on the other hand its own special microporous structure inhibits denitrification by microorganisms, thus reducing nitrogen volatilization losses [30]. Biochar has contributed to the conversion of slow-acting potassium to fast-acting potassium, thus promoting higher levels of fast-acting potassium in the soil [31], and it also promotes an increase in the solubility of insoluble phosphorus compounds [18,32] and sequesters soil phosphorus by enhancing the stability of agglomerates and decreasing the release of organic matter, which in turn improves the effective soil phosphorus content [33].
Furthermore, biochar added to the soil could improve soil aeration, reduce soil nitrogen loss, and increase soil effective phosphorus and soil quick-acting potassium content [34], thus enhancing soil fertility, improving nutrient utilization, and then improving the effect of apple yield and quality [35].

5. Conclusions

In recent years, research on the application of biochar in agriculture has received increasing attention. In this study, we investigated the effect of biochar on apple yield and quality in aged orchards of Loess Plateau through two years of successive experiments to address the problems of tree degradation and yield and quality decline in aged orchards. This study showed that: biochar could improve soil water retention capacity, but at the same time, it could also cause the soil to become alkaline, the right amount of biochar addition could help the growth of apple trees, and too much biochar leads to too high soil ph, which is rather unfavorable to the growth of apple trees; the right amount of biochar could improve apple quality, T3 had the largest fruit vertical and transverse diameters, the smallest fruit hardness, the highest fruit sweetness, the highest sugar-acid ratio, T4 and T5 had the highest fruit shape index, and T4 had the largest single fruit weight, and the increase in soluble solids was not obvious with biochar application greater than T3 treatment, and the increase in the superior fruit rate was not obvious with biochar application greater than T4 treatment. Considering all qualities of apples, the apples of T3 and T4 were of better quality. The right biochar could increase apple yield, with the T3 treatment having the highest apple yield.
In the study, T3 is the optimal solution to improve the quality and yield of aged orchards on the Loess Plateau, the results of the study not only provide a reference for aged orchards in other parts of the world, but also have great significance for the sustainable development of the apple industry.

Supplementary Materials

The following supporting information can be downloaded at: https://www.mdpi.com/article/10.3390/agronomy14061125/s1.

Author Contributions

Conceptualization, W.L.; methodology, W.L.; software, W.L. and S.Z.; validation, W.L. and F.Z.; formal analysis, W.L. and S.Z.; investigation, W.L.; resources, W.L.; data curation, W.L.; writing—original draft preparation, W.L.; writing—review and editing, J.G.; visualization, W.L.; supervision, W.L.; project administration, W.L.; funding acquisition, W.L. and J.G. All authors have read and agreed to the published version of the manuscript.

Funding

This research was funded by the National Key Research and Development Program of China (2021YFD1900704): the “LINGYAN” Research Project of Qinghai Minzu University (23GCC20), National Natural Science Foundation of China (No. 41877078).

Data Availability Statement

The original contributions presented in the study are included in the article/Supplementary Materials, further inquiries can be directed to the corresponding author.

Acknowledgments

We acknowledge Xiping Wang, Xinghua Li, and Rafiq Ahmad for their contributions to the experiment. We also sincerely appreciate State Key Laboratory of Soil Erosion and Dryland farming on Loess Plateau, Chafang Village, and Ansai Soil and Water Conservation Comprehensive Experiment Station for providing the test site and support during the experiments.

Conflicts of Interest

The authors declare no conflict of interest.

References

  1. Campeanu, G.; Neata, G.; Darjanschi, G. Chemical composition of the fruits of several apple cultivars growth as biological crop. Not. Bot. Horti Agrobot. Cluj-Napoca 2009, 37, 161–164. [Google Scholar] [CrossRef]
  2. Li, Z.; Liu, G.; Zhang, X. Review of reaearches on the Valsa canker of apple trees. North Fruits 2013, 4, 1–3, (In Chinese with English Abstract). [Google Scholar]
  3. Peng, X.; Guo, Z.; Zhang, Y.; Li, J. Simulation of long-term yield and soil water consumption in apple orchards on the Loess Plateau, China, in response to fertilization. Sci. Rep. 2017, 7, 5444. [Google Scholar] [CrossRef]
  4. Peng, X.; Guo, Z.; Zhang, Y.; Li, J. Quantitative simulation of the effect of longterm organic manure and chemical fertilizer application on water productivity and soil organic carbon contents of apple orchards in Weibei Highland. Plant Nutr. Fertil. 2018, 24, 33–43, (In Chinese with English Abstract). [Google Scholar]
  5. Li, Z.H.; Ji, Q.; Zhao, S.X.; Wei, B.M.; Wang, X.D.; Hussain, Q. Changes in C and N fractions with composted manure plus chemical fertilizers applied in apple orchard soil: An in-situ field incubation study on the Loess Plateau, China. Soil Use Manag. 2018, 34, 276–285. [Google Scholar] [CrossRef]
  6. Yan, T.; Xue, J.; Zhou, Z.; Wu, Y. Biochar-based fertilizer amendments improve the soil microbial community structure in a karst mountainous area. Sci. Total Environ. 2021, 794, 148757. [Google Scholar] [CrossRef]
  7. Pérez-Hernández, H.; Fernández-Luqueño, F.; Huerta-Lwanga, E.; Mendoza-Vega, J.; Álvarez-Solís José, D. Effect of engineered nanoparticles on soil biota: Do they improve the soil quality and crop production or jeopardize them? Land Degrad. Dev. 2020, 31, 2213–2230. [Google Scholar] [CrossRef]
  8. Wang, F.; Wang, X.; Song, N. Biochar and vermicompost improve the soil properties and the yield and quality of cucumber (Cucumis sativus L.) grown in plastic shed soil continuously cropped for different years. Agric. Ecosyst. Environ. 2021, 315, 107425. [Google Scholar] [CrossRef]
  9. Khakpour, S.; Hajizadeh, H.S.; Hemati, A.; Bayanati, M.; Nobaharan, K.; Chelan, E.M.; Lajayer, B.A.; Dell, B. The effect of pre-harvest treatment of calcium nitrate and iron chelate on post-harvest quality of apple (Malus domestica Borkh cv. Red Delicious). Sci. Hortic. 2022, 304, 111351. [Google Scholar] [CrossRef]
  10. Tian, Y.; Zhang, Z.; Zhang, Q.; Yin, R. Research status and countermeasures analysis of biochar. Shanxi Agric. Sci. 2016, 680–681, 714, (In Chinese with English Abstract). [Google Scholar]
  11. Zhang, A.; Liu, Y.; Pan, G.; Hussain, Q.; Li, L.; Zheng, J.; Zhang, X. Effect of biochar amendment on maize yield and greenhouse gas emissions from a soil organic carbon poor calcareous loamy soil from Central China Plain. Plant Soil 2012, 351, 263–275. [Google Scholar] [CrossRef]
  12. Mehmood, K.; Li, J.-Y.; Jiang, J.; Masud, M.M.; Xu, R.-K. Effect of low energy-consuming biochars in combination with nitrate fertilizer on soil acidity amelioration and maize growth. Soils Sediments 2017, 17, 790–799. [Google Scholar] [CrossRef]
  13. Chen, W.; Zhang, W.; Meng, J.; Xu, Z. Research on the application technology of biochar. China Eng. Sci. 2011, 13, 83–89, (In Chinese with English Abstract). [Google Scholar]
  14. Karhu, K.; Mattila, T.; Bergström, I.; Regina, K. Biochar addition to agricultural soil increased CH4 uptake and water holding capacity–Results from a short-term pilot field study. Agric. Ecosyst. Environ. 2011, 140, 309–313. [Google Scholar] [CrossRef]
  15. Li, D.; Duan, Y.; Zhang, S. Soil Moisture Measurement and Simulation: A Review. Adv. Earth Sci. 2012, 27, 424–434. [Google Scholar] [CrossRef]
  16. Chintala, R.; Schumacher, T.E.; Mcdonald, L.M.; Clay, D.E.; Malo, D.D.; Papiernik, S.K. Phosphorus Sorption and Availability From Biochars and Soil/biochar Mixtures. Clean-Soil Air Water 2014, 42, 626–634. [Google Scholar] [CrossRef]
  17. Jing, Y.; Chen, X.M.; Qiu-Xia, L.I.; Huang, Q.R.; Zhang, J.B.; Chen, C. Effects of Biochar on Ammonium Nitrogen and Nitrate Nitrogen in Red Soil. J. Soil Water Conserv. 2013, 27, 265–269. [Google Scholar]
  18. Angst, T.E.; Sohi, S.P. Establishing release dynamics for plant nutrients from biochar. GCB Bioenergy 2013, 5, 221–226. [Google Scholar] [CrossRef]
  19. Van Zwieten, L.; Kimber, S.; Morris, S.; Chan, K.Y.; Downie, A.; Rust, J.; Joseph, S.; Cowie, A. Effects of biochar from slow pyrolysis of papermill waste on agronomic performance and soil fertility. Plant Soil 2010, 327, 235–246. [Google Scholar] [CrossRef]
  20. Kimetu, J.M.; Lehmann, J. Stability and stabilisation of biochar and green manure in soil with different organic carbon contents. Soil Res. 2010, 48, 577–585. [Google Scholar] [CrossRef]
  21. Spokas, K.A.; Novak, J.M.; Venterea, R.T. Biochar’s role as an alternative N-fertilizer: Ammonia capture. Plant Soil. 2012, 350, 35–42. [Google Scholar] [CrossRef]
  22. GB/T 19587-2004; Gas Adsorption BET Method of Solid Material Specific Surface Area. Standards of China (GB): Beijing, China, 2004.
  23. Dugan, E.; Verhoef, A.; Robinson, S.; Sohi, S.; Gilkes, R.J.; Prakpongkep, N. Bio-Char from Sawdust, Maize Stover and Charcoal: Impact on Water Holding Capacities (WHC) of Three Soils from Ghana, 19th World Congress of Soil Science: Soil Solutions for a Changing World, Brisbane, Queensland, Australia. Available online: https://www.cabidigitallibrary.org/doi/full/10.5555/20113353882 (accessed on 1 August 2010).
  24. Bu, X.; Xue, J. Research progress on the effects of biochar on soil habitat and plant growth. J. Ecol. Environ. 2014, 3, 535–540, (In Chinese with English Abstract). [Google Scholar] [CrossRef]
  25. Xu, N.-N.; Lin, D.-S.; Xu, Y.-M.; Xie, Z.-L.; Peng, Q.-H.; Guo, W.-J. Application of biochar in soil improvement and heavy metal pollution treatment. J. Agric. Resour. Environ. 2013, 4, 29–34, (In Chinese with English Abstract). [Google Scholar]
  26. Huang, M.; Yang, L.; Qin, H.; Jiang, L.; Zou, Y. Fertilizer nitrogen uptake by rice increased by biochar application. Biol Fertil Soils 2014, 50, 997–1000. [Google Scholar] [CrossRef]
  27. Partey, S.T.; Preziosi, R.F.; Robson, G.D. Short-Term Interactive Effects of Biochar, Green Manure, and Inorganic Fertilizer on Soil Properties and Agronomic Characteristics of Maize. Agric Res. 2014, 3, 128–136. [Google Scholar] [CrossRef]
  28. He, F.; Rong, X.; Liang, Y.; Wu, A.; Liu, Q. Effects of biochar on physicochemical properties and N2O and CO2 emissions from red soil vegetable fields. J. Agric. Environ. Sci. 2013, 32, 1893–1900, (In Chinese with English Abstract). [Google Scholar]
  29. Han, X.; Ge, Y.; Li, N.; Chen, K.; Yang, J.; Zhan, X.; Luo, P.; Liu, N. Effects of continuous application of biochar on soil physicochemical properties and nitrogen fertilizer utilization. J. Shenyang Agric. Univ. 2017, 48, 392–398, (In Chinese with English Abstract). [Google Scholar]
  30. Laird, D.; Fleming, P.; Wang, B.Q.; Horton, R.; Karlen, D. Biochar Impact on Nutrient Leaching from a Midwestern Agricultural Soil. Geoderma 2010, 158, 436–442. [Google Scholar] [CrossRef]
  31. Liu, S. Microecological Mechanism of Biochar Affecting the Effectiveness of Soil Phosphorus and Potassium. Ph.D. Thesis, Shenyang Agricultural University, Shenyang, China, 2016. (In Chinese with English Abstract). [Google Scholar]
  32. Prendergast-Miller, M.T.; Duvalla, M.; Sohia, S.P. Biochar-root interactions are mediated by biochar nutrient contentand impacts on soil nutrient availability. Eur. J. Soil Sci. 2014, 65, 173–185. [Google Scholar] [CrossRef]
  33. Butnan, S.; Deenik, J.L.; Toomsan, B.Y. Biochar chara-cteristics and application rates affecting corn growth and properties of soils contrasting in texture and mineralogy. Geoderma 2015, 237–238, 105–116. [Google Scholar] [CrossRef]
  34. Fang, B.; Li, X.; Zhao, B.; Zhong, L. Effects of biochar on soil physicochemical properties and crop yield in dry-crop farmland. J. Ecol. Environ. 2014, 8, 1292–1297, (In Chinese with English Abstract). [Google Scholar]
  35. Renner, R. Rethinking Biochar. Environ. Sci. Technol. 2007, 41, 5932. [Google Scholar] [CrossRef] [PubMed]
Figure 1. Location of the experimental area. (Note: The red triangle symbols with red labels represent sample plot. Map data from China’s National Geospatial Information Cloud, DEM means Digital Elevation Model).
Agronomy 14 01125 g001
Figure 2. Monthly changes in soil moisture content for different planting practices. (Note: data from November 2020 to November 2022).
Agronomy 14 01125 g002
Figure 3. Effect of biochar on the appearance quality of apples. (a) the effect of biochar on fruit transverse diameters; (b) the effect of biochar on fruit vertical diameters; (c) the effect of biochar on fruit pigmentation degree; (d) the effect of biochar on fruit weight. Different letters within the same column denote significant differences (p < 0.05) between the treatments.
Agronomy 14 01125 g003
Figure 4. Effect of biochar on fruit intrinsic quality. (a) the effect of biochar on fruit hardness; (b) the effect of biochar on fruit soluble solids; (c) the effect of biochar on fruit sweetness; (d) the effect of biochar on fruit acidity.
Agronomy 14 01125 g004
Figure 5. The effect of biochar on apple yield and optimal fruit rate.
Agronomy 14 01125 g005
Table 1. The levels of implementation of biochar in different treatments. (Note: CK means control check. T1 means treatment 1, the same with T2, T3, T4, T5, T6).
TreatmentCKT1T2T3T4T5T6
Biochar application (kg/plant)024681012
Compound fertilizer (kg/plant)15151515151515
Table 2. The soil pH of different treatments. (Note: 2020, 2021 and 2022. CK means control check. T1 means treatment 1, the same with T2, T3, T4, T5, T6).
TreatmentNovember 2020November 2021November 2022
CK8.63 ± 0.11 a8.66 ± 0.08 b8.64 ± 0.12 c
T18.45 ± 0.10 b8.61 ± 0.09 b8.70 ± 0.05 c
T28.50 ± 0.10 b8.68 ± 0.07 b8.79 ± 0.12 bc
T38.56 ± 0.09 ab8.77 ± 0.04 ab8.88 ± 0.08 b
T48.61 ± 0.08 ab8.85 ± 0.09 ab8.98 ± 0.03 ab
T58.64 ± 0.06 a8.91 ± 0.06 a9.05 ± 0.02 ab
T68.54 ± 0.07 ab8.96 ± 0.07 a9.11 ± 0.04 a
Different letters within the same column denote significant differences (p < 0.05) between the treatments.
Table 3. The effect of biochar on fruit shape index. (Note: CK means control check. T1 means treatment 1, the same with T2, T3, T4, T5, T6).
TreatmentCKT1T2T3T4T5T6
Fruit shape index0.84 0.85 0.84 0.85 0.86 0.86 0.84
Disclaimer/Publisher’s Note: The statements, opinions and data contained in all publications are solely those of the individual author(s) and contributor(s) and not of MDPI and/or the editor(s). MDPI and/or the editor(s) disclaim responsibility for any injury to people or property resulting from any ideas, methods, instructions or products referred to in the content.

