Article

Long-Term Nitrogen Addition Stimulated Soil Respiration in a Rainfed Wheat Field on the Loess Plateau

1
College of Agriculture, Shanxi Agricultrual University, Taigu, Jinzhong 030801, China
2
College of Forestry, Shanxi Agricultrual University, Taigu, Jinzhong 030801, China
3
State Key Laboratory of Soil Erosion and Dryland Farming on the Loess Plateau, Institute of Soil and Water Conservation, Chinese Academy of Sciences and Ministry of Water Resources, Yangling, Xianyang 712100, China
*
Author to whom correspondence should be addressed.
Agronomy 2024, 14(6), 1136; https://doi.org/10.3390/agronomy14061136
Submission received: 7 April 2024 / Revised: 19 May 2024 / Accepted: 22 May 2024 / Published: 27 May 2024

Abstract

:
Increased nitrogen (N) application has profound effects on CO2 flux in croplands. The aim of this study is to investigate the effects of long-term N addition on soil respiration (SR) in a rainfed winter wheat (Triticum aestivum L.) field in the Loess Plateau of China. Two wheat cultivars were planted under three levels of N application (0, 180, and 360 kg N ha−1 year−1) in non-irrigated cropland from 2004 to 2013. The diurnal and seasonal SR variations and abiotic and biotic factors were measured during the growing seasons in 2012–2013. The results showed that N180 and N360 increased the cumulative CO2 flux by 30.3% and 32.4% on average after 5 and 10 years of N application, respectively. Multiple regressions revealed that the seasonal SR was mainly controlled by the soil temperature (ST), at a depth of 8 cm, and the leaf area index. Diurnal SR was mainly controlled by the ST and the net photosynthesis rate. Long-term N application stimulated SR by increasing the photosynthetic leaf area and temperature sensitivity. Overall, N application at a rate of 360 kg N ha−1 year−1 did not reach the threshold for limiting SR in the investigated semi-humid rainfed wheat cropland in the Loess Plateau of China.

1. Introduction

Soil stores several times more carbon (C) than the atmosphere [1]. Soil respiration (SR) is the primary process through which CO2 is emitted from root respiration and soil organic matter (SOM) decomposition to the atmosphere [2,3]. It is a major component of terrestrial ecosystem C fluxes and is sensitive to N addition in ecosystems [4,5]. Given that excessive N application in croplands is prevalent in some regions [6], an improved understanding of the responses of SR to long-term N application is of great importance for clarifying C balances in agricultural ecosystems.
Although the effects of N application on SR have been widely studied, the results obtained in different regions are inconsistent. N effects on soil CO2 effluxes are extremely heterogeneous across various soil characteristics and climatic conditions [7] and may be positive [5,8], negative [9,10], or neutral [11,12]. An important factor contributing to the inconsistency of results is the fact that SR is composed of two components. One component is autotrophic respiration from plant roots, mycorrhizal fungi, and rhizosphere microorganisms; this component is supplied by carbohydrates from temporal photosynthesis [13]. The other component is heterotrophic respiration from microbial processes in the decomposition of plant residues and SOM [13]. The responses of autotrophic and heterotrophic respiration to N addition are inconsistent, likely because N inputs can change the allocation of carbohydrates to roots and/or microbial processes [14]. In N-limited ecosystems, N addition may increase photosynthetic C fixation, below-ground C allocation, and root respiration [15,16]. It can also relieve N limitations on microbial growth and promote heterotrophic respiration [17,18,19]. In N-saturated ecosystems, excessive N application may suppress soil microbial activities by decreasing pH or producing toxic compounds, and reduce root respiration by decreasing below-ground C allocation [20,21,22]. In some cases, excessive N application may have little effect on SR because of N leaching, lateral transportation in soil water, denitrification, or ammonia volatilization [7].
The Loess Plateau, one of the largest geographic units in China, covers an area of approximately 400,000 km2. More than 90% of its area is cropland. In this area, the average annual precipitation is only 300–600 mm, and the atmospheric evaporation is high [23,24]. Soil water availability is not only a key factor determining crop growth and C allocation [25], but it also influences microbial respiration [26,27]. Crops in this region are always intensively cultivated under excessive synthetic N addition [28]. In previous reports, N application rates routinely exceed 300 kg N ha–1 year−1 in winter wheat systems [6]. However, the long-term influence of N supplied at different rates on SR in wheat fields is unclear. In this study, we planted two varieties of winter wheat (Triticum aestivum L.) with different drought resistances under three levels of N supply (0, 180, and 360 kg N ha−1 year−1) over 10 years to investigate (i) the magnitude of SR response to long-term N supplied at different rates in rainfed wheat fields and (ii) the main factor affecting SR under long-term N supply in rainfed wheat fields.

2. Materials and Methods

2.1. Site Description

This study was conducted at a long-term field station established in 2004 at the Institute of Soil and Water Conservation of the Chinese Academy of Science. The study area is located at 34° 16′ 56.24″ N and 108° 4′ 7.95″ E (Yangling, China) and has a typical mild and semi-humid climate. Its mean annual precipitation is approximately 612 mm, and its mean annual air temperature is 13 °C. Rainfall is mainly concentrated from July to September. The daily temperatures and monthly rainfalls for 2012–2013 at the study location are shown in Figure 1. The air temperature was measured using a Testo 175-T2 data logger (Testo limited, Alton, UK), and precipitation was measured using a tipping bucket rain gauge (Model 7852, Davis Instruments, Hayward, CA, USA) connected to a CR10X data logger. In terms of annual precipitation and its distribution, 2012–2013 were regular years in this region.
The soil type is Eum-Orthic Anthrosols. Previous reports in the same field showed that the basic physical and chemical properties of the topsoil (0–20 cm) were as follows: pH 8.25, soil organic carbon (SOC) 8.79 g kg−1, total N 0.96 g kg−1, available N 25.1 mg kg−1, and available P 7.9 mg kg−1. The percentages of sand (0.05–2 mm), silt (0.002–0.05 mm), and clay (<0.002 mm) particles in the soil particle size composition were 6.4%, 59.4%, and 34.2%, respectively. The bulk density, water holding capacity, and permanent wilting point were 1.23 g cm−3, 23.6%, and 8.5%, respectively [29,30].

2.2. Experimental Design

This study used a randomized block design with two wheat (T. aestivum L.) cultivars, namely Changhan58 (CH) and Zhengmai9023 (ZM). Three treatments were conducted for each variety, and each treatment had three plot replicates. CH is a drought-tolerant cultivar, and ZM is a water-sensitive cultivar. The 1000-kernel weights of the two cultivars were 43.61 and 43.58 g, respectively. The size of each plot was 2 m × 3 m. Wheat seeds were sown in rows 15 cm apart at a rate of 130 kg ha−1 on 3 October and harvested on 9 June every year. Before sowing, fertilizer was evenly applied over the surface of the soil and immediately incorporated into the upper 15 cm of the soil by chiseling. N fertilizer was provided in the form of urea at three rates, namely, 0 (N0), 180 (N180), and 360 (N360) kg ha−1. The P application rate was 75 kg P2O5 ha−1. No K fertilizer was applied. All the fertilizers were applied before sowing. The experimental field was plowed to bury any weeds prior to sowing. The field management (fertilization and tillage) was consistent from 2004 to 2013. All soils were rainfed throughout the experiment.

2.3. Measurement and Methods

2.3.1. Soil Respiration and Temporal Soil Temperature

SR was recorded using an automated Li-8100 soil CO2 flux measurement system and a Li-8150 multiplexer with 12 8100-104 long-term chambers (Li-Cor Inc., Lincoln, NE, USA) at the elongation, heading, anthesis, grain-filling, and maturity stages. Twelve polyvinyl chloride collars with a height of 11.4 cm and a diameter of 21.3 cm were hammered into the soil to a depth of 1.5 cm. The collars were installed at least 2 weeks prior to the first measurement and retained in the soil throughout the wheat growing season. Plants and litter on the ground in collars were removed before each measurement. The measurement time was from 00:00 to 23:59 on sunny days. The CO2 flux rate in each collar was recorded once every 30 min. A chamber constructed of opaque polyvinyl chloride cylinders was closed for 120 s for each measurement, and the linear increase in the CO2 concentration in the closed chamber was used for the SR calculation.
The diurnal variation in soil temperature (ST) near each collar was recorded at the same time as the SR. The ST was measured at a depth of 8 cm using a thermocouple probe (Li-Cor Inc., Lincoln, NE, USA). In previous studies, correlation analyses have shown that the SR is more correlated with the temperature in top soils than in deep soils (20–80 cm) [31]. Hence, ST data at a depth of 8 cm were used to investigate the correlation between ST and SR.
To evaluate the temperature response of the SR, i.e., the temperature sensitivity, Q10, was calculated on the basis of the following function [1,32]:
SR = R 10 Q 10 ( T - 10 10 )
where Q10 describes the multiplicative change in SR with a 10 °C increase in the ST, SR represents the SR rate, R10 is the SR at 10 °C, and T describes the measured ST at a depth of 8 cm. The SR and ST data for regression analysis were taken from temporal measurements.

2.3.2. Soil Water Content and Soil Nitrogen Measurements

Soil water content (SWC) was measured through calibrated neutron scattering (Model 503 DR, Campbell Pacific Nuclear, Martinez, CA, USA) in a centrally located tube. SWC data acquired at a depth of 20 cm were used to estimate the relationship between the SWC and SR. Three soil cores with a depth of 0–20 cm and a diameter of 3 cm were extracted from each pot and subsequently combined to form a composite sample. Each sample was air-dried and stored at room temperature for chemical analysis. The total soil N (as digested with sulfuric acid) was measured by titrating the distillates after Kjeldahl sample preparation and determination (Foss, Kjeltec 2300 Analyzer Unit, Rose Scientific Ltd., Copenhagen, Denmark).

2.3.3. Gas Exchange and Leaf Area Index

An open gas exchange system (LI-6400, Li-Cor Inc., Lincoln, NE, USA) was used to measure the gas exchange parameters for the last fully expanded leaves throughout the growing season. Each measurement was performed from 9:30 to 11:00 on the same day as the SR measurements. The photosynthetic photon flux density was 1500 μmol m−2 s−1 and was provided using an LED (model 6400-02B, Li-Cor Biosciences Inc., Lincoln, NE, USA). The airflow rate was 0.5 cm3 min−1, and the cuvette temperature was 25 °C. The light-saturated net photosynthesis rate (Pn) and transpiration rate (Tr) were recorded automatically. Leaf water use efficiency (WUE) was estimated as the ratio of Pn/Tr. Additionally, a canopy analyzer (LAI-2000, Li-Cor Inc., Lincoln, NE, USA) was used to measure leaf area index (LAI) between 9:30 and 10:30 at each stage of growth.

2.4. Statistical Analysis

A multiway analysis of variance (ANOVA) was performed to test significance using SPSS software, ver. 17.0 (SPSS Inc., Chicago, IL, USA). Firstly, the normality of all data was tested using the K-S tests, and homogeneity using the F-tests. Then, significant differences were assessed at the 95% confidence level using the least significant difference post hoc tests. Moreover, linear regression was used to evaluate the relationship among ST, PAR, and SR at the diurnal scale and between LAI and SR at the seasonal scale. Exponential regression was used to evaluate the relationship between ST and SR at a seasonal scale.

3. Results

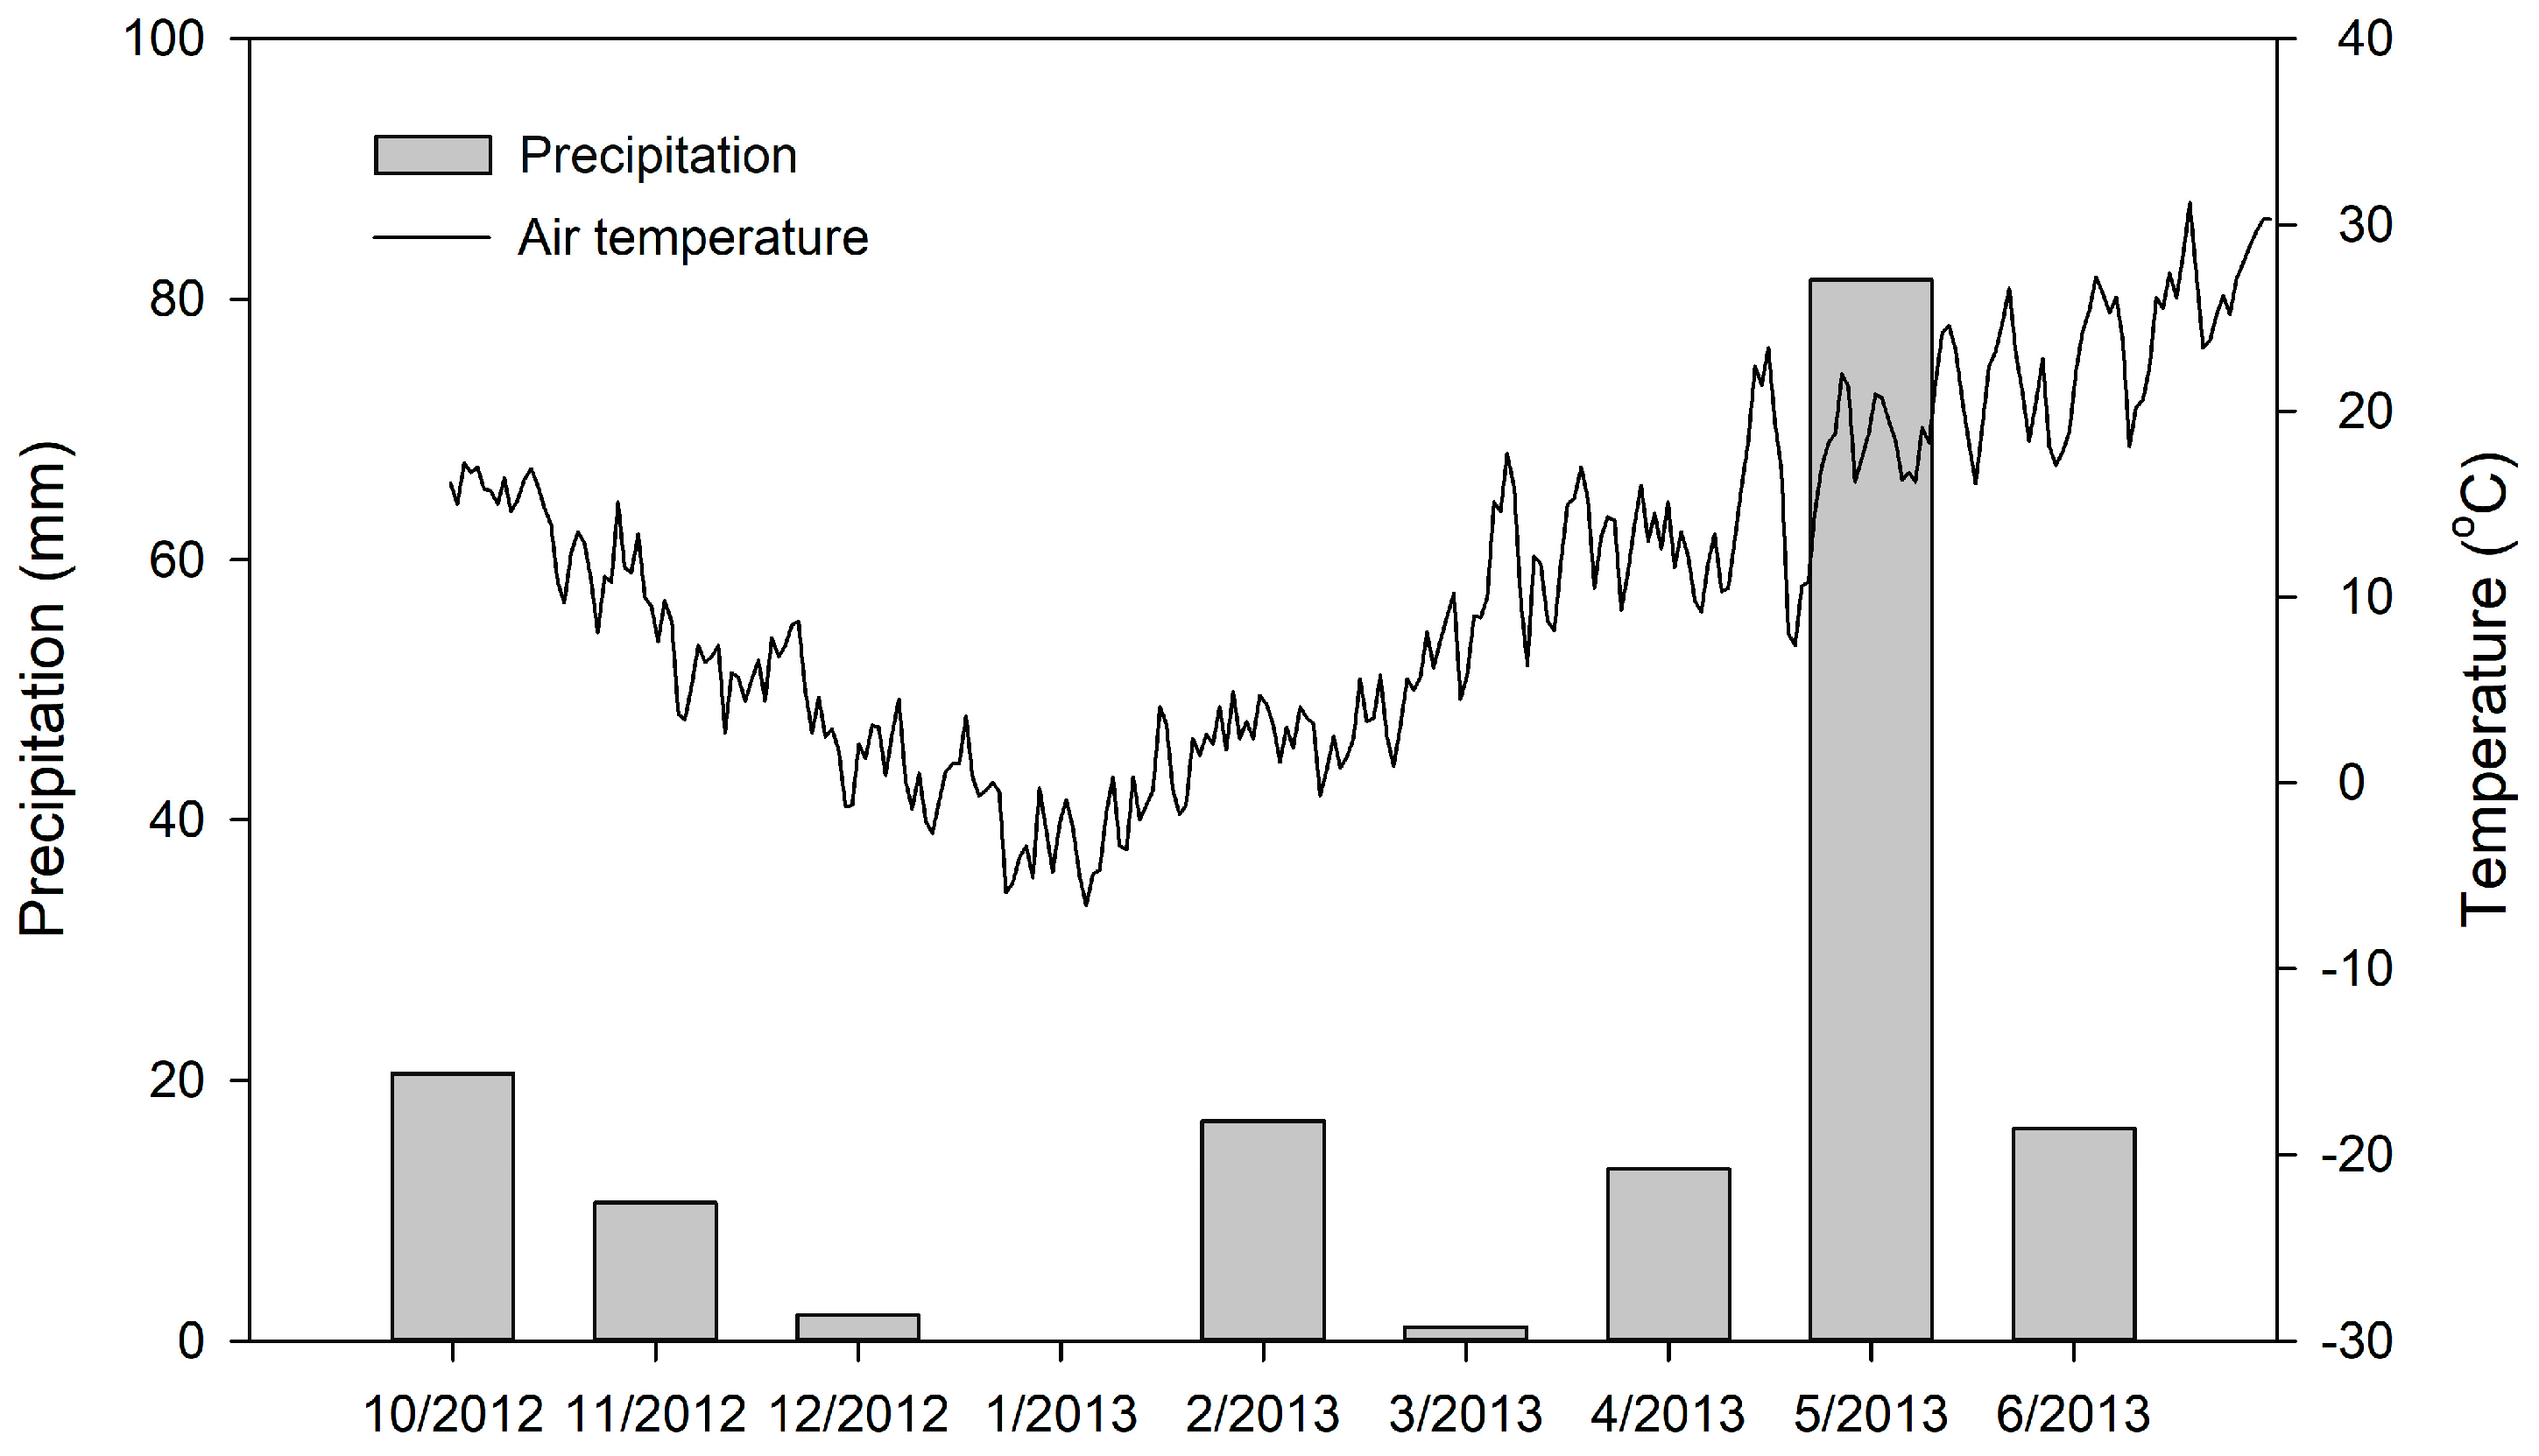
3.1. Variations in Annual Microclimatic, Biotic, and Abiotic Factors

The soil N content and SWC at the mature stage in the 5th (2009) and 10th (2013) years of the experiment are shown in Table 1. N180 and N360 significantly increased the soil N content and SWC in the ZM and CH plots. However, there was a difference in the total N between N180 and N360 for the two varieties. For CH, the total soil N of N360 was significantly higher than that of N180, but for ZM, there was no significant difference between N180 and N360. In addition, N180 increased the LAI at the elongation and heading stages and the net photosynthetic rate (Pn) from the elongation stage to the anthesis stage (Figure 2). N360 increased the LAI but did not increase the Pn in either cultivar.

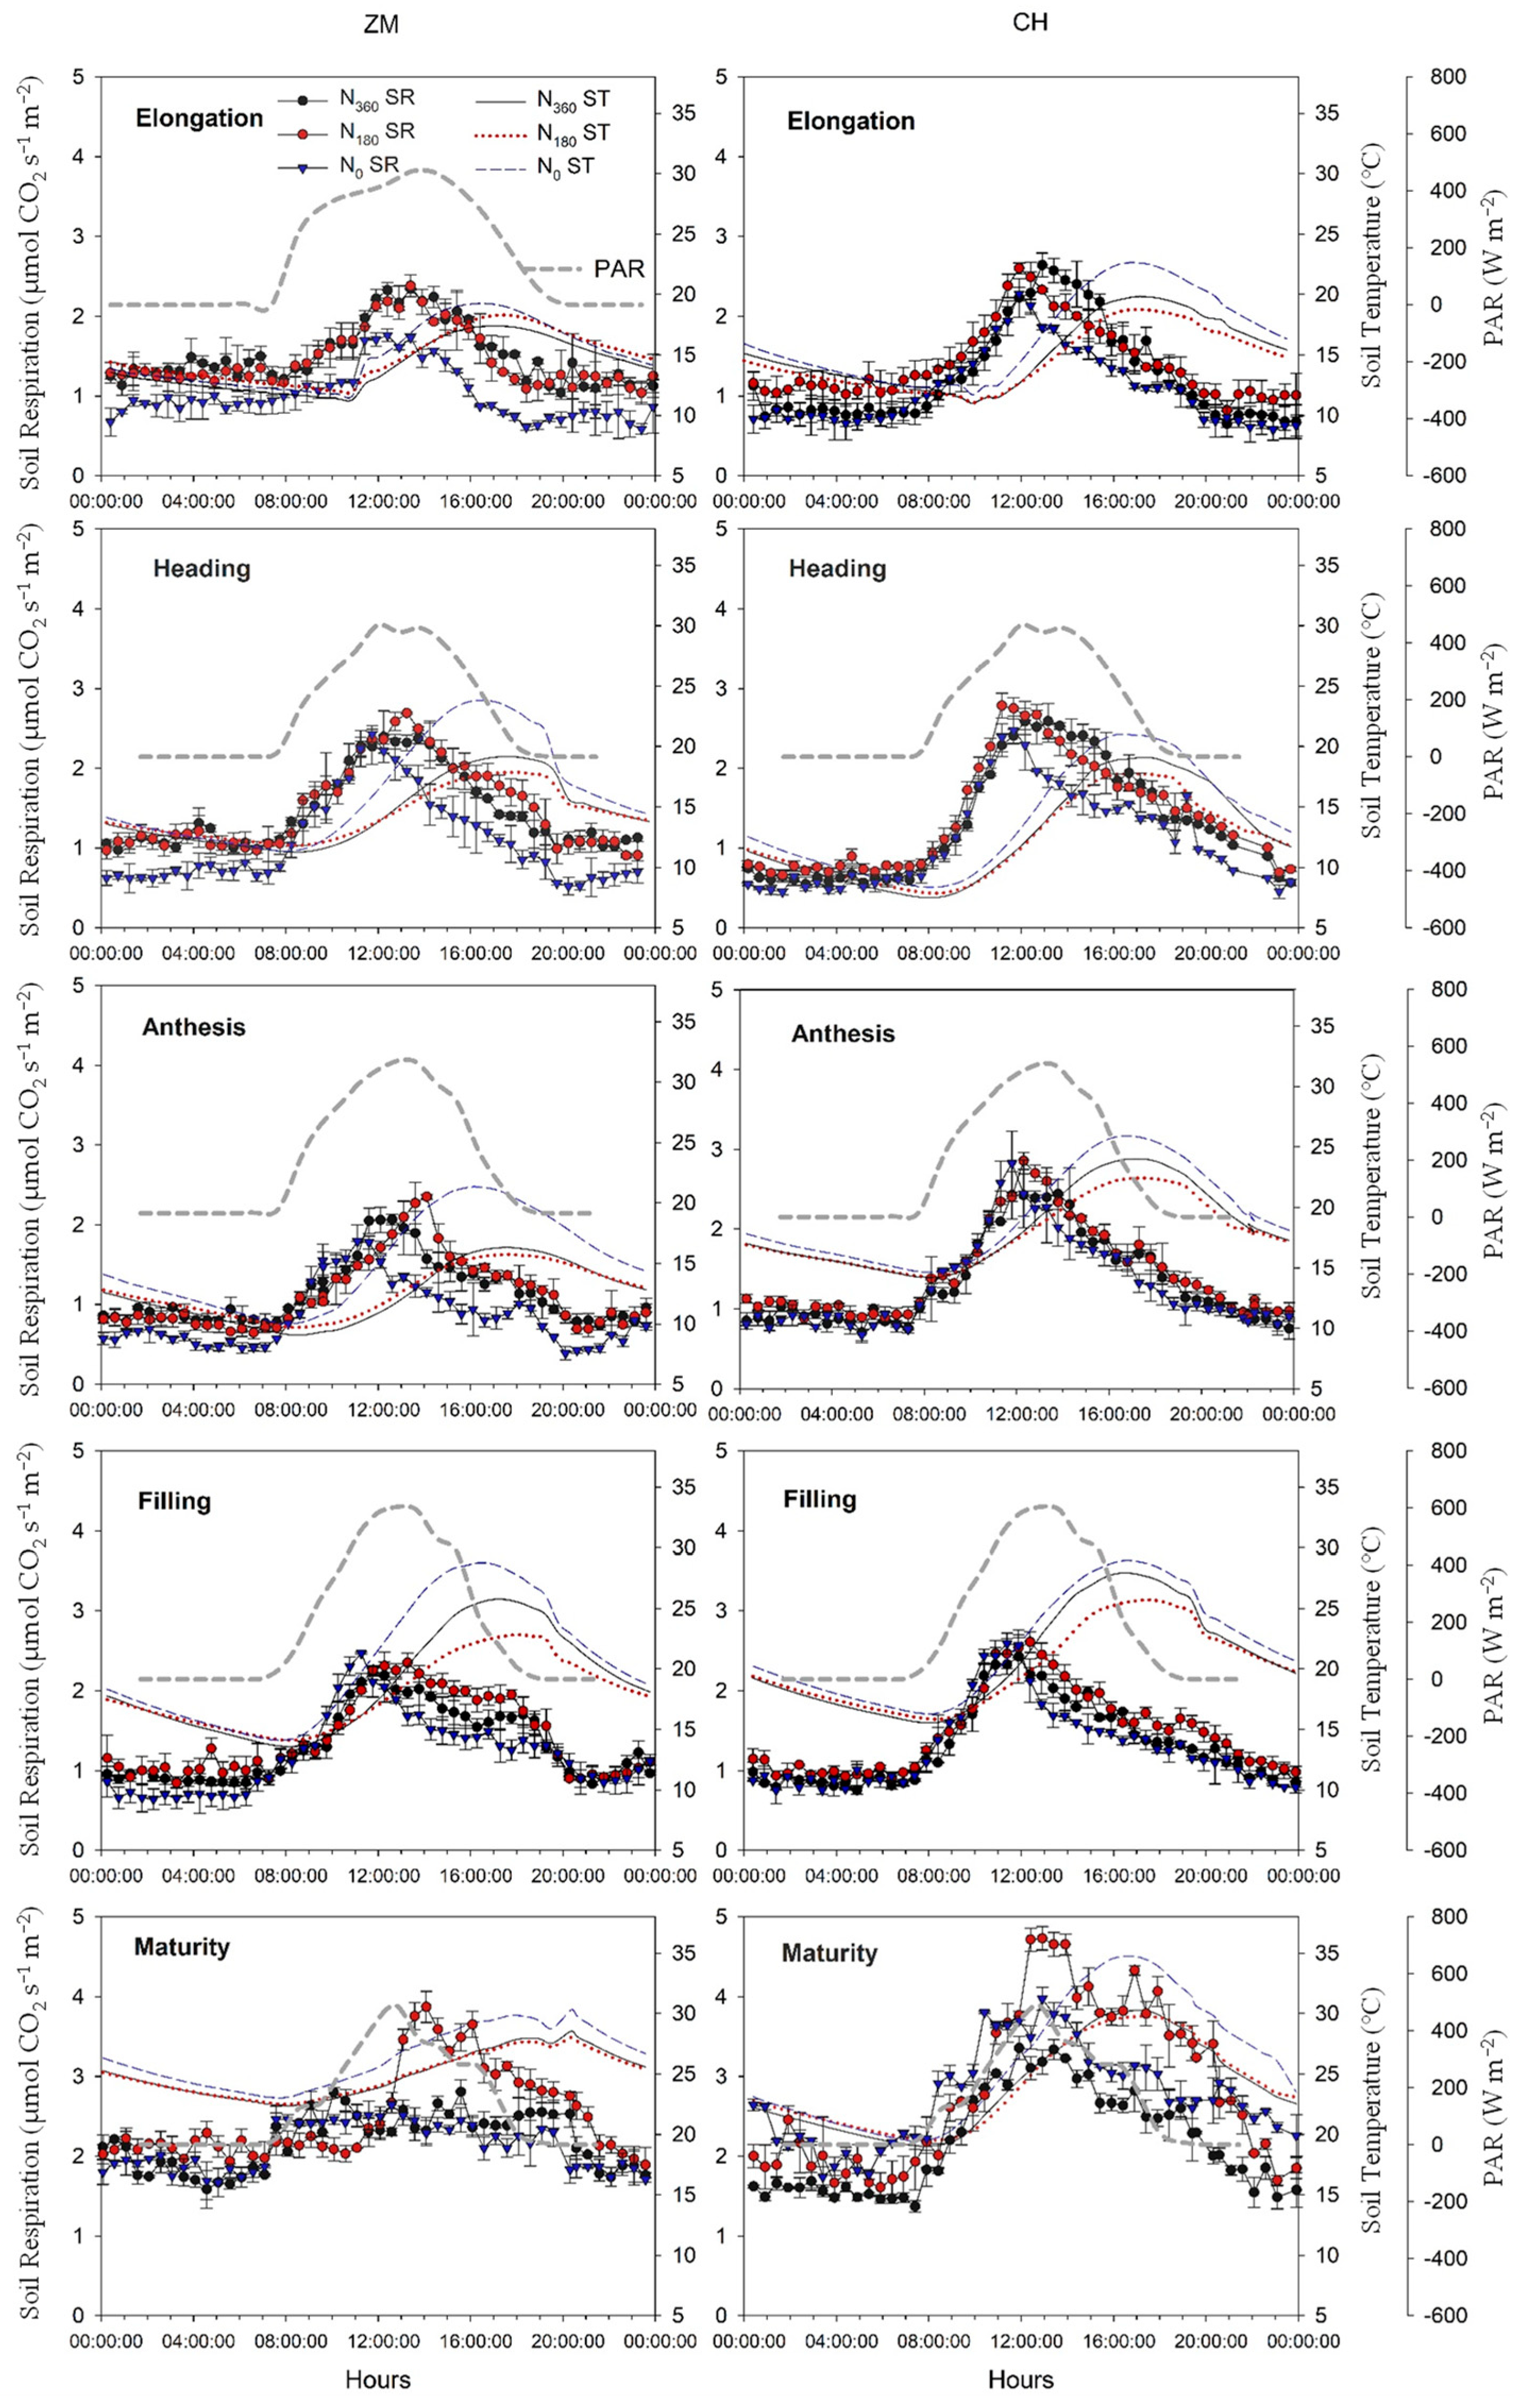
3.2. Soil Respiration Dynamics

On the seasonal scale, N180 and N360 increased cumulative CO2 effluxes by approximately 30.3% and 32.4%, respectively, and decreased cumulative STs by approximately 5.6% and 6.5%, respectively (Figure 3). The response of cumulative CO2 effluxes did not differ between cultivars, and the cumulative ST responses were greater in CH than in ZM. In addition, the SR and ST showed strong diurnal patterns with peaks in the daytime (Figure 4). N180 increased the daily peak of the SR over the growing season. By contrast, N360 increased the daily peak of the SR only from the elongation stage to the anthesis stage.
The daily peak of the ST delayed the peak of the SR by approximately 5.2 h (varying from 3.0 h to 7.5 h) in the ZM plots and by approximately 4.7 h (varying from 3.5 h to 6.0 h) in the CH plots (Figure 5). Generally, higher SWC and shorter lag times were observed in the CH plots than in the ZM plots (Figure 4).

3.3. Relationships of Soil Respiration with Biotic and Abiotic Factors

N180 increased the Q10 in both cultivars, and N360 increased the Q10 in only the ZM on the seasonal scale (Table 2), illustrating that N180 improved the impact of the ST on SR variation in both cultivars, whereas N360 improved this impact only in ZM plots. On the diurnal scale, the correlation between the ST and SR was higher in ZM plots (R2 = 0.70–0.77, p ≤ 0.04) than in CH plots (R2 = 0.42–0.59, p ≤ 0.05), whereas the correlation between PAR and SR was significant in the CH (R2 = 0.82–0.90, p ≤ 0.02) and ZM plots (R2 = 0.77–0.79, p ≤ 0.03) (Table 3). Correlations changed negligibly under different N treatments. The data illustrated that cultivars influenced the effect of the ST and PAR on the SR diurnal variation, whereas N application had little effect on the same parameters. The SR diurnal variation in CH mainly depended on the PAR, and in the ZM, it depended on the PAR and ST. Although the LAI and ST were good predictors of the seasonal variation in the SR, the relationship between the SR and SWC was not significant (p > 0.05) in both cultivars. The LAI and ST showed greater explanatory capabilities for the SR seasonal variations under N applications than under non-N applications (Table 4).

4. Discussion

4.1. Regulatory Mechanisms of Soil Respiration under N Application

N addition has been proven to promote SR in N-limited ecosystems, whereas it inhibits or has little effect on SR in N-saturated ecosystems [5,10,17]. In this study, the cumulative soil CO2 efflux increased on average by 30.3% under N180 and by 32.4% under N360 after 5 and 10 years of N application (Figure 3). This result is very close to the mean value for cropland calculated in a global meta-analysis (27.3% [33]). We observed that the application of N fertilizer at a rate of 360 kg N ha−1 year−1 did not reach the threshold for limiting the SR in the investigated field.
Previous studies have ascribed SR stimulation caused by N addition to increases in below-ground photosynthate allocation, residual inputs, SWC, and soil microbial activities [15,34]. In this study, SWC was not the main factor controlling SR variation (Table 4). The LAI and PAR showed great explanatory capabilities for the SR variation on seasonal and diurnal scales, respectively (Table 3 and Table 4). N addition promoted the LAI and Pn in both cultivars (Figure 2). Compared to the N-limited system (N0), the increase in photosynthetic capacity (Figure 2) and photosynthate transport to roots [35] by long-term N application promoted SR. However, compared to moderate N application (N180), excessive N treatment (N360) had little effect on the SR after 5 years of N application and decreased the SR after 10 years of N application. These results are consistent with a global meta-analysis showing that excessive N inputs (>150 kg N ha−1 year−1) may lead to N saturation in ecosystems and decrease the N application effect on autotrophic and heterotrophic respiration [33]. The reason may be that excessive N application could lead to a decrease in soil pH because after urea hydrolysis into NH4+-N, NH4+-N is converted into NO3-N, and H+ is released into the soil [36]. Soil acidification was well documented to decrease microbial activity, community composition, and the activity of extracellular enzymes, which inhibited litter and SOM decomposition and heterotrophic respiration [37,38].
In addition, compared to the N180 treatment, N360 had little effect on the ST and Q10 values. The Q10 represents the relative change in the SR with a 10 °C increase in the ST and is a determinant of climate-C cycle feedback in terrestrial ecosystems [33]. The Q10 was proven to be affected by many factors, such as the ST, SWC, quantity and composition of soil microbial community, root biomass, and soil substrate quality [39]. In some ecosystems, N enrichment-induced changes in the LAI and soil microclimate; below-ground C inputs may improve Q10 values of SR [8]. In the current study, compared with N180, the Pn and LAI under N360 conditions decreased slightly (Figure 2), indicating an inefficient stimulation on primary production and belowground C inputs of excessive N addition. Therefore, we speculate that more energy was needed to simulate SR under certain STs in plots with long-term excessive N application when compared to moderate N application in the current study.

4.2. Main Factors of Soil Respiration in Different Wheat Cultivars

We observed differences in soil microclimates between CH and ZM, which, in turn, influenced the SR. The daily peak of the SR was 1.5 h earlier in CH than in ZM (Figure 2). The daily peak of the ST delayed the peak of SR by only approximately 4.7 h in CH plots and by 5.2 h in ZM plots (Figure 5). ZM has several traits that moderated STs. The greater LAI in ZM than in CH at the elongation stage resulted in a cooler soil microclimate in ZM plots during late spring. A high LAI increases the quantity of solar radiation reflected upward and the amount of radiation absorbed by the plant canopy, thus reducing the radiation at the soil surface. In agreement with our results, the moderating effect of the LAI on ST has also been observed in switchgrass (Panicum virgatum L.) and maize (Zea mays L.) systems [23]. However, compared with CH, ZM under N180 and N360 showed a higher Q10 on a seasonal scale (Table 2) and closer relationships between the SR and ST on a diurnal scale (Table 3). This result suggests that the diurnal and seasonal increases in the ST may stimulate a greater SR in ZM plots than in CH plots under long-term N addition. In many cases, the Q10 was negatively correlated with STs [33,39]. In the current study, we speculate that there were two main reasons for a higher Q10 in ZM plots than in CH plots. Firstly, compared with CH, the cooler soil microclimate and lower SWC in ZM plots due to the large leaf area, higher transpiration rate, and higher water consumption possibly altered the quantity and composition of soil microbial communities, resulting in more heterotrophic respiration being sensitive to ST changes. Moreover, the increase in the ST possibly enhanced primary production and below-ground C allocation in ZM due to the large photosynthetic areas, leading to an increase in autotrophic respiration. Therefore, in a world of future climate change, it is important for ZM to find a compromise between increasing yields and reducing CO2 emissions through N management.

5. Conclusions

In a rainfed wheat field on the Loess Plateau of China, N application and cultivars altered the SR. Ten years of N addition at a rate of 180 or 360 kg N ha−1 increased the cumulative CO2 flux. The seasonal SR was mainly controlled by the ST and LAI; the diurnal SR was mainly controlled by the ST and Pn. A long-term N application stimulated SR by increasing the LAI and Q10. The diurnal and seasonal increases in STs may stimulate greater SRs in ZM plots than in CH plots due to the improvement in the LAI and water consumption under long-term N addition. Overall, N application at a rate of 360 kg N ha−1 year−1 did not reach the threshold for limiting SR in the investigated semi-humid rainfed wheat cropland. Our findings provide a basis for further understanding the CO2 emission patterns and control mechanisms of wheat fields in semi-humid regions under long-term N addition.

Author Contributions

Conceptualization, Z.S. and Y.Z. (Yuzheng Zong); methodology, X.S.; formal analysis, C.L.; investigation, Y.Z. (Yuzheng Zong); data curation, B.Y.; writing—original draft preparation, C.L. and Y.Z. (Yan Zhang); writing—review and editing, X.H. and H.Z.; visualization, X.S. and H.Z.; supervision, Z.S. and X.H.; funding acquisition, Y.Z. (Yuzheng Zong). All authors have read and agreed to the published version of the manuscript.

Funding

This study was supported by the Basic Applied Research Project of Shanxi Province (202103021224152), the Youth Talents Support Program of Shanxi Agricultural University (BJRC201602), and the Science and Technology Innovation Fund of Shanxi Agricultural University (2014018).

Data Availability Statement

The raw data supporting the conclusions of this article will be made available by the corresponding author on request.

Conflicts of Interest

The authors declare no conflicts of interest.

References

  1. Heimann, M.; Reichstein, M. Terrestrial ecosystem carbon dynamics and climate feedback. Nature 2008, 451, 289–292. [Google Scholar] [CrossRef]
  2. Ito, A. Global trends in land-atmosphere CO2 exchange fluxes: An analysis of a flux measurement dataset and comparison with terrestrial model simulations. J. Agric. Meteorol. 2021, 77, 211–223. [Google Scholar] [CrossRef]
  3. Jennifer, D.W.; Natali, S.M.; Minions, C.; Risk, D.; Arndt, K.; Zona, D.; Euskirchen, E.S.; Rocha, A.V.; Sonnentag, O.; Helbig, M.; et al. Soil respiration strongly offsets carbon uptake in Alaska and Northwest Canada. Environ. Res. Lett. 2021, 16, 084051. [Google Scholar] [CrossRef]
  4. Tu, L.H.; Hu, T.X.; Zhang, J.; Li, X.W.; Hu, H.L.; Liu, L.; Xiao, Y.L. Nitrogen addition stimulates different components of soil respiration in a subtropical bamboo ecosystem. Soil Biol. Biochem. 2013, 58, 255–264. [Google Scholar] [CrossRef]
  5. Diao, H.J.; Chen, X.P.; Wang, G.; Ning, Q.S.; Hu, S.Y.; Sun, W.; Dong, K.H.; Wang, C.H. The response of soil respiration to different N compounds addition in a saline–alkaline grassland of northern China. J. Plant Ecol. 2022, 15, 897–910. [Google Scholar] [CrossRef]
  6. Lu, D.; Lu, F.; Yan, P.; Cui, Z.; Chen, X. Elucidating population establishment associated with N management and cultivars for wheat production in China. Field Crop. Res. 2014, 163, 81–89. [Google Scholar] [CrossRef]
  7. Liu, Y.; Men, M.; Peng, Z.; Chen, H.Y.H.; Yang, Y.; Peng, Y. Spatially explicit estimate of nitrogen effects on soil respiration across the globe. Glob. Change Biol. 2023, 29, 3591–3600. [Google Scholar] [CrossRef] [PubMed]
  8. Shao, R.X.; Deng, L.; Yang, Q.H.; Shangguan, Z.P. Nitrogen fertilization increase soil carbon dioxide efflux of winter wheat field: A case study in Northwest China. Soil Tillage Res. 2014, 143, 164–171. [Google Scholar] [CrossRef]
  9. Ramirez, K.S.; Craine, J.M.; Fierer, N. Nitrogen fertilization inhibits soil microbial respiration regardless of the form of nitrogen applied. Soil Biol. Biochem. 2010, 42, 2336–2338. [Google Scholar] [CrossRef]
  10. Vinícius, A.O.; Brasil, E.P.F.; Teixeira, W.G.; Felipe, C.V.d.S.; Silva, A.R.D. Effects of Enhanced-Efficiency Nitrogen Fertilizers on Soil Microbial Biomass and Respiration in Tropical Soil Under Upland Rice Cultivation. J. Agric. Sci. 2021, 13, 31–42. [Google Scholar] [CrossRef]
  11. Lee, K.H.; Jose, S. Soil respiration, fine root production, and microbial biomass in cottonwood and loblolly pine plantations along a nitrogen fertilization gradient. For. Ecol. Manag. 2003, 185, 263–273. [Google Scholar] [CrossRef]
  12. Zhang, X.L.; Tan, Y.L.; Zhang, B.W.; Li, A.; Daryanto, S.; Wang, L.X.; Huang, J.H. The impacts of precipitation increase and nitrogen addition on soil respiration in a semiarid temperate steppe. Ecosphere 2017, 8, e01655. [Google Scholar] [CrossRef]
  13. Ryan, M.G.; Law, B.E. Interpreting, measuring, and modeling soil respiration. Biogeochemistry 2005, 73, 3–27. [Google Scholar] [CrossRef]
  14. Zhou, L.Y.; Zhou, X.H.; Zhang, B.C.; Lu, M.; Luo, Y.Q.; Liu, L.L.; Li, B. Different responses of soil respiration and its components to nitrogen addition among biomes: A meta-analysis. Glob. Chang. Biol. 2013, 20, 2332–2343. [Google Scholar] [CrossRef]
  15. Carreiro, M.M.; Sinsabaugh, R.L.; Repert, D.A.; Parkhurst, D.F. Microbial enzyme shifts explain litter decay responses to simulated nitrogen deposition. Ecology 2000, 81, 2359–2365. [Google Scholar] [CrossRef]
  16. Wei, L.; Su, J.; Jing, G.; Zhao, J.; Liu, J.; Cheng, J.; Jin, J. Nitrogen addition decreased soil respiration and its components in a long-term fenced grassland on the Loess Plateau. J. Arid Environ. 2018, 152, 37–44. [Google Scholar] [CrossRef]
  17. Widdig, M.; Schleuss, P.M.; Biederman, L.A.; Borer, E.T.; Spohn, M. Microbial carbon use efficiency in grassland soils subjected to nitrogen and phosphorus additions. Soil Biol. Biochem. 2020, 146, 107815. [Google Scholar] [CrossRef]
  18. Sun, Z.Z.; Liu, L.L.; Ma, Y.C.; Yin, G.D.; Zhao, C.; Zhang, Y.; Piao, S.L. The effect of nitrogen addition on soil respiration from a nitrogen-limited forest soil. Agric. For. Meteorol. 2014, 197, 103–110. [Google Scholar] [CrossRef]
  19. Kivimäki, S.K.; Sheppard, L.J.; Leith, I.D.; Grace, J. Long-term enhanced nitrogen deposition increases ecosystem respiration and carbon loss from a Sphagnum bog in the Scottish Borders. Environ. Exp. Bot. 2013, 90, 53–61. [Google Scholar] [CrossRef]
  20. Guo, J.H.; Liu, X.J.; Zhang, Y.; Shen, J.L.; Han, W.X.; Zhang, W.F.; Christie, P.; Goulding, K.W.T.; Vitousek, P.M.; Zhang, F.S. Significant acidification in major Chinese croplands. Science 2010, 327, 1008–1010. [Google Scholar] [CrossRef] [PubMed]
  21. Janssens, I.; Dieleman, W.; Luyssaert, S.; Subke, J.-A.; Reichstein, M.; Ceulemans, R.; Ciais, P.; Dolman, A.J.; Grace, J.; Matteucci, G. Reduction of forest soil respiration in response to nitrogen deposition. Nat. Geosci. 2010, 3, 315–322. [Google Scholar] [CrossRef]
  22. Bowden, R.D.; Davidson, E.; Savage, K.; Arabia, C.; Steudler, P. Chronic nitrogen additions reduce total soil respiration and microbial respiration in temperate forest soils at the Harvard Forest. For. Ecol. Manag. 2004, 196, 43–56. [Google Scholar] [CrossRef]
  23. Fan, T.L.; Stewart, B.A.; Wang, Y.; Luo, J.J.; Zhou, G.Y. Long-term fertilization effects on grain yield, water-use efficiency and soil fertility in the dryland of Loess Plateau in China. Agric. For. Meteorol. 2005, 106, 313–329. [Google Scholar] [CrossRef]
  24. Zhu, X.M.; Li, Y.S.; Peng, X.L.; Zhang, S.G. Soils of the Loess Plateau in China. Geoderma 1983, 29, 237–255. [Google Scholar] [CrossRef]
  25. Du, S.; Wang, Y.L.; Kume, T.; Zhang, J.G.; Otsuki, K.; Yamanaka, N.; Liu, G.B. Sapflow characteristics and climatic responses in three forest species in the semiarid Loess Plateau region of China. Agric. For. Meteorol. 2011, 151, 1–10. [Google Scholar] [CrossRef]
  26. Zhou, G.Y.; Zhou, X.H.; Liu, R.Q.; Du, Z.G.; Zhou, L.Y.; Li, S.S.; Liu, H.Y.; Shao, J.J.; Wang, J.W.; Nie, Y.Y. Soil fungi and fine root biomass mediate drought-induced reductions in soil respiration. Funct. Ecol. 2020, 34, 2634–2643. [Google Scholar] [CrossRef]
  27. Liu, L.; Estiarte, M.; Bengtson, P.; Li, J.; Peuelas, J. Drought legacies on soil respiration and microbial community in a Mediterranean forest soil under different soil moisture and carbon inputs. Geoderma 2022, 405, 115425. [Google Scholar] [CrossRef]
  28. Ju, X.T.; Xing, G.X.; Chen, X.P.; Zhang, S.L.; Zhang, L.J.; Liu, X.J.; Cui, Z.L.; Yin, B.; Christie, P.; Zhu, Z.L. Reducing environmental risk by improving N management in intensive Chinese agricultural systems. Proc. Natl. Acad. Sci. USA 2009, 106, 3041–3046. [Google Scholar] [CrossRef] [PubMed]
  29. Zhong, Y.; Yan, W.; Shangguan, Z. Soil carbon and nitrogen fractions in the soil profile and their response to long-term nitrogen fertilization in a wheat field. Catena 2015, 135, 38–46. [Google Scholar] [CrossRef]
  30. Zhong, Y.; Yan, W.; Shangguan, Z. Impact of long-term N additions upon coupling between soil microbial community structure and activity, and nutrient-use efficiencies. Soil Biol. Biochem. 2015, 91, 151–159. [Google Scholar] [CrossRef]
  31. Han, G.X.; Yu, J.B.; Li, H.B.; Yang, L.Q.; Wang, G.M.; Mao, P.L.; Gao, Y.J. Winter soil respiration from different vegetation patches in the Yellow River Delta, China. Environ. Manag. 2012, 50, 39–49. [Google Scholar] [CrossRef] [PubMed]
  32. Shi, W.Y.; Zhang, J.G.; Yan, M.J.; Yamanaka, N.; Du, S. Seasonal and diurnal dynamics of soil respiration fluxes in two typical forests on the semiarid Loess Plateau of China: Temperature sensitivities of autotrophs and heterotrophs and analyses of integrated driving factors. Soil Biol. Biochem. 2012, 52, 99–107. [Google Scholar] [CrossRef]
  33. Yang, Y.; Li, T.; Pokharel, P.; Liu, L.; Qiao, J.; Wang, Y.; An, S.; Chang, S.X. Global effects on soil respiration and its temperature sensitivity depend on nitrogen addition rate. Soil Biol. Biochem. 2022, 174, 108814. [Google Scholar] [CrossRef]
  34. Xu, W.H.; Wan, S.Q. Water-and plant-mediated responses of soil respiration to topography, fire, and nitrogen fertilization in a semiarid grassland in northern China. Soil Biol. Biochem. 2008, 40, 679–687. [Google Scholar] [CrossRef]
  35. Jia, H.; Fei, X.; Zhu, J.; Chen, W.; Chen, R.; Liao, Z.; Zhou, B.; Huang, Y.; Du, H.; Xu, P.; et al. Soil respiration and its response to climate change and anthropogenic factors in a karst plateau wetland, southwest China. Sci. Rep. 2024, 14, 8653. [Google Scholar] [CrossRef] [PubMed]
  36. Kopáček, J.; Cosby, B.J.; Evans, C.D.; Hruška, J.; Moldan, F.; Oulehle, F.; Šantrůčková, H.; Tahovská, K.; Wright, R.F. Nitrogen, organic carbon and sulphur cycling in terrestrial ecosystems: Linking nitrogen saturation to carbon limitation of soil microbial processes. Biogeochemistry 2013, 115, 33–51. [Google Scholar] [CrossRef]
  37. Wang, J.; Song, B.; Ma, F.; Tian, D.; Li, Y.; Yan, T.; Quan, Q.; Zhang, F.; Li, Z.; Wang, B.; et al. Nitrogen addition reduces soil respiration but increases the relative contribution of heterotrophic component in an alpine meadow. Funct. Ecol. 2019, 33, 2239–2253. [Google Scholar] [CrossRef]
  38. Du, W.; Li, Y.; He, P.; Zhang, J.; Jing, H.; Nie, C.; Liu, Y. Nitrogen Addition Decreases Soil Respiration without Changing the Temperature Sensitivity in a Semiarid Grassland. J. Resour. Ecol. 2020, 11, 129–139. [Google Scholar] [CrossRef]
  39. Yang, S.; Wu, H.; Wang, Z.; Semenov, M.; Ye, J.; Yin, L.; Wang, X.; Kravchenko, I.; Semenov, V.; Kuzyakov, Y. Linkages between the temperature sensitivity of soil respiration and microbial life strategy are dependent on sampling season. Soil Biol. Biochem. 2022, 172, 108758. [Google Scholar] [CrossRef]
Figure 1. Monthly precipitations (mm) and daily air temperatures (°C) during the sampling periods in the Yangling research farm from October 2012 to June 2013.
Agronomy 14 01136 g001
Figure 2. The water use efficiency (WUE, μmol s−1 m−2 mmol s−1 m−2), leaf area index (LAI), and net photosynthetic rate (Pn, μmol s−1 m−2) of CH and ZM from the elongation stage (5 March) to anthesis stages (10 April) during the 2013 growing season. The values represent the means ± SE (n = 5). Different letters in the same columns indicate significant differences among N treatments at p < 0.05. CH: Changhan58, ZM: Zhengmai9023, N0: urea was applied at 0 kg ha−1, N180: urea was applied at 180 kg ha−1, N360: urea was applied at 360 kg ha−1.
Agronomy 14 01136 g002
Figure 3. The cumulative CO2 emission (g C m−2 year−1), (A) and accumulated soil temperature (°C), (C) from the sowing (25 October) to maturity stages (6 June) during the 2008–2009 growing season, and the cumulative CO2 effluxes (B) and accumulated soil temperature (D) from the sowing (21 October) to maturity stages (8 June) during the 2012–2013 growing season. Values represent the means ± SE (n = 3). Different letters in the same columns indicate significant differences among N treatments in one cultivar at p < 0.05. CH: Changhan58, ZM: Zhengmai9023, N0: urea was applied at 0 kg ha−1, N180: urea was applied at 180 kg ha−1, N360: urea was applied at 360 kg ha−1.
Agronomy 14 01136 g003
Figure 4. Diurnal variations in soil respiration (SR, μmol CO2 s−1 m−2), soil temperature (ST, °C), and photosynthetically active radiation (PAR, W m−2) at the elongation stage (5/6 March), heading stage (19/20 March), anthesis stage (10/11 April), filling stage (22/23 April), and maturity stage (8/9 June) during the 2013 growing season. The SR and ST data were measured once every 0.5 h. The values represent the means ± SE (n = 3). CH: Changhan58, ZM: Zhengmai9023, N0: urea was applied at 0 kg ha−1, N180: urea was applied at 180 kg ha−1, N360: urea was applied at 360 kg ha−1.
Agronomy 14 01136 g004
Figure 5. Average diurnal variations in soil respiration (SR, open circles with solid lines), photosynthetically active radiation (PAR, dotted lines), and soil temperature (ST, solid lines) at 8 cm depth in (A) ZM and (B) CH plots during the 2013 growing season. Dashed lines perpendicular to the horizontal indicate daily peaks of SR and ST. Black solid lines with double arrows indicate lag times between the peaks of SR and ST. CH: Changhan58, ZM: Zhengmai9023.
Agronomy 14 01136 g005
Table 1. The total soil N (mg kg−1) and soil water content (SWC, %) in 0–20 cm of soil at the maturity stage in 2009 and 2013.
Total N (mg kg−1)SWC (%)
2009201320092013
CHN078.61 ± 3.57 c79.74 ± 3.29 c5.45 ± 0.73 c18.30 ± 1.83 b
N18083.02 ± 3.04 b84.80 ± 2.75 b11.97 ± 0.95 b20.33 ± 1.38 b
N36086.25 ± 3.15 a88.72 ± 3.17 a24.08 ± 2.24 a27.89 ± 1.74 a
ZMN077.04 ± 4.03 b77.52 ± 3.02 b5.87 ± 0.69 c15.36 ± 1.94 b
N18082.72 ± 4.19 a84.27 ± 4.26 a12.54 ± 1.58 b17.43 ± 1.67 b
N36083.24 ± 5.62 a85.34 ± 4.38 a20.32 ± 2.47 a20.11 ± 1.63 a
The values represent the means ± SE (n = 3). Different letters in the same column indicate significant differences among N treatments in one cultivar at p < 0.05. CH: Changhan58, ZM: Zhengmai9023, N0: urea was applied at 0 kg ha−1, N180: urea was applied at 180 kg ha−1, N360: urea was applied at 360 kg ha−1.
Table 2. Relationships between soil respiration (SR) and soil temperature (ST) and the apparent Q10 values at seasonal scale.
VarietyTreatmentFitted EquationQ10
ZMN0SR = 9.80e0.38ST2.41
N180SR = 7.07e0.56ST3.64
N360SR = 6.94e0.56ST3.66
CHN0SR = 12.70e0.26ST1.81
N180SR = 11.11e0.36ST2.28
N360SR = 10.20e0.30ST1.99
CH: Changhan58, ZM: Zhengmai9023, N0: urea was applied at 0 kg ha−1, N180: urea was applied at 180 kg ha−1, N360: urea was applied at 360 kg ha−1.
Table 3. Relationships between soil respiration (SR) and soil temperature (ST) and photosynthetically active radiation (PAR) at the diurnal scale.
TreatmentSTPAR
R2pR2p
ZMN00.750.030.770.01
N1800.770.010.780.02
N3600.700.040.790.03
CHN00.590.010.820.01
N1800.420.050.860.02
N3600.540.050.900.02
Main statistics of the relationships between them include R2 (correlation coefficient) and p-value. CH: Changhan58, ZM: Zhengmai9023, N0: urea was applied at 0 kg ha−1, N180: urea was applied at 180 kg ha−1, N360: urea was applied at 360 kg ha−1.
Table 4. Relationships between soil respiration (SR) and the leaf area index (LAI), soil temperature (ST), and soil water content (SWC) at the seasonal scale.
TreatmentLAISTSWC
R2pR2pR2p
ZMN00.370.200.190.380.960.001
N1800.670.010.640.020.030.76
N3600.850.010.890.000.150.45
total0.770.050.540.0010.350.51
CHN00.670.050.490.120.210.36
N1800.460.210.790.020.150.44
N3600.490.120.350.210.100.57
total0.610.050.630.00040.180.40
Main statistics of the relationships between them include R2 (correlation coefficient) and p-value. The “total” represents the relationship without distinguishing fertilization treatments. CH: Changhan58, ZM: Zhengmai9023, N0: urea was applied at 0 kg ha−1, N180: urea was applied at 180 kg ha−1, N360: urea was applied at 360 kg ha−1.
Disclaimer/Publisher’s Note: The statements, opinions and data contained in all publications are solely those of the individual author(s) and contributor(s) and not of MDPI and/or the editor(s). MDPI and/or the editor(s) disclaim responsibility for any injury to people or property resulting from any ideas, methods, instructions or products referred to in the content.

