Article

Assessing Net Irrigation Needs in Maize–Wheat Rotation Farmlands on the North China Plain: Implications for Future Climate Scenarios

by
Yujin Wu
1,2,
Pei Leng
2,* and
Chao Ren
1
1
College of Geomatics and Geoinformation, Guilin University of Technology, Guilin 541006, China
2
State Key Laboratory of Efficient Utilization of Arid and Semi-Arid Arable Land in Northern China/Institute of Agricultural Resources and Regional Planning, Chinese Academy of Agricultural Sciences, Beijing 100081, China
*
Author to whom correspondence should be addressed.
Agronomy 2024, 14(6), 1144; https://doi.org/10.3390/agronomy14061144
Submission received: 16 April 2024 / Revised: 16 May 2024 / Accepted: 26 May 2024 / Published: 27 May 2024
(This article belongs to the Section Water Use and Irrigation)

Abstract

:
Assessment of agricultural water requirements under future climate projections has received increasing attention in recent decades. The agriculture pattern of the semi-arid North China Plain is a maize–wheat rotation system in which sufficient irrigation is required to maintain production. In this study, the effects of future climate scenarios on the net irrigation requirement of the maize–wheat rotation system were assessed using the Food and Agriculture Organization crop growth model—AquaCrop. First, the baseline net irrigation requirement over the study region was obtained through AquaCrop simulation under ERA5-Land reanalysis from 2011 to 2020. In addition, the AquaCrop model was used to predict irrigation requirements in future scenarios (2021–2050) under the extreme-emission scenario of the Shared Socioeconomic Pathway SSP 5-8.5 (SSP 5-8.5). Finally, the predicted irrigation amount for maize and wheat during the period 2021–2050 under SSP 5-8.5 was compared with the baseline to assess the interannual change in irrigation water requirement. Results reveal significant agreement between the AquaCrop-derived daily soil moisture (SM) and a reference SM product with unbiased root mean square differences of 0.03 m3/m3 and 0.04 m3/m3 over maize and wheat, respectively. Furthermore, the median net irrigation requirement is expected to increase by approximately 107 mm (21%) to guarantee optimum yield.

1. Introduction

Global climate affected agricultural water demand and crop production [1,2,3,4]. Agriculture is the largest global consumer of water, accounting for approximately 69% of annual water withdrawals, and irrigated croplands cover only 18% of the global cropland area but contribute 40% of global food production [5,6]. Studies in recent years have shown that climate change may be more dramatic than previously thought [7,8]. To this end, it is necessary to assess the agricultural water requirement under possible future climate conditions.
The most widely used method for providing information on irrigation water use was through census statistics, which only supports data at a coarse scale. For example, the Pakistan Bureau of Statistics (https://opendata.com.pk/, accessed on 25 May 2024) reports irrigation water withdrawals from canals at the province scale, and the China Water Resources Bulletin reports withdrawals for agriculture at the province scale [9]. However, these data cannot provide details on exact water use for croplands, and withdrawals might also be underreported by some countries. Beyond census data, satellite remote sensing has enabled regular gridded data for efficient geospatial analyses of irrigation over large areas. The wide availability of data from various satellite sensors made it possible to assess which areas are irrigated, the timing of irrigation, and the water amount supplied to the fields [10,11]. However, the accuracy of irrigation information from satellite data is strongly affected not only by spatial and temporal resolution of observations but also by cloud cover and sensitivity to vegetation [12,13]. The process-based models, such as hydrological and crop models that have integrated irrigation schemes, are another alternative to provide explicit spatial and temporal information on irrigation water use [14,15,16]. One of the pioneering work on the assessment of global future irrigation requirements under climate change was performed by Döll and Siebert [14], who used a hydrological model with two future climate projections and found an average global increase in the long-term average irrigation requirement of about 10% by the 2070s. Compared with hydrological models, crop models provide detailed representations of crop-specific phenology and resource (water and nutrient) use, which can better describe the water requirement during crop growth [17]. With the development of global climate projections, many studies have combined crop models and future climate scenarios to evaluate the effects of climate changes on agricultural water demand and crop production in recent years [18,19,20,21,22].
The North China Plain (NCP) is one of the most important agricultural production bases in China [23]. It is a typical semi-arid region with a summer maize–winter wheat rotation system and supplies approximately 50% of the wheat and 33% of the maize in China [20,24]. From the 1980s to the 2000s, the irrigation water requirements for winter wheat and summer maize are approximately 341.1 mm/year and 250.5 mm/year in the NCP region, respectively [25]. The impacts of future climate change on water use in the NCP have frequently been assessed during the past decades [20,21,26,27,28]. However, a major drawback for most of these studies is that they operated at relatively coarse spatial resolution (~100–250 km) under various Representative Concentration Pathways (RCPs) [29,30]. Hence, downscaling techniques are commonly required to obtain future climate predictions at finer spatial resolution [21,31,32,33]. Nevertheless, a number of auxiliary data are required for the downscaling techniques, which has further constrained the application of these future climate projections on a regional scale. With the development of the CMIP6 High Resolution Model Intercomparison Project (HighResMIP), climate projections with high spatial resolution are expected to enable a more realistic simulation of atmospheric processes [34]. In recent years, an increasing number of studies have highlighted the positive impact of higher spatial resolution climate projections on the description of climate interactions at various scales [35,36,37,38,39,40,41]. Another limitation of previous studies is the lack of consideration of actual water requirements over different crop growth stages. For instance, Busschaert [42] considered that the actual irrigation requirement should be equal to evapotranspiration, whereas others used a fixed threshold value to determine the irrigation amount during the entire growth period [43,44]. To this end, the objective of this study is to investigate irrigation requirements to maintain production over the semi-arid NCP region under future climate projections with high spatial resolution using a well-defined crop model. Specifically, the irrigated area and phenological phases of crops were assumed to be unchanged to maximize the comparability of future and baseline irrigation. Except for these, since the present study focused on the effects of future climate change on net irrigation needs, other factors (including cultivars and field management) were kept unchanged and assigned as default values inherited in crop model simulation. Under these hypotheses, net irrigation needs over four major crop growth stages (emergence, canopy growth, max canopy, and senescence) with both summer maize and winter wheat were considered, and the possible variation in irrigation needs can be finally determined by comparison with the baseline value.
The remaining part of the paper is structured as follows: Section 2 presents the materials and methods, Section 3 analyzes the results, and the discussion and conclusion are provided in Section 4 and Section 5, respectively.

2. Materials and Methods
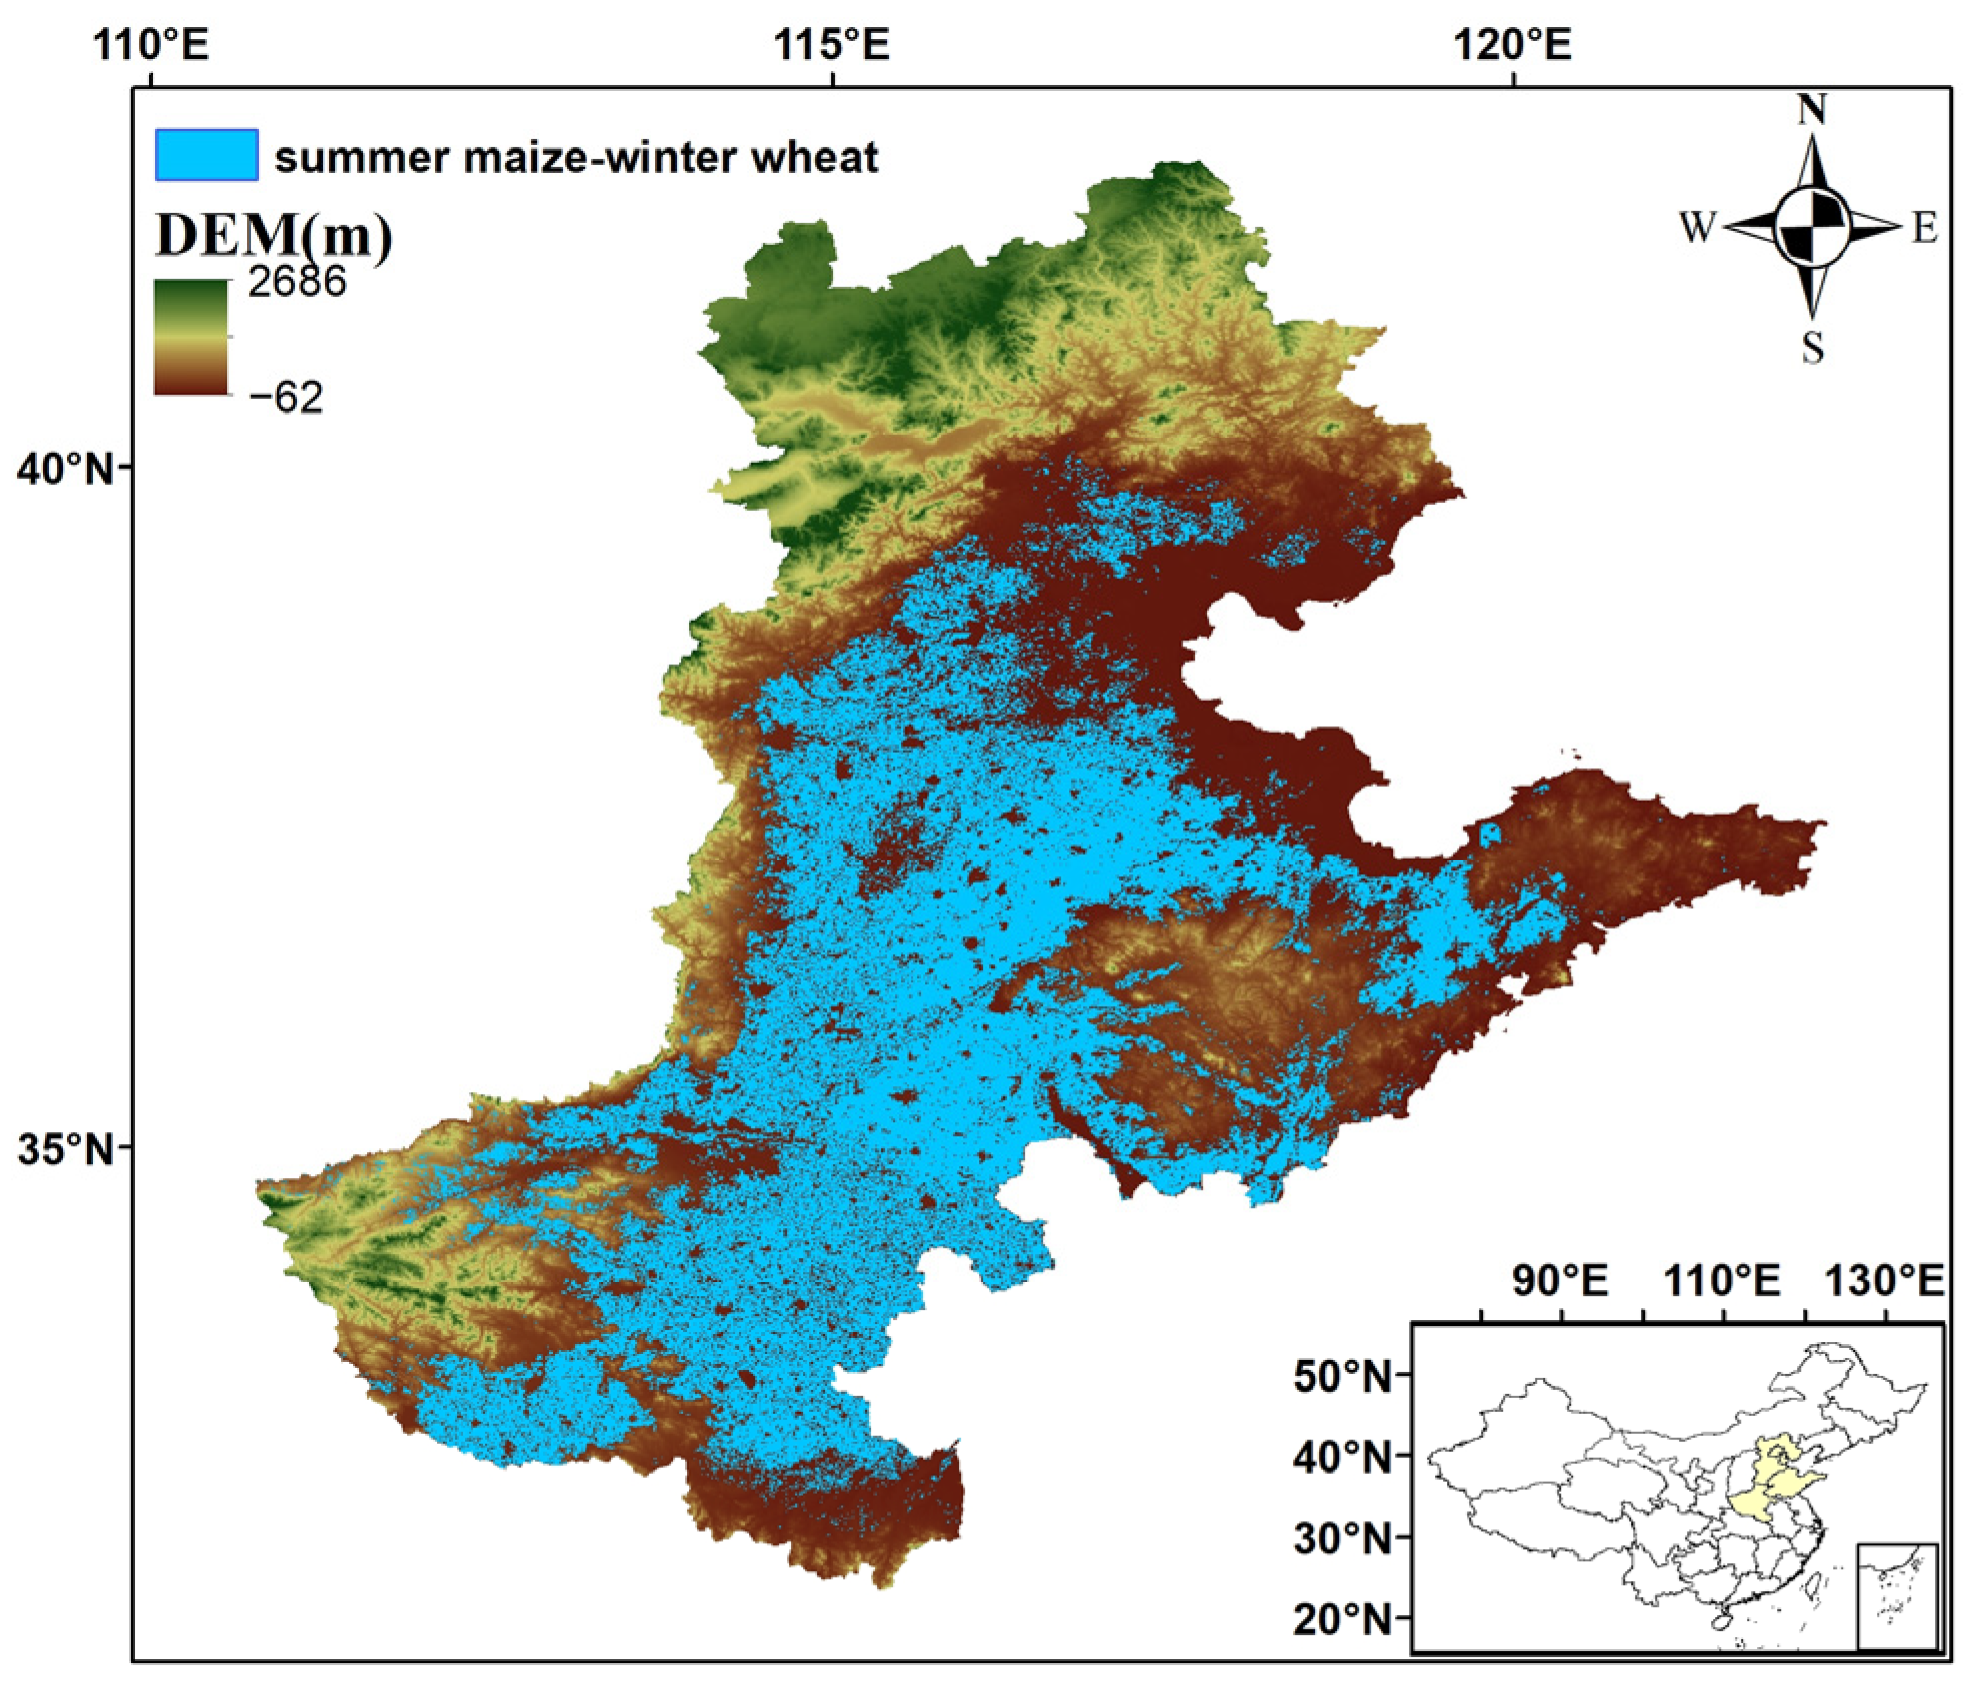
2.1. Study Region

In this paper, the NCP is selected as a study region to investigate irrigation requirements in future climate scenarios. The NCP region is characterized by a typical summer maize–winter wheat rotation system. Figure 1 shows the planting area in the NCP region. Specifically, the blue area was determined as a summer maize–winter wheat pixel and belonged to a typical irrigated region where irrigation is required to maintain crop yields. As seen in the figure, except for the mountain areas in the north and west parts of the NCP, it is obvious that most of the study region belongs to the summer maize–winter wheat rotation system. Another reason for selecting the NCP is due to the severe water shortage in this region. The recent literature has indicated that the annual available water resources per capita in NCP (~300 m3/year) are far less than those in Southern China (~3180 m3/year) [45] and below the recommended global baseline for water stress (1700 m3/year) [46]. Hence, it is necessary to investigate the irrigation requirement of the NCP under a possible dramatic future scenario.

2.2. Data

In the present study, the ERA5-Land reanalysis data, including grid total precipitation, dew point temperature, air temperature, wind speed, surface pressure, and surface net solar radiation with a spatial resolution of 0.1° (~10,000 m) and temporal resolution of one day from 2011 to 2020 were used for calibrating the parameters of the AquaCrop model. Specifically, the hourly ERA5-Land data were averaged at daily intervals to match the requirement of the AquaCrop model.
Because SM can directly reflect the effects of irrigation, a reference SM product, namely the soil moisture of China by in situ data (SMCI), was used to evaluate the AquaCrop-derived SM. The SMCI was obtained through a machine learning algorithm using climate variables, vegetation indices, soil properties, and in situ SM measurements at 1789 stations in China [48]. Apart from the high accuracy with an unbiased root mean square error of approximately 0.05 m3/m3, the SMCI product can also provide SM at different depths, which is one of the main reasons for selecting it in the present study because other congeneric SM products are characterized with a shallow depth of approximately 5 cm, whereas most of the roots in the study region are distributed within a layer of approximately 30 cm [49,50]. To this end, SM at three layers (0–10 cm, 10–20 cm, and 20–30 cm) of the SMCI product were averaged to representative SM at a depth of 30 cm.
To investigate the irrigation requirement over the semi-arid NCP region under future climate projection with high spatial resolution, three future climate datasets (FGOALS-f3-H, EC-Earth3P-HR, and HiRAM-SIT-HR) from 2021 to 2050 from HighResMIP were considered [51,52,53]. Table 1 shows the three future climate datasets in detail. Specifically, the HighresMIP has two scenarios with the extreme-emission scenario of Shared Socioeconomic Pathway SSP5-8.5 (SSP5-8.5): highres-future and highresSST-future. The main difference between them is that the sea surface temperature (SST) was considered in the latter, as many studies have shown that SST has a significant influence on the atmosphere via changes in air–sea fluxes [54,55,56,57]. All climate variables were resampled to match the ERA5-Land data using the cubic interpretation method.

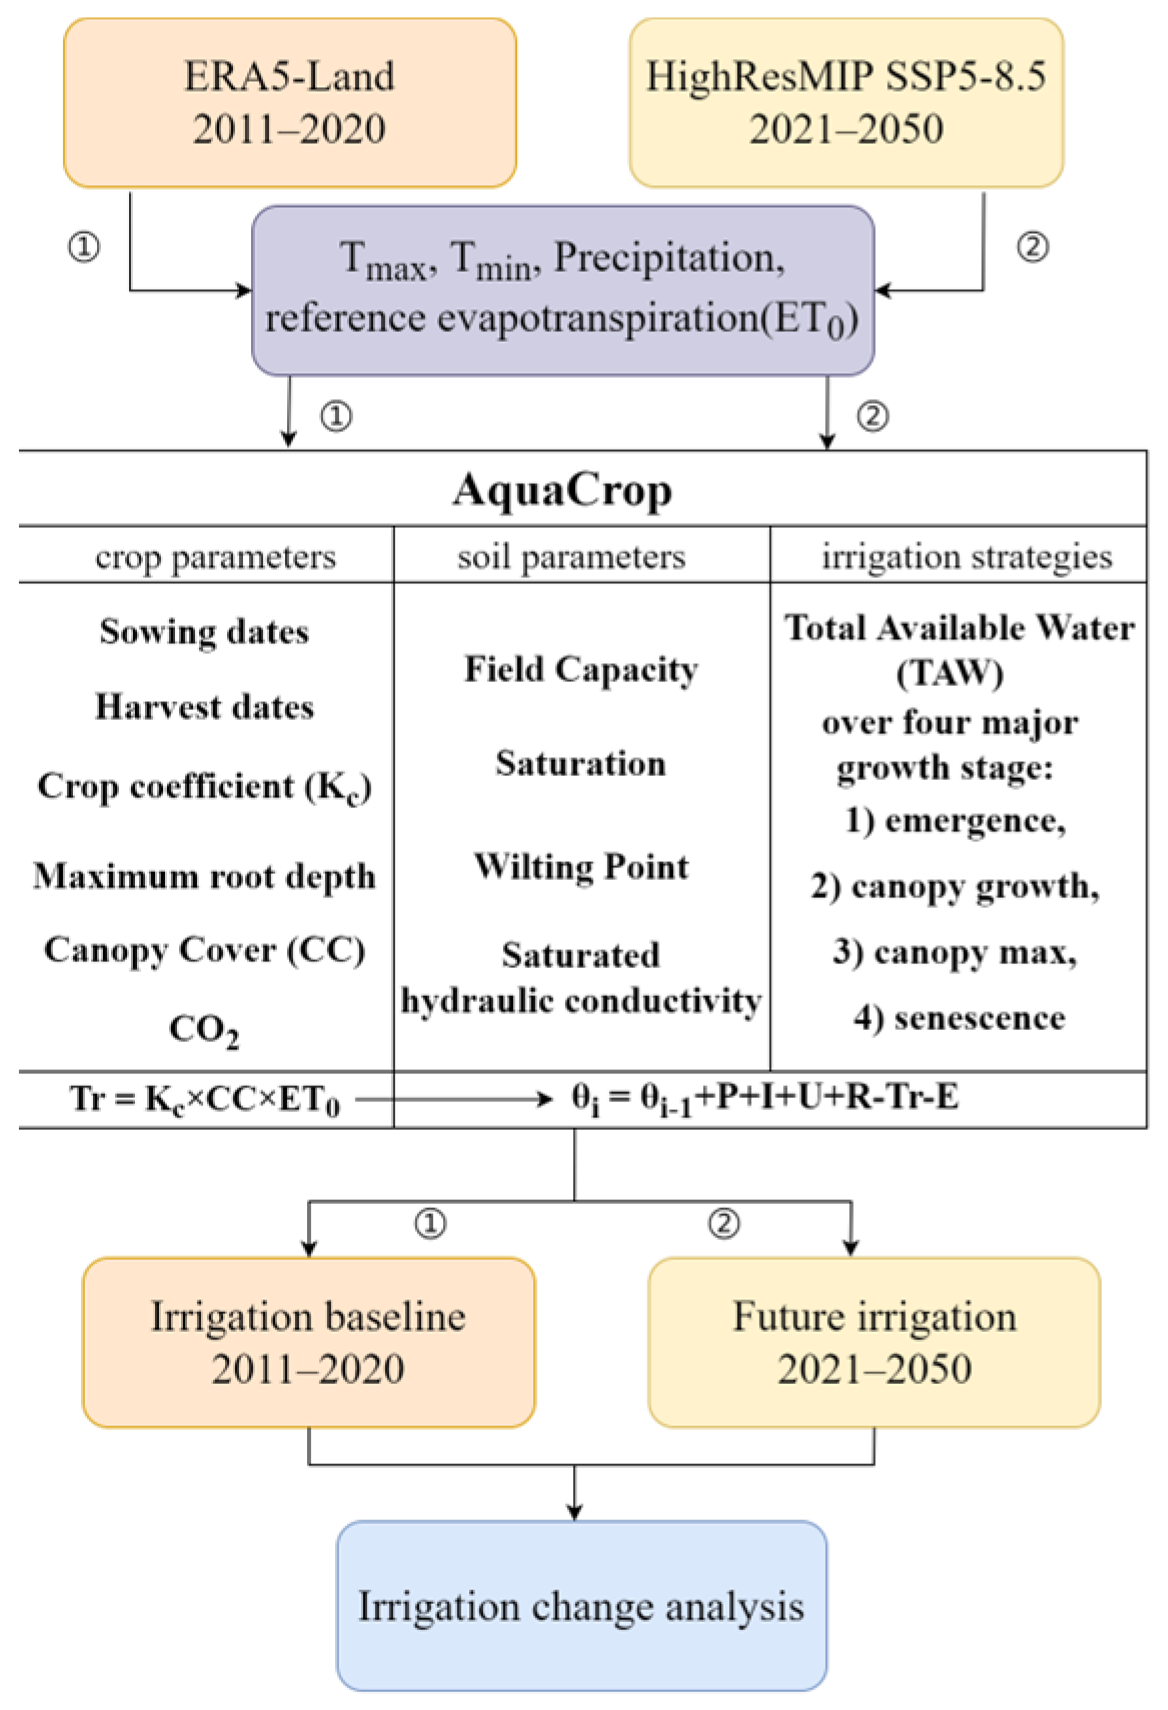
2.3. AquaCrop Simulation

AquaCrop is a water-driven crop growth model developed by the Food and Agriculture Organization (FAO). Specifically, the AquaCrop model simulates the yield response of herbaceous crops to water and is particularly well suited to conditions in which water is a key limiting factor in crop production [61,62]. This is the main reason we chose the AquaCrop model in this study. Figure 2 depicts the flow chart of this study. In general, the AquaCrop simulation can be divided into two parts: one is driven by the ERA5-Land reanalysis data from 2011 to 2020, and the other is driven by the three future climate projections from 2021 to 2050. Specifically, the former is not only to produce the irrigation baseline but also to evaluate the performance of the AquaCrop model via SM because the change in SM can directly reflect irrigation.
To run the AquaCrop model, daily reference evapotranspiration (ET0) was estimated using the Penman–Monteith equation, where ERA5-Land reanalysis and future climate datasets [63]. In addition, soil parameters, crop parameters, and irrigation schemes should be determined for the AquaCrop model. For soil parameters, the volumetric soil water content at saturation (θS), field capacity (θFC), permanent wilting point (θPWP), and saturated hydraulic conductivity (KSat) were calculated from a physical-based soil hydraulic function [64]. Figure 3 depicts the spatial distribution of these soil parameters over the study region. Except for these, a total soil profile depth of 1.6 m was defined, as the maximum rooting depth of summer maize and winter wheat is about 1.2 m and 1.6 m, respectively [50]. For crop parameters, we adjusted the sowing dates of winter wheat and summer maize according to prior knowledge [20,32,65] and kept other parameters as default by FAO in the AquaCrop model. Specifically, the sowing dates for winter wheat and summer maize were set as 15 October and 15 May, respectively. The CO2 concentration was also considered in the AquaCrop simulation following the method proposed by Meinshausen et al. [66]. Table 2 shows the crucial parameters in the AquaCrop simulations regarding crop growth. In addition to the soil and crop parameters, management practices, including soil fertility, mulches, and weed management, were set as the default mode in AquaCrop simulation due to the lack of such information on the regional scale. Readers can refer to the manual of the AquaCrop model for further information [61]. In general, these default settings would not affect the assessment of net irrigation needs under future climate projections because they are kept unchanged in simulation. Regarding irrigation schemes, Table 3 provides detailed irrigation strategies for both winter wheat and summer maize at different growth stages. Specifically, for each growth stage, the target of irrigation is to maintain the SM content at the corresponding thresholds. For each growth stage, the threshold of total available water (TAW) can be found in the previous literature [16,67].
With the exception of the aforementioned setting of the AquaCrop model simulation, two major assumptions were made to decrease the uncertainty. The first is that the irrigated region was assumed to be unchanged, which can avoid the need to estimate the future hypothetical land use and the uncertainty of the extent of irrigated areas [68,69]; the other is that constant dates of the start and end of the growing season were used, because a dynamic growing season may decrease the comparability of future and baseline irrigation [42].
In the present study, the four metrics of the Pearson correlation coefficient (R), bias, root mean square difference (RMSD), and unbiased RMSD (ubRMSD) were used to evaluate the performance of the AquaCrop simulation via SM. The four metrics can be written as follows:
R = n = 1 N x n x ¯ y n y ¯ n = 1 N x n x ¯ 2 n = 1 N y n y ¯ 2
b i a s = 1 N n = 1 N x n y n
R M S D = 1 N n = 1 N x n y n 2
u b R M S D = R M S D 2 b i a s 2
where x is the AquaCrop-derived SM, y is the reference SMCI data, N is the total number of the AquaCrop simulations, x ¯ and y ¯ are the temporal mean of x and y.

3. Results

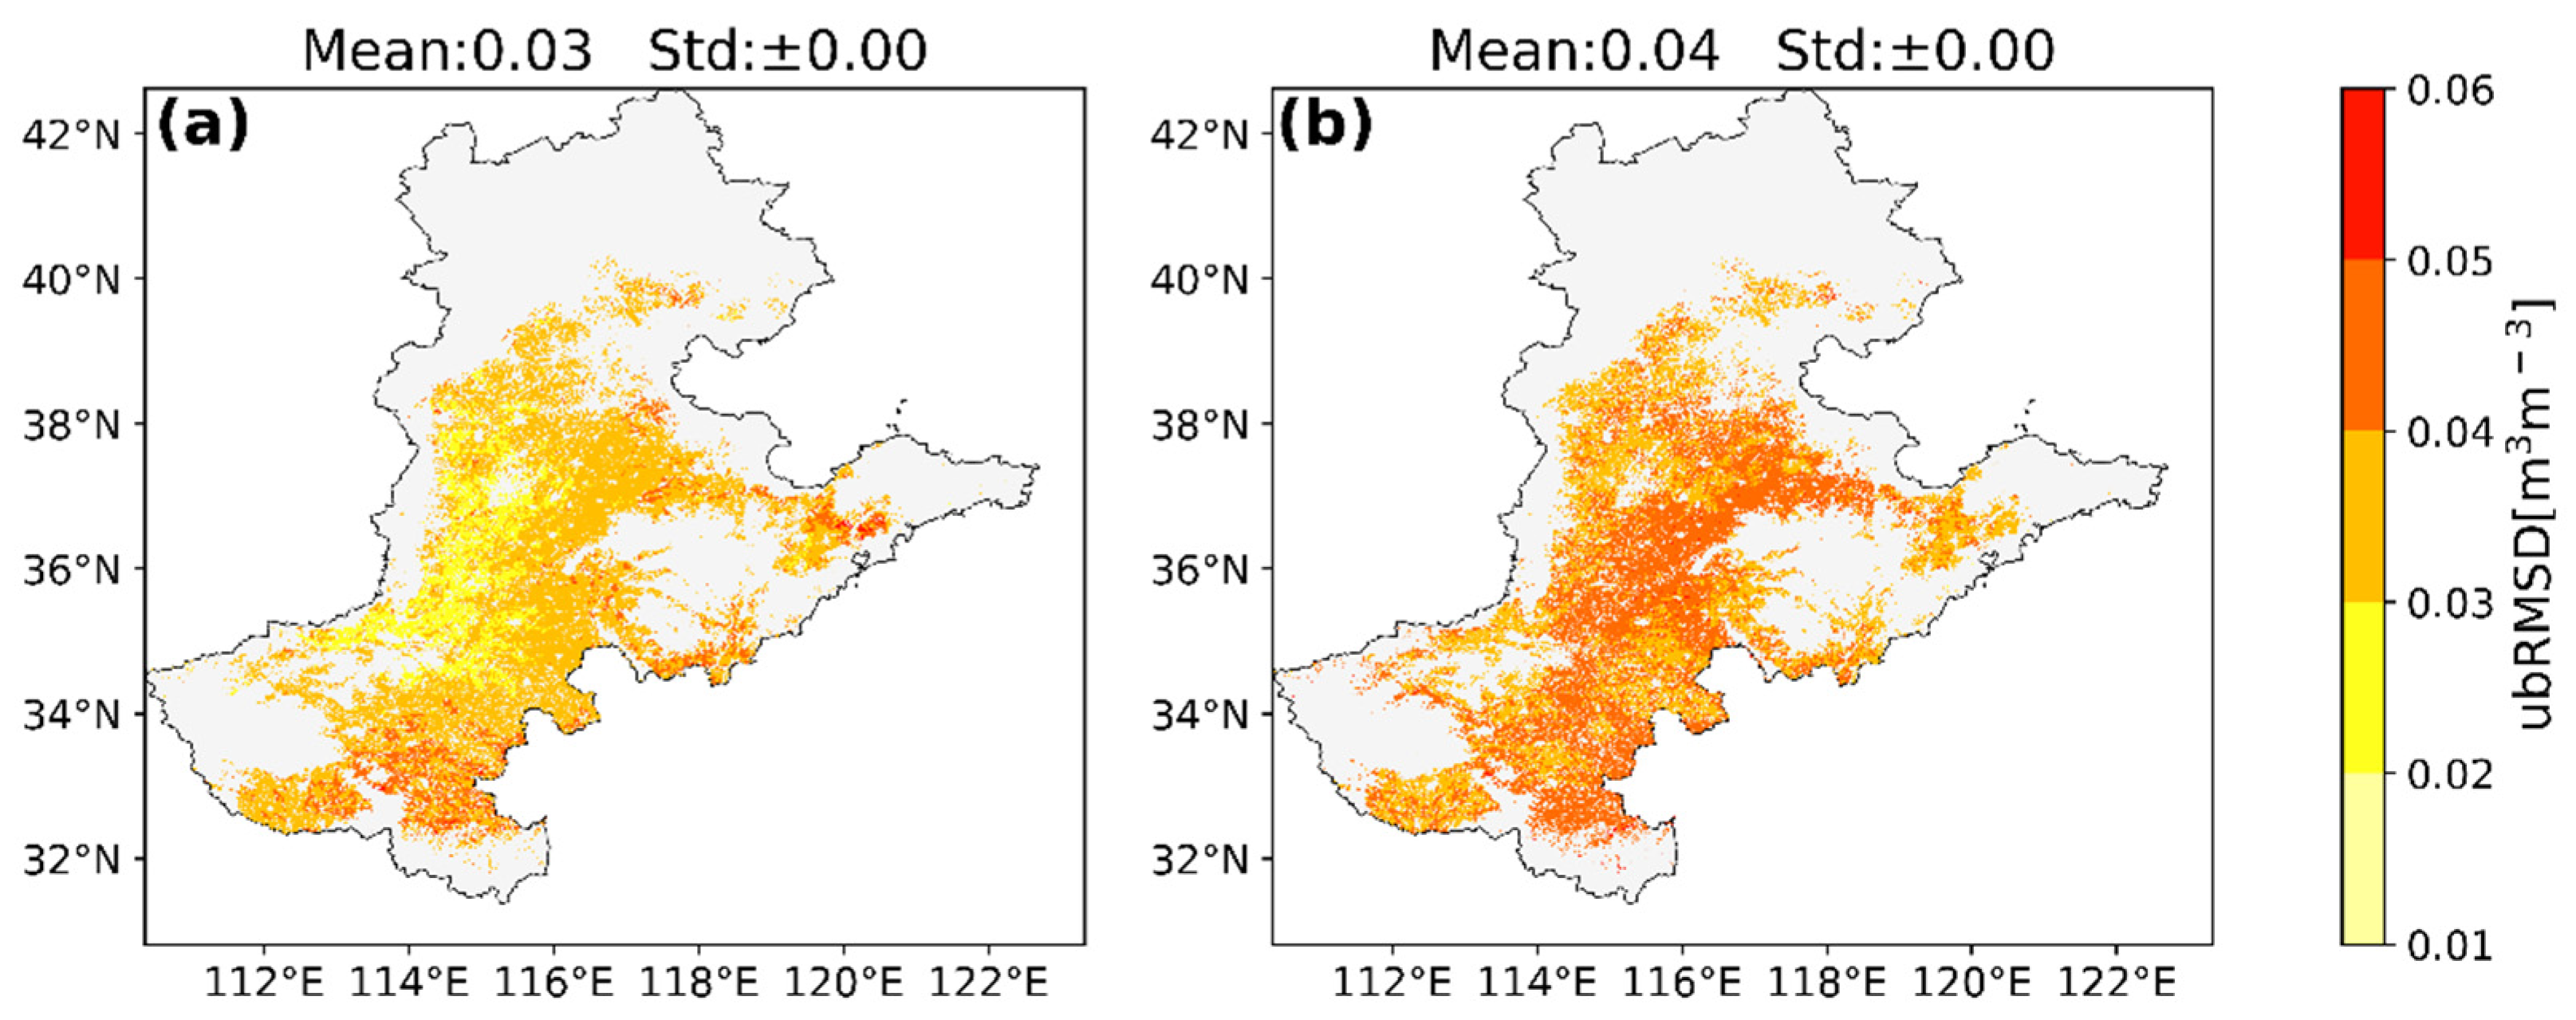
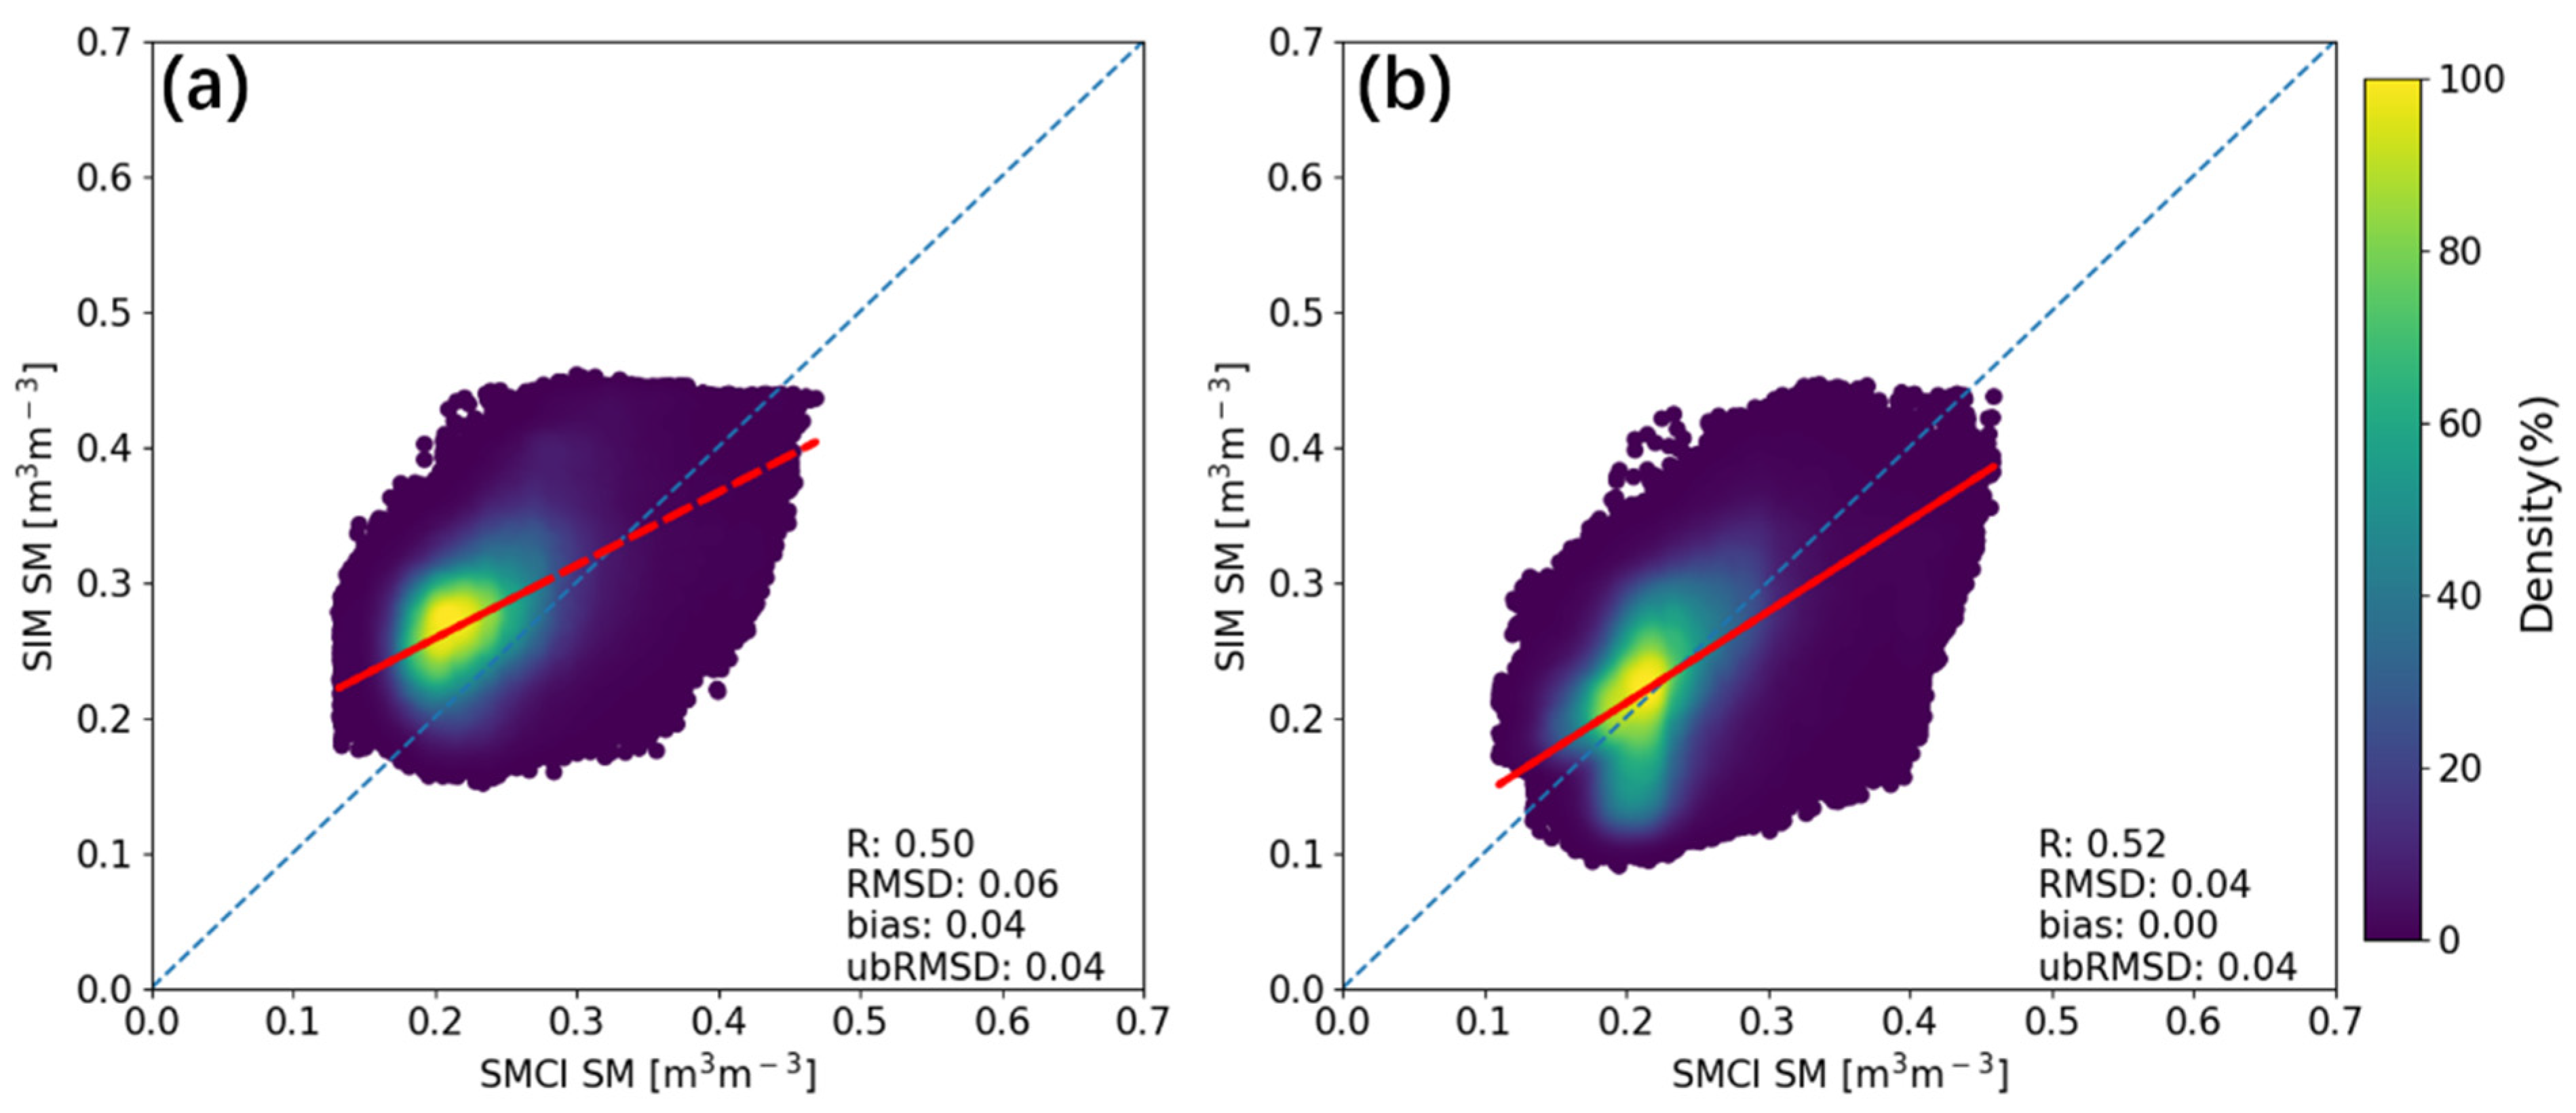
3.1. Performance of the AquaCrop-Derived SM

Because SM is one of the most significant variables associated with irrigation in the AquaCrop model, it is reasonable to assess the skill of the AquaCrop simulations by SM. In the present study, the AquaCrop SM simulations forced with ERA5-Land reanalysis data under the irrigation strategy shown in Table 3 were evaluated with SMCI SM data during the baseline period from 2011 to 2020. The spatial distribution of ubRMSD for the summer maize and winter wheat growth periods is presented in Figure 4. It is obvious that the comparable accuracy with mean ubRMSD of 0.03 m3/m3 and 0.04 m3/m3 was obtained for summer maize and winter wheat, respectively.
To further illustrate the performance of the AquaCrop-derived SM, Figure 5 presents the spatiotemporal skill metrics comparing the AquaCrop-derived SM and SMCI data for all pixels over the study period. Following the results, although the phenomenon of slight overestimation and underestimation when the SM was lower or higher can be found in both summer maize and winter wheat growing periods, the two SM datasets still revealed relatively high agreements with correlation coefficients of 0.50 and 0.52, respectively. Moreover, an unbiased RMSD of 0.04 m3/m3 can be found for the two crops. Specifically, this RMSD level has reached the benchmark as a quality measure for SM predictions in agricultural applications. These results confirmed that the AquaCrop model forced by ERA5-Land reanalysis has a reasonable performance regarding SM simulation over the study region, which can guarantee the estimation of irrigation requirement since SM is the main factor for the determination of irrigation strategy in the AquaCrop model.

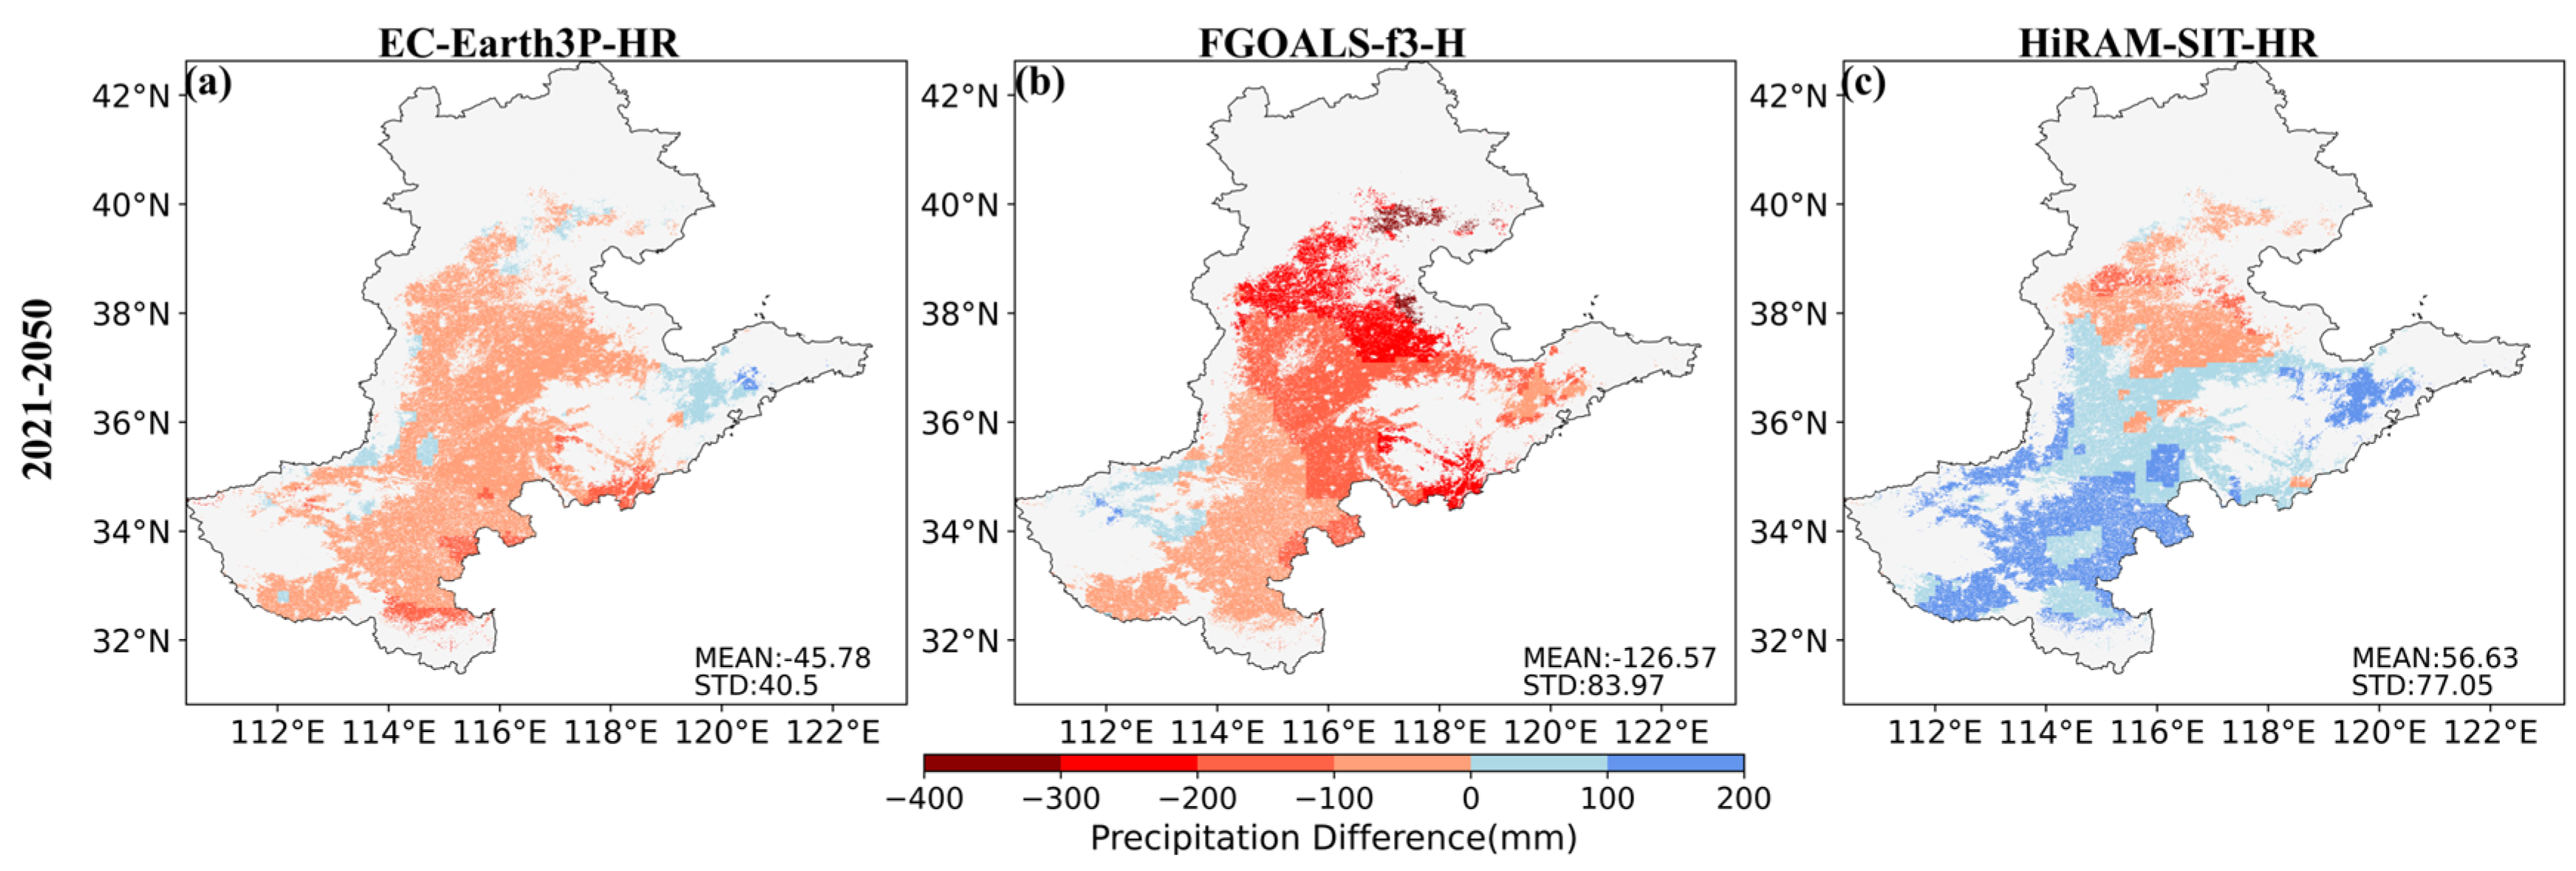
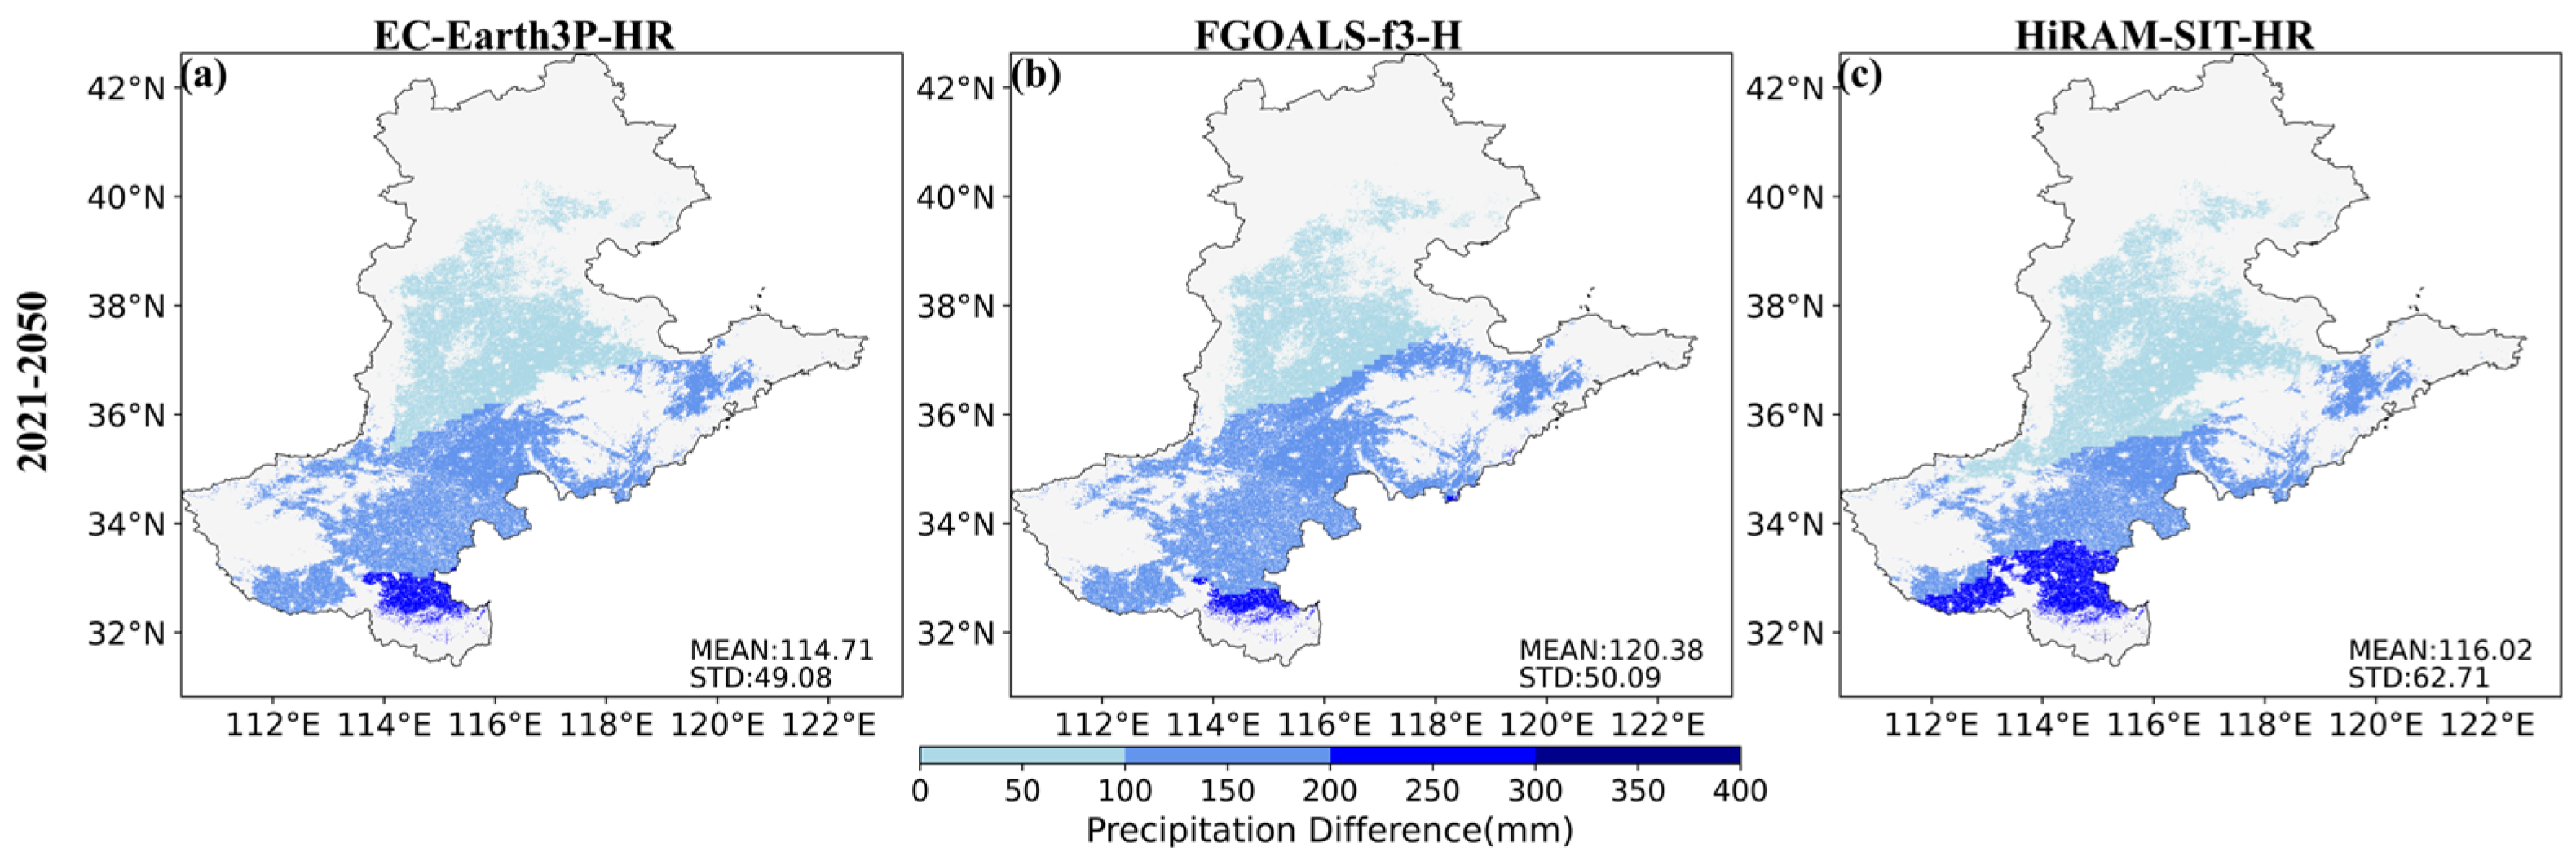
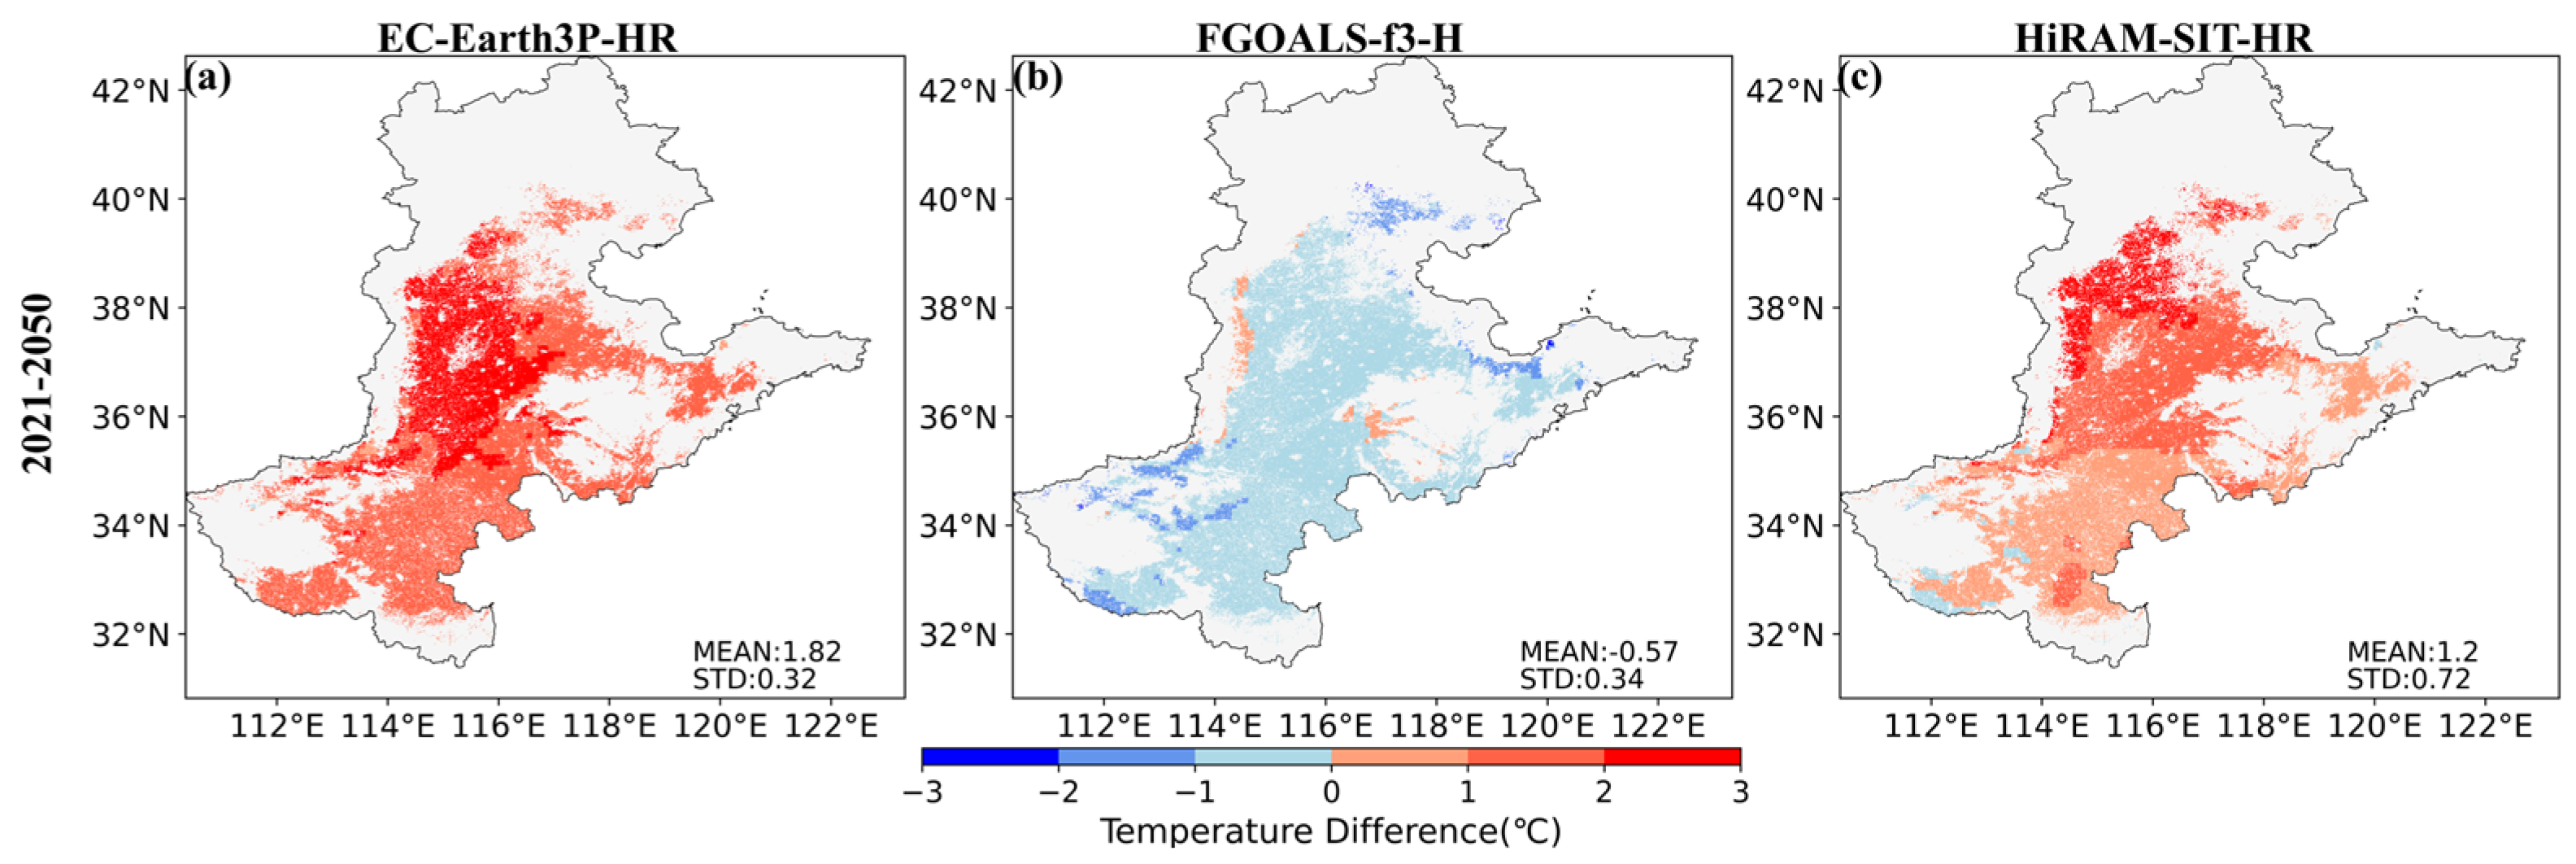
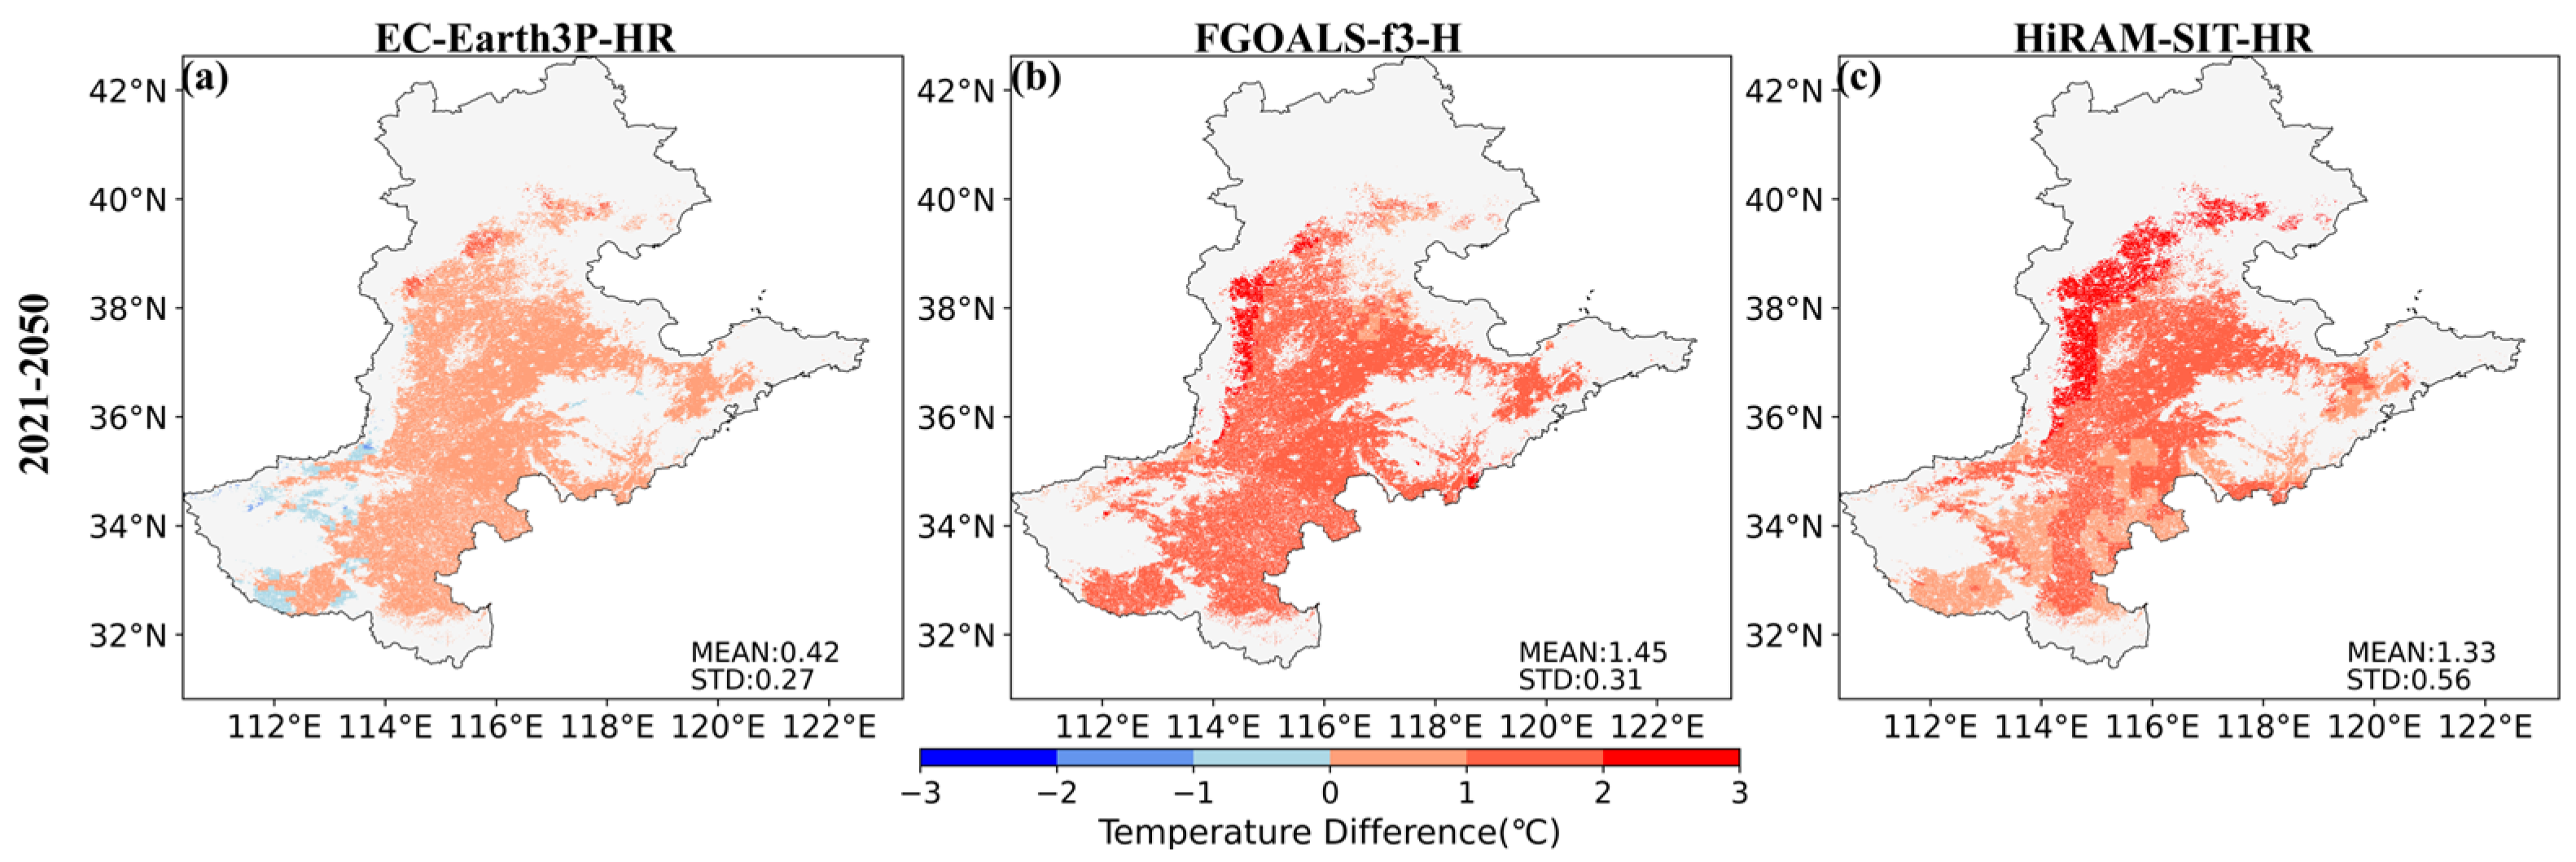
3.2. Comparison of Future Climate Data

Air temperature and precipitation are two pivotal variables in future climate datasets, which are associated with the water balance in soils via evapotranspiration and infiltration, respectively. Hence, the accuracy of air temperature and precipitation in future climate datasets would directly affect simulations of SM and the prediction of irrigation requirements in the AquaCrop model. Figure 6 depicts the difference in average precipitation over the 2021–2050 period and baseline precipitation during the summer maize period. According to the FGOALS-f3-H and EC-Earth3P-HR, the precipitation during the summer maize growth period will decrease substantially in the future (Figure 5a,b), and it will decrease more in the northern part of the NCP under FGOALS-f3-H. The HiRAM-SIT-HR shows an increase around most parts of the NCP but the same decrease as EC-Earth3P-HR in the northern part.
Figure 7 shows the difference between average precipitation over the 2021–2050 period and baseline precipitation during the winter wheat period. Unlike those in the summer maize period, the three future climate datasets reveal better consistency in the study region. The precipitation of the winter wheat growth period will increase over the NCP under all future climate datasets, which may lead to a lower irrigation amount of winter wheat because the precipitation replenishes the loss of water in the soil according to the soil water balance.
Air temperature also varies among the three future climate datasets. In the maize growth period, air temperature shows an increase over the NCP under the climate future datasets, except for FGOALS-f3-H. FGOALS-f3-H shows a spatial mean decrease of −0.57 °C over the study area. The EC-Earth3P-HR shows the highest mean increase of 1.82 °C over the three climate datasets (Figure 8). The HiRAM-SIT-HR shows an increase over most parts of the study area but a decrease at the southern edge of the study area. However, air temperature in the winter wheat growth period shows a regular distribution among the three future climate datasets (Figure 9). Air temperature rises over the NCP and only has a decrease in the southeast edge under EC-Earth3P-HR, which may result from the bias of climate projection. The results above present an obvious difference in air temperature and precipitation between the summer maize and winter wheat, which may contribute to the discrepancy in irrigation requirements under future scenarios.

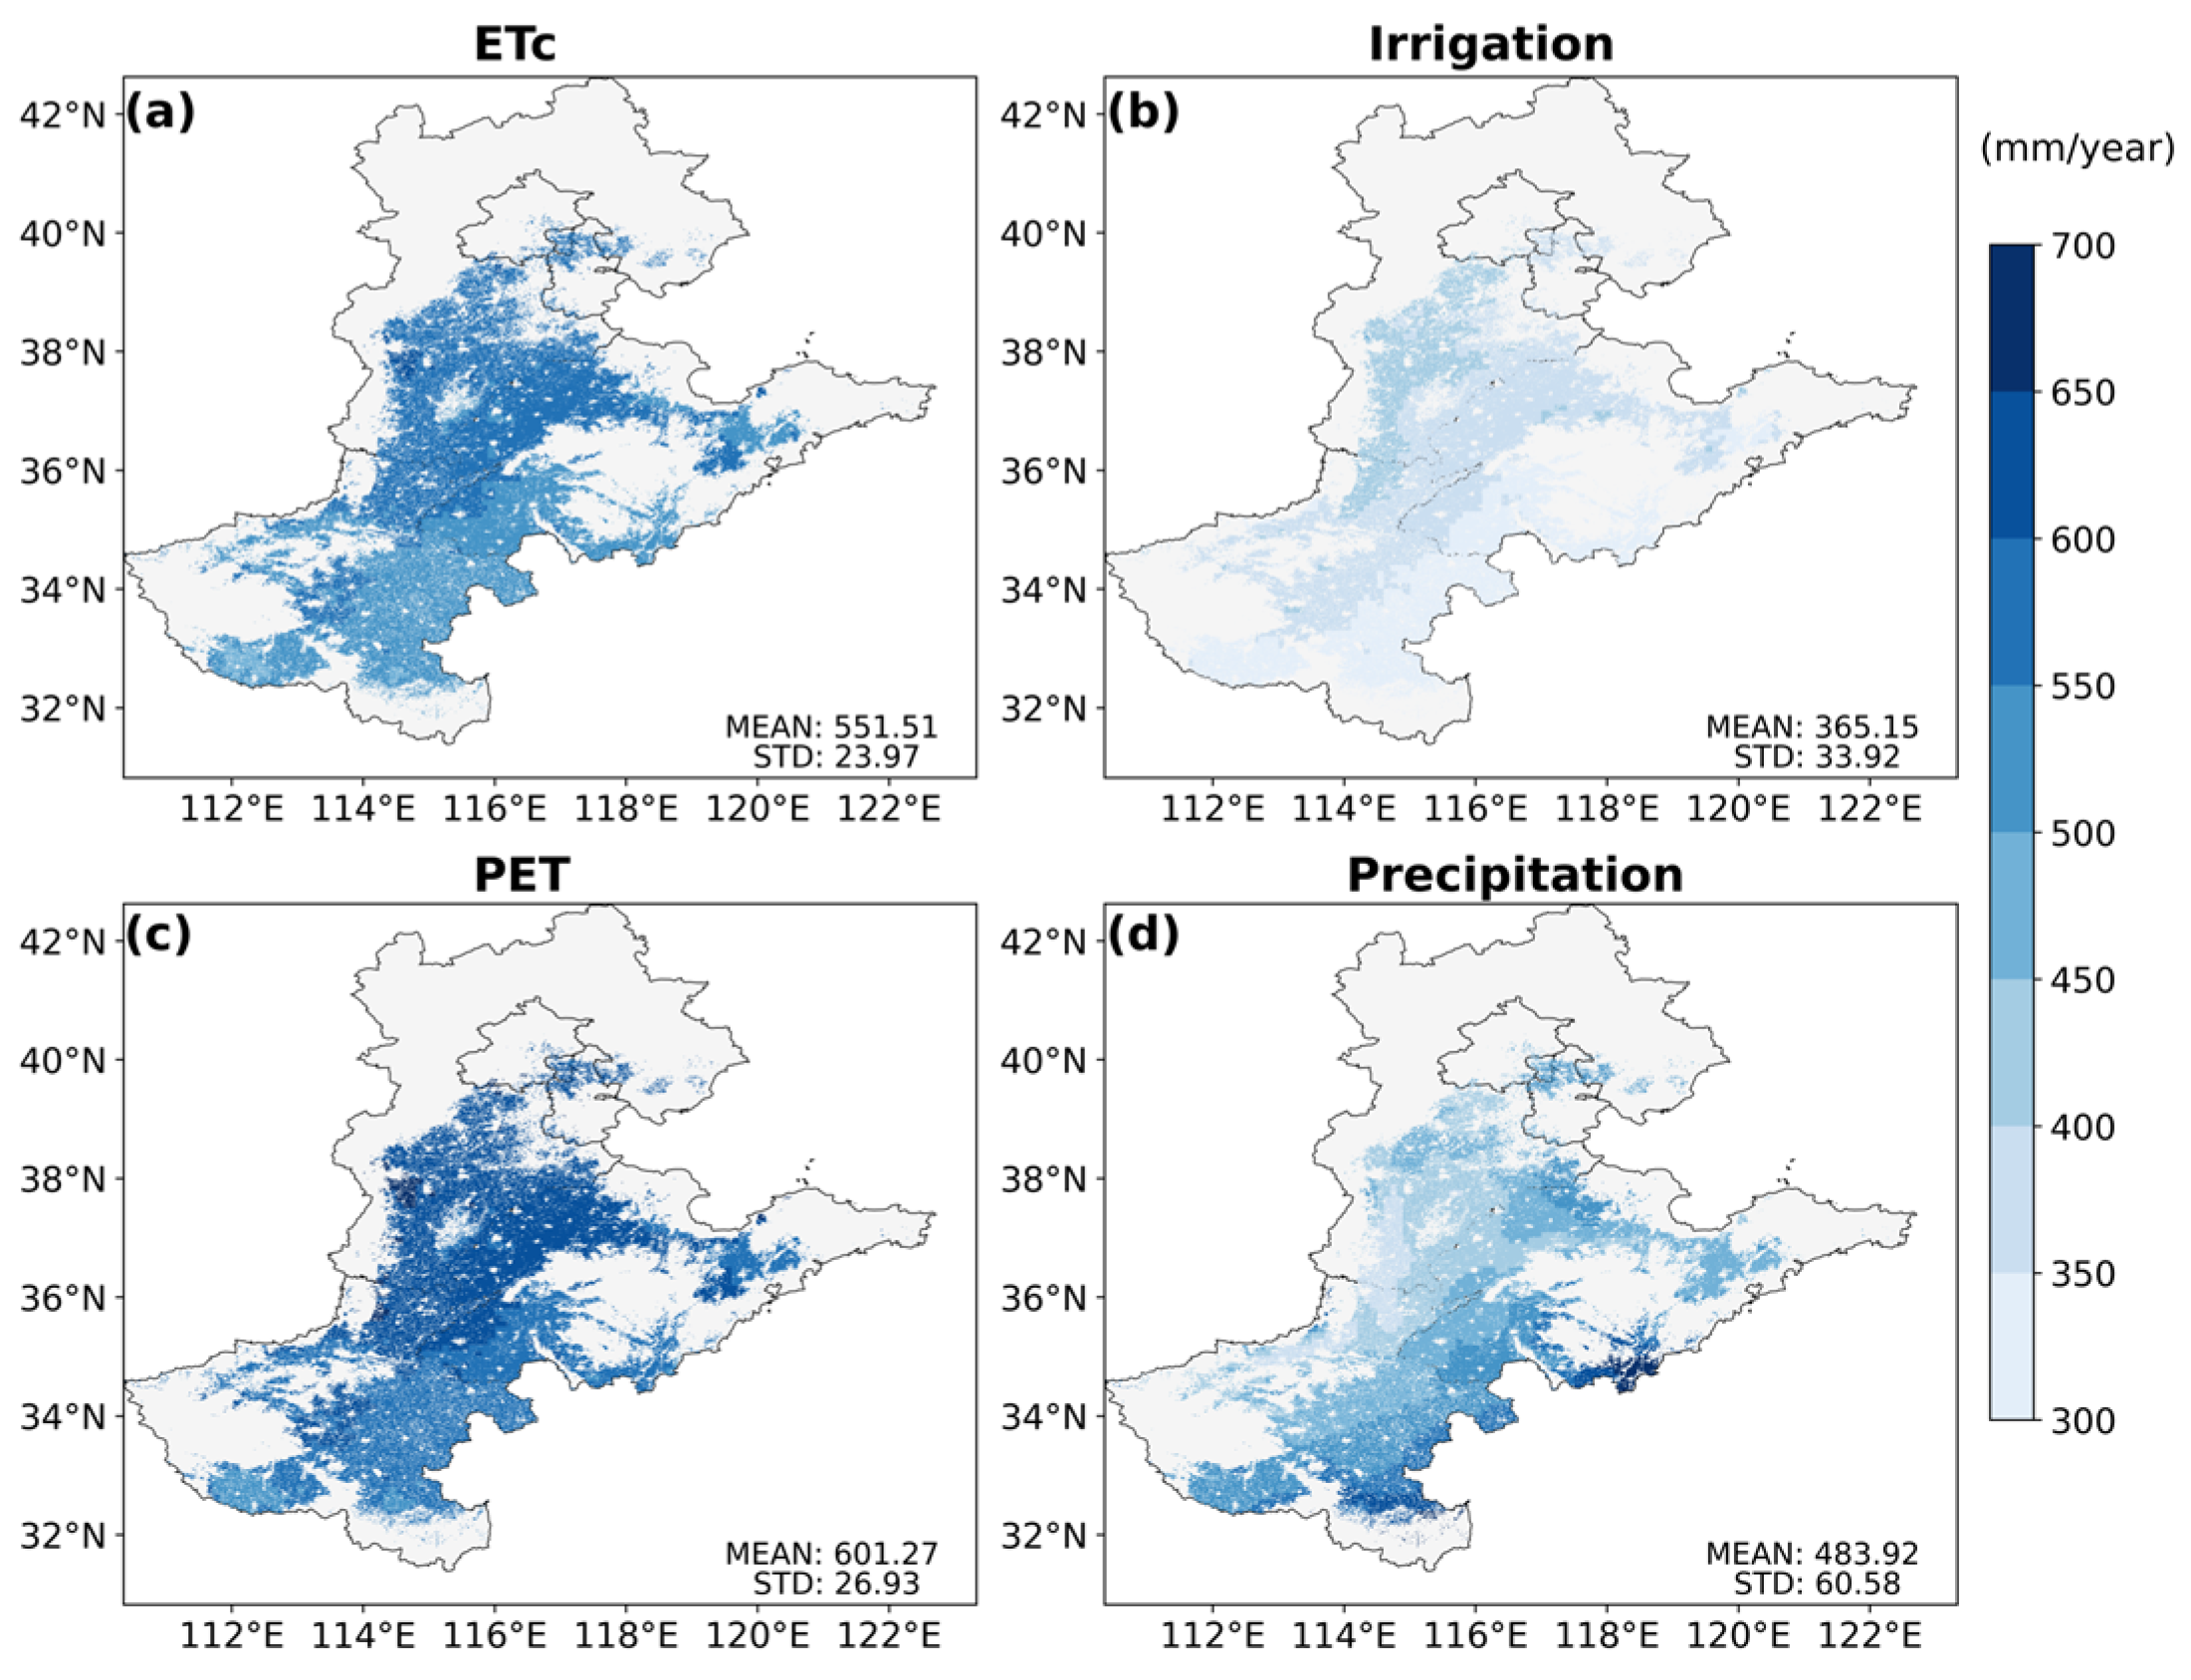
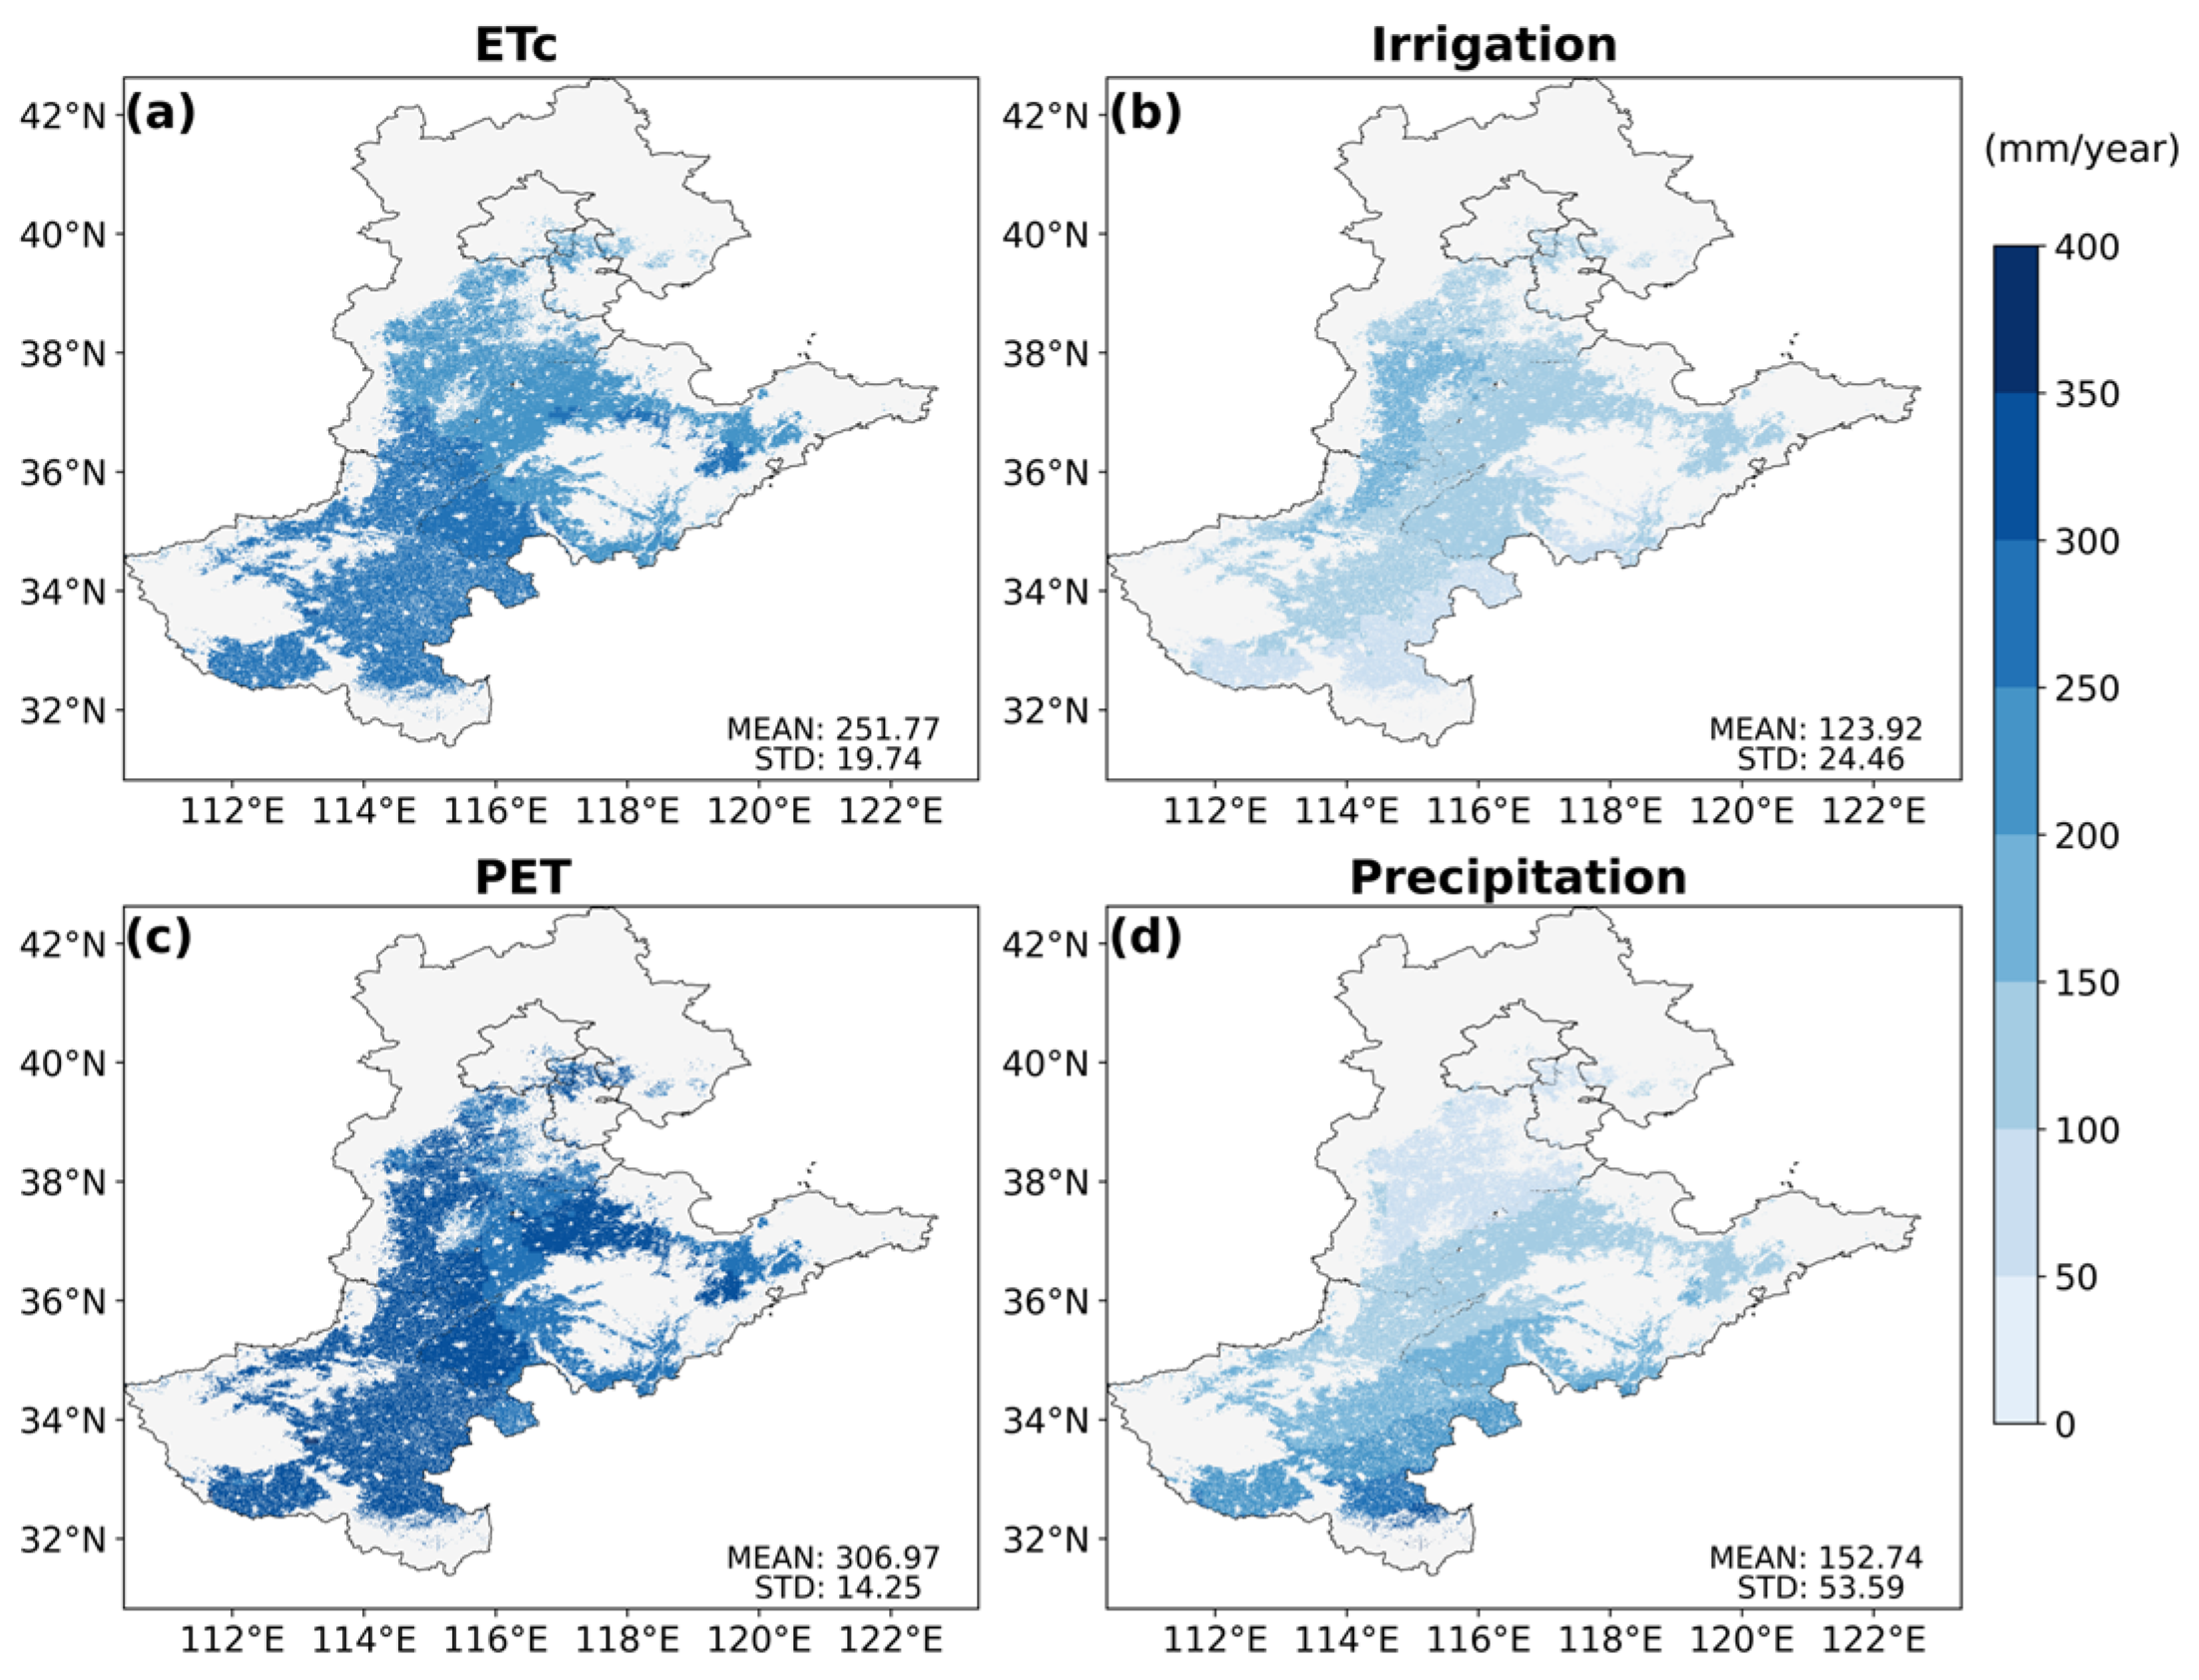
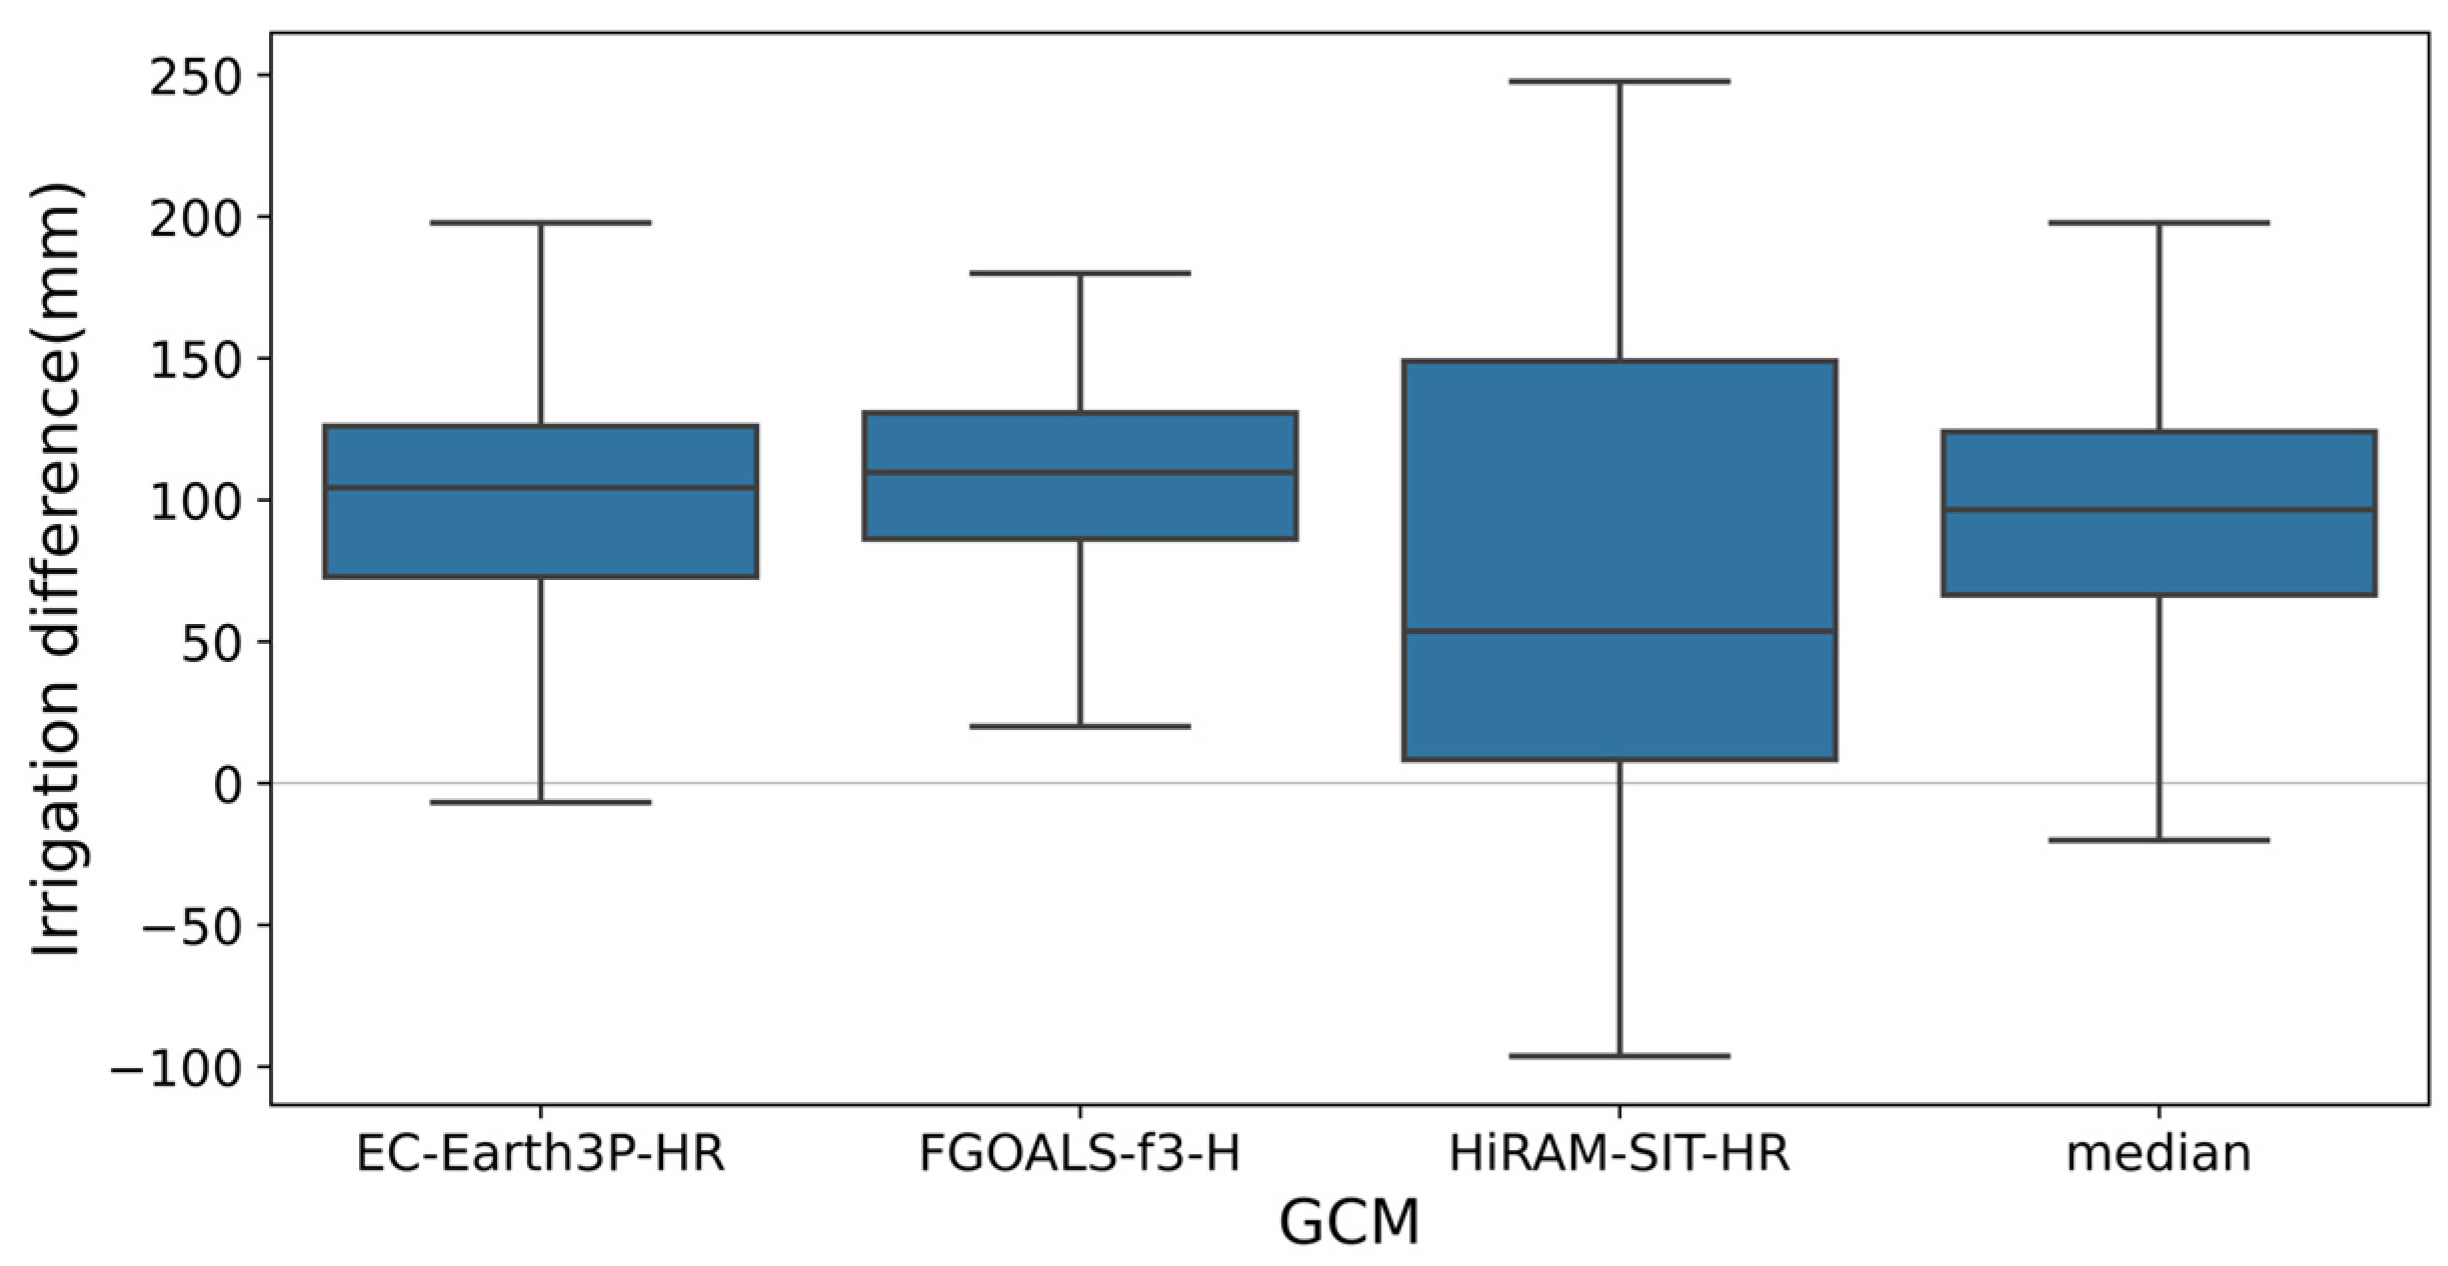
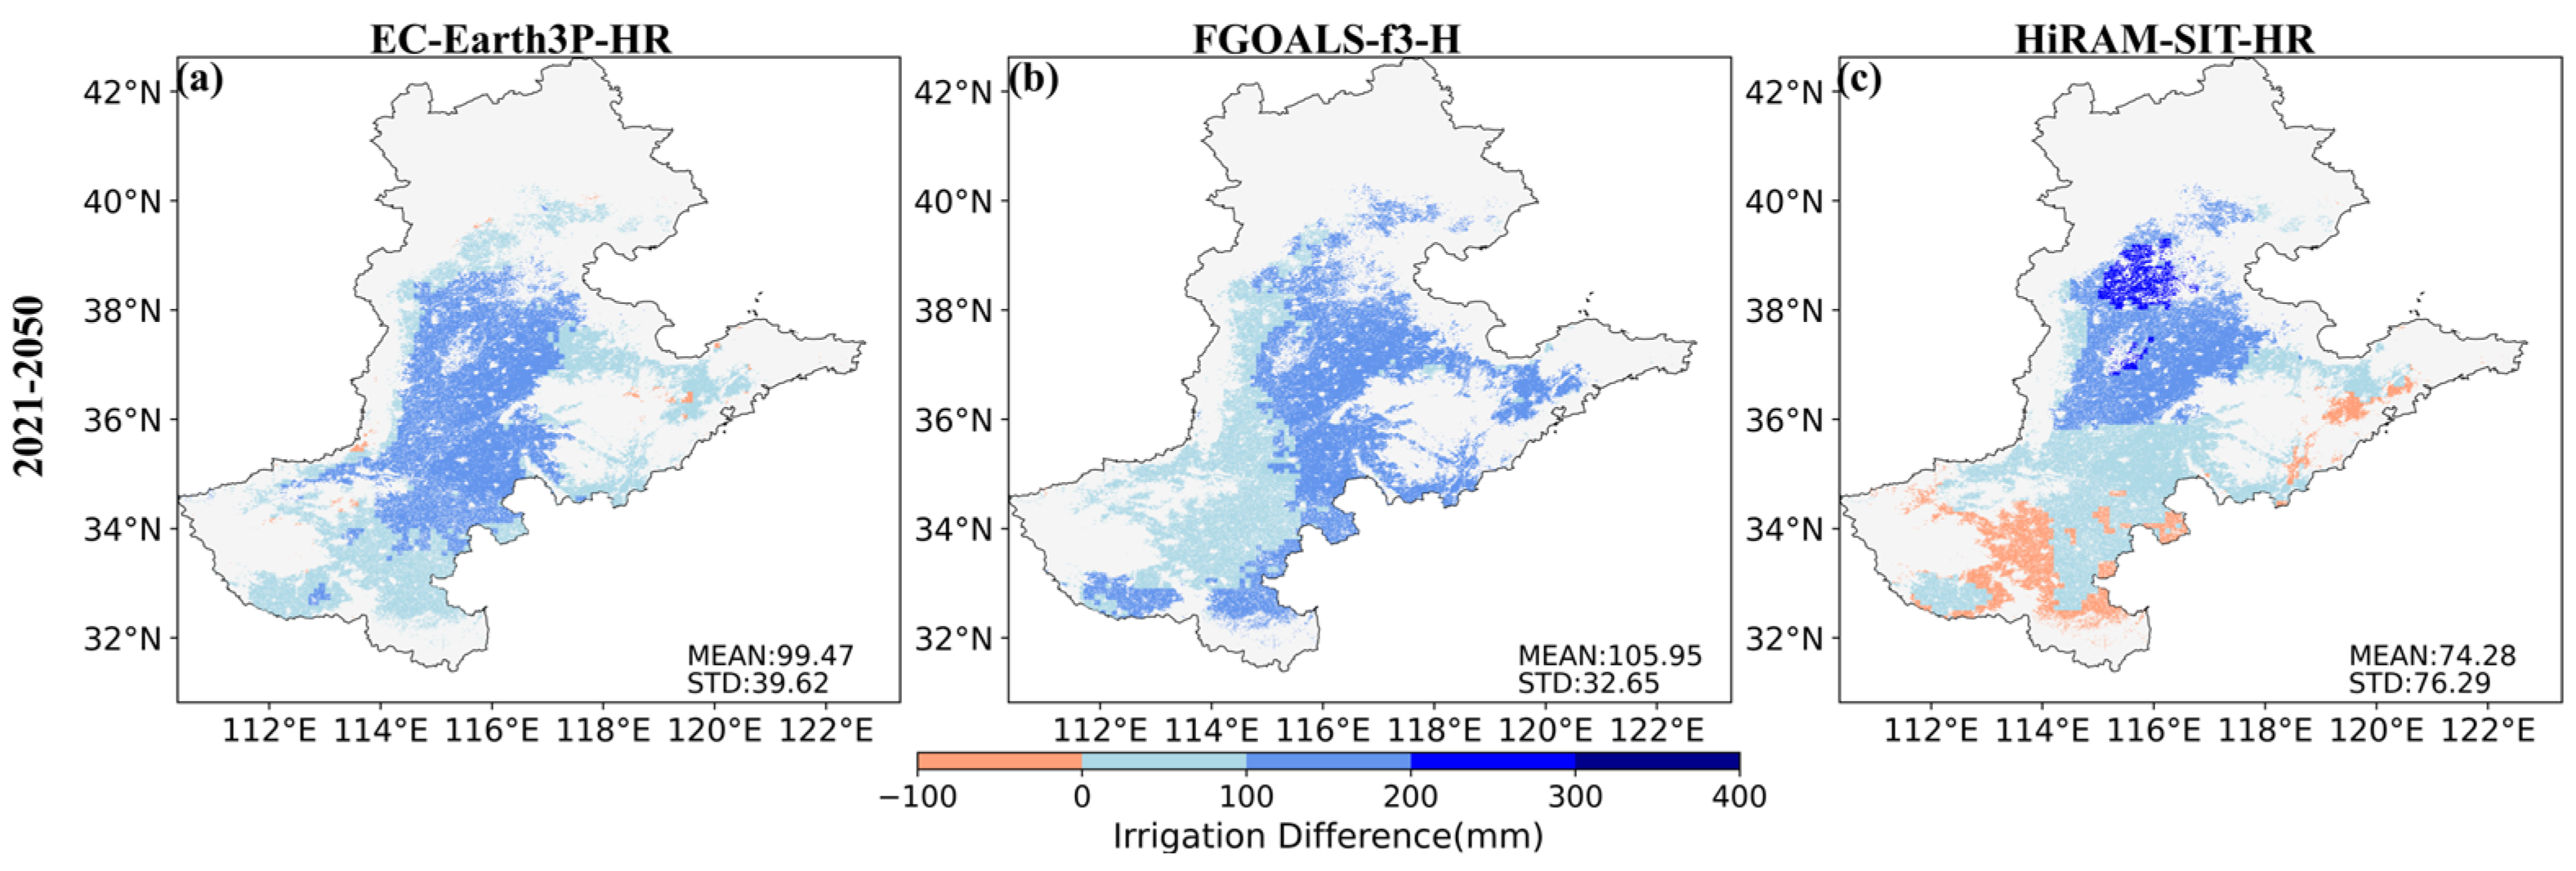
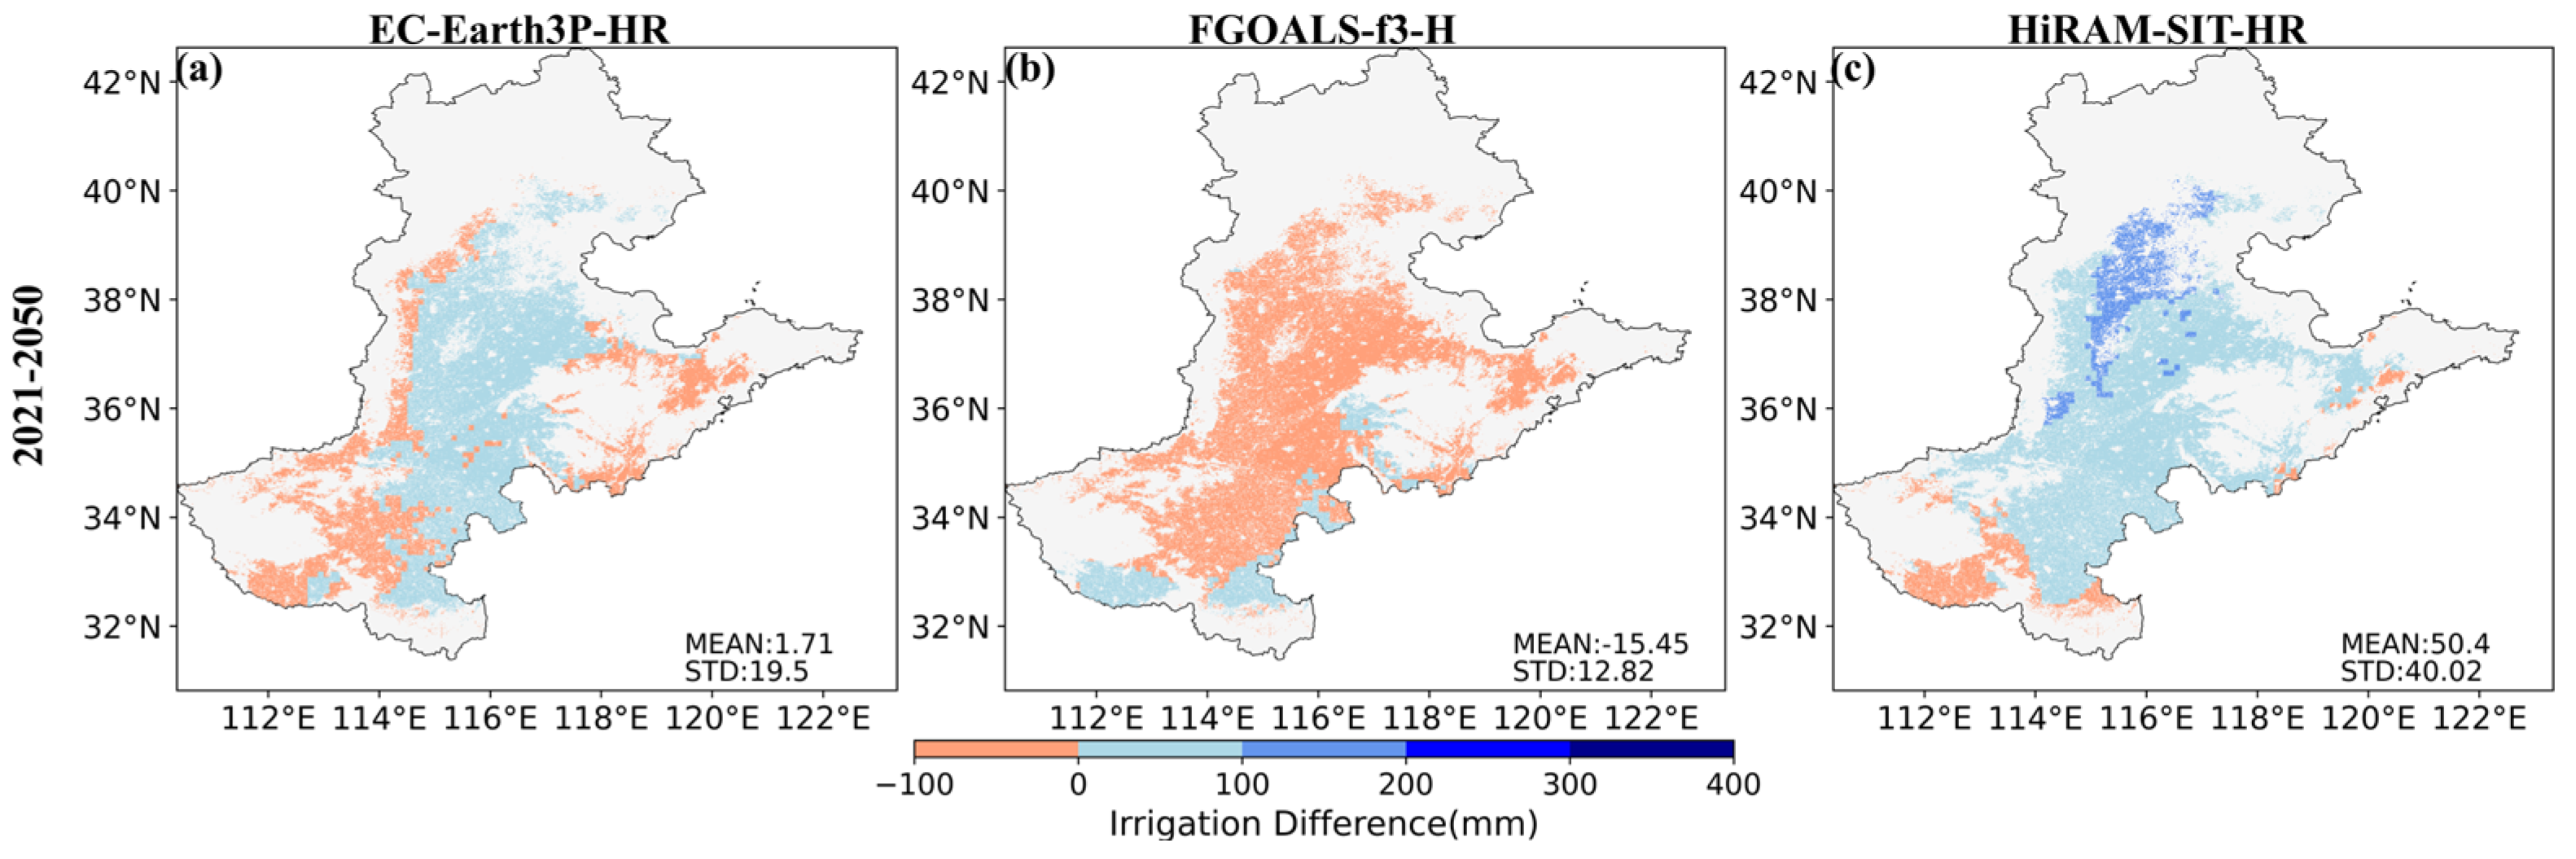
3.3. Irrigation Requirements for Summer Maize and Winter Wheat

Figure 9 and Figure 10 show the basic information related to irrigation. Figure 10 shows the spatial distribution of mean precipitation, mean potential crop evapotranspiration (PET), mean actual crop evapotranspiration (ETc), and mean irrigation amount during the summer maize growth period at baseline. Specifically, PET and the ETc present a regulation of higher value in the southern part and lower value in the study region. Meanwhile, the precipitation is unable to compensate for the lost water due to evapotranspiration, which results in a higher irrigation amount in the northern part of the study region. Similarly, the basic information related to irrigation during the winter wheat growth period at baseline is shown in Figure 11. It is obvious that the values of these variables are lower than those of the summer maize growth period, which may be due to the difference between summer and winter.
Based on the AquaCrop-derived SM over the baseline period (2011–2020), the irrigation requirement for this period was obtained as the baseline irrigation. Figure 12 shows the differences between the annual mean irrigation requirement in future climate projections (2021–2050) and the baseline irrigation requirement (2011–2020) for summer maize. It is obvious that increased irrigation water can be found in the three future climate scenarios. Specifically, compared to a value of approximately 50 mm under the HiRAM-SIT-HR, the other two future climate projections (EC-Earth3P-HR and FGOALS-f3-H) required much more irrigation water of ~100 mm. Moreover, significant variation also appeared for the HiRAM-SIT-HR, indicating that a considerable discrepancy may exist between HiRAM-SIT-HR and the others. One of the main reasons for this may be the consideration of SST for the HiRAM-SIT-HR.
The spatial distribution of irrigation differences in summer maize is shown in Figure 13. Under EC-Earth3P-HR and FGOALS-f3-H, extra irrigation water was required in most pixels under SSP8-8.5, and the center part of the study region was expected to have more extra irrigation water than the surrounding regions. Significant irrigation requirements can also be found in the center part of the study region under HiRAM-SIT-HR. However, across the coastline of the eastern part and the southern parts of the NCP region, a decreased irrigation requirement was found.
Similarly, the differences between the annual mean irrigation requirement under the three future climate projections and the baseline irrigation requirement for winter wheat are shown in Figure 14. Following the results, it is evident that irrigation requirements varied very differently across the three future climate scenarios from 2021 to 2050. Specifically, there was a significant increase of approximately 50 mm under HiRAM-SIT-HR. However, the EC-Earth3P-HR required only a slight increase of approximately 5 mm of irrigation water, and the FGOALS-f3-H had a decrease of about 10 mm of irrigation requirements. Moreover, the HiRAM-SIT-HR still presented a relatively higher variation compared with the other two future climate projections. Based on the results from summer maize and winter wheat, the median net irrigation requirement is expected to increase by approximately 107 mm (21%) in future climate scenarios.
Figure 15 shows the spatial distribution of irrigation differences in winter wheat between future requirements and the baseline. It is obvious that an increase in irrigation water was required in most parts of the study region under the EC-Earth3P-HR and HiRAM-SIT-HR. Specifically, the EC-Earth3P-HR required less amount of additional irrigation water compared to the HiRAM-SIT-HR, and the HiRAM-SIT-HR required more irrigation water in the northern part of the study region. Compared with EC-Earth3P-HR and HiRAM-SIT-HR, except for a small part in the south of the NCP region, a decreased irrigation requirement can be found under FGOALS-f3-H over the study region. This is completely different from the other two future climate projections.

4. Discussion

The present study mainly assessed the net irrigation requirement in typical summer maize–winter wheat rotation farmlands under future climate scenarios using AquaCrop simulations. The investigation was conducted based on three future climate projections. Compared to the baseline net irrigation need, an increased net irrigation amount of approximately 107 mm (approximately 21%) was required to maintain yield production over the NCP region. The findings of this study agreed well with those of previous studies in the last two decades, which confirm an increase in irrigation requirements over the study region in future climate scenarios [70,71]. Specifically, Shirazi et al. [70] found a total change in the water budget of approximately −101 mm in 2020–2050 under RCP8.5, suggesting an increased irrigation requirement of 101 mm. Xing et al. [71] found a 25% increase in irrigation requirement in the winter wheat growth period under RCP8.5 in NCP. Another finding of the present study is that significant discrepancies may exist in future climate data, which would directly affect AquaCrop simulations. As for the three future climate data, air temperature increased by around 1.2 °C in 2021–2050, but the precipitation decreased by around 100 mm in the summer maize growth period and increased by around 115 mm in the winter wheat growth period. This spatial heterogeneity of future climate projections can also be found in previous studies [32,65]. Nevertheless, compared to existing investigations, the advantages of the present study mainly appear in two aspects: one is that climate data with a relatively high spatial resolution (~0.1°) was considered over the study region, whereas most of the previous literature mainly used either coarse (~0.5°) climate data or only conducted at local sites. From this perspective, the present study can be regarded as an attempt at the intermediate between these two spatial scales, which also provides a direction for obtaining finer irrigation (kilometer or farmland scale) information in future developments. The other actual summer maize–winter wheat rotation was considered in the present study, which is more in accord with the actual planting pattern over the study region.
Nevertheless, the present study also has several limitations. First, this study mainly focused on the irrigation requirement affected by future climate scenarios and did not consider the influence of climate changes on the characteristics of crop growth (e.g., start of growing season, end of growing season, and length of growing season). However, previous studies have highlighted that increased air temperature may shorten the crop growth period and decrease the irrigation requirement [72]. In addition, due to the complicated interaction between land use/land cover and climate change, the present study mainly investigated the effects of climate change on irrigation. Possible land use/land cover change was also not considered in the present study [68]. With the developments of satellite-based phenological parameters and future land use/land cover datasets under future climate conditions, irrigation based on AquaCrop and other models is possible to avoid extra uncertainty from the input variables. Finally, unlike most of the simulation studies over large regions (e.g., global, continent, or major countries like China and the U.S.), the present study focused on one of the major agricultural production bases of the NCP region as the study area. Although the NCP region can provide approximately half of wheat and one-third of the maize production in China, with the successful experience over the study region, further studies can explore the assessment of irrigation amount over a larger region. This is particularly significant because China has long been suffering from a crisis of water resources.

5. Conclusions

In the present study, the AquaCrop model with HighresMIP meteorological forcing at a spatial resolution of 0.1° was used to assess future changes in irrigation needs over the NCP. Specifically, the performance of the AquaCrop model simulation regarding irrigation was assessed by SM. Compared to the reference SM product, AquaCrop-derived SM revealed considerable ubRMSD of 0.03 m3/m3 and 0.04 m3/m3 over the summer maize and winter wheat growth period, respectively. The irrigation requirements in future scenarios (2021–2050) were simulated using three different future climate datasets under SSP5-8.5, and it was indicated that an increase in irrigation amount of approximately 21% was required to ensure crop yield production over the study region. These results highlight the impact of climate change on future irrigation demand. This study aims to present the impact of climate change on irrigation requirements over the summer maize–winter wheat rotation system in the NCP. Although the results are compared to the previous literature on the study region, the present study did not consider the change in cropland, details of crop parameters, and actual irrigated areas to avoid more uncertainty. Therefore, the results of this study should be considered as an indication of the potential impact of climate change on the irrigation requirement.

Author Contributions

Conceptualization, Y.W. and P.L.; methodology, Y.W. and P.L.; software, Y.W.; formal analysis, Y.W. and P.L.; data curation, Y.W.; writing—original draft preparation, Y.W. and P.L.; writing—review and editing, P.L. and C.R.; funding acquisition, P.L. All authors have read and agreed to the published version of the manuscript.

Funding

This work was supported by the National Natural Science Foundation of China under grant 42271384 and the Fundamental Research Funds for Central Non-profit Scientific Institution under grant 1610132022010.

Data Availability Statement

The data presented in this study are available on request from the corresponding author due to the large data volume.

Conflicts of Interest

The authors declare no conflicts of interest. The funders had no role in the design of the study; in the collection, analyses, or interpretation of data; in the writing of the manuscript; or in the decision to publish the results.

References

  1. Elliott, J.; Deryng, D.; Müller, C.; Frieler, K.; Konzmann, M.; Gerten, D.; Glotter, M.; Flörke, M.; Wada, Y.; Best, N.; et al. Constraints and potentials of future irrigation water availability on agricultural production under climate change. Proc. Natl. Acad. Sci. USA 2014, 111, 3239–3244. [Google Scholar] [CrossRef] [PubMed]
  2. Fuglie, K. Climate change upsets agriculture. Nat. Clim. Chang. 2021, 11, 294–295. [Google Scholar] [CrossRef]
  3. Piao, S.; Ciais, P.; Huang, Y.; Shen, Z.; Peng, S.; Li, J.; Zhou, L.; Liu, H.; Ma, Y.; Ding, Y.; et al. The impacts of climate change on water resources and agriculture in China. Nature 2010, 467, 43–51. [Google Scholar] [CrossRef] [PubMed]
  4. Taylor, R.G.; Scanlon, B.; Döll, P.; Rodell, M.; van Beek, R.; Wada, Y.; Longuevergne, L.; Leblanc, M.; Famiglietti, J.S.; Edmunds, M.; et al. Ground water and climate change. Nat. Clim. Chang. 2013, 3, 322–329. [Google Scholar] [CrossRef]
  5. IEA. World Energy Outlook 2016; IEA: Paris, France, 2016. [Google Scholar] [CrossRef]
  6. Puma, M.J.; Cook, B.I. Effects of irrigation on global climate during the 20th century. J. Geophys. Res. Atmos. 2010, 115, D16120. [Google Scholar] [CrossRef]
  7. Duffey, A.; Mallett, R.; Irvine, P.J.; Tsamados, M.; Stroeve, J. ESD Ideas: Arctic amplification’s contribution to breaches of the Paris Agreement. Earth Syst. Dynam. 2023, 14, 1165–1169. [Google Scholar] [CrossRef]
  8. Rantanen, M.; Karpechko, A.Y.; Lipponen, A.; Nordling, K.; Hyvärinen, O.; Ruosteenoja, K.; Vihma, T.; Laaksonen, A. The Arctic has warmed nearly four times faster than the globe since 1979. Commun. Earth Environ. 2022, 3, 168. [Google Scholar] [CrossRef]
  9. Sun, S.; Tang, Q.; Konar, M.; Huang, Z.; Gleeson, T.; Ma, T.; Fang, C.; Cai, X. Domestic Groundwater Depletion Supports China’s Full Supply Chains. Water Resour. Res. 2022, 58, e2021WR030695. [Google Scholar] [CrossRef]
  10. Chen, Y.; Lu, D.; Luo, L.; Pokhrel, Y.; Deb, K.; Huang, J.; Ran, Y. Detecting irrigation extent, frequency, and timing in a heterogeneous arid agricultural region using MODIS time series, Landsat imagery, and ancillary data. Remote Sens. Environ. 2018, 204, 197–211. [Google Scholar] [CrossRef]
  11. Dari, J.; Brocca, L.; Quintana-Seguí, P.; Escorihuela, M.J.; Stefan, V.; Morbidelli, R. Exploiting High-Resolution Remote Sensing Soil Moisture to Estimate Irrigation Water Amounts over a Mediterranean Region. Remote Sens. 2020, 12, 2593. [Google Scholar] [CrossRef]
  12. Brombacher, J.; Silva, I.R.D.O.; Degen, J.; Pelgrum, H. A novel evapotranspiration based irrigation quantification method using the hydrological similar pixels algorithm. Agric. Water Manag. 2022, 267, 107602. [Google Scholar] [CrossRef]
  13. Zappa, L.; Schlaffer, S.; Bauer-Marschallinger, B.; Nendel, C.; Zimmerman, B.; Dorigo, W. Detection and Quantification of Irrigation Water Amounts at 500 m Using Sentinel-1 Surface Soil Moisture. Remote Sens. 2021, 13, 1727. [Google Scholar] [CrossRef]
  14. Döll, P.; Siebert, S. Global modeling of irrigation water requirements. Water Resour. Res. 2002, 38, 8-1–8-10. [Google Scholar] [CrossRef]
  15. Fischer, G.; Tubiello, F.N.; van Velthuizen, H.; Wiberg, D.A. Climate change impacts on irrigation water requirements: Effects of mitigation, 1990–2080. Technol. Forecast. Soc. Chang. 2007, 74, 1083–1107. [Google Scholar] [CrossRef]
  16. Iqbal, M.A.; Shen, Y.; Stricevic, R.; Pei, H.; Sun, H.; Amiri, E.; Penas, A.; Del Rio, S. Evaluation of the FAO AquaCrop model for winter wheat on the North China Plain under deficit irrigation from field experiment to regional yield simulation. Agric. Water Manag. 2014, 135, 61–72. [Google Scholar] [CrossRef]
  17. McDermid, S.; Nocco, M.; Lawston-Parker, P.; Keune, J.; Pokhrel, Y.; Jain, M.; Jägermeyr, J.; Brocca, L.; Massari, C.; Jones, A.D.; et al. Irrigation in the Earth system. Nat. Rev. Earth Environ. 2023, 4, 435–453. [Google Scholar] [CrossRef]
  18. Dixit, P.N.; Telleria, R.; Al Khatib, A.N.; Allouzi, S.F. Decadal analysis of impact of future climate on wheat production in dry Mediterranean environment: A case of Jordan. Sci. Total Environ. 2018, 610–611, 219–233. [Google Scholar] [CrossRef]
  19. Tao, F.; Zhang, Z.; Zhang, S.; Rötter, R.P.; Shi, W.; Xiao, D.; Liu, Y.; Wang, M.; Liu, F.; Zhang, H. Historical data provide new insights into response and adaptation of maize production systems to climate change/variability in China. Field Crops Res. 2016, 185, 1–11. [Google Scholar] [CrossRef]
  20. Wang, J.; Wang, E.; Yang, X.; Zhang, F.; Yin, H. Increased yield potential of wheat-maize cropping system in the North China Plain by climate change adaptation. Clim. Chang. 2012, 113, 825–840. [Google Scholar] [CrossRef]
  21. Wang, W.; Yu, Z.; Zhang, W.; Shao, Q.; Zhang, Y.; Luo, Y.; Jiao, X.; Xu, J. Responses of rice yield, irrigation water requirement and water use efficiency to climate change in China: Historical simulation and future projections. Agric. Water Manag. 2014, 146, 249–261. [Google Scholar] [CrossRef]
  22. Zhang, H.; Zhou, G.; Liu, D.L.; Wang, B.; Xiao, D.; He, L. Climate-associated rice yield change in the Northeast China Plain: A simulation analysis based on CMIP5 multi-model ensemble projection. Sci. Total Environ. 2019, 666, 126–138. [Google Scholar] [CrossRef] [PubMed]
  23. Jeong, S.-J.; Ho, C.-H.; Piao, S.; Kim, J.; Ciais, P.; Lee, Y.-B.; Jhun, J.-G.; Park, S.K. Effects of double cropping on summer climate of the North China Plain and neighbouring regions. Nat. Clim. Chang. 2014, 4, 615–619. [Google Scholar] [CrossRef]
  24. Yuan, Z.; Shen, Y. Estimation of Agricultural Water Consumption from Meteorological and Yield Data: A Case Study of Hebei, North China. PLoS ONE 2013, 8, e58685. [Google Scholar] [CrossRef] [PubMed]
  25. Wu, D.; Fang, S.; Li, X.; He, D.; Zhu, Y.; Yang, Z.; Xu, J.; Wu, Y. Spatial-temporal variation in irrigation water requirement for the winter wheat-summer maize rotation system since the 1980s on the North China Plain. Agric. Water Manag. 2019, 214, 78–86. [Google Scholar] [CrossRef]
  26. Guo, R.; Lin, Z.; Mo, X.; Yang, C. Responses of crop yield and water use efficiency to climate change in the North China Plain. Agric. Water Manag. 2010, 97, 1185–1194. [Google Scholar] [CrossRef]
  27. Mo, X.; Liu, S.; Lin, Z.; Guo, R. Regional crop yield, water consumption and water use efficiency and their responses to climate change in the North China Plain. Agric. Ecosyst. Environ. 2009, 134, 67–78. [Google Scholar] [CrossRef]
  28. Tao, F.; Zhang, Z. Climate change, wheat productivity and water use in the North China Plain: A new super-ensemble-based probabilistic projection. Agric. For. Meteorol. 2013, 170, 146–165. [Google Scholar] [CrossRef]
  29. Pachauri, R.K.; Allen, M.R.; Barros, V.R.; Broome, J.; Cramer, W.; Christ, R.; Church, J.A.; Clarke, L.; Dahe, Q.D.; Dasqupta, P.; et al. Climate Change 2014 Synthesis Report. Contribution of Working Groups I, II, and III to the Fifth Assessment Report of the Intergovernmental Panel on Climate Change; IPCC: Paris, France, 2014. [Google Scholar]
  30. van Vuuren, D.P.; Edmonds, J.; Kainuma, M.; Riahi, K.; Thomson, A.; Hibbard, K.; Hurtt, G.C.; Kram, T.; Krey, V.; Lamarque, J.-F.; et al. The representative concentration pathways: An overview. Clim. Chang. 2011, 109, 5–31. [Google Scholar] [CrossRef]
  31. Rashid, M.A.; Jabloun, M.; Andersen, M.N.; Zhang, X.; Olesen, J.E. Climate change is expected to increase yield and water use efficiency of wheat in the North China Plain. Agric. Water Manag. 2019, 222, 193–203. [Google Scholar] [CrossRef]
  32. Xiao, D.; Liu, D.L.; Feng, P.; Wang, B.; Waters, C.; Shen, Y.; Qi, Y.; Bai, H.; Tang, J. Future climate change impacts on grain yield and groundwater use under different cropping systems in the North China Plain. Agric. Water Manag. 2021, 246, 106685. [Google Scholar] [CrossRef]
  33. Zhou, J.; Lu, H.; Yang, K.; Jiang, R.; Yang, Y.; Wang, W.; Zhang, X. Projection of China’s future runoff based on the CMIP6 mid-high warming scenarios. Sci. China Earth Sci. 2023, 66, 528–546. [Google Scholar] [CrossRef]
  34. Haarsma, R.J.; Roberts, M.J.; Vidale, P.L.; Senior, C.A.; Bellucci, A.; Bao, Q.; Chang, P.; Corti, S.; Fučkar, N.S.; Guemas, V.; et al. High Resolution Model Intercomparison Project (HighResMIP v1.0) for CMIP6. Geosci. Model Dev. 2016, 9, 4185–4208. [Google Scholar] [CrossRef]
  35. Chen, Q.; Ge, F.; Jin, Z.; Lin, Z. How well do the CMIP6 HighResMIP models simulate precipitation over the Tibetan Plateau? Atmos. Res. 2022, 279, 106393. [Google Scholar] [CrossRef]
  36. Liang, J.; Tan, M.L.; Hawcroft, M.; Catto, J.L.; Hodges, K.I.; Haywood, J.M. Monsoonal precipitation over Peninsular Malaysia in the CMIP6 HighResMIP experiments: The role of model resolution. Clim. Dyn. 2022, 58, 2783–2805. [Google Scholar] [CrossRef]
  37. Rhoades, A.M.; Hatchett, B.J.; Risser, M.D.; Collins, W.D.; Bambach, N.E.; Huning, L.S.; McCrary, R.; Siirila-Woodburn, E.R.; Ullrich, P.A.; Wehner, M.F.; et al. Asymmetric emergence of low-to-no snow in the midlatitudes of the American Cordillera. Nat. Clim. Chang. 2022, 12, 1151–1159. [Google Scholar] [CrossRef]
  38. Siirila-Woodburn, E.R.; Rhoades, A.M.; Hatchett, B.J.; Huning, L.S.; Szinai, J.; Tague, C.; Nico, P.S.; Feldman, D.R.; Jones, A.D.; Collins, W.D.; et al. A low-to-no snow future and its impacts on water resources in the western United States. Nat. Rev. Earth Environ. 2021, 2, 800–819. [Google Scholar] [CrossRef]
  39. van der Linden, E.C.; Haarsma, R.J.; van der Schrier, G. Impact of climate model resolution on soil moisture projections in central-western Europe. Hydrol. Earth Syst. Sci. 2019, 23, 191–206. [Google Scholar] [CrossRef]
  40. Wang, S.; Ma, X.; Zhou, S.; Wu, L.; Wang, H.; Tang, Z.; Xu, G.; Jing, Z.; Chen, Z.; Gan, B. Extreme atmospheric rivers in a warming climate. Nat. Commun. 2023, 14, 3219. [Google Scholar] [CrossRef] [PubMed]
  41. You, Y.; Ting, M. Improved Performance of High-Resolution Climate Models in Simulating Asian Monsoon Rainfall Extremes. Geophys. Res. Lett. 2023, 50, e2022GL100827. [Google Scholar] [CrossRef]
  42. Busschaert, L.; de Roos, S.; Thiery, W.; Raes, D.; De Lannoy, G.J.M. Net irrigation requirement under different climate scenarios using AquaCrop over Europe. Hydrol. Earth Syst. Sci. 2022, 26, 3731–3752. [Google Scholar] [CrossRef]
  43. Zhang, W.; Liu, W.; Xue, Q.; Chen, J.; Han, X. Evaluation of the AquaCrop model for simulating yield response of winter wheat to water on the southern Loess Plateau of China. Water Sci. Technol. 2013, 68, 821–828. [Google Scholar] [CrossRef]
  44. Zhuo, L.; Mekonnen, M.M.; Hoekstra, A.Y. Benchmark levels for the consumptive water footprint of crop production for different environmental conditions: A case study for winter wheat in China. Hydrol. Earth Syst. Sci. 2016, 20, 4547–4559. [Google Scholar] [CrossRef]
  45. Ministry of Water Resources in China. China Water Resources Bulletin; Ministry of Water Resources in China: Beijing, China, 2018.
  46. Zhang, C.; Duan, Q.; Yeh, P.J.-F.; Pan, Y.; Gong, H.; Gong, W.; Di, Z.; Lei, X.; Liao, W.; Huang, Z.; et al. The Effectiveness of the South-to-North Water Diversion Middle Route Project on Water Delivery and Groundwater Recovery in North China Plain. Water Resour. Res. 2020, 56, e2019WR026759. [Google Scholar] [CrossRef]
  47. Luo, Y.; Zhang, Z.; Chen, Y.; Li, Z.; Tao, F. ChinaCropPhen1km: A high-resolution crop phenological dataset for three staple crops in China during 2000–2015 based on leaf area index (LAI) products. Earth Syst. Sci. Data 2020, 12, 197–214. [Google Scholar] [CrossRef]
  48. Li, Q.; Shi, G.; Shangguan, W.; Nourani, V.; Li, J.; Li, L.; Huang, F.; Zhang, Y.; Wang, C.; Wang, D.; et al. A 1 km daily soil moisture dataset over China using in situ measurement and machine learning. Earth Syst. Sci. Data 2022, 14, 5267–5286. [Google Scholar] [CrossRef]
  49. Raes, D.; Steduto, P.; Hsiao, T.C.; Fereres, E. AquaCrop—The FAO Crop Model to Simulate Yield Response to Water: II. Main Algorithms and Software Description. Agron. J. 2009, 101, 438–447. [Google Scholar] [CrossRef]
  50. Zhou, S.-L.; Wu, Y.-C.; Wang, Z.-M.; Lu, L.-Q.; Wang, R.-Z. The nitrate leached below maize root zone is available for deep-rooted wheat in winter wheat–summer maize rotation in the North China Plain. Environ. Pollut. 2008, 152, 723–730. [Google Scholar] [CrossRef]
  51. Liang-Liang, L.; Jian, L.; Ru-Cong, Y. Evaluation of CMIP6 HighResMIP models in simulating precipitation over Central Asia. Adv. Clim. Chang. Res. 2022, 13, 1–13. [Google Scholar] [CrossRef]
  52. Yang, J.-X.; Zhou, B.-Q.; Zhai, P.-M. Constrained high-resolution projection of hot extremes in the Beijing–Tianjin–Hebei region of China. Adv. Clim. Chang. Res. 2023, 14, 387–393. [Google Scholar] [CrossRef]
  53. Yang, W.; Long, D.; Scanlon, B.R.; Burek, P.; Zhang, C.; Han, Z.; Butler, J.J., Jr.; Pan, Y.; Lei, X.; Wada, Y. Human Intervention Will Stabilize Groundwater Storage Across the North China Plain. Water Resour. Res. 2022, 58, e2021WR030884. [Google Scholar] [CrossRef]
  54. Ma, X.; Chang, P.; Saravanan, R.; Montuoro, R.; Hsieh, J.-S.; Wu, D.; Lin, X.; Wu, L.; Jing, Z. Distant Influence of Kuroshio Eddies on North Pacific Weather Patterns? Sci. Rep. 2015, 5, 17785. [Google Scholar] [CrossRef] [PubMed]
  55. Minobe, S.; Kuwano-Yoshida, A.; Komori, N.; Xie, S.-P.; Small, R.J. Influence of the Gulf Stream on the troposphere. Nature 2008, 452, 206–209. [Google Scholar] [CrossRef] [PubMed]
  56. O’Reilly, C.H.; Minobe, S.; Kuwano-Yoshida, A. The influence of the Gulf Stream on wintertime European blocking. Clim. Dyn. 2016, 47, 1545–1567. [Google Scholar] [CrossRef]
  57. Parfitt, R.; Czaja, A.; Minobe, S.; Kuwano-Yoshida, A. The atmospheric frontal response to SST perturbations in the Gulf Stream region. Geophys. Res. Lett. 2016, 43, 2299–2306. [Google Scholar] [CrossRef]
  58. An, B.; Yu, Y.; Bao, Q.; He, B.; Li, J.; Luan, Y.; Chen, K.; Zheng, W. CAS FGOALS-f3-H Dataset for the High-Resolution Model Intercomparison Project (HighResMIP) Tier 2. Adv. Atmos. Sci. 2022, 39, 1873–1884. [Google Scholar] [CrossRef]
  59. Harris, L.M.; Lin, S.-J.; Tu, C. High-Resolution Climate Simulations Using GFDL HiRAM with a Stretched Global Grid. J. Clim. 2016, 29, 4293–4314. [Google Scholar] [CrossRef]
  60. Haarsma, R.; Acosta, M.; Bakhshi, R.; Bretonnière, P.A.; Caron, L.P.; Castrillo, M.; Corti, S.; Davini, P.; Exarchou, E.; Fabiano, F.; et al. HighResMIP versions of EC-Earth: EC-Earth3P and EC-Earth3P-HR—Description, model computational performance and basic validation. Geosci. Model Dev. 2020, 13, 3507–3527. [Google Scholar] [CrossRef]
  61. Hsiao, T.C.; Heng, L.; Steduto, P.; Rojas Lara, B.; Raes, D.; Fereres, E. AquaCrop—The FAO Crop Model to Simulate Yield Response to Water: III. Parameterization and Testing for Maize. Agron. J. 2009, 101, 448–459. [Google Scholar] [CrossRef]
  62. Kelly, T.D.; Foster, T. AquaCrop-OSPy: Bridging the gap between research and practice in crop-water modeling. Agric. Water Manag. 2021, 254, 106976. [Google Scholar] [CrossRef]
  63. Allen, R.; Pereira, L.; Raes, D.; Smith, M. FAO Irrigation and drainage paper No. 56. Rome Food Agric. Organ. U. N. 1998, 56, 26–40. [Google Scholar]
  64. Zhang, Y.; Schaap, M.G.; Zha, Y. A High-Resolution Global Map of Soil Hydraulic Properties Produced by a Hierarchical Parameterization of a Physically Based Water Retention Model. Water Resour. Res. 2018, 54, 9774–9790. [Google Scholar] [CrossRef]
  65. Yan, Z.; Zhang, X.; Rashid, M.A.; Li, H.; Jing, H.; Hochman, Z. Assessment of the sustainability of different cropping systems under three irrigation strategies in the North China Plain under climate change. Agric. Syst. 2020, 178, 102745. [Google Scholar] [CrossRef]
  66. Meinshausen, M.; Vogel, E.; Nauels, A.; Lorbacher, K.; Meinshausen, N.; Etheridge, D.M.; Fraser, P.J.; Montzka, S.A.; Rayner, P.J.; Trudinger, C.M.; et al. Historical greenhouse gas concentrations for climate modelling (CMIP6). Geosci. Model Dev. 2017, 10, 2057–2116. [Google Scholar] [CrossRef]
  67. Wang, F.; Meng, H.; Xie, R.; Wang, K.; Ming, B.; Hou, P.; Xue, J.; Li, S. Optimizing deficit irrigation and regulated deficit irrigation methods increases water productivity in maize. Agric. Water Manag. 2023, 280, 108205. [Google Scholar] [CrossRef]
  68. Hurtt, G.C.; Chini, L.; Sahajpal, R.; Frolking, S.; Bodirsky, B.L.; Calvin, K.; Doelman, J.C.; Fisk, J.; Fujimori, S.; Klein Goldewijk, K.; et al. Harmonization of global land use change and management for the period 850–2100 (LUH2) for CMIP6. Geosci. Model Dev. 2020, 13, 5425–5464. [Google Scholar] [CrossRef]
  69. Prestele, R.; Alexander, P.; Rounsevell, M.D.A.; Arneth, A.; Calvin, K.; Doelman, J.; Eitelberg, D.A.; Engström, K.; Fujimori, S.; Hasegawa, T.; et al. Hotspots of uncertainty in land-use and land-cover change projections: A global-scale model comparison. Glob. Chang. Biol. 2016, 22, 3967–3983. [Google Scholar] [CrossRef] [PubMed]
  70. Shirazi, S.Z.; Mei, X.; Liu, B.; Liu, Y. Estimating potential yield and change in water budget for wheat and maize across Huang-Huai-Hai Plain in the future. Agric. Water Manag. 2022, 260, 107282. [Google Scholar] [CrossRef]
  71. Xing, W.; Wang, W.; Shao, Q.; Ding, Y. Estimating Net Irrigation Requirements of Winter Wheat across Central-Eastern China under Present and Future Climate Scenarios. J. Irrig. Drain. Eng. 2018, 144, 05018005. [Google Scholar] [CrossRef]
  72. Xiao, D.; Liu, D.L.; Wang, B.; Feng, P.; Bai, H.; Tang, J. Climate change impact on yields and water use of wheat and maize in the North China Plain under future climate change scenarios. Agric. Water Manag. 2020, 238, 106238. [Google Scholar] [CrossRef]
Figure 1. Study region of the North China Plain and the distribution of the summer maize–winter wheat rotation area. The source data is based on Luo et al. [47].
Agronomy 14 01144 g001
Figure 2. Flowchart of the study. Where Tr is the transpiration, θi is the soil moisture in the i day, P is the precipitation, I is the irrigation, U is the root uptake, R is the runoff, E is the evaporation, and Kc is the crop coefficient. ① and ② represent the workflows of experiment.
Agronomy 14 01144 g002
Figure 3. Spatial distribution of volumetric water content at saturation (θS, (a)), field capacity (θFC, (b)), permanent wilting point (θPWP, (c)), and saturated hydraulic conductivity (KSat, (d)) over the study region.
Agronomy 14 01144 g003
Figure 4. Spatial distribution of ubRMSD of AquaCrop-derived SM and SMCI products from 2011 to 2020. The spatial mean and standard deviation are shown in the titles. (a) Summer maize growth period and (b) winter wheat growth period.
Agronomy 14 01144 g004
Figure 5. Density scatterplots comparing the AquaCrop-derived SM and SMCI products from 2011 to 2020. (a) Summer maize growth period and (b) winter wheat growth period. The color bar represents the percentage of the total samples. The blue dash line is the 1:1 line, and the red line is the fitted line of scatterplots.
Agronomy 14 01144 g005
Figure 6. Spatial distribution of the interannual precipitation difference of summer maize for three future climate datasets ((a) EC-Earth3P-HR, (b) FGOALS-f3-H, (c) HiRAM-SIT-HR) with reference to baseline.
Agronomy 14 01144 g006
Figure 7. Spatial distribution of the interannual precipitation difference of winter wheat for three future climate datasets ((a) EC-Earth3P-HR, (b) FGOALS-f3-H, (c) HiRAM-SIT-HR) with reference to baseline.
Agronomy 14 01144 g007
Figure 8. Spatial distribution of the temperature difference in summer maize for three future climate datasets ((a) EC-Earth3P-HR, (b) FGOALS-f3-H, (c) HiRAM-SIT-HR) with reference to baseline.
Agronomy 14 01144 g008
Figure 9. Spatial distribution of the temperature difference of winter wheat for three future climate datasets ((a) EC-Earth3P-HR, (b) FGOALS-f3-H, (c) HiRAM-SIT-HR) with reference to baseline.
Agronomy 14 01144 g009
Figure 10. Spatial distribution of ETc (a), irrigation amount (b), PET (c), precipitation (d) during the summer maize growth period at baseline (2011–2020).
Agronomy 14 01144 g010
Figure 11. Spatial distribution of ETc (a), irrigation amount (b), PET (c), precipitation (d) during the winter wheat growth period at baseline (2011–2020).
Agronomy 14 01144 g011
Figure 12. Box plot of irrigation difference (mm) between future scenarios (2021–2050) and baseline (2011–2020) of summer maize for the three future climate datasets and the median across all datasets.
Agronomy 14 01144 g012
Figure 13. Spatial distribution of irrigation difference in the summer maize growth period for three future climate projections ((a) EC-Earth3P-HR, (b) FGOALS-f3-H, (c) HiRAM-SIT-HR) during 2021–2050 period with reference to baseline irrigation (2011–2020).
Agronomy 14 01144 g013
Figure 14. Box plot of irrigation difference (mm) between future scenarios (2021–2050) and baseline (2011–2020) of winter wheat for the three future climate datasets and the median across all datasets.
Agronomy 14 01144 g014
Figure 15. Spatial distribution of irrigation difference in the winter wheat growth period for three future climate projections ((a) EC-Earth3P-HR, (b) FGOALS-f3-H, (c) HiRAM-SIT-HR) during 2021–2050 period with reference to baseline irrigation (2011–2020).
Agronomy 14 01144 g015
Table 1. The future climate datasets under SSP5-8.5 future scenario used in this study.
DatasetSpatial
Resolution
SSP ForcingReference
FGAOLS-f3-H0.25°highres-futureAn et al., 2022 [58]
HiRAM-SIT-HR0.25°highresSST-futureHarris et al., 2016 [59]
EC-Earth3P-HR0.35°highres-futureHaarsma et al., 2020 [60]
Table 2. Crucial parameters in the AquaCrop model regarding crop growth.
ParametersDescriptionUnitWheatMaize
matTimes from sowing to maturityday197132
emeTimes from sowing to emergenceday136
rootdepTimes from sowing to maximum rooting depthday93108
CCxMaximum canopy cover%9696
numNumber of plants per hectare-4,500,00075,000
KcCrop coefficient when canopy growth is complete but prior to senescence-1.11.05
TbaseBase temperature below which growth does not progress°C08
TuppUpper temperature above which crop development no longer increases°C2630
HI0Reference harvest index-0.480.48
Table 3. Characteristics of the crops and irrigation strategy under four major growth stages (emergence, canopy growth, max canopy, and senescence).
Growth StagesThreshold
Winter WheatSummer Maize
Period of emergence70%TAW70%TAW
Period of canopy growth80%TAW80%TAW
Period of max canopy80%TAW95%TAW
Period of senescence80%TAW85%TAW
Disclaimer/Publisher’s Note: The statements, opinions and data contained in all publications are solely those of the individual author(s) and contributor(s) and not of MDPI and/or the editor(s). MDPI and/or the editor(s) disclaim responsibility for any injury to people or property resulting from any ideas, methods, instructions or products referred to in the content.

