Abstract
The use of resistant varieties is an important strategy for managing tomato bacterial spot. The objective of this study was to evaluate the reaction of tomato genotypes to Xanthomonas euvesicatoria pv. perforans. The experiment was conducted in a randomized block design with 10 genotypes and four repetitions. The genotypes consisted of hybrids (UFU-1, UFU-2, UFU-3), wild resistant accession Solanum pennellii, commercial susceptible cultivar Santa Clara and homozygous lines (UFU-5, UFU-6, UFU-11, UFU-12, UFU-15). The UFU B8 isolate of X. euvesicatoria pv. perforans was used. The bacterial suspension was prepared and adjusted in a spectrophotometer OD550 = 0.5 (1 × 10⁹ CFU mL−1). Inoculation occurred 10 days after transplantation. Disease severity was assessed at 3, 6, 9, 12 and 15 days after inoculation, and the area under the disease progress curve (AUDPC) was calculated. There was a significant difference between the genotypes regarding the severity of the disease at 3, 6 and 12 days after inoculation. Lineages 5, 6 and 12, the hybrid UFU-1 and the wild accession S. pennellii showed the lowest severity of the disease, being promising for promoting genetic improvement programs aimed at resistance to the bacteria.
1. Introduction
Tomato (Solanum lycopersicum L.) is one of the most important crops worldwide, being the second most prominent vegetable in Brazil. Essential for a healthy diet, it has significant socioeconomic contributions [1], with an estimated five to six direct jobs per hectare [2].
In Brazil, the tropical climate is ideal for the development of bacterial diseases in tomatoes [3], with bacterial spot being particularly notable. Tomato bacterial spot is caused by four species of Xanthomonas: X. vesicatoria [4], X. euvesicatoria pv. euvesicatoria, X. euvesicatoria pv. perforans [5] and X. hortorum pv. gardineri [6], which can lead to losses exceeding 60% [7] in production, especially under conditions of high humidity and temperatures between 20 and 30 °C [8].
In Brazilian regions, the most prevalent species is X. euvesicatoria pv. perforans. This is due to its greater competitive capacity and adaptability to higher temperatures, being particularly aggressive when temperatures exceed 25 °C [9]. Disease control is hindered by the scarcity of phytosanitary products registered for the crop. The products used focus on protection, such as copper-based products, which show variable efficiency [10,11]. The incidence of this disease in tomato crops is concerning, encouraging the search for new research aiming at mitigating measures capable of reducing production losses.
There are reports that genetic resistance can be an important strategy to reduce losses caused by bacteria [12]. However, there are no reports of tomato cultivars resistant to different species of Xanthomonas spp. [13]. This is mainly due to the scarcity of available germplasm coupled with frequent racial changes in the pathogen, along with quantitative resistance in the host plant, which is more difficult to manipulate than unique qualitative genes [14].
Therefore, it is necessary to evaluate new tomato germplasms for their reaction to X. euvesicatoria pv. perforans, aiming to contribute to sustainable production. Thus, the objective was to evaluate the reaction of tomato lineages and hybrids against Xanthomonas euvesicatoria pv. perforans.
2. Materials and Methods
The trial was conducted at the Phytopathology Laboratory and in a greenhouse at the Vegetable Experimental Station of the Federal University of Uberlândia (UFU), Monte Carmelo campus, Minas Gerais, MG, Brazil.
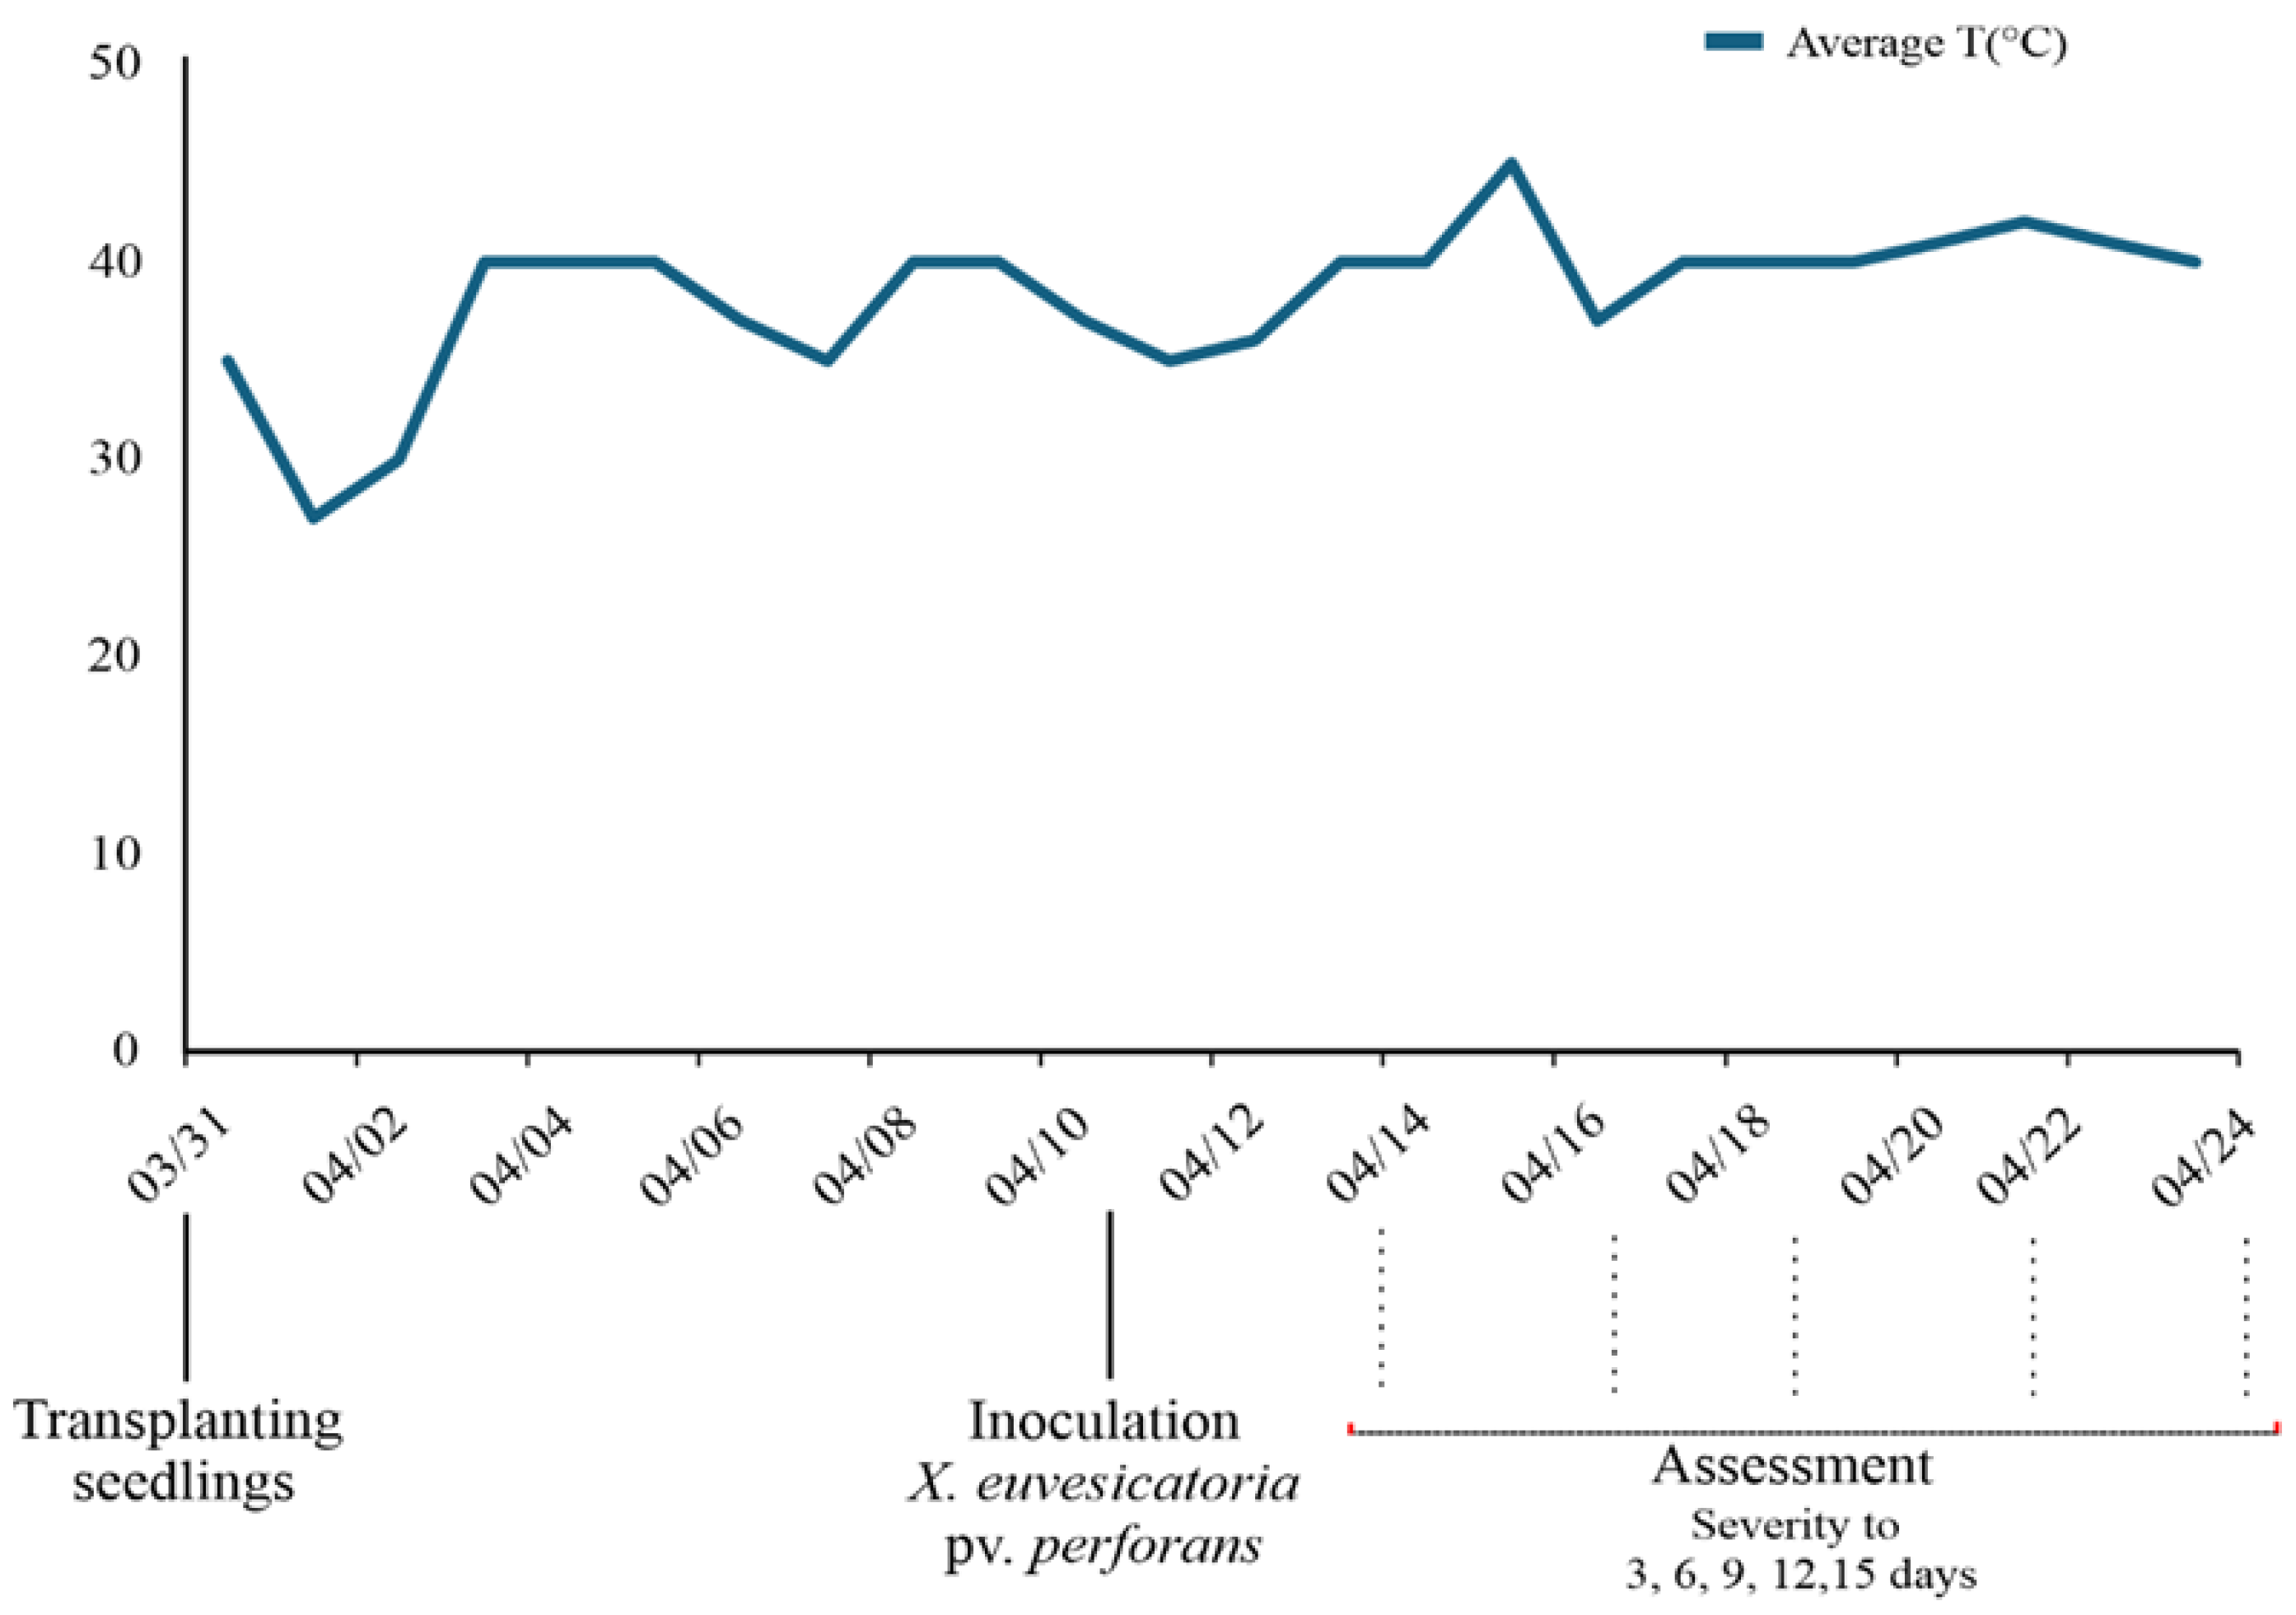
Temperature variations throughout the experiment were monitored, and the average data for the period were obtained (Figure 1).
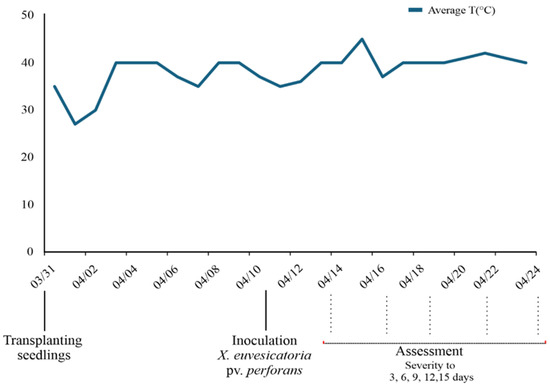
Figure 1.
Climograph for the period of the experiment conducted in Monte Carmelo, MG, Brazil.
The isolate of X. euvesicatoria pv. perforans (UFU B8), preserved and maintained in the LABAC/UFU working collection, was collected from tomato leaves in Uberlândia, MG. It was identified by PCR using the species-specific primer pairs Bs-XgF (5′-TCA GTG CTT AGT TCC TCA TTG TC-3′) and Bs-XgR (5′-TGA CCG ATA AAG ACT GCG AAA G-3′), which amplify the 154 bp amplicon [15].
The pathogenic isolate was cultured in 523 medium [16] at 28 °C for 48 h. The bacterial suspension was prepared in sterilized filtered water and adjusted in a spectrophotometer OD550 = 0.5 (1 × 10⁹ CFU mL−1).
The experiment was conducted in a randomized complete block design consisting of ten treatments, including three hybrids (UFU-1, UFU-2, UFU-3), Solanum pennellii [wild and resistant to X. euvesicatoria pv. perforans [17]], Santa Clara (commercial cultivar and susceptible to X. euvesicatoria pv. perforans), five homozygous lineages (UFU-5, UFU-6, UFU-11, UFU-12, UFU-15) and four replications. Each experimental unit consisted of two pots, with each pot containing two plants (Table 1).

Table 1.
Identification of the germplasm used in the experiment.
The germplasm used is part of the Tomato Breeding Program at UFU, with all the pedigree stored in the “BG α BIOFORT” software (Version 1), registration number BR512019002403-6 at INPI [18].
The experiment was carried out in a greenhouse (7 m × 4 m) covered with 150-micron transparent anti-UV plastic. Seeding was performed in expanded polystyrene trays with 200 cells, filled with c pine bark bio-stabilized-based substrate.
Approximately 30 days after sowing, when the seedlings had three to four definitive leaves, they were transplanted into 500 mL (10.5 cm in height and ×12 cm in width) plastic pots containing the substrate VIVATO® SLIM PRO 10 based on pine bark bio-stabilized, vermiculite, charcoal fines, and water.
Irrigation was performed using a watering can, and the plants were watered until runoff, avoiding leaf wetting. The watering schedule was twice a day.
Ten days after transplantation, the plants were inoculated with bacterial suspension in a concentration of 1 × 10⁹ CFU mL−1 by spraying up to the point of runoff. The plants were kept in a humid chamber 24 h before and after inoculation.
Disease severity was assessed at 3, 6, 9, 12 and 15 days after inoculation using the diagrammatic scale proposed by Mello et al. [19]. The area under the disease progress curve (AUDPC) was calculated using the following formula:
where y1 and y2 refer to two successive evaluations of the proportion of lesioned tissue conducted at times t1 and t2, respectively [20].
AUDPC = ∑ [(y1 + y2)/2] (t2 − t1)
The experimental plot consisted of four plants present in the two pots containing two plants each. Thus, the average was calculated for each experimental plot. The relative superiority (RS%) was calculated using the data from the mean of each treatment through the following equation: RS% = [(G1/G2) − 1] × 100, where RS% is the percentage difference between the Santa Clara genotype (G2), and G1 is the genotype to be calculated.
An analysis of variance was performed, and means were compared using the Scott–Knott test (p < 0.05). Additionally, the standard deviation was calculated.
The data were also subjected to multivariate analysis to characterize the dissimilarity between treatments and variables using the dendrogram of the heat map.
The dissimilarity matrix was obtained using the Euclidean distance, with genetic dissimilarity represented by the dendrogram obtained by the hierarchical method (UPGMA). The UPGMA clustering was validated by the cophenetic correlation coefficient (CCC) calculated using the Mantel test [21]. The relative contribution of the evaluated traits was calculated according to Singh’s criterion. All statistical analyses were performed using R software version 3.6 [22].
3. Results
The temperature variations observed were favorable for the development of the pathogen in tomatoes (Figure 1) [9]. The genotypes differed from each other in disease severity assessed at 3, 6 and 12 days after inoculation (F test, p < 0.05). However, for the AUDPC and disease severity observed at 9 and 15 days after inoculation, there was no difference among the genotypes (Table 2).
Table 2.
Severity and area under the disease progress curve of bacterial spot in different tomato genotypes at 3, 6, 9, 12 and 15 days after inoculation.
The wild accession S. pennellii showed higher disease severity at 3 days after inoculation compared to the other genotypes, indicating a possible hypersensitive reaction. Additionally, it was observed that in the wild accession, severity at 9 and 12 days was lower compared to the commercial cultivar Santa Clara (Table 2).
On average, at 6 days after inoculation, all genotypes showed symptoms of the disease. However, the hybrids UFU-1 and UFU-2 and all homozygous lines (UFU-5, UFU-6, UFU-11, UFU-12, UFU-15) significantly differed (Scott–Knott, p < 0.05) from the wild accession S. pennellii and the commercial cultivar Santa Clara. Shi and Panthee [23] also observed the same incubation period when working with tomato genotypes resistant to X. euvesicatoria pv. perforans.
The cultivar Santa Clara showed the highest disease severity observed at 12 days after inoculation (28.96) compared to the other genotypes, as well as the highest AUDPC (212.25), confirming its susceptibility. The AUDPC varied with mean values from 152.91 (lineage 12) to 212.25 (commercial cultivar, Santa Clara) (Table 2).
When analyzing the relative contribution of the traits (Table 3), it was found that the AUDPC was the variable that contributed most to genetic dissimilarity (91.31%), followed by disease severity observed at 12 days after inoculation (4.98%), with these two traits accounting for 96.29% of the genetic dissimilarity among the evaluated genotypes.
Table 3.
Relative contribution of traits to genetic dissimilarity (CRDG) among the ten tomato genotypes.
Five distinct groups were formed, and the separation of the groups was based on the knowledge of the genotypes and visual analysis of the dendrogram, resulting in the delimitation of a cut-off line of 53.72 (Figure 2).
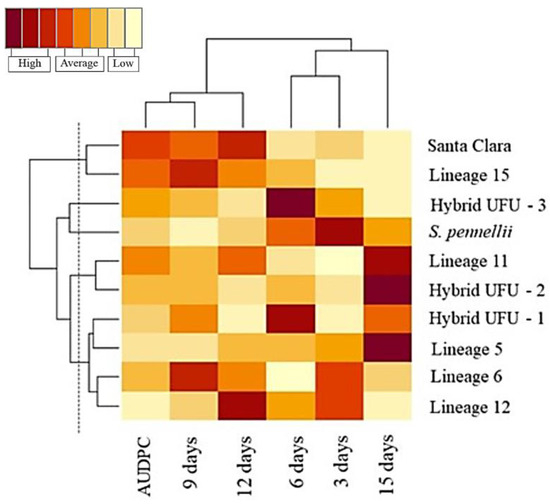
Figure 2.
Dendrogram of genetic dissimilarity among 10 tomato genotypes using Euclidean distance, UPGMA method. CCC = 0.76.
The first group was formed by the cultivar Santa Clara and lineage 15, the second was formed by the wild accession S. pennellii, the third group was constituted by the hybrid UFU-3, the fourth group contained the hybrid UFU-2 and lineage 11, and the fifth group was formed by the hybrid UFU-1 and lineages 5, 6 and 12.
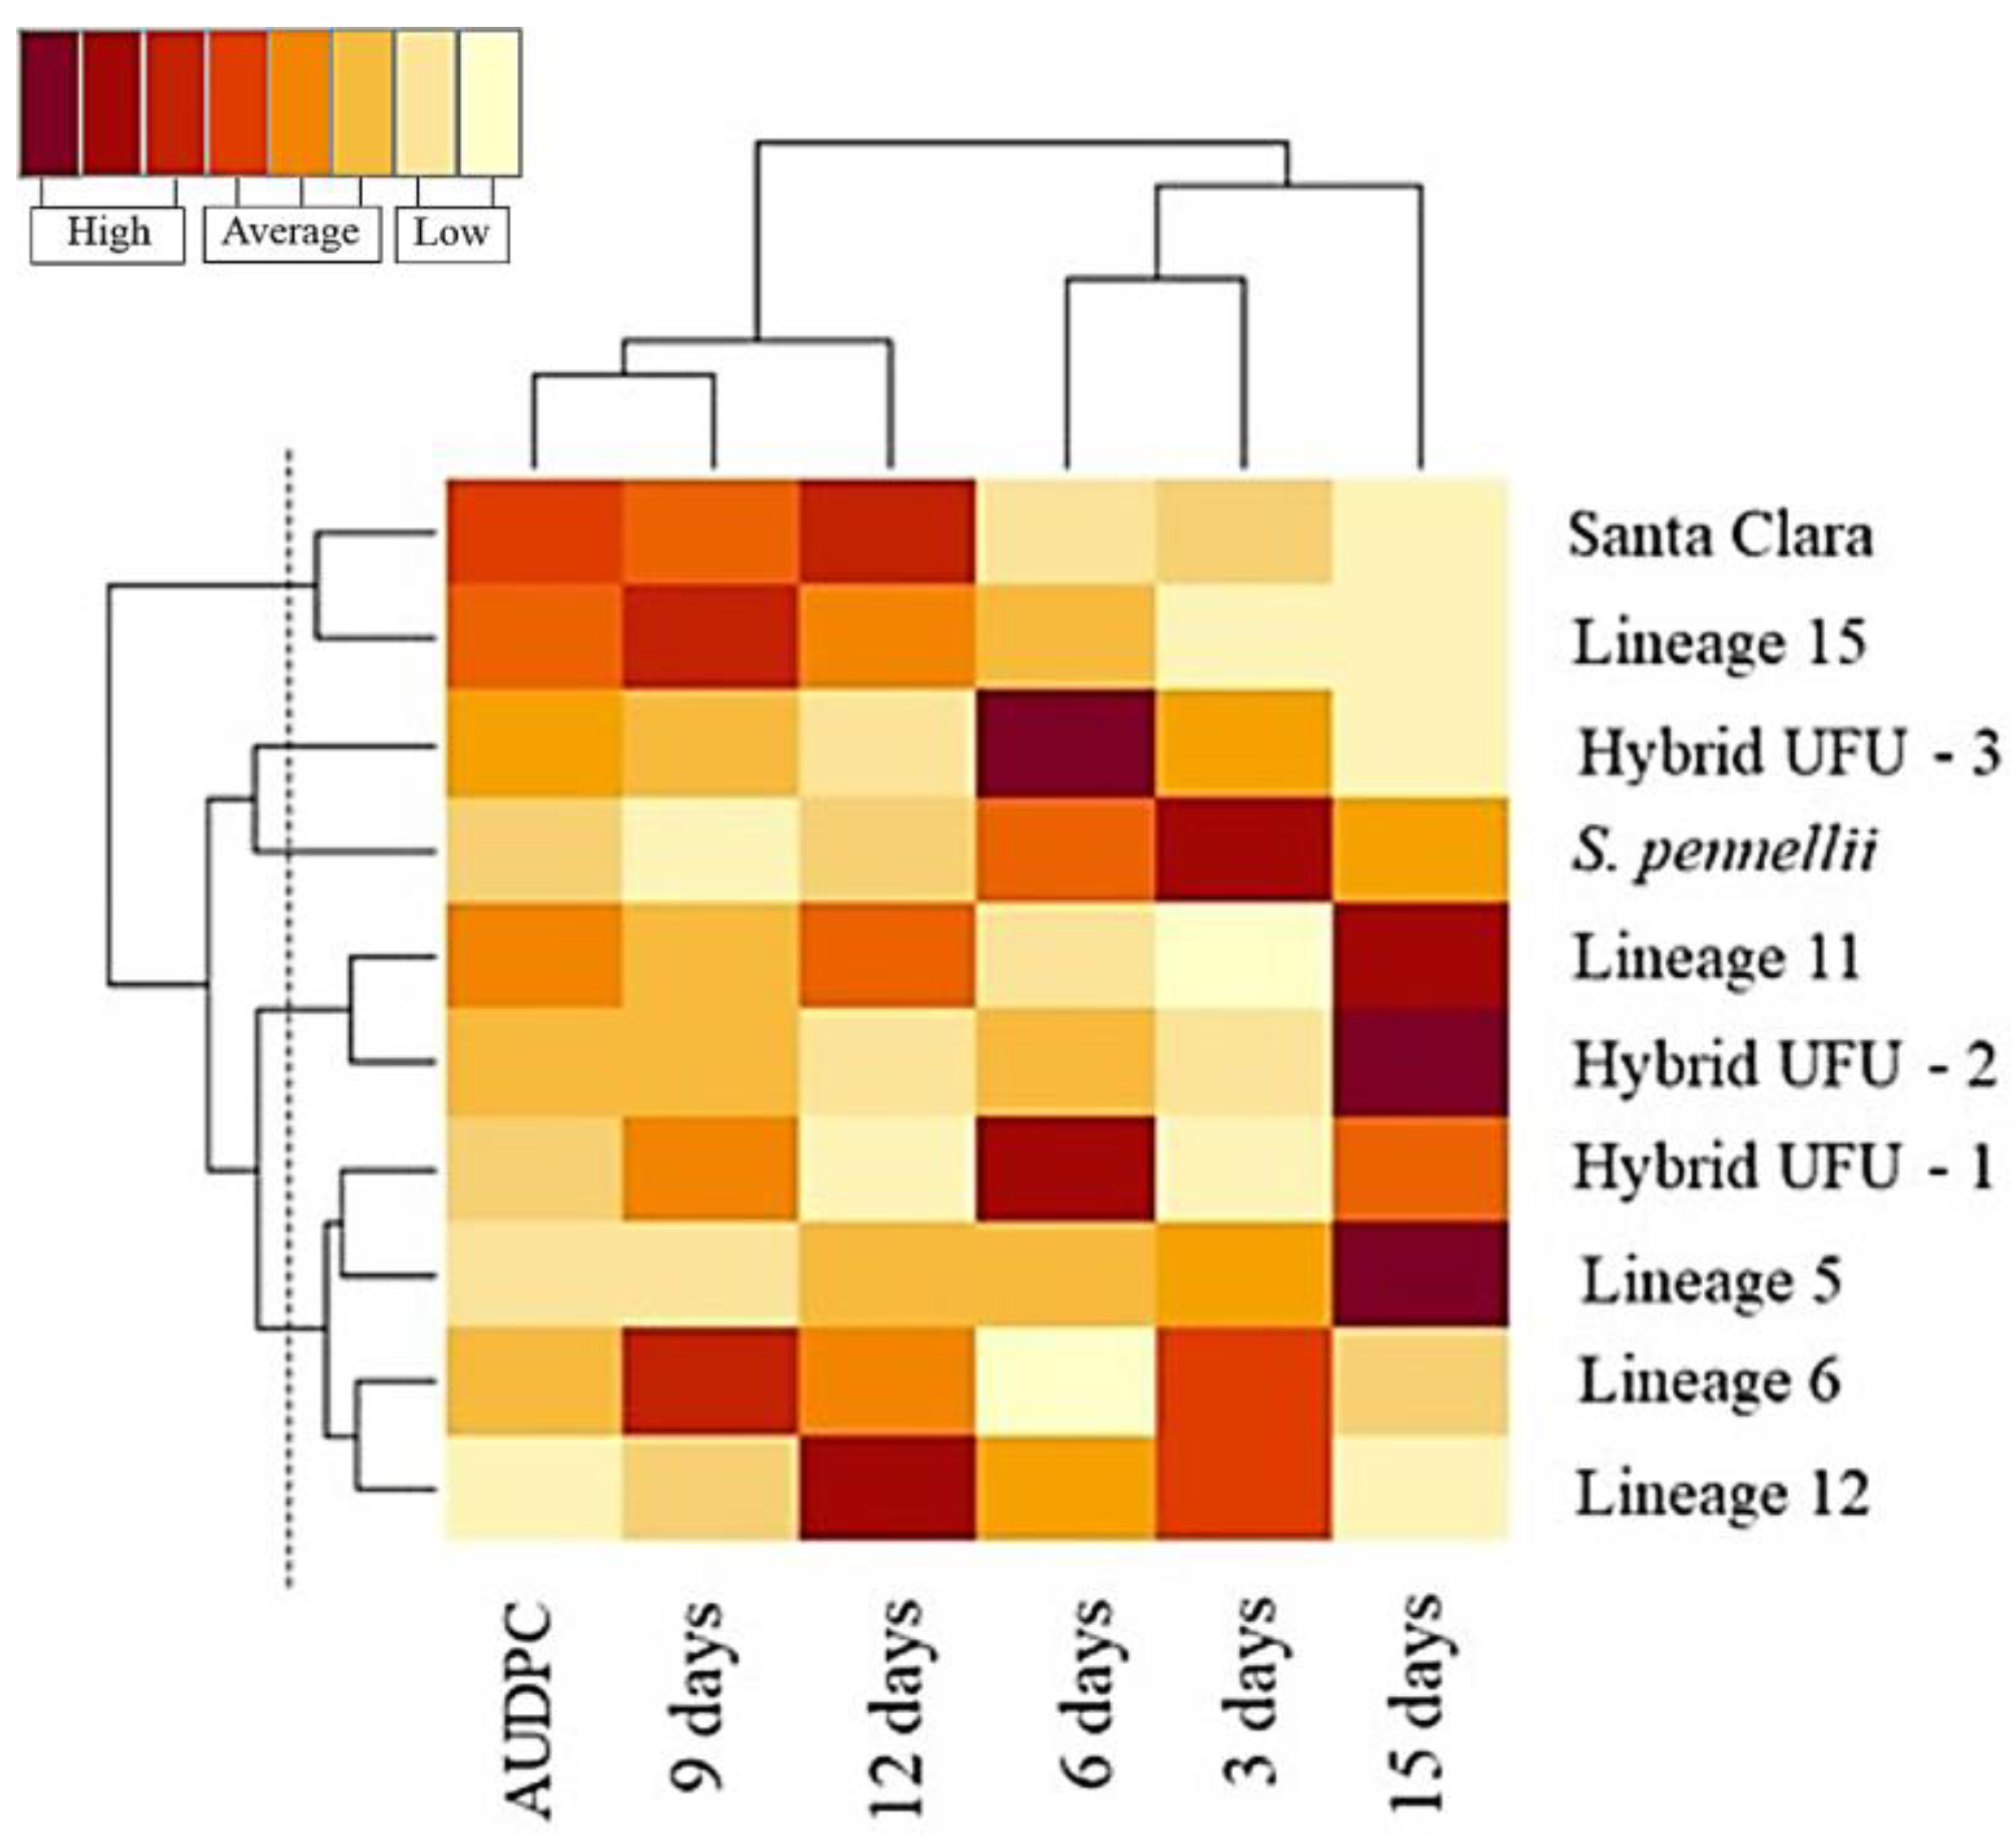
In the heat map, warmer colors (dark brown) indicate higher disease severity. For the AUDPC, it is possible to observe warmer colors for lineages 11 and 15 and cv. Santa Clara, indicating higher disease severity, which could be considered susceptible. In contrast, lineages 5, 6 and 12 and hybrid UFU-1 showed cooler colors (ranging from yellow to orange), indicating possible sources of resistance. All genotypes show relative superiority compared to the Santa Clara cultivar, presenting lower AUDPC (Figure 3).
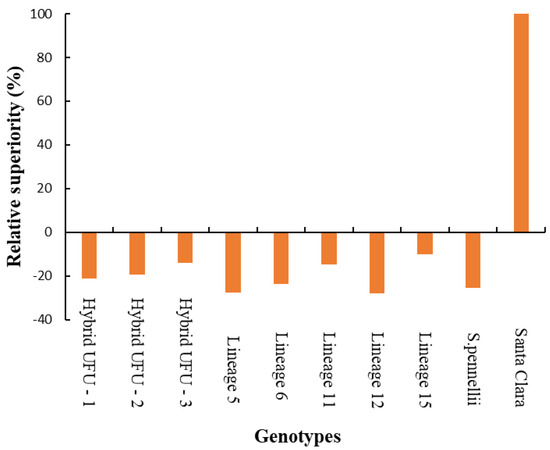
Figure 3.
Relative superiority of ten tomato genotypes compared to the commercial cultivar Santa Clara, for the area under the disease progress curve (AUDPC).
Lineages 15 and 5 showed a disease reduction of −9.93 to −27.69, respectively, compared to the cultivar Santa Clara. The S. pennellii accession exhibited a disease reduction of around −25.62.
4. Discussion
The variable AUDPC is the sum of severities observed throughout the assessments and was the most important variable. Several studies use this variable in disease evaluations [15,24].
At 3 days after inoculation, the wild accession S. pennellii had the highest disease incidence compared to the other genotypes. However, for AUDPC, the wild accession S. pennellii (157.87) showed a disease reduction of 25.62% compared to the Santa Clara cultivar (212.25). This is consistent with the results found by [17], who verified the resistance of the wild accession S. pennellii when using a pathogen concentration of 104 CFU/mL.
The Santa Clara cultivar, considered susceptible, had the highest disease development (212.25), as expected. Similarly, Sá and Tebaldi [15] found an AUDPC of 245.5 for the susceptible cultivar Santa Cruz Kada when using the same concentration of pathogenic inoculum while working with X. hortorum pv. gardneri.
According to the heat map, the cooler colors observed for lineages 5, 6 and 12 and hybrid UFU-1 represent lower disease development, potentially indicative of resistance. These, in turn, showed AUDPCs around 153.47, 161.72, 152.91 and 167.44, respectively, resulting in disease reductions of −27.69, −23.81, −27.96 and −21.11 compared to the susceptible Santa Clara cultivar.
Shi and Panthee [23], in search of genotypes resistant to X. euvesicatoria pv. perforans, found that the genotypes PI 270,443 and PI 114,490 were resistant, showing AUDPCs of 135.5 and 221.5, respectively, corroborating the results found for lineages 5, 6 and 12 and hybrid UFU-1.
Additionally, for the variable AUDPC, the genotypes showed relative superiority compared to the Santa Clara cultivar, highlighting the prominence of these genotypes as a source of resistance.
Considering the importance of bacterial spot disease in tomatoes and the challenges in its control, seeking lineages that are resistant to X. euvesicatoria pv. perforans becomes paramount in the search for better control strategies.
Therefore, further studies need to be conducted involving lineages 5, 6 and 12 and hybrid UFU-1, which showed lower disease severity. These results open new avenues for future research to understand the genes involved in this trait and the possibility of obtaining hybrids with the germplasm characterized in this study.
5. Conclusions
Lineages 5, 6 and 12, hybrid UFU-1 and the wild accession S. pennellii showed the lowest disease severity and the highest relative superiority to cv. Santa Clara, showing promise for future breeding programs in selecting tomato genotypes resistant to Xanthomonas euvesicatoria pv. perforans.
Author Contributions
Conceptualization, N.D.T., G.M.M. and A.C.P.J.; methodology, A.C.P.J., N.D.T. and A.L.A.R.; software, A.C.P.J. and A.L.A.R.; validation, A.C.P.J., A.L.A.R., N.D.T. and G.M.M.; formal analysis, A.C.P.J. and A.L.A.R.; investigation, A.C.P.J. and A.L.A.R.; resources, N.D.T. and G.M.M.; data curation, A.C.P.J. and A.L.A.R.; writing—preparation of the original draft, A.C.P.J., A.L.A.R., N.D.T. and G.M.M.; writing—review and editing, A.C.P.J., N.D.T. and G.M.M.; visualization, A.C.P.J., A.L.A.R., N.D.T. and G.M.M.; supervision, A.C.P.J., A.L.A.R., N.D.T. and G.M.M.; project administration, N.D.T. and G.M.M.; acquisition financing, N.D.T. and G.M.M. All authors have read and agreed to the published version of the manuscript.
Funding
This research was funded by Coordenação de Aperfeiçoamento de Pessoal de Nível Superior, grant number 88887.637115/2021-00, and Universidade Federal de Uberlândia.
Data Availability Statement
The original contributions presented in the study are included in the article, further inquiries can be directed to the corresponding author.
Conflicts of Interest
The authors declare no conflicts of interest.
References
- Li, H.; Chen, A.; Zhao, L.; Bhagayathula, A.S.; Amirthalingam, P.; Rahmani, J.; Salehisahlabadi, A.; Abduzaleem, H.M.; Adebayo, O.; Yin, X. Effect of tomato consumption on fasting blood glucose and lipid profiles: A systematic review and meta-analysis of randomized controlled trials. Phytother. Res. 2020, 34, 1956–1965. [Google Scholar] [CrossRef] [PubMed]
- Vilela, N.J.; Boiteux, L.S.; Teixeira, F.M.V. Tomate: Importância. Available online: https://www.embrapa.br/agencia-de-informacao-tecnologica/cultivos/tomate/pre-producao/socioeconomia/importancia (accessed on 17 February 2024).
- Lopes, C.A.; Ávila, A.C. Doenças do Tomateiro; Embrapa Hortaliças: Brasília, Brazil, 2005; p. 151. [Google Scholar]
- Jones, J.B.; Lacy, G.H.; Bouzar, H.; Stall, R.E.; Schaad, N.W. Reclassification of the Xanthomonas associated with bacterial spot Disease of tomato and pepper. Syst. Appl. Microbiol. 2004, 27, 755–762. [Google Scholar] [CrossRef] [PubMed]
- Constantin, E.C.; Cleenwerck, I.; Maes, M.; Baeyen, S.; Van Malderghem, C.; De Vos, P.; Cottyn, B. Genetic characterization of strains named as Xanthomonas axonopodis pv. dieffenbachiae leads to a taxonomic revision of the X. axonopodis species complex. Plant Pathol. 2016, 65, 792–806. [Google Scholar]
- Morinière, L.; Burlet, A.; Rosenthal, E.R.; Nesme, X.; Portier, P.; Bull, C.T.; Lavire, C.; Fischer-Le Saux, M.; Bertolla, F. Clarifying the taxonomy of the causal agent of bacterial leaf spot of lettuce through a polyphasic approach leads to combine Xanthomonas hortorum Vauterin et al. 1995 and Xanthomonas cynarae Trébaol 2000 emend. Timilsina et al. 2019. Syst. Appl. Microbiol. 2020, 43, 1–43. [Google Scholar] [CrossRef] [PubMed]
- Adhikari, P.; Adhikari, T.B.; Louws, F.J.; Panthee, D.R. Advances and challenges in bacterial spot resistance breeding in tomato (Solanum lycopersicum L.). Int. J. Mol. Sci. 2020, 21, 1–14. [Google Scholar] [CrossRef] [PubMed]
- Inoue-Nagata, A.K.; Lopes, C.A.; Reis, A.; Pereira, R.B.; Quezado-Duval, A.M.; Pinheiro, J.B.; Lima, M.F. Doenças do tomateiro. In Manual de Fitopatologia. Vol. 2 Doenças das Plantas Cultivadas, Eds.; Amorim, L., Bergamin Filho, A., Rezende, J.A.M., Camargo, L.E.A., Eds.; Agronômica Ceres: São Paulo, Brazil, 2016; pp. 697–723. [Google Scholar]
- Araújo, E.R.; Costa, J.R.; Ferreira, M.A.S.V.; Quezado-Duval, A.M. Widespread distribution of Xanthomonas perforans and limited presence of X. gardneri in Brazil. Plant Pathol. 2017, 66, 159–168. [Google Scholar] [CrossRef]
- Potnis, N.; Timilsina, S.; Strayer, A.; Shantharaj, D.; Barak, J.D.; Paret, M.L.; Vallad, G.E.; Jones, J.B. Bacterial spot of tomato and pepper: Diverse Xanthomonas species with a wide variety of virulence factors posing a worldwide challenge. Molecular Plant Pathol. 2015, 16, 907–920. [Google Scholar] [CrossRef] [PubMed]
- Liao, Y.Y.; Strayer-Scherer, A.L.; White, J.; Mukherjee, A.; De La Torre-Roche, R.; Ritchie, L.; Colee, J.; Vallad, G.E.; Freeman, J.H.; Jones, J.B.; et al. Óxido de nanomagnésio: Um novo bactericida contra Xanthomonas perforans tolerante ao cobre que causa manchas bacterianas no tomate. Fitopatologia 2019, 109, 52–62. [Google Scholar]
- Bernal, E.; Liabeufi, D.; Francis, D.M. Evaluating quantitative trait locus resistance in tomato to mutiple Xanthomonas spp. Plant Dis. 2020, 104, 423–429. [Google Scholar] [CrossRef] [PubMed]
- Sharma, S.; Bhattarai, K. Progress in developing bacterial spot resistance in tomato. Agronomy 2019, 9, 1–26. [Google Scholar] [CrossRef]
- Quiao, K.; Liu, Q.; Huang, Y.; Xia, Y.; Zhang, S. Management of bacterial spot of tomato caused by copper-resistant Xanthomonas perforans using a small molecule compound carvacrol. Crop. Prot. 2020, 132, 105114. [Google Scholar] [CrossRef]
- Vieira de Sá, G.N.; Tebaldi, N.D. Inactivated bacterial suspension to control tomato bacterial spot. Trop. Plant Pathol. 2022, 47, 583–589. [Google Scholar] [CrossRef]
- Kado, C.I.; Heskett, M.G. Selective media for isolation of Agrobacterium, Corynebacterium, Erwinia, Pseudomonas and Xanthomonas. Phytopathology 1970, 60, 969–976. [Google Scholar] [CrossRef] [PubMed]
- Sharlach, M.; Dahlbeck, D.; Liu, L.; Chiu, J.; Jiménez-Gómez, J.M.; Kimura, S.; Koenig, D.; Maloof, J.N.; Sinha, N.; Minsavage, G.V.; et al. Fine genetic mapping of RXopJ4, a bacterial spot disease resistance locus from Solanum pennellii LA716. Theor. Appl. Genet. 2013, 126, 601–609. [Google Scholar] [CrossRef] [PubMed]
- Maciel, G.M.; Siquieroli, A.C.S.; Gallis, R.D.A.; Pereira, L.M.; Sales, V.F. Programa de Computador BG a Biofort; Universidade Federal de Uberlândia: Uberlandia, Brazil, 2019. [Google Scholar]
- Mello, S.C.; Takatsu, A.; Lopes, C.A. Escala diagramática para avaliação da mancha bacteriana do tomateiro. Fitopatol. Bras. 1997, 22, 447–448. [Google Scholar]
- Shaner, G.; Finney, R.E. The effect of nitrogen fertilization on the expression of slow mildewing resistance in Knox wheat. Phytopathology 1977, 67, 1051–1056. [Google Scholar] [CrossRef]
- Mantel, N. The detection of disease clustering and a generalized regression approach. Cancer Res. 1967, 27, 209–220. [Google Scholar] [PubMed]
- R Core Team, 2023. R: A Language and Environment for Statistical Computing. R Foundation for Statistical Computing, Vienna, Austria. Available online: https://www.R-project.or (accessed on 5 February 2024).
- Shi, R.; Panthee, D.R. Transcriptome-Based Analysis of Tomato Genotypes Resistant to Bacterial Spot (Xanthomonas perforans) Race T4. Int. J. Mol. Sci. 2020, 21, 4070. [Google Scholar] [CrossRef] [PubMed]
- Ferreira, F.S.; Tebaldi, N.D.; Oliveira, C.A. Photodynamic inactivation to control Xanthomonas gardneri in tomato seeds. Trop. Plant Pathol. 2021, 46, 559–564. [Google Scholar] [CrossRef]

Disclaimer/Publisher’s Note: The statements, opinions and data contained in all publications are solely those of the individual author(s) and contributor(s) and not of MDPI and/or the editor(s). MDPI and/or the editor(s) disclaim responsibility for any injury to people or property resulting from any ideas, methods, instructions or products referred to in the content. |
© 2024 by the authors. Licensee MDPI, Basel, Switzerland. This article is an open access article distributed under the terms and conditions of the Creative Commons Attribution (CC BY) license (https://creativecommons.org/licenses/by/4.0/).