Article

Influence of High-Voltage Corona Discharge on Drying Kinetics and Physicochemical Properties of Alfalfa at Various Air-Gap Spacings

by
Mengheng Guo
,
Yingying Qian
,
Jiamin Yuan
and
Zhiqing Song
*
College of Science, Inner Mongolia University of Technology, Hohhot 010051, China
*
Author to whom correspondence should be addressed.
Agronomy 2024, 14(6), 1235; https://doi.org/10.3390/agronomy14061235
Submission received: 10 May 2024 / Revised: 4 June 2024 / Accepted: 5 June 2024 / Published: 7 June 2024
(This article belongs to the Section Agricultural Biosystem and Biological Engineering)

Abstract

:
The high nutritional value of alfalfa hay makes it a widely utilized component in animal feed. However, the current prevalent drying methods for forage have a significantly detrimental impact on the quality of alfalfa during the drying process. This study investigates the effects of high-voltage corona discharge (HVCD) treatment on post-cut alfalfa. Gradient experiments are conducted by adjusting the air-gap spacing at a voltage of 25 kV. The results demonstrate that as the distance decreases, there is an observed increase in the drying rate, rehydration rate, and color intensity of the HVCD-treated material. HVCD treatment significantly enhances crude protein content, which increases with decreasing air-gap spacing. Meanwhile, it negatively affects lignin, neutral detergent fiber (NDF), and acid detergent fiber (ADF) levels. The relative forage quality (RFQ) of alfalfa reaches its peak at an air-gap spacing of 7 cm. The application of HVCD disrupts the fiber structure and induces significant electroporation effects in cells. Minimal changes in functional groups preserve nutrient integrity. Furthermore, HVCD exhibits lower energy consumption compared to hot air dryers. The HVCD treatment is a highly efficient and effective method, with a gradual improvement in alfalfa hay quality as the air-gap distance decreases.

1. Introduction

Alfalfa, a leguminous plant renowned as the “pasture king”, is an indispensable feed source in animal husbandry due to its high protein content and abundance of vitamins and minerals [1,2]. It plays a pivotal role in promoting the growth and development of animals. In the breeding industry, alfalfa serves as a high-quality forage and plays a crucial role in both concentrated feed and compound feed formulations. This not only ensures the provision of comprehensive and balanced nutrition but also contributes to cost reduction in feed and the enhancement of economic benefits in livestock production [3].
To improve the quality and utilization rate of forage grass and extend its shelf life, alfalfa is usually made into hay. However, alfalfa hay generally has some problems in the market, such as a low crude protein content, low relative feeding value, and unstable product quality. The root cause of these problems lies in its drying method. At present, common methods of alfalfa treatment include traditional natural drying and artificial drying [4]. The study conducted by Bambang Suwignyo et al. revealed a decline in the quality of alfalfa, irrespective of whether it was naturally dried or subjected to hot air drying [5]. However, conventional drying methods are time-consuming and susceptible to environmental factors, thereby compromising the subsequent drying quality. Although hot air drying offers rapid dehydration, it leads to significant nutrient loss [6]. Hence, there is an urgent need for a non-thermal and efficient approach to alfalfa processing.
In recent years, the application of high-voltage corona discharge (HVCD) technology has become increasingly prevalent in the seed pretreatment and food drying fields due to its unique technical advantages and significant processing effects [7]. The high-voltage corona electric field is a localized phenomenon of corona discharge, resulting from the ionization of air under the influence of a non-uniform electric field. The degree of gas ionization is influenced by the spatial distribution of the electric field, with a higher charge density at the electrode tip leading to a smaller curvature radius, stronger electric fields, and increased electron mobility [8]. HVCD technology has been widely employed in the pretreatment and drying processes of various foods, including hawthorn, mushrooms, and jackfruit slices. When applied to hawthorn treatment, HVCD technology effectively eliminates surface dirt and pesticide residues while preserving the original nutritional components and flavor [9]. For mushrooms, HVCD technology enables rapid and uniform drying without compromising heat-sensitive ingredients or diminishing their texture and nutritional value [10]. Similarly, when used for jackfruit slices, HVCD technology significantly enhances drying efficiency while reducing energy consumption; it also preserves their distinctive aroma and taste [11]. Research indicates that HVCD technology offers numerous advantages: Firstly, it consumes less energy than traditional drying methods, resulting in substantial energy savings. Secondly, it is environmentally friendly, as it does not generate harmful substances or emissions—aligning with modern green sustainable development concepts. Additionally, HVCD technology achieves uniform drying without issues such as unevenness or localized overheating, which are commonly associated with traditional methods. Furthermore, HVDC technology exhibits a remarkable sterilization effect by effectively eliminating microorganisms in food products, thereby extending their shelf life [12].
Currently, the limited utilization of scientific and advanced methods in forage processing severely hampers the progress of animal husbandry and the forage processing industry. Investigating the impact of HVCD treatment on cut alfalfa can offer a non-thermal drying method with low energy consumption and high nutrient retention, thereby addressing this issue. Notably, there is currently a dearth of research investigating the application of HVCD treatment specifically for alfalfa. Therefore, this study employs HVCD technology to treat fresh alfalfa and comprehensively investigates how varying the air-gap spacing influences its drying characteristics under identical voltage conditions. Additionally, an evaluation is conducted to assess quality improvements and microstructural changes in dried alfalfa following treatment, aiming to achieve superior dried alfalfa quality.

2. Materials and Methods

2.1. Experimental Materials

Zhongmu No. 3 alfalfa cultivated in the laboratory was used as the experimental material (111°40′ E, 40°50′ N), and the alfalfa was harvested at the maturity stage, when the flowers were approximately 10% open, by cutting it 3 cm above the root. The harvested alfalfa was promptly subjected to processing, and its initial moisture content was determined as 75% ± 3%. To ensure high-quality alfalfa during the drying process, damaged and spoiled samples were manually excluded. The alfalfa samples with a similar plant height, cluster density, and leaf area were segregated into stem and leaf components prior to being cut into approximately 3 cm lengths and homogenized to the maximum extent possible.

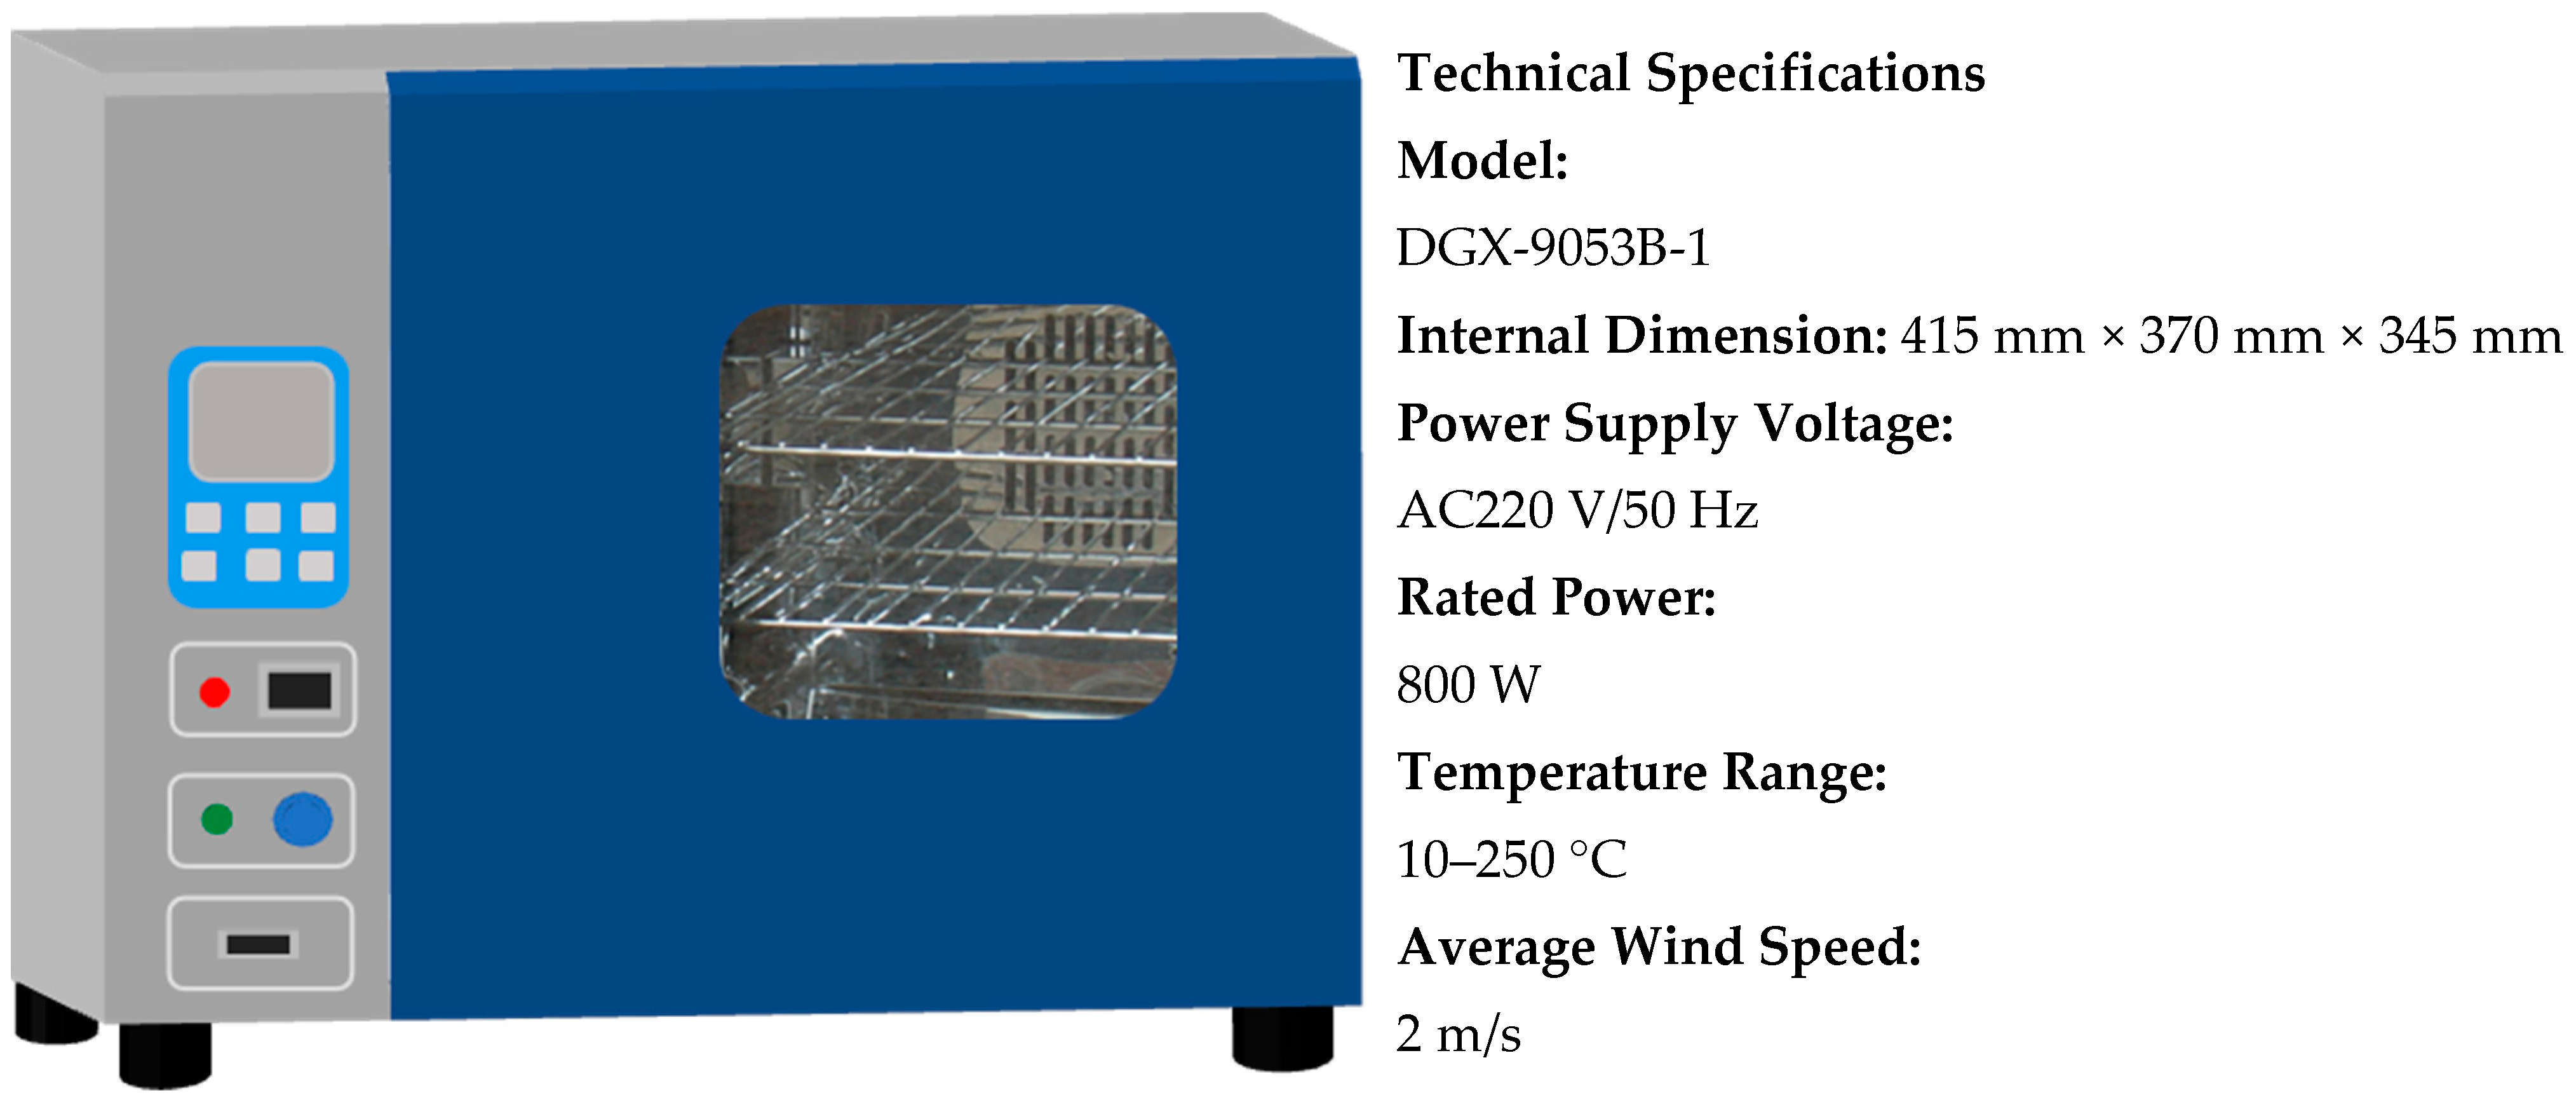
2.2. Instruments and Equipment

The experimental setup utilized in this study was a pin array plate dielectric barrier HVCD device, as illustrated in Figure 1. This device is equipped with various high-voltage power supplies, including a DC pulse and high-frequency AC options, allowing for the switching of different gases, adjustment of the air-gap spacing and gas flow rate, and measurement of temperature and humidity during the drying process. The high-voltage power supply control system (model: YD(JZ)-1.5/50, Wuhan Boyu Electric Power Equipment Co., Ltd., Wuhan, China) enables adjustable AC and DC output voltages within the ranges of 0~50 kV and 0~70 kV, respectively. In this experiment, an AC voltage was employed due to it having a superior drying effect to DC power [7]. The needle-shaped electrode is connected to a high-power control system, while the ground electrode consists of an aluminum plate with dimensions of 1000 mm in length, 550 mm in width, and 5 mm in thickness. In addition, a 4 mm thick polyethylene insulation board with a dielectric constant of 2.8 is placed on top of the grounding electrode. The tip electrode of the electrode system consists of a multi-needle electrode measuring 75 cm × 28 cm, comprising a total of 98 needles. Adjacent needle-shaped electrodes are spaced at intervals of 40 mm, with adjacent needle tips positioned at distances of 20 mm from each other. Each needle-shaped electrode possesses a diameter of 1 mm and a length of 20 mm, featuring a tip curvature radius of 0.5 mm and a tip length of 1 mm. In contrast, as shown in Figure 2, a hot air drying (HAD) oven was used for the control group (model: DGX-9053B-1, Shanghai Fangyuan Experimental Instrument Co., Ltd., Shanghai, China). This oven has an inner chamber size of 415 mm × 370 mm × 345 mm and a temperature range of 10 °C to 250 °C, which can be adjusted by inputting a rated power of 800 W; the average wind speed of the device is 2 m/s. Throughout the duration of the experiment, the ambient room temperature was maintained at 24 ± 3 °C while maintaining an air humidity level of 30% RH.

2.3. Empirical Method

The prepared alfalfa sample was placed in a plastic square dish with dimensions of 210 mm × 140 mm as the base, with a thickness of approximately 20 mm. Each group had a mass ranging from 21.0 to 22.0 g. Subsequently, the samples were subjected to different drying methods: air dry (AD) at room temperature (with a wind speed of 0 m/s), HAD in an oven set to 55 °C, and HVCD treatment under a voltage of 25 kV with various air-gap spacings (7 cm, 8.5 cm, and 10 cm). The quality of the alfalfa samples was measured using an electronic balance (BS124S, Shanghai Guanglu Electronic Technology Co., Ltd., Shanghai, China) every two hours until their water content fell below 17%, upon which the drying process was terminated.

2.4. Determination of Ion Wind Rate in High-Voltage Electric Field

The ionic wind speed at 25kV with different air-gap spacings was measured using a hot-wire anemometer (405i, Ruice Electronics Technology Co., Ltd., Guangzhou, China). Each group was independently repeated three times, and the average value was obtained.

2.5. Voltage and Current Measurement

The signals were fed into an oscilloscope (RIGOL MSO5204) through a high-voltage probe (Tektronix P6015A, 75 MHz, Beaverton, OR, USA) and a current probe (PEARSON U.S.A., 120 MHz, New York, NY, USA). The voltage and current variations were measured at a voltage of 25 kV for various air-gap spacings.

2.6. Alfalfa Moisture Content Determination

The moisture content and drying rate of alfalfa during the drying process can be measured using the methods below [13]. The moisture content of alfalfa during drying is defined as follows:
M i = m i m g m g × 100 %
M R = M i M e M 0 M e
where mg is the dry mass of the alfalfa, mi is the quality of the alfalfa at the time of drying, M0 is the water content of the alfalfa at the time of 0, Mi is the water content of the alfalfa at the time of drying to i, Me is the equilibrium water content of the alfalfa, and MR is the water content of the alfalfa.
The formula for calculating the drying rate [14] is as follows:
D R = M t M t + Δ t Δ t
where DR represents the drying rate, Mt corresponds to the water content of the alfalfa at time t, Mt+∆t denotes the water content at time t + ∆t, and ∆t represents the time interval from time t to time t + ∆t.

2.7. Rehydration Rate

The dried alfalfa was immersed in a water bath maintained at a constant temperature of 37 °C for a duration of 7 h. Subsequently, the rehydrated alfalfa was carefully extracted from the bath, and any residual surface moisture was thoroughly absorbed using filter paper [15]. The quantification of the pre- and post-rehydration quality of alfalfa was conducted by employing an electronic balance. The rehydration rate [16] of alfalfa can be calculated using the following formula:
R R = m a m b
where RR is the rehydration rate of the alfalfa, ma is the mass of the alfalfa after rehydration, and mb is the mass of the alfalfa before rehydration.

2.8. Alfalfa Color Difference Measurement

The surface brightness value L*, redness value a*, and yellowness value b* of the dry alfalfa were measured using an automatic color difference meter (3nh-NR60CP, Shenzhen, China) under different treatment methods. The experiment was repeated 15 times for each sample, and the average value was considered the experimental result.

2.9. Determination of Nutrient Composition of Alfalfa

The determination of crude protein (CP) in the alfalfa was conducted using a FOSS Kjeltec 8400 automatic nitrogen determination instrument (Kjeltec 8400, Foss, Denmark) [17]. Near-infrared spectroscopy was employed to determine non-fiber carbohydrate (NFC) and lignin content [18]. Acid detergent fiber (ADF) and neutral detergent fiber (NDF) were determined using conventional detergent methods and an ANKOM automatic fiber analysis system [19,20,21]. The relative forage quality (RFQ) [22] was calculated using the following formula:
D M I   % B W = 120 N D F   % D M
T D N = 82.38 0.751 × A D F
R F Q = T D N × D M I 1.23
where TDN represents the total digestible nutrients and DMI denotes the dry matter intake.

2.10. Study on Infrared Spectrum

The treated alfalfa sample was finely ground and then mixed with potassium bromide at a ratio of 1:100. Subsequently, the mixture was further ground to ensure homogeneity. The resulting powdered mixture underwent sieving before being compressed into particles using a press (model: HY-12, manufacturer: Jiangyin Huayu Pharmaceutical Machinery Co, Ltd., Jiangyin, China). Finally, the prepared sample was subjected to a Fourier transform infrared spectroscopy analysis within a wave number range of 400–4000 cm1 using a high-resolution instrument (Model: Nicolet iS10, Thermo Fisher Scientific, Waltham, MA, USA). The spectral resolution was below 0.4 cm1, the beam accuracy was less than 0.01 cm1, and the scanning frequency amounted to 32 times. The data were processed using OMNIC 8.0 (Thermo Fisher, Waltham, MA, USA) and PeakFit® software version 4.12 (Seasolve Software Inc., San Jose, CA, USA).

2.11. Scanning Electron Microscopy (SEM)

The alfalfa sample was affixed to conductive tape and securely positioned on the sample table. Subsequently, a thin layer of gold was applied using an ion-sputtering coater. Scanning electron microscopy (SEM) images were then acquired at a magnification of 250 times using a Hitachi Hi-tech Corporation SU8020 SEM model in Tokyo, Japan. The scanning voltage was set at 5 kV, with a spot size of 3.5 mm. The objective lens aperture measured 30 microns, while the working distance was maintained at 8 mm. The same regions on different samples were scanned to obtain corresponding SEM images.

2.12. Measurement of Specific Energy Consumption per Drying Unit of High-Voltage Electric Field

The measurement of specific energy consumption (SEC) per drying unit in a high-voltage electric field refers to the amount of energy required for the evaporation of 1 kg of water under the influence of said electric field [23]. The calculation formula is as follows:
S E C = V × I m 0 m t × Δ t
where V and I are the voltage and current, ∆t is the time used for the drying process, m0 is the quality of the grass before drying, and mt is the quality when its water content reaches 17%.

2.13. Statistical Analysis

Experimental data were obtained through three independent measurements and are presented as the mean ± standard deviation. Basic data statistics were performed using Excel 2020 software, plotting was conducted using Origin2021 software, and a significance analysis was carried out using SPSS 18.0 software. The differences between the treatment groups were analyzed using one-way analysis of variance (ANOVA), and group distinctions were determined through post hoc tests, including least significant difference (LSD) and Duncan’s test at a significance level of p < 0.05.

3. Results

3.1. Drying Characteristics

3.1.1. Analysis of Ion Wind Velocity Measurement Results

The significance of ion wind speed in the drying process cannot be overlooked, as it exerts a notable influence on both the efficiency and velocity of drying [24]. For example, when a needle electrode is charged with a negative voltage, an abundance of positive ions accumulates at the tip of the needle electrode within the electric field established between the needle and plate electrodes. Under the influence of electric field force, electrons migrate towards the plate electrode through collisions with air molecules, resulting in the amplification of both electrons and ions sharing identical polarity. This drives the directed motion of electrons and ions with a consistent polarity, ultimately leading to ion wind formation [25].
The information depicted in Figure 3 presents the measurement results elucidating the fluctuation pattern of ion wind speed at various air-gap spacings. Under a maintained voltage of 25 kV, when the air-gap spacings are set to 7 cm, 8.5 cm, and 10 cm, the ion wind speeds measure 0.5272 m/s, 0.3312 m/s, and 0.1986 m/s, respectively. With an increase in the electrode distance, a gradual decline is observed in ion wind speed. This observation aligns with the findings reported by Jie F et al. [26] regarding the ion wind velocity in a metal mesh, thus corroborating their research outcomes.

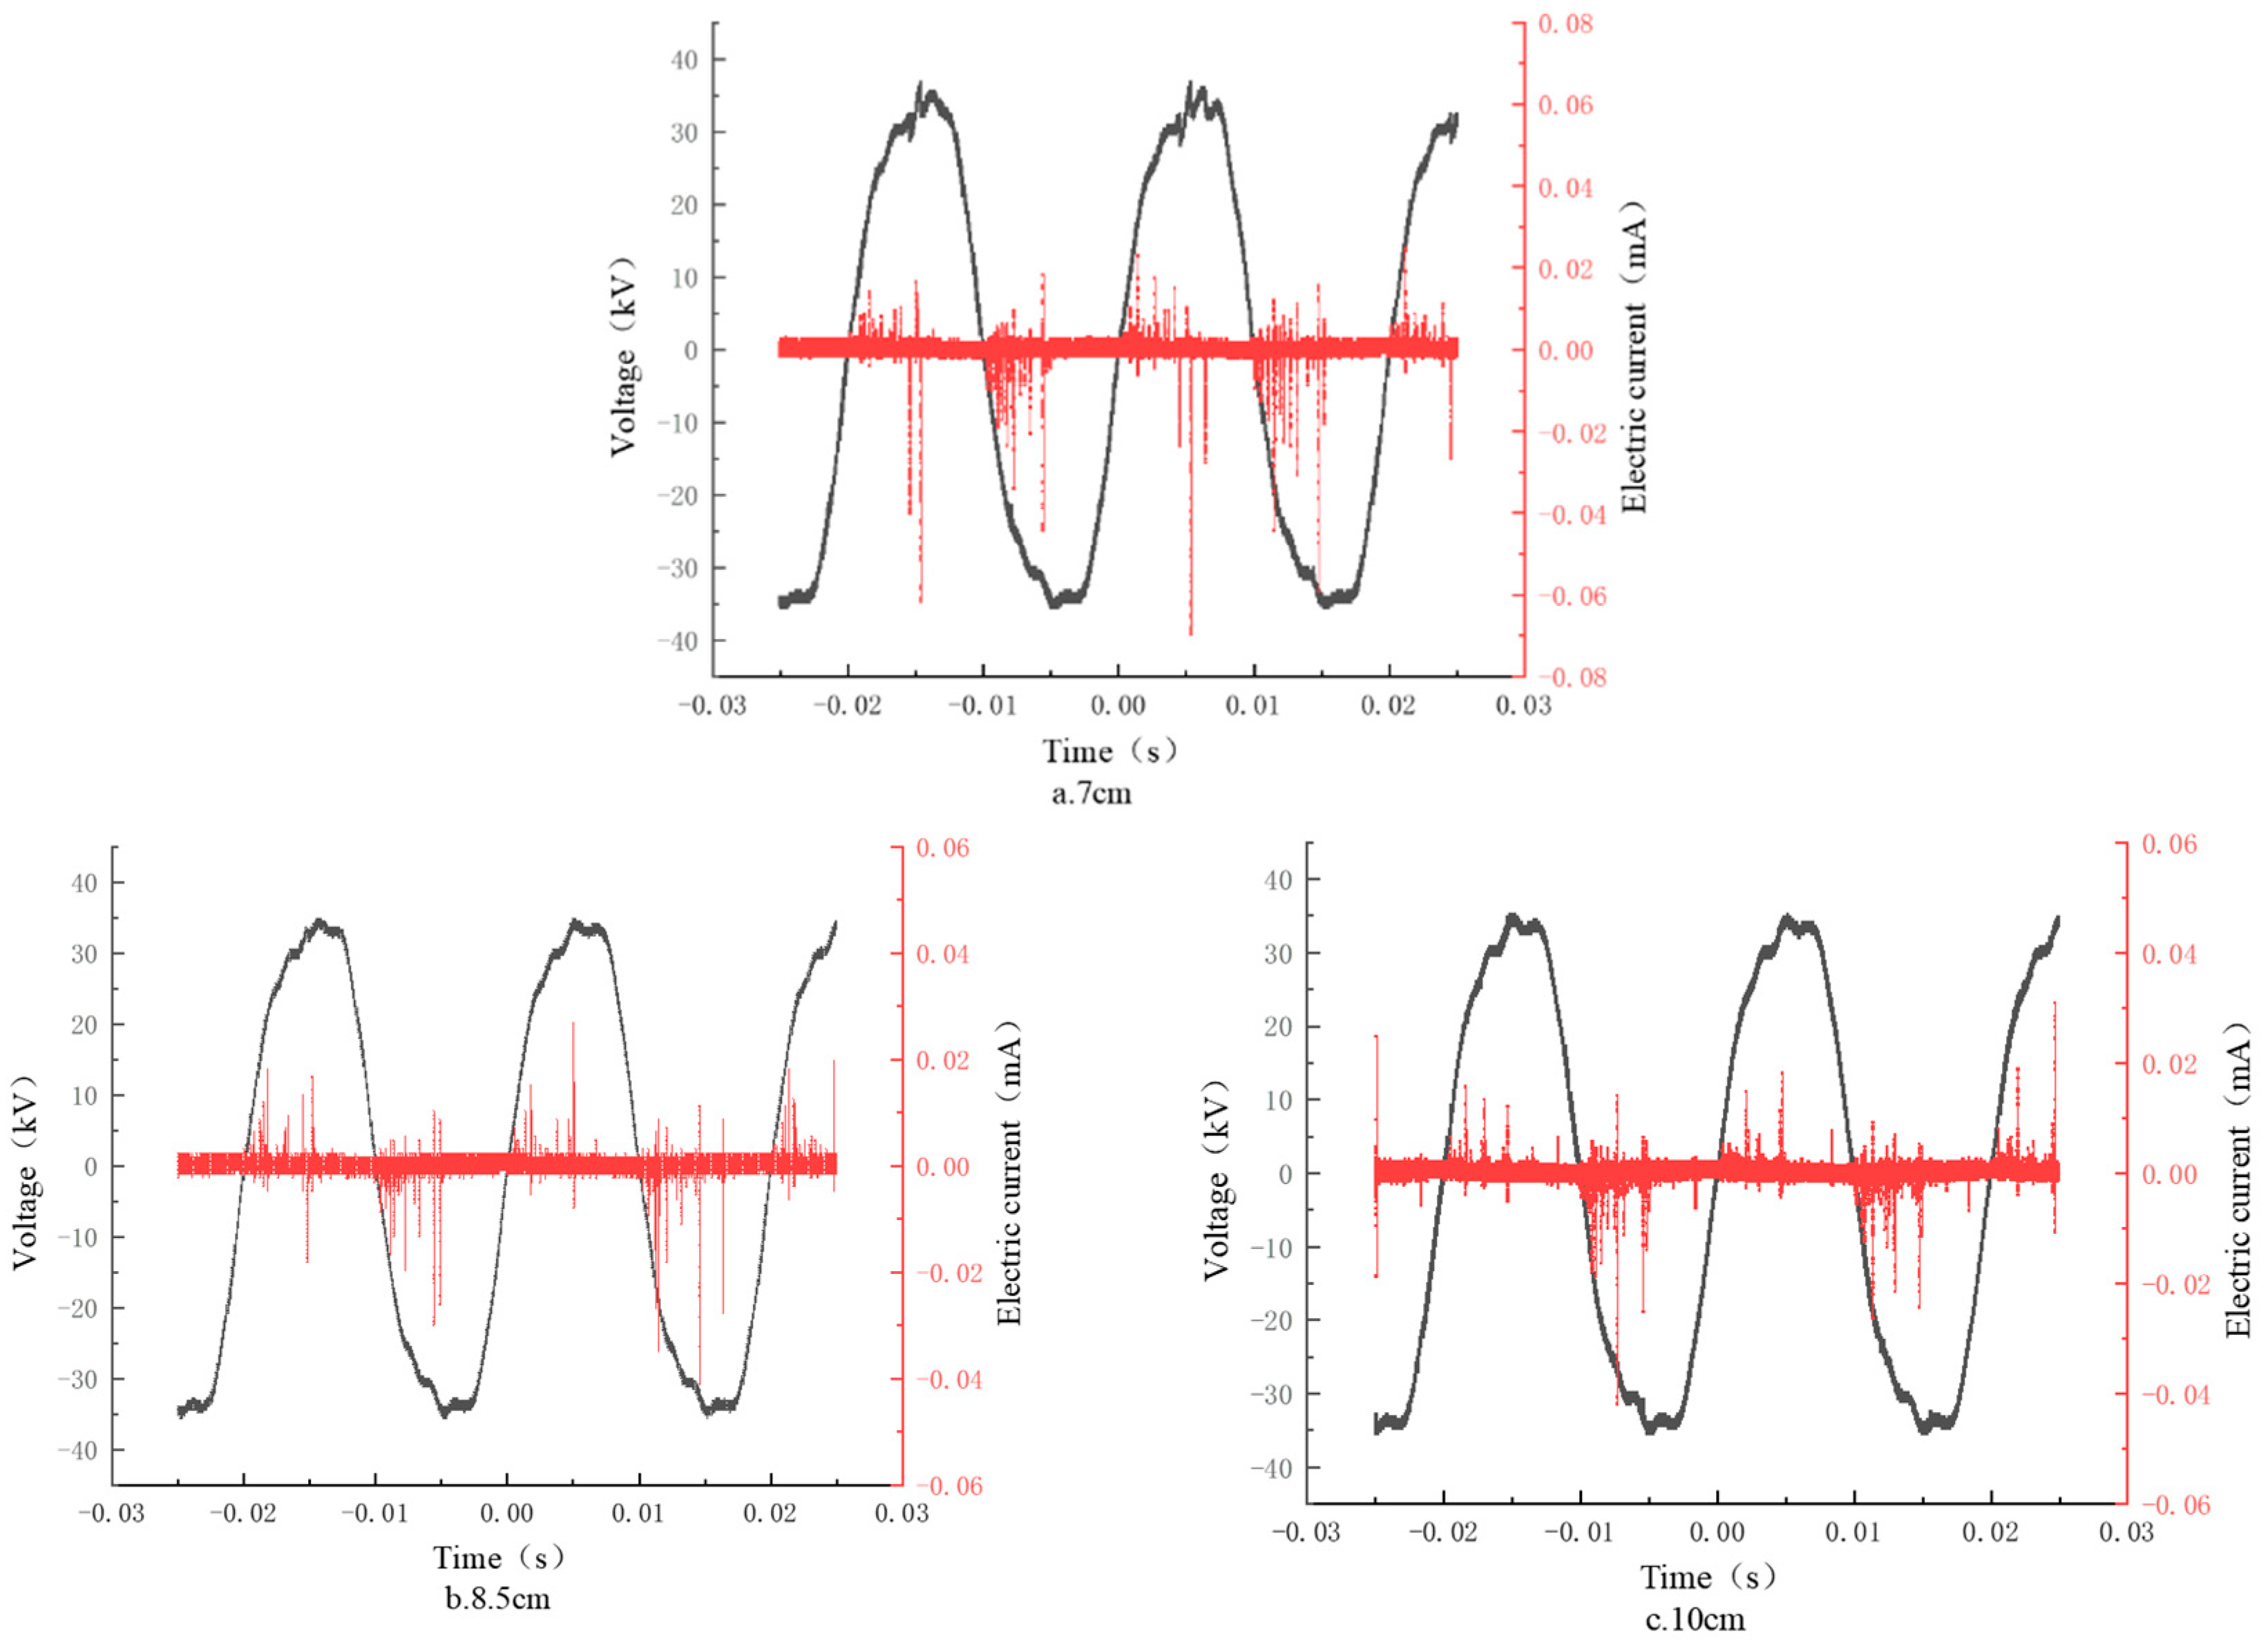
3.1.2. Waveforms of Voltage and Current

The impact of various air-gap spacings on the 25 kV voltage, as depicted in Figure 4, is found to be insignificant. However, a reduction in the air-gap spacing leads to an increase in both the frequency of pole discharge and the amplitude of the current within a single cycle. The relationship between the corona discharge current and ion concentration reflects the interplay of physical processes, including electric field strength, gas ionization, and ion motion during the discharge process. As the current increases, there is a corresponding rise in the ion concentration. By precisely controlling the magnitude of the corona discharge current, the effective regulation of the ion concentration within the discharge space can be achieved, thereby enabling the precise control of the entire discharge process [27].

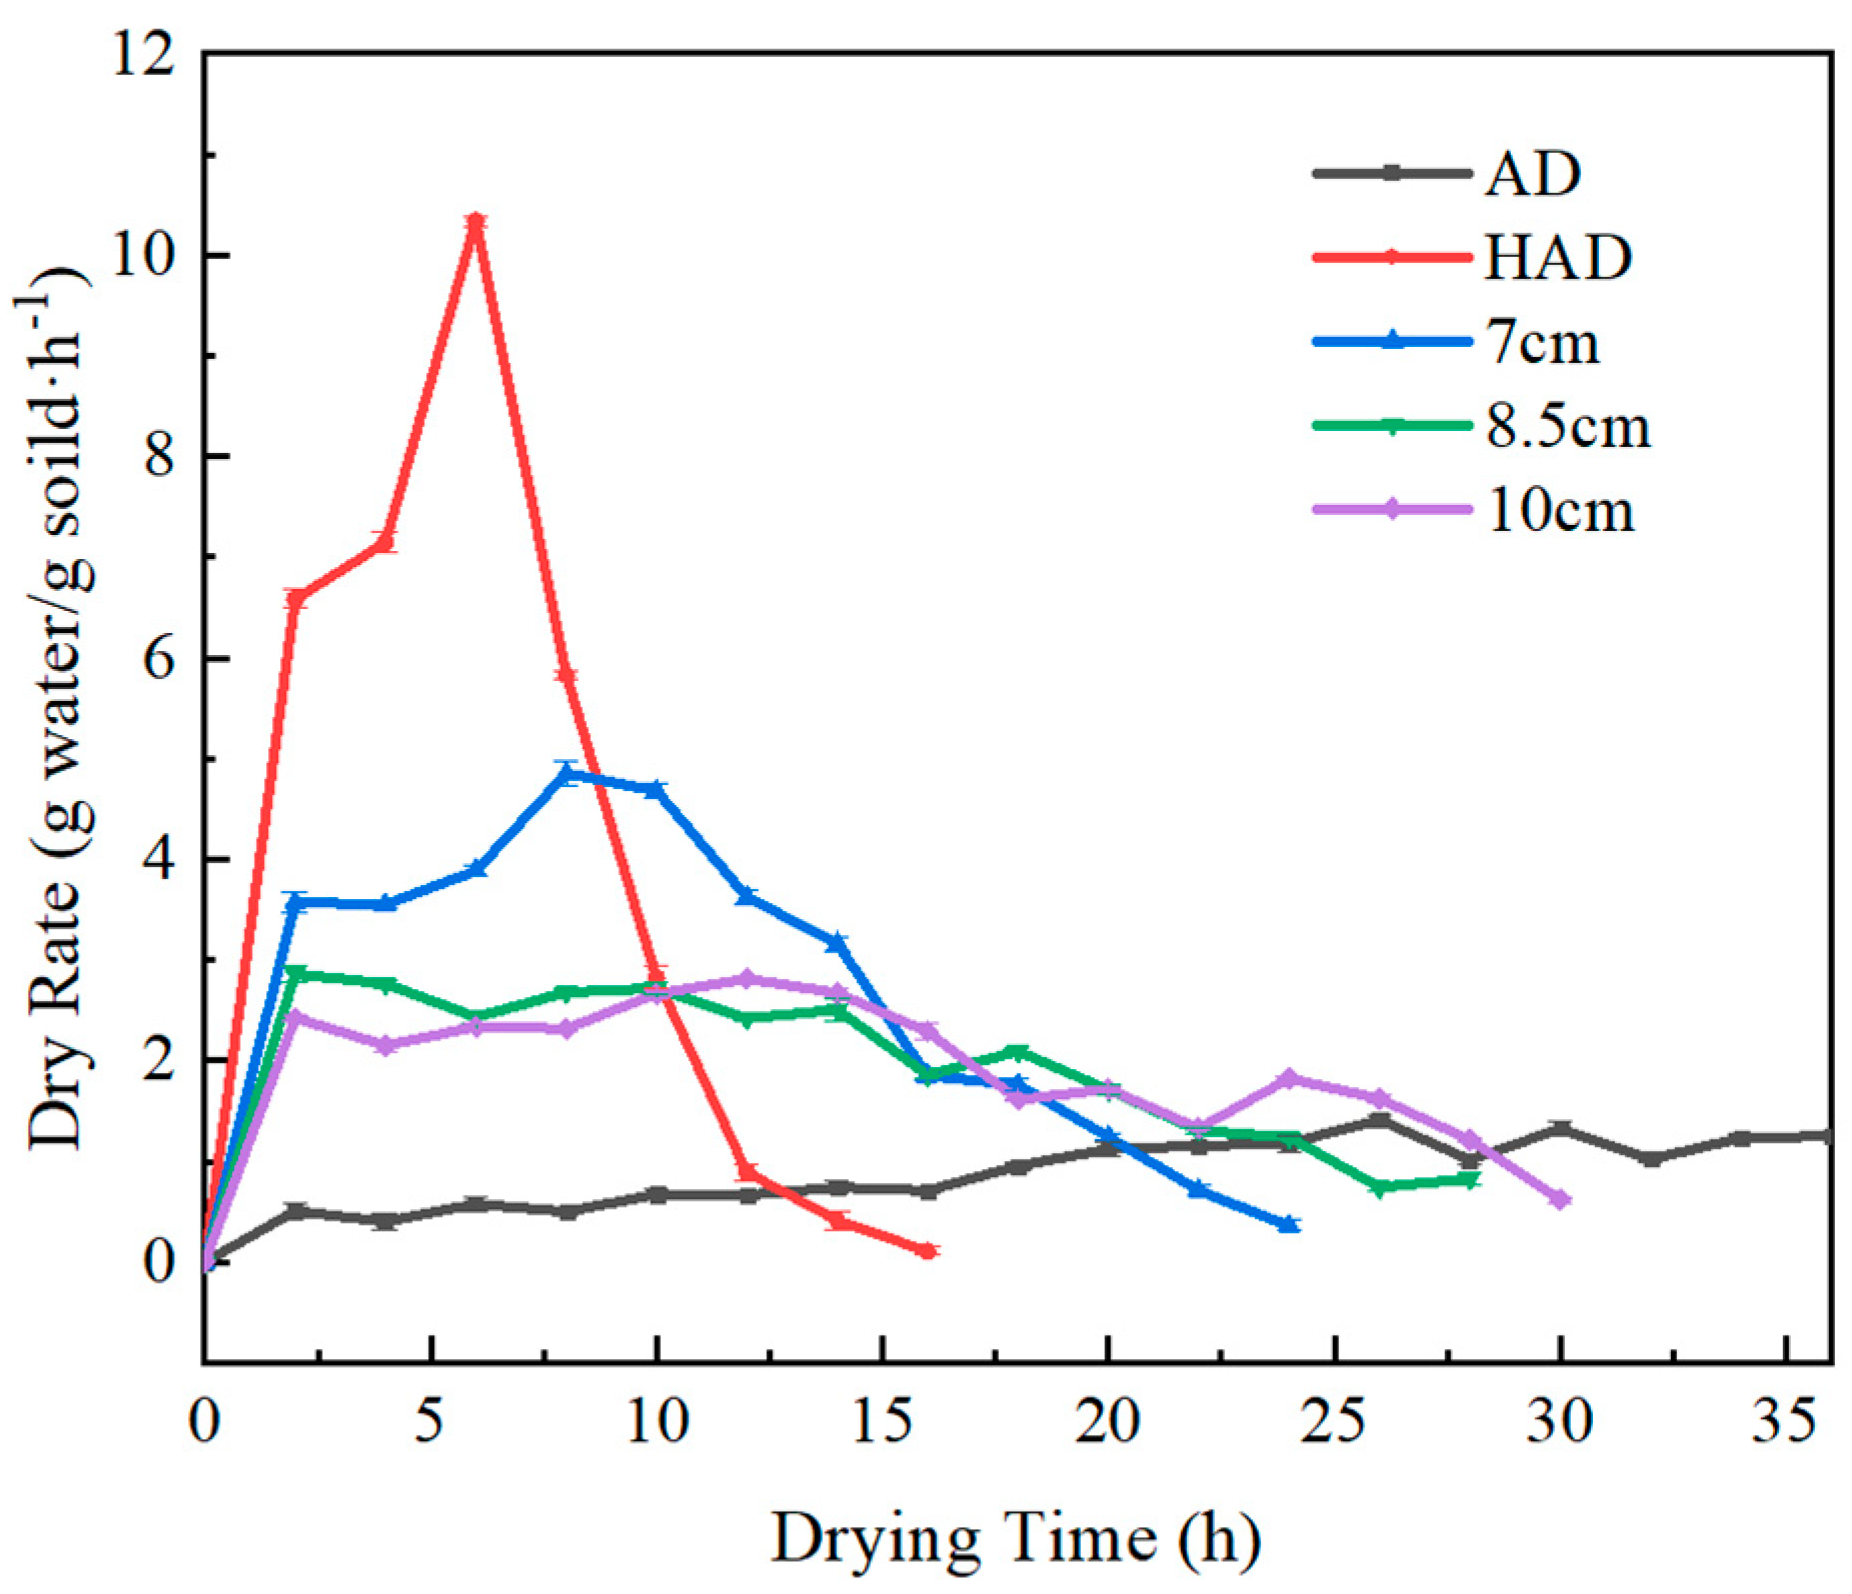
3.1.3. Analysis of Drying Rate and Drying Time

As shown in Figure 5 and Figure 6, the AD group exhibits a relatively consistent drying rate within a specific range; however, it demonstrates the slowest rate and requires the longest time for complete drying. Initially, the HAD group shows a faster drying rate, which gradually decelerates over time, ultimately achieving the shortest duration with optimal performance. In contrast, the HVCD group displays significantly superior drying rates to the AD group, with its required time reduced by 3.25 times at maximum levels and by 1.67 times at minimum levels. Furthermore, both the drying rate and duration of the HVCD group exhibit an approximate inverse relationship with the air-gap spacing. The HAD group exhibited significant differences (p < 0.05) compared to the other groups. The conclusion is consistent with the findings of Srivastav S et al. [28] and Pratiwi et al. [29], who used electrohydrodynamics with electrode distance variation to process carrots and potatoes. These findings provide substantial evidence validating the efficacy of HVCD treatment in accelerating alfalfa’s drying process.

3.2. Quality

3.2.1. Rehydration Rate

Rehydration is a crucial parameter for characterizing the restoration of dry products to their original state after water absorption, and it is determined by the internal structure of alfalfa [30,31]. However, during drying, irreversible cell rupture and dislocation lead to reduced hydrophilicity and water absorption capacity, causing the dried product to typically not regain its initial moisture content upon rehydration [30]. As shown in Figure 7, the rehydration rates of the alfalfa in the AD group and HAD group were 2.331 and 2.406, respectively. Furthermore, under different air-gap spacings, the rehydration rates of the alfalfa were found to be 2.708, 2.577, and 2.475. The rehydration rate of alfalfa treated with HVCD exhibited a significant disparity compared to the control groups treated with AD or HAD (p < 0.05). Additionally, there was a notable discrepancy in rehydration rates observed across different air-gap spacings (p < 0.05). The findings of Srivastav S et al. are in line with our conclusion [27]. In conclusion, HVCD drying can enhance the rehydration performance of alfalfa due to its non-thermal nature, which minimizes damage to internal cells while only affecting material surfaces through generated ion wind action.

3.2.2. Color Analysis

The color of a product plays a pivotal role in determining its quality, and visual indicators hold significant importance when it comes to alfalfa hay. The greenness and brightness of the dried grass after the drying process are highly important factors. A higher degree of greenness coupled with a lower yellow value signifies superior color quality [32,33]. During the drying process, issues such as browning, pigment degradation, and oxidation are likely to occur [34]. As depicted in Figure 8 and Table 1, the brightness of the alfalfa treated with HVCD exhibited an increase of 7–12% compared to that of the AD group, and it also showed improvement over the HAD group. The highest level of brightness was achieved at an air-gap spacing of 7 cm. In terms of redness, the HAD group displayed the lowest value, while the HVCD group had slightly lower values than the AD group. Redness gradually decreased with decreasing polar distance. The yellow degree of the alfalfa samples reached the minimum at an air-gap spacing of 7 cm, whereas it was the highest for the samples dried using the HAD methods. Yellowness progressively decreased as the electrode distance decreased. To summarize, reducing the electrode distance enhances the color quality and reduces the drying time for alfalfa while significantly mitigating oxidation and discoloration.

3.3. Nutritional Quality

3.3.1. Lignin Content

Nutritional quality is a pivotal evaluation parameter for assessing forage quality, directly impacting the palatability and digestibility of feedstock. Lignin, as a polyphenolic polymer, plays a crucial role in limiting fiber digestibility in ruminants, and diets with a higher lignin content can impede nutrient digestion [35]. As depicted in Figure 9, the alfalfa treated with HVCD exhibited a significantly reduced lignin content compared to the AD group. As the air-gap spacing decreased, there was a gradual reduction in the lignin content. Moreover, different air-gap spacings exerted significant effects on the lignin content (p < 0.05).

3.3.2. Crude Protein Content

Protein is a vital constituent of the animal body, and forage crude protein serves as the primary source of protein essential for animal growth [36]. The content of crude protein is closely associated with animal production performance, slaughter performance, and the quality of animal products [37]. As depicted in Figure 9, the alfalfa treated with HVCD at various air-gap spacings exhibited an increase in the crude protein content by 5.4%, 4.1%, and 1.1% compared to the AD control group and by 4.5%, 3.1%, and 0.3% compared to the HAD group. The crude protein content of the alfalfa gradually increased as the air-gap spacing decreased. The crude protein content of the alfalfa was found to be susceptible to drying time and temperature; longer drying times and higher temperatures resulted in lower levels of crude protein content. Although HVCD has a longer drying time than HAD, it belongs to non-thermal drying. During the drying process, the temperature of alfalfa does not increase, so it can also significantly increase the crude protein content of alfalfa.

3.3.3. NFC/NDF

The ratio of non-fibrous carbohydrate (NFC) to neutral detergent fiber (NDF) in forage exerts a significant impact on animal growth [38,39]. As per the findings of Chen Qian et al. [40], a higher NFC/NDF ratio demonstrates a more favorable influence on sheep weight, rumen fermentation, microbial community composition, and fermentation characteristics. As shown in Figure 9 and Table 2, the NFC/NDF ratios were 1.22, 1.29, 1.44, 1.23, and 1.31 for the AD group, HAD group, and HVCD groups with air-gap spacings of 7 cm, 8.5 cm, and 10 cm, respectively. The NFC/NDF ratio decreased with the decrease in the air-gap spacing. The results indicate that HVCD technology effectively enhances the nutritional quality of alfalfa (p < 0.05).

3.3.4. NDF and ADF Contents

As a major constituent of plant fiber, neutral detergent fiber (NDF) typically consists of hemicellulose, cellulose, and lignin [41]. It exhibits a relatively slow degradation rate. An excessive NDF content may impede the intake and utilization efficiency of ruminants for roughage [42]. Moreover, acid detergent fiber (ADF) content directly influences the digestibility efficacy of forage; generally, a higher ADF content corresponds to lower digestibility [43]. Figure 9 shows that, in the AD group, HAD group, and HVCD groups with air-gap spacings of 7 cm, 8.5 cm, and 10 cm, the alfalfa exhibited NDF contents of 25.93%, 22.7%, 21.37%, 23.3%, and 23.4%, while the ADF contents were recorded as 29.74%, 28.96%, 26.61%, 29.26%, and 28.75%, respectively. With the decrease in the air-gap spacing, both the NDF and ADF contents in the alfalfa showed a decreasing trend. HVCD treatment significantly reduced both the NDF and ADF contents, specifically at an electrode distance of 7 cm, where they were notably lower than in the other groups (p < 0.05). However, no significant difference was observed in the NDF and ADF contents between the air-gap spacings of 8.5 cm and 10 cm (p > 0.05).

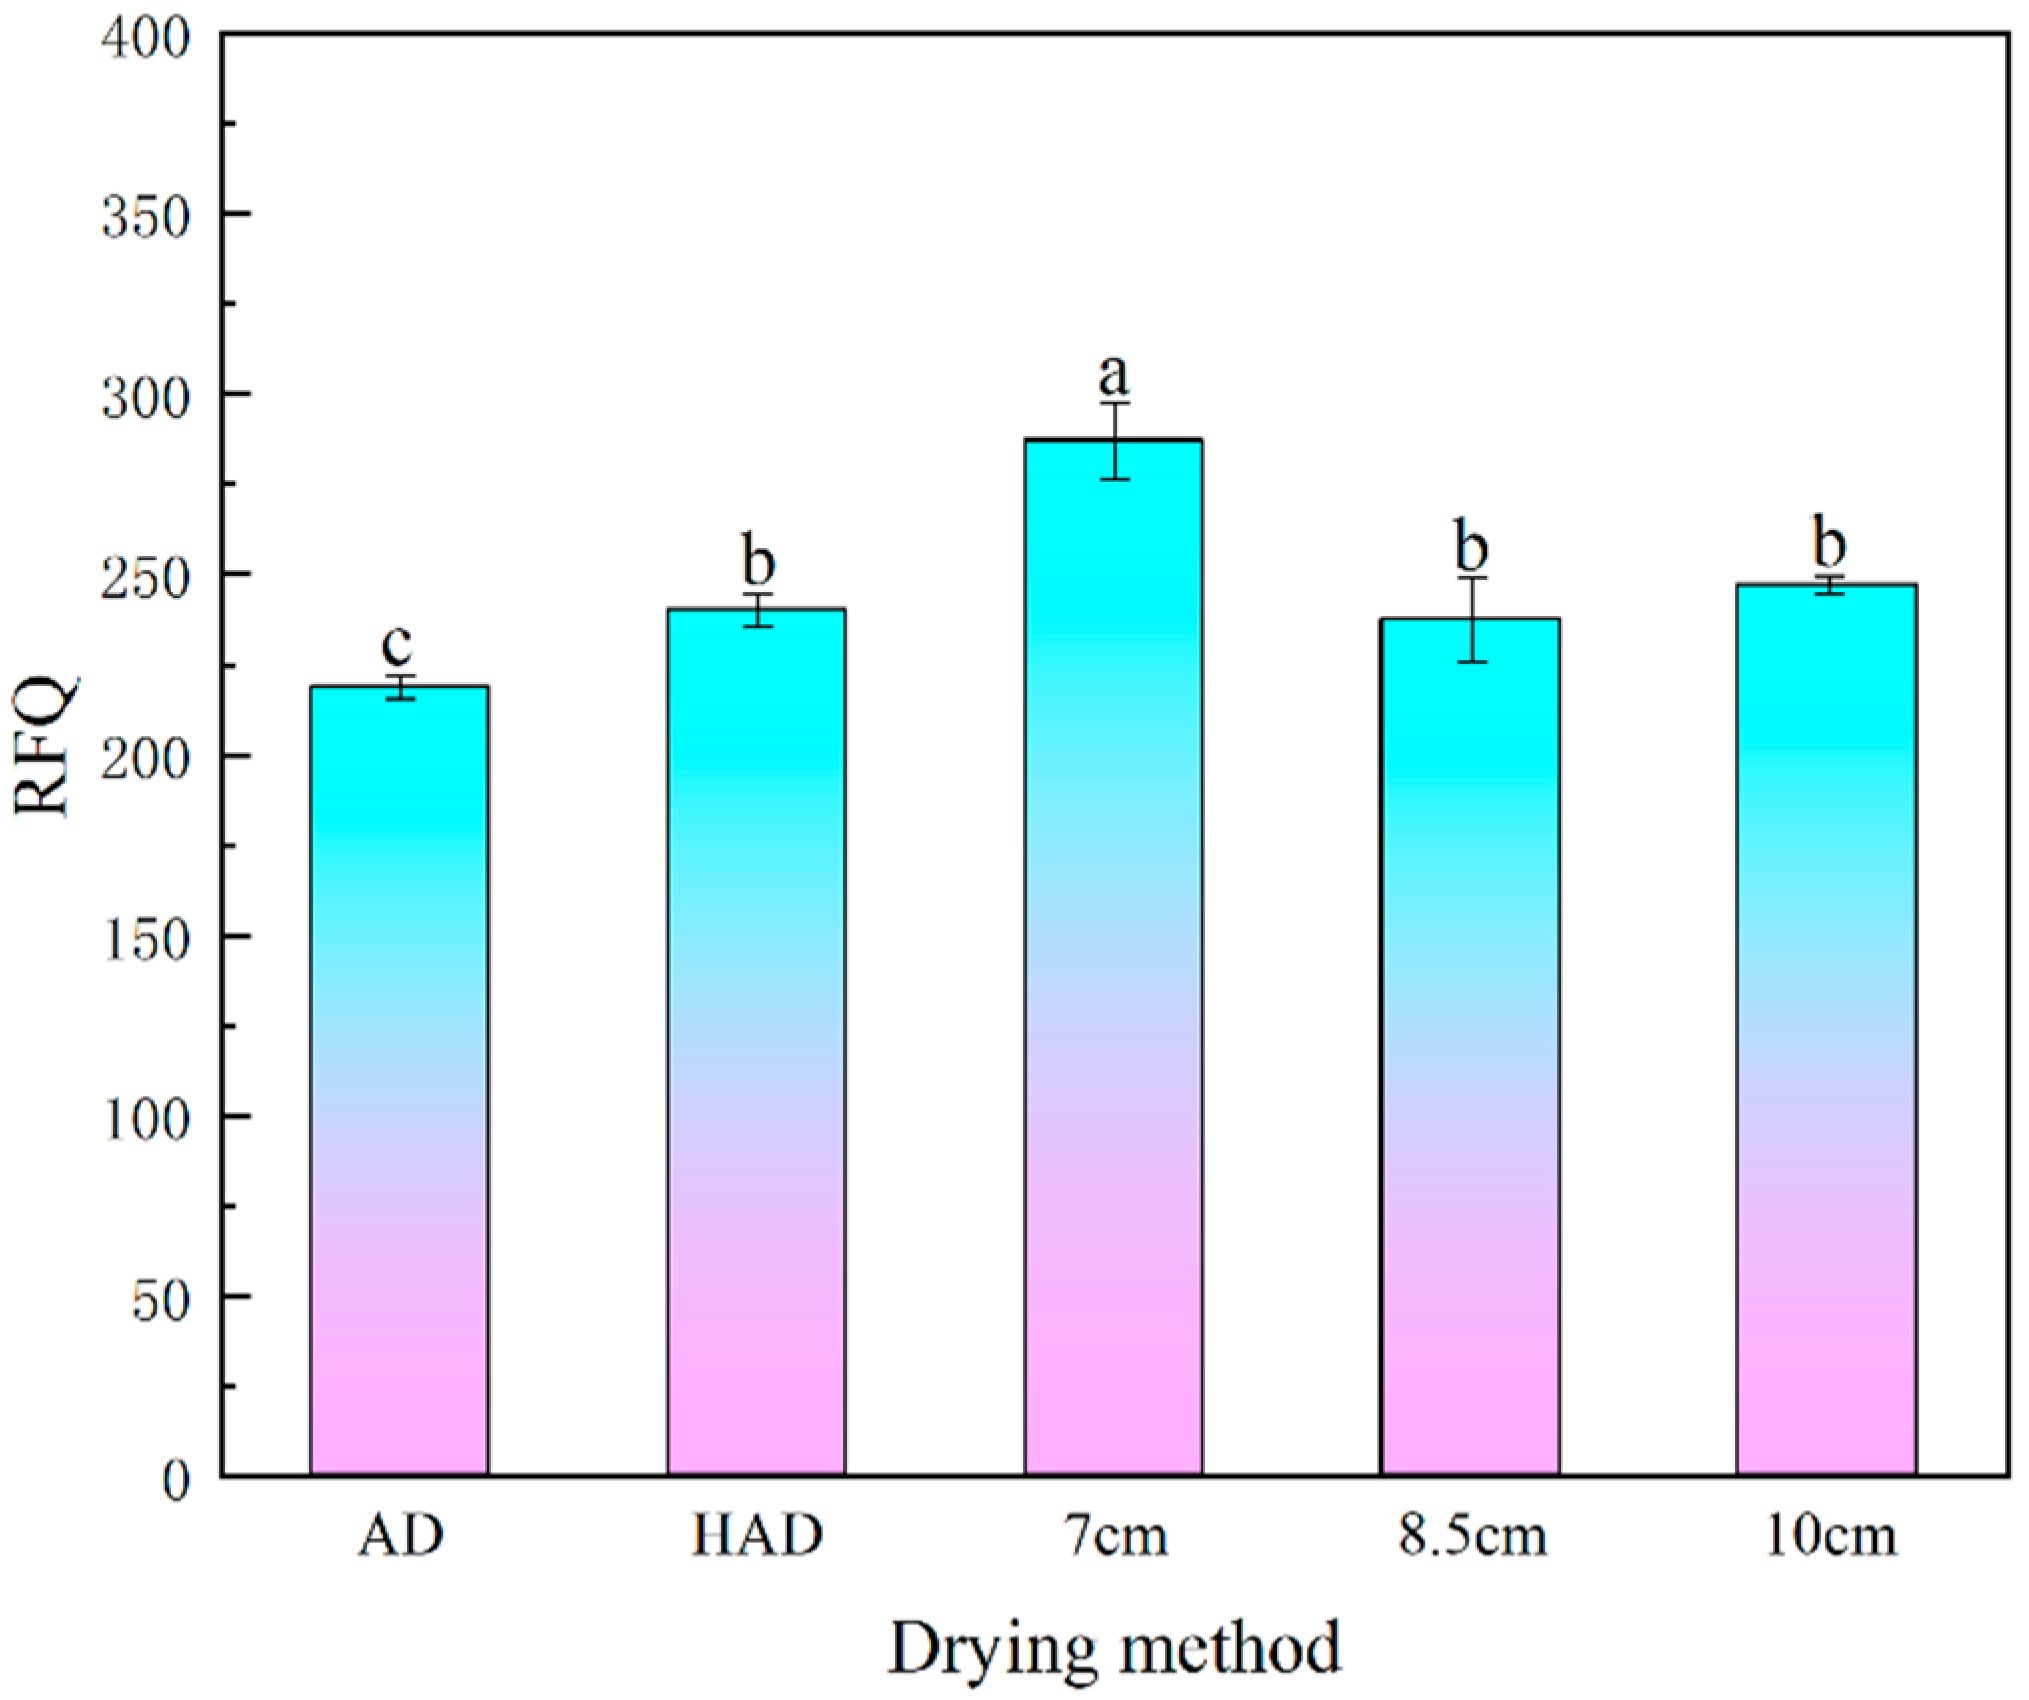
3.3.5. Relative Forage Quality

Relative forage quality serves as a crucial indicator of forage quality, with higher RFQ values indicating superior quality and promoting sustainable development in animal husbandry [44,45]. As depicted in Figure 10, when the electrode distance was 7 cm, the alfalfa exhibited the highest RFQ value. Moreover, the RFQ of the HVCD-treated alfalfa significantly surpassed that of the AD group (p < 0.05), particularly at air-gap spacings of 7 cm and 10 cm, where it even exceeded that of the HAD group. The RFQ differences between the alfalfa samples in the HAD group and HVCD groups with air-gap spacings of 8.5 cm and 10 cm were not found to be statistically significant (p > 0.05).

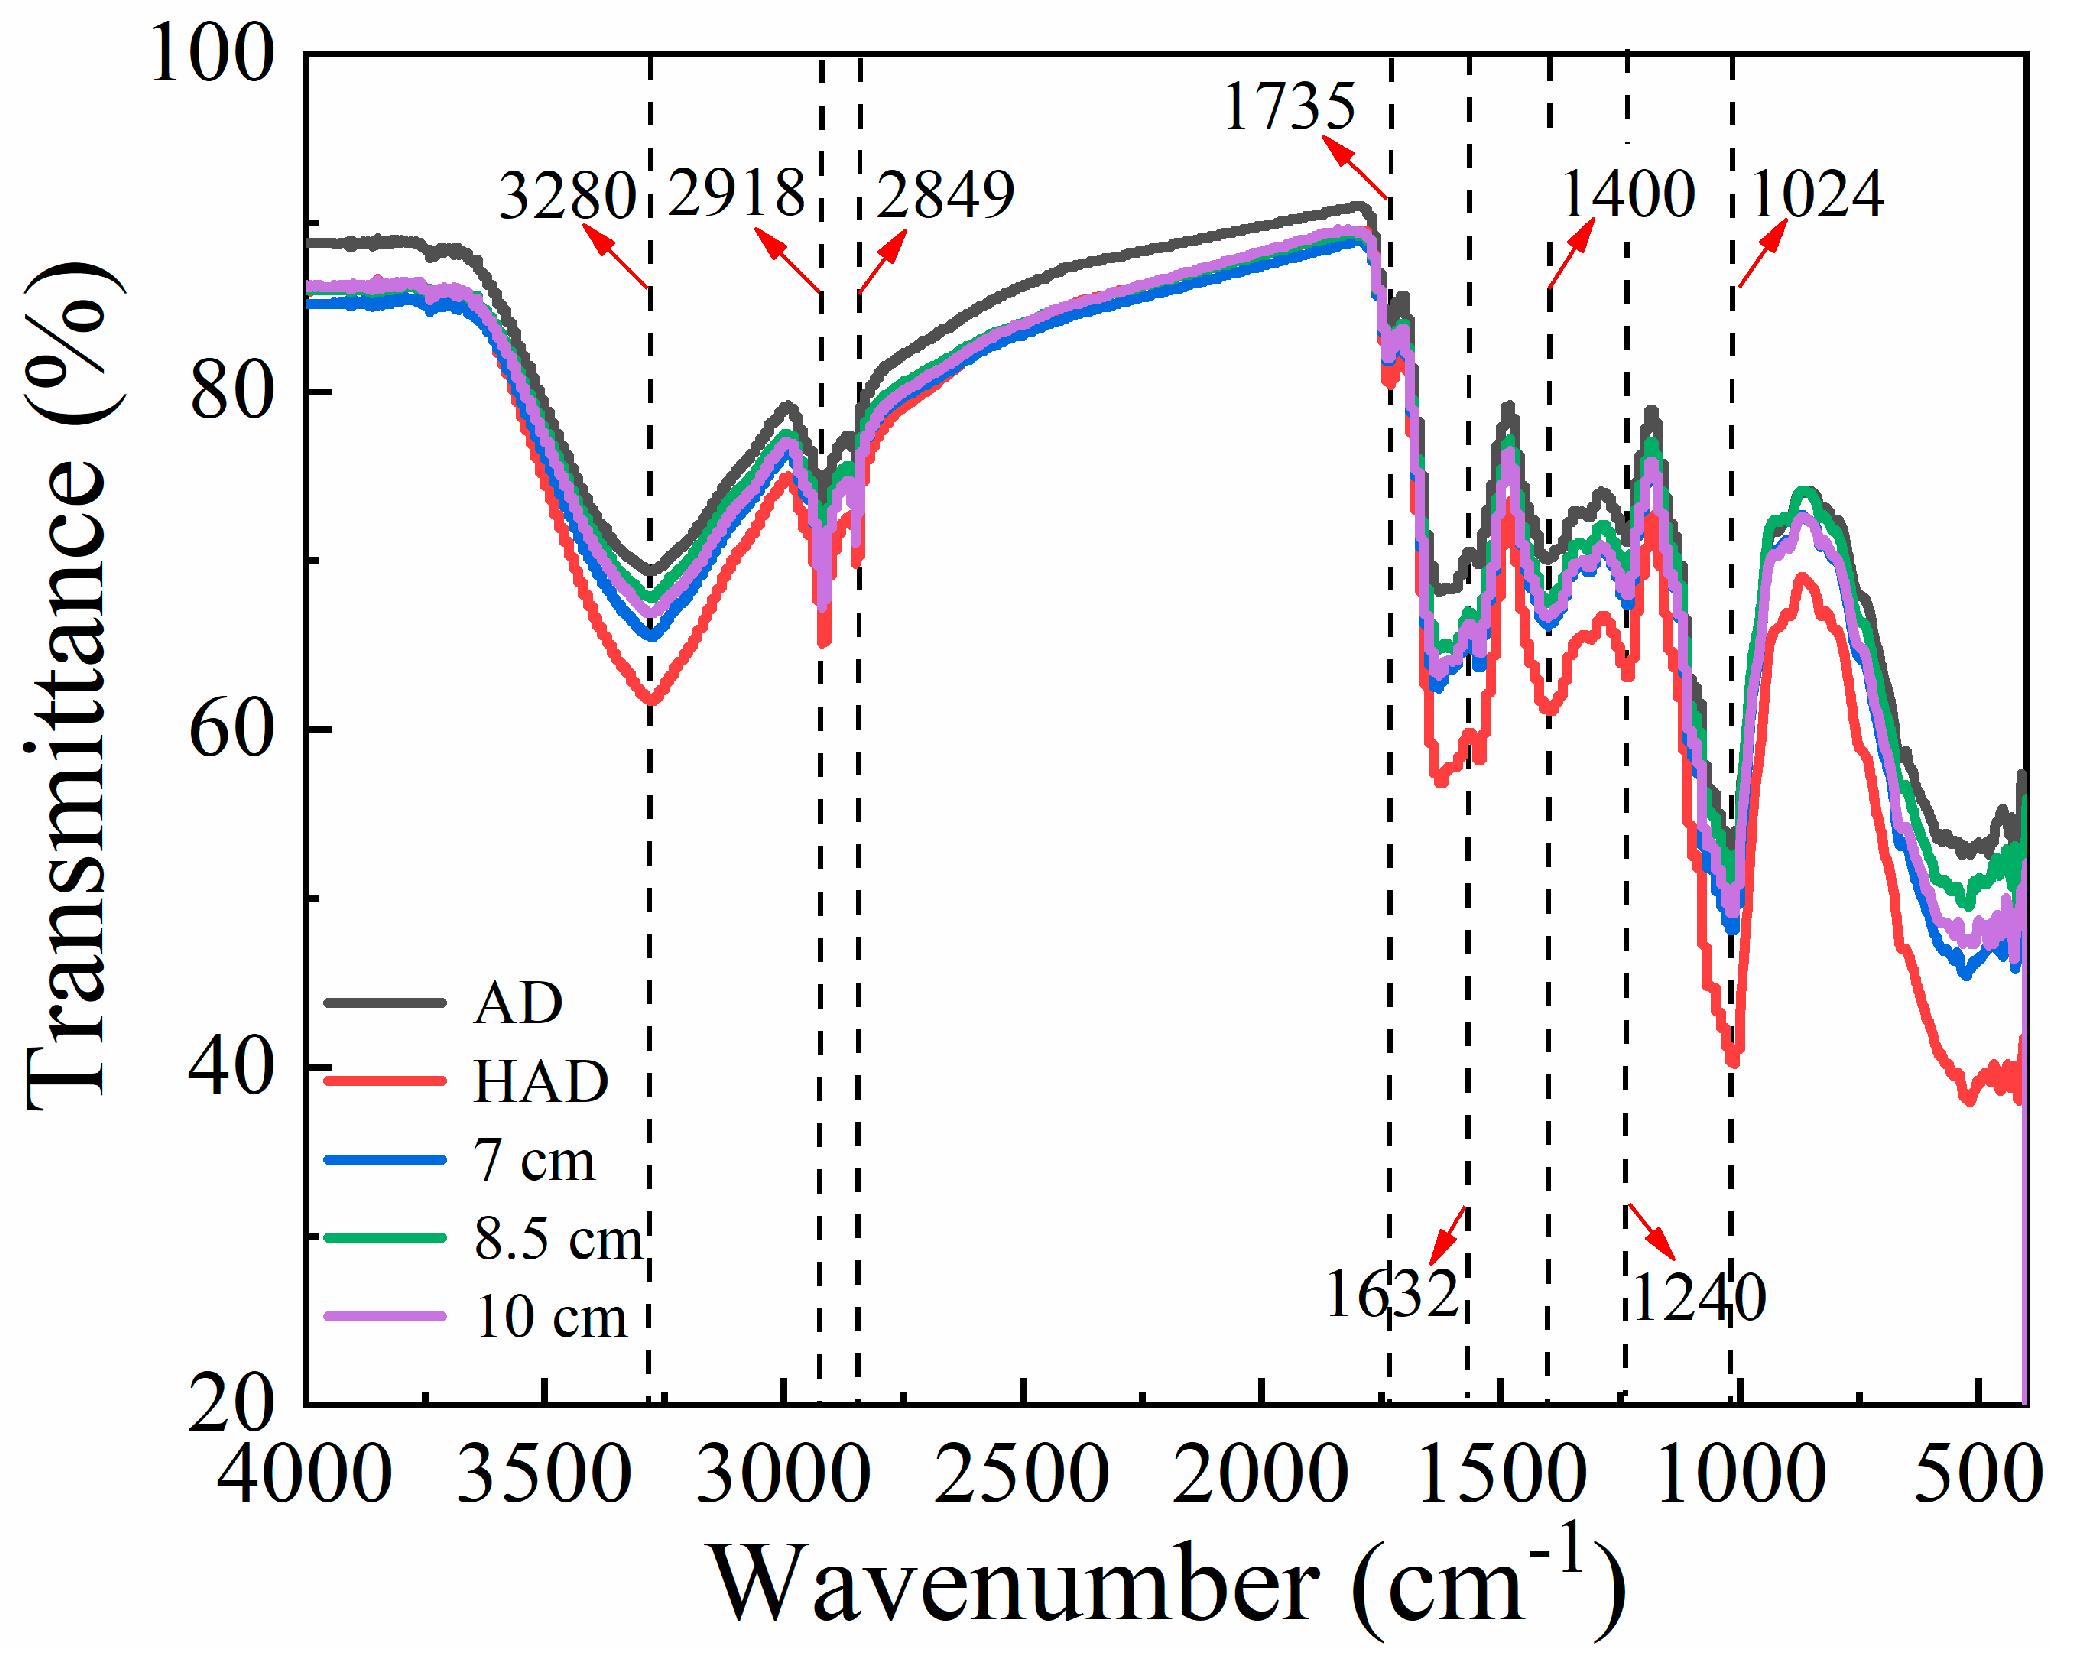
3.4. Infrared Spectroscopic Analysis

The functional groups and chemical bonds in molecules exhibit vibrational absorption under various wavelengths of infrared light; thus, infrared spectra can be used to assess alterations in functional groups and chemical bonds based on the position of absorption peaks and changes in intensity [46]. As depicted in Figure 11, the position of the absorption peak for the alfalfa remained relatively constant across the different drying methods; however, there were significant variations observed in the peak intensities. Specifically, the HAD group exhibited the highest peak intensity, while the HVCD group displayed a significantly higher peak intensity than the AD group. Moreover, when considering the air-gap spacing, a maximum peak intensity was achieved at 7 cm, with similar intensities observed between 8.5 cm and 10 cm.
The peak at 2918 cm−1 corresponding to the asymmetric stretching vibration of C-H bonds in alfalfa reveals the dynamic properties of these bonds, which are closely associated with the structure and conformation of aliphatic chains [47]. The absorption peak near 1632 cm−1, resulting from the stretching vibration of carboxyl groups (C=O), indicates the presence of carboxylic acids in alfalfa, which play a crucial role in maintaining the stability and functionality of plant cell walls [48]. The consistency of these absorption peaks across all treated alfalfa samples indicates that the basic structure of the alfalfa was not fundamentally altered [49]. The stretching peak of the C=O bond at 1735 cm−1 and the stretching vibration peak of the acyl-C-O single bond at 1240 cm−1 gradually decreased, reflecting the removal of lignin and hemicellulose [50]. Protein is a major component in alfalfa, as evidenced by the absorption peak near 3280 cm−1 representing N-H stretching vibrations and the involvement of O-H stretching vibrations from polysaccharides [51]. The typical protein bands centered around 1632 cm−1, 1545 cm−1, and 1400 cm−1 correspond to amide I and amide II groups, reflecting C=O stretching vibrations due to out-of-plane C-N stretching vibrations and N-H bonding/C-H stretching within proteins [52,53,54]. These peaks confirm that alfalfa is rich in protein and carbohydrates, which are essential for its quality. The absorption peaks at 1240 cm−1 and 1024 cm−1 correspond to the stretching vibrations of C-C or C-O single bonds in polysaccharides [55]. The research findings demonstrate that the absorption peak position of the HVCD treatment group exhibited no significant change compared to the control group, thereby confirming negligible alterations in the functional groups of alfalfa following HVCD drying. Consequently, it can be inferred that the nutritional composition of the alfalfa was effectively preserved throughout this process.

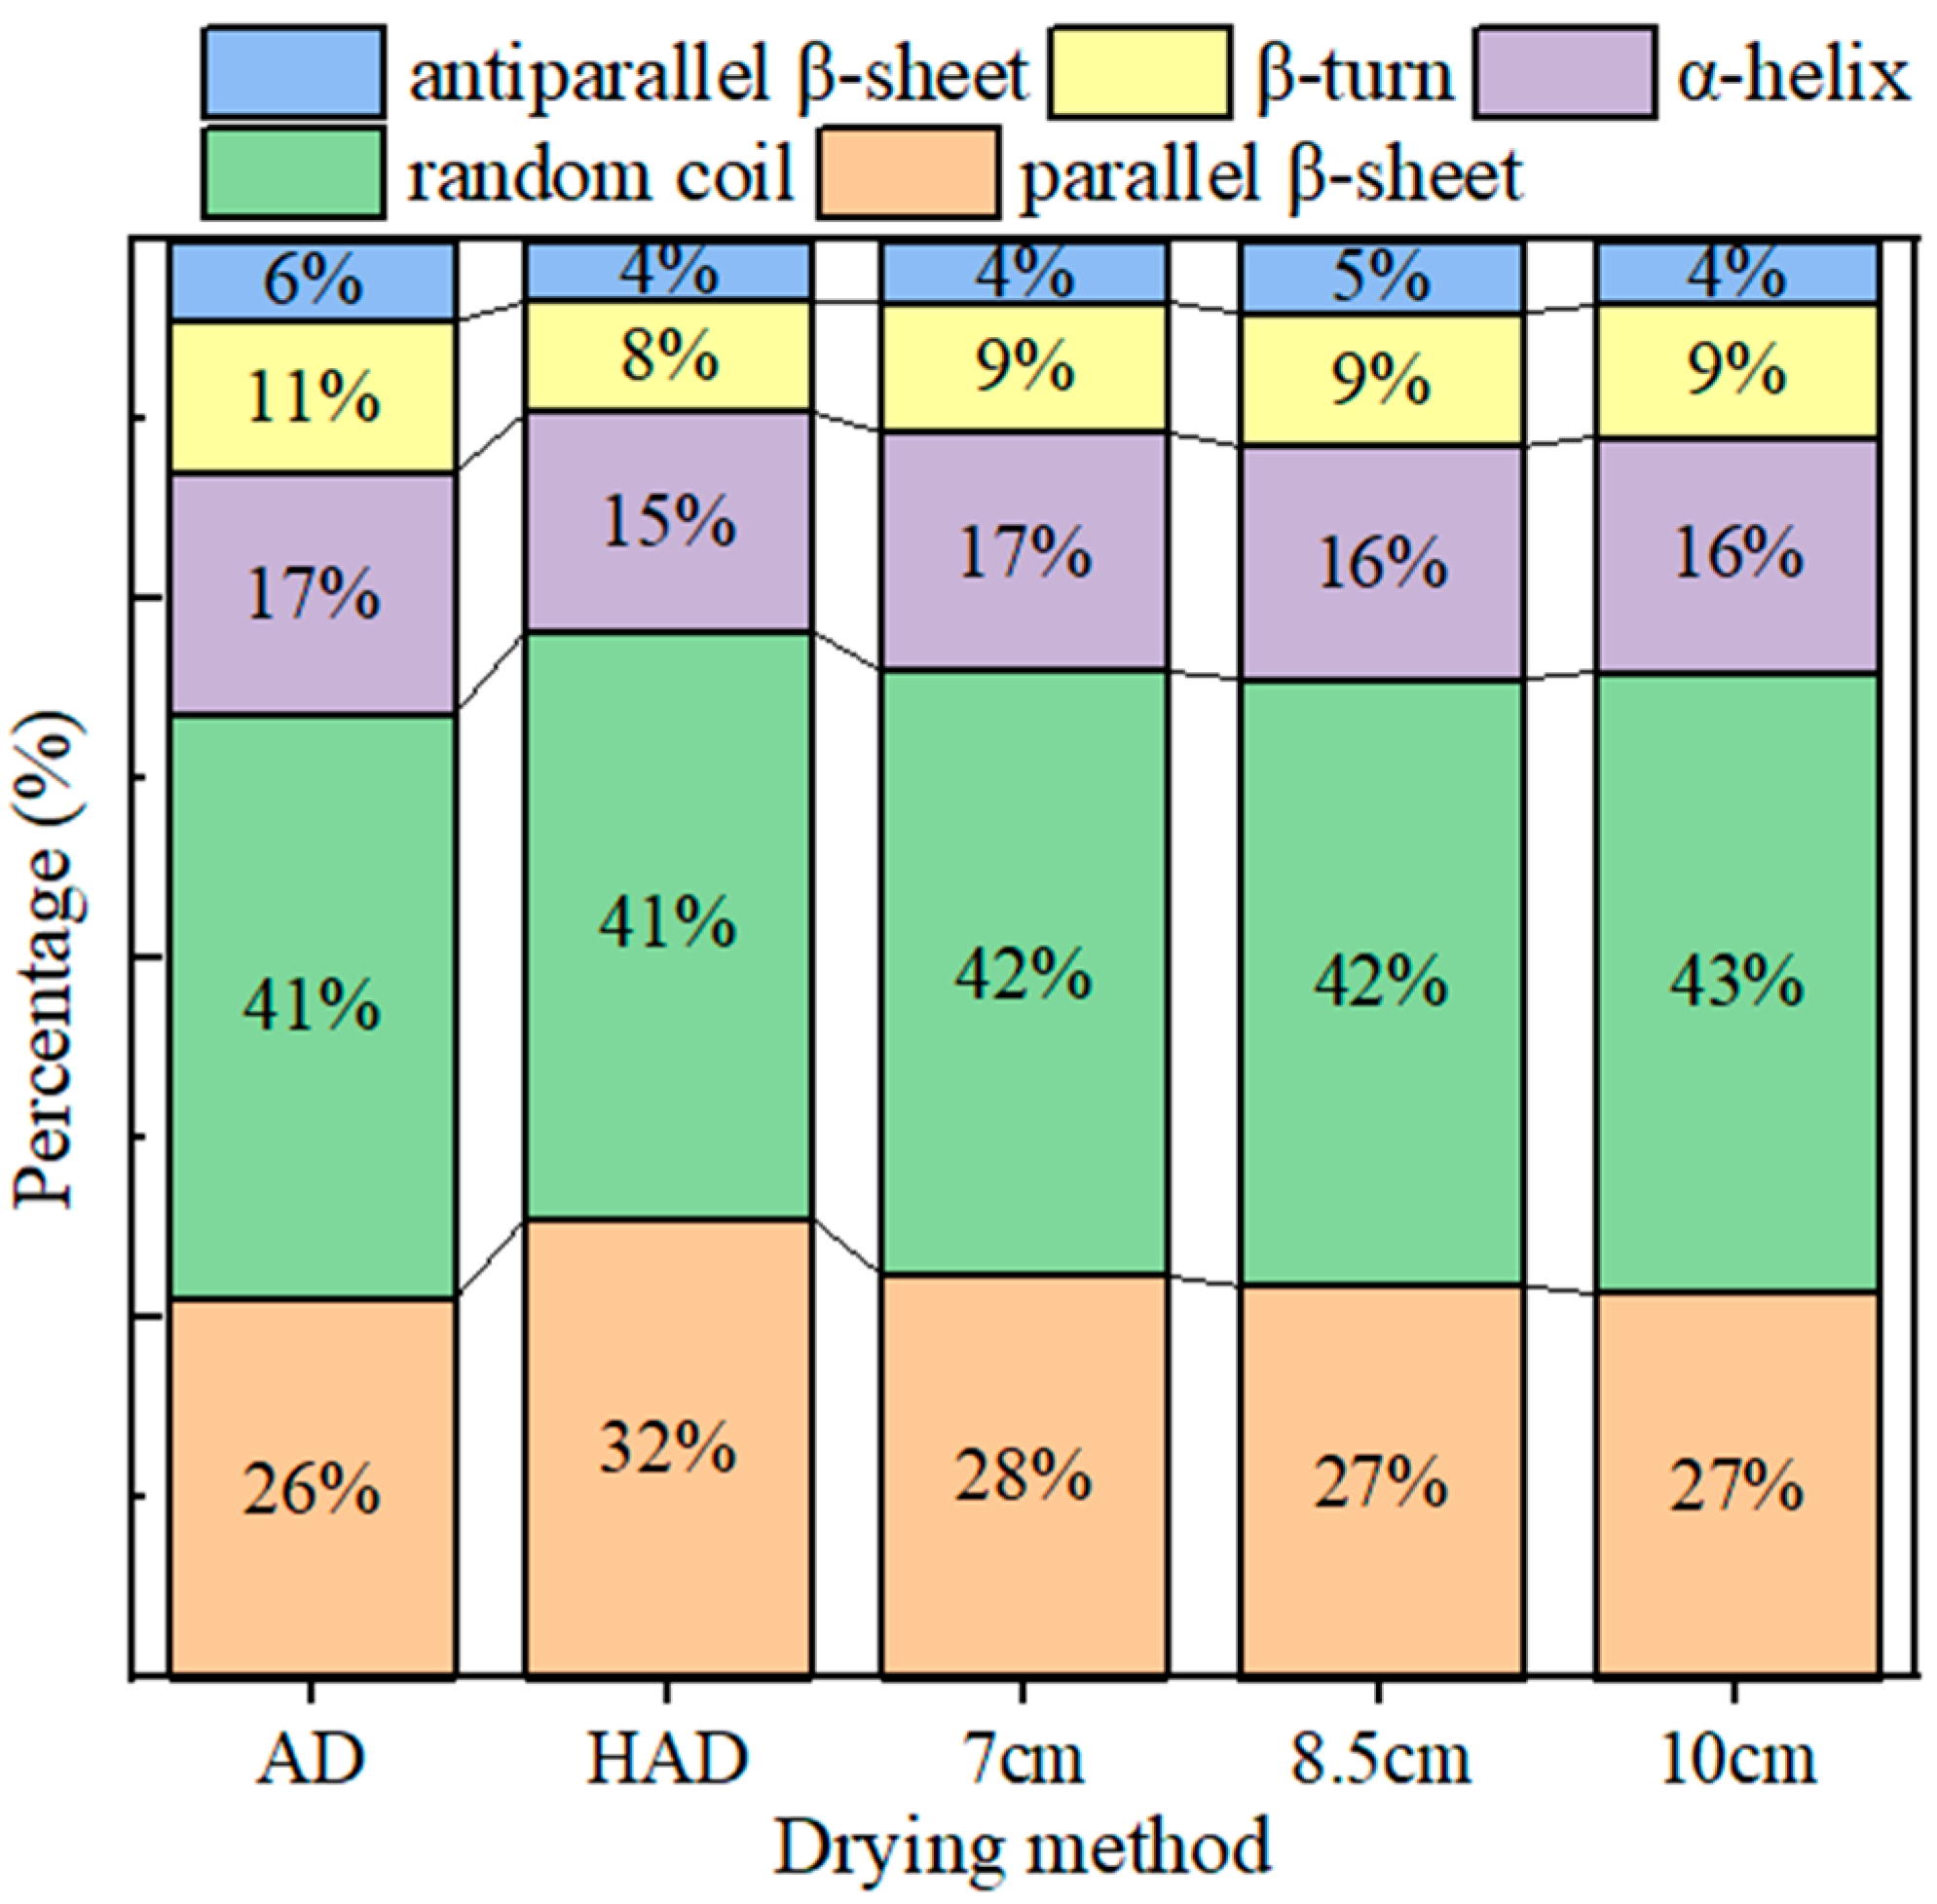
3.5. Secondary Protein Structure

The ordered structures of α-spiral, β-fold, and β-reverse flat behavior proteins are depicted [56,57]. As shown in Figure 12, β-turn and random coil develop disordered structures. Among these, the proportions of disordered structures were 51.2%, 48.6%, 51.1%, 51.6%, and 52.4%, whereas the proportions of ordered structures were 48.8%, 51.4%, 48.9%, 48.4%, and 47.6% for the AD group, HAD group, and HVCD groups with air-gap spacings of 7 cm, 8.5 cm, and 10 cm, respectively. During HVCD treatment, protein molecules undergo structural changes due to high-energy particle impact, resulting in not only alterations in their ordered structure but also an increase in the proportion of disordered structures [58,59,60]. The disorder of the alfalfa gradually increased as the air-gap spacing decreased. Overall, the different treatment methods led to variations in the protein secondary structure among the alfalfa samples, with corona discharge treatment having an effect.

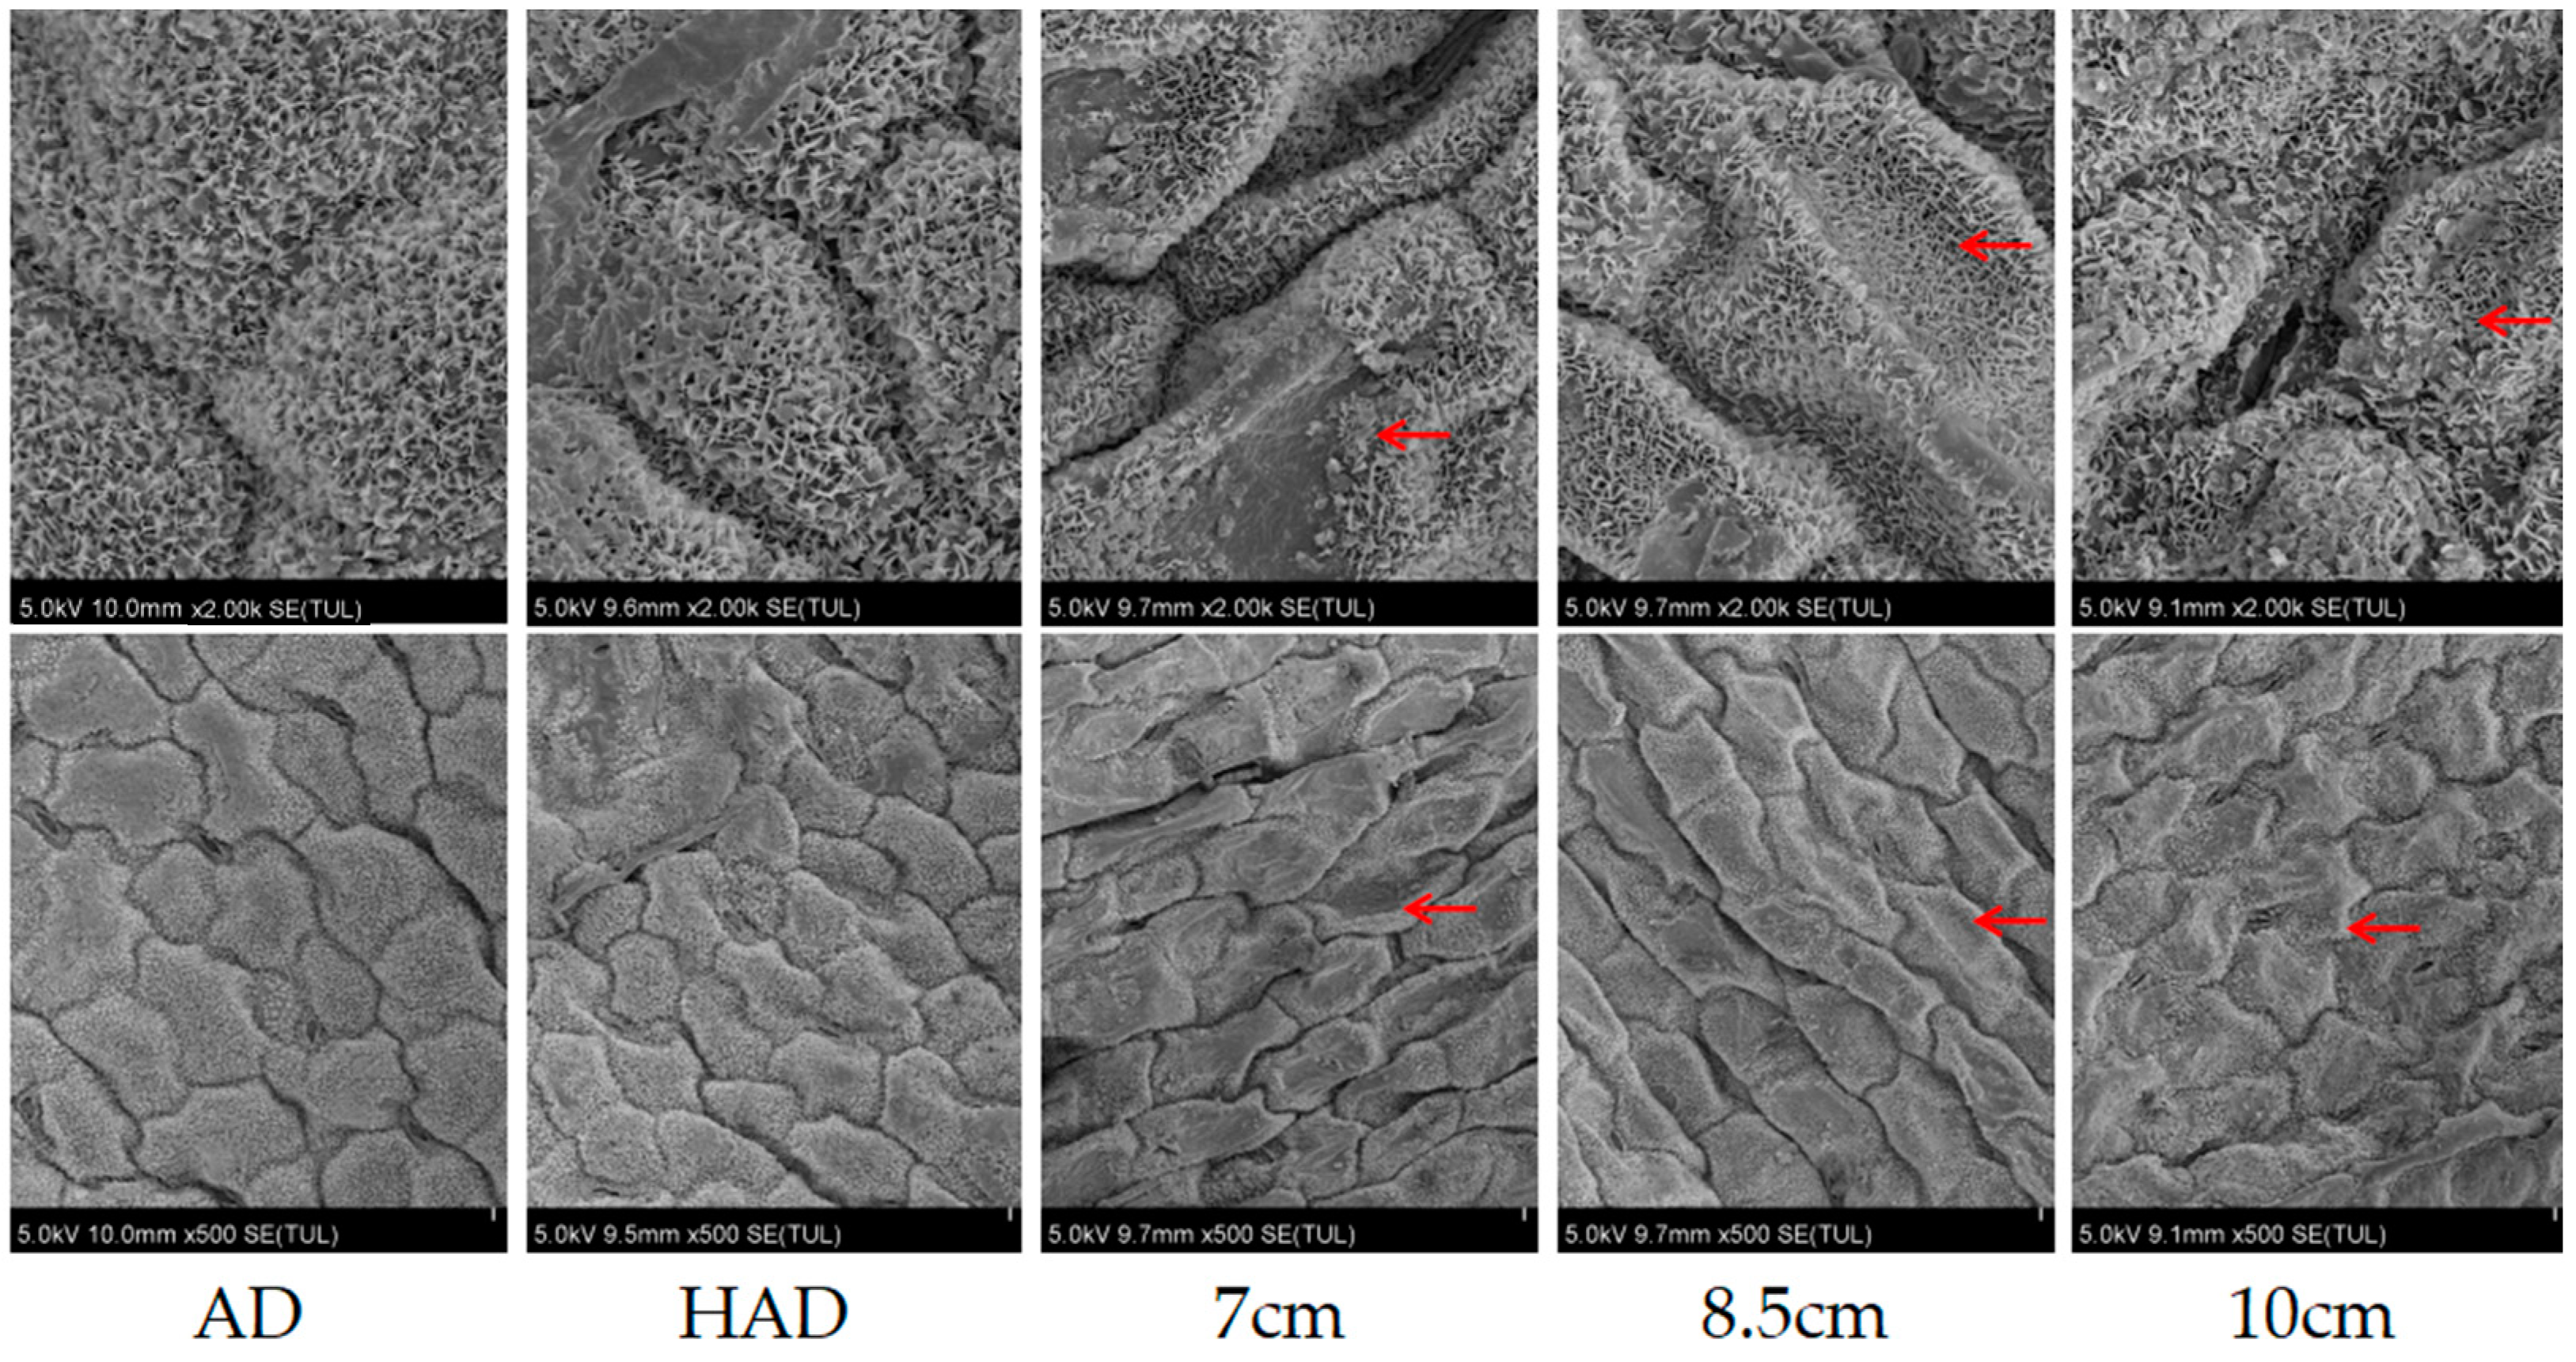
3.6. Microstructure Analysis

When subjected to high-voltage electric fields, a transmembrane potential is induced across the bacterial cell membrane. As the transmembrane potential progressively increases, it triggers the opening of membrane proteins and pores, ultimately leading to irreversible punctures that result in either cellular content leakage or small molecule influx into the cell, thereby culminating in cell death [61,62,63]. In addition, ion wind contains abundant active species, which can cause physical and chemical etching on the surface of alfalfa, forming channels for water loss. These factors can accelerate the drying of alfalfa. As depicted in Figure 13, the structure of the alfalfa treated with AD and HAD remained intact, exhibiting a distinct outline without any significant folds. Conversely, the HVCD-treated alfalfa exhibited a disrupted fiber structure characterized by the absence of cell outlines and partial degradation. This finding aligns with that of Nyssanbek Marzhan et al.’s study [64] on the plasma treatment of natural fibers, confirming that plasma treatment induces substantial alterations in fiber structure, thereby enhancing livestock digestion and absorption. Additionally, noticeable surface folds and severe cell damage were observed on the HVCD-treated alfalfa, indicating disintegration caused by HVCD treatment. Notably, as the electrode distance decreased, the fold formation on the alfalfa became increasingly prominent.

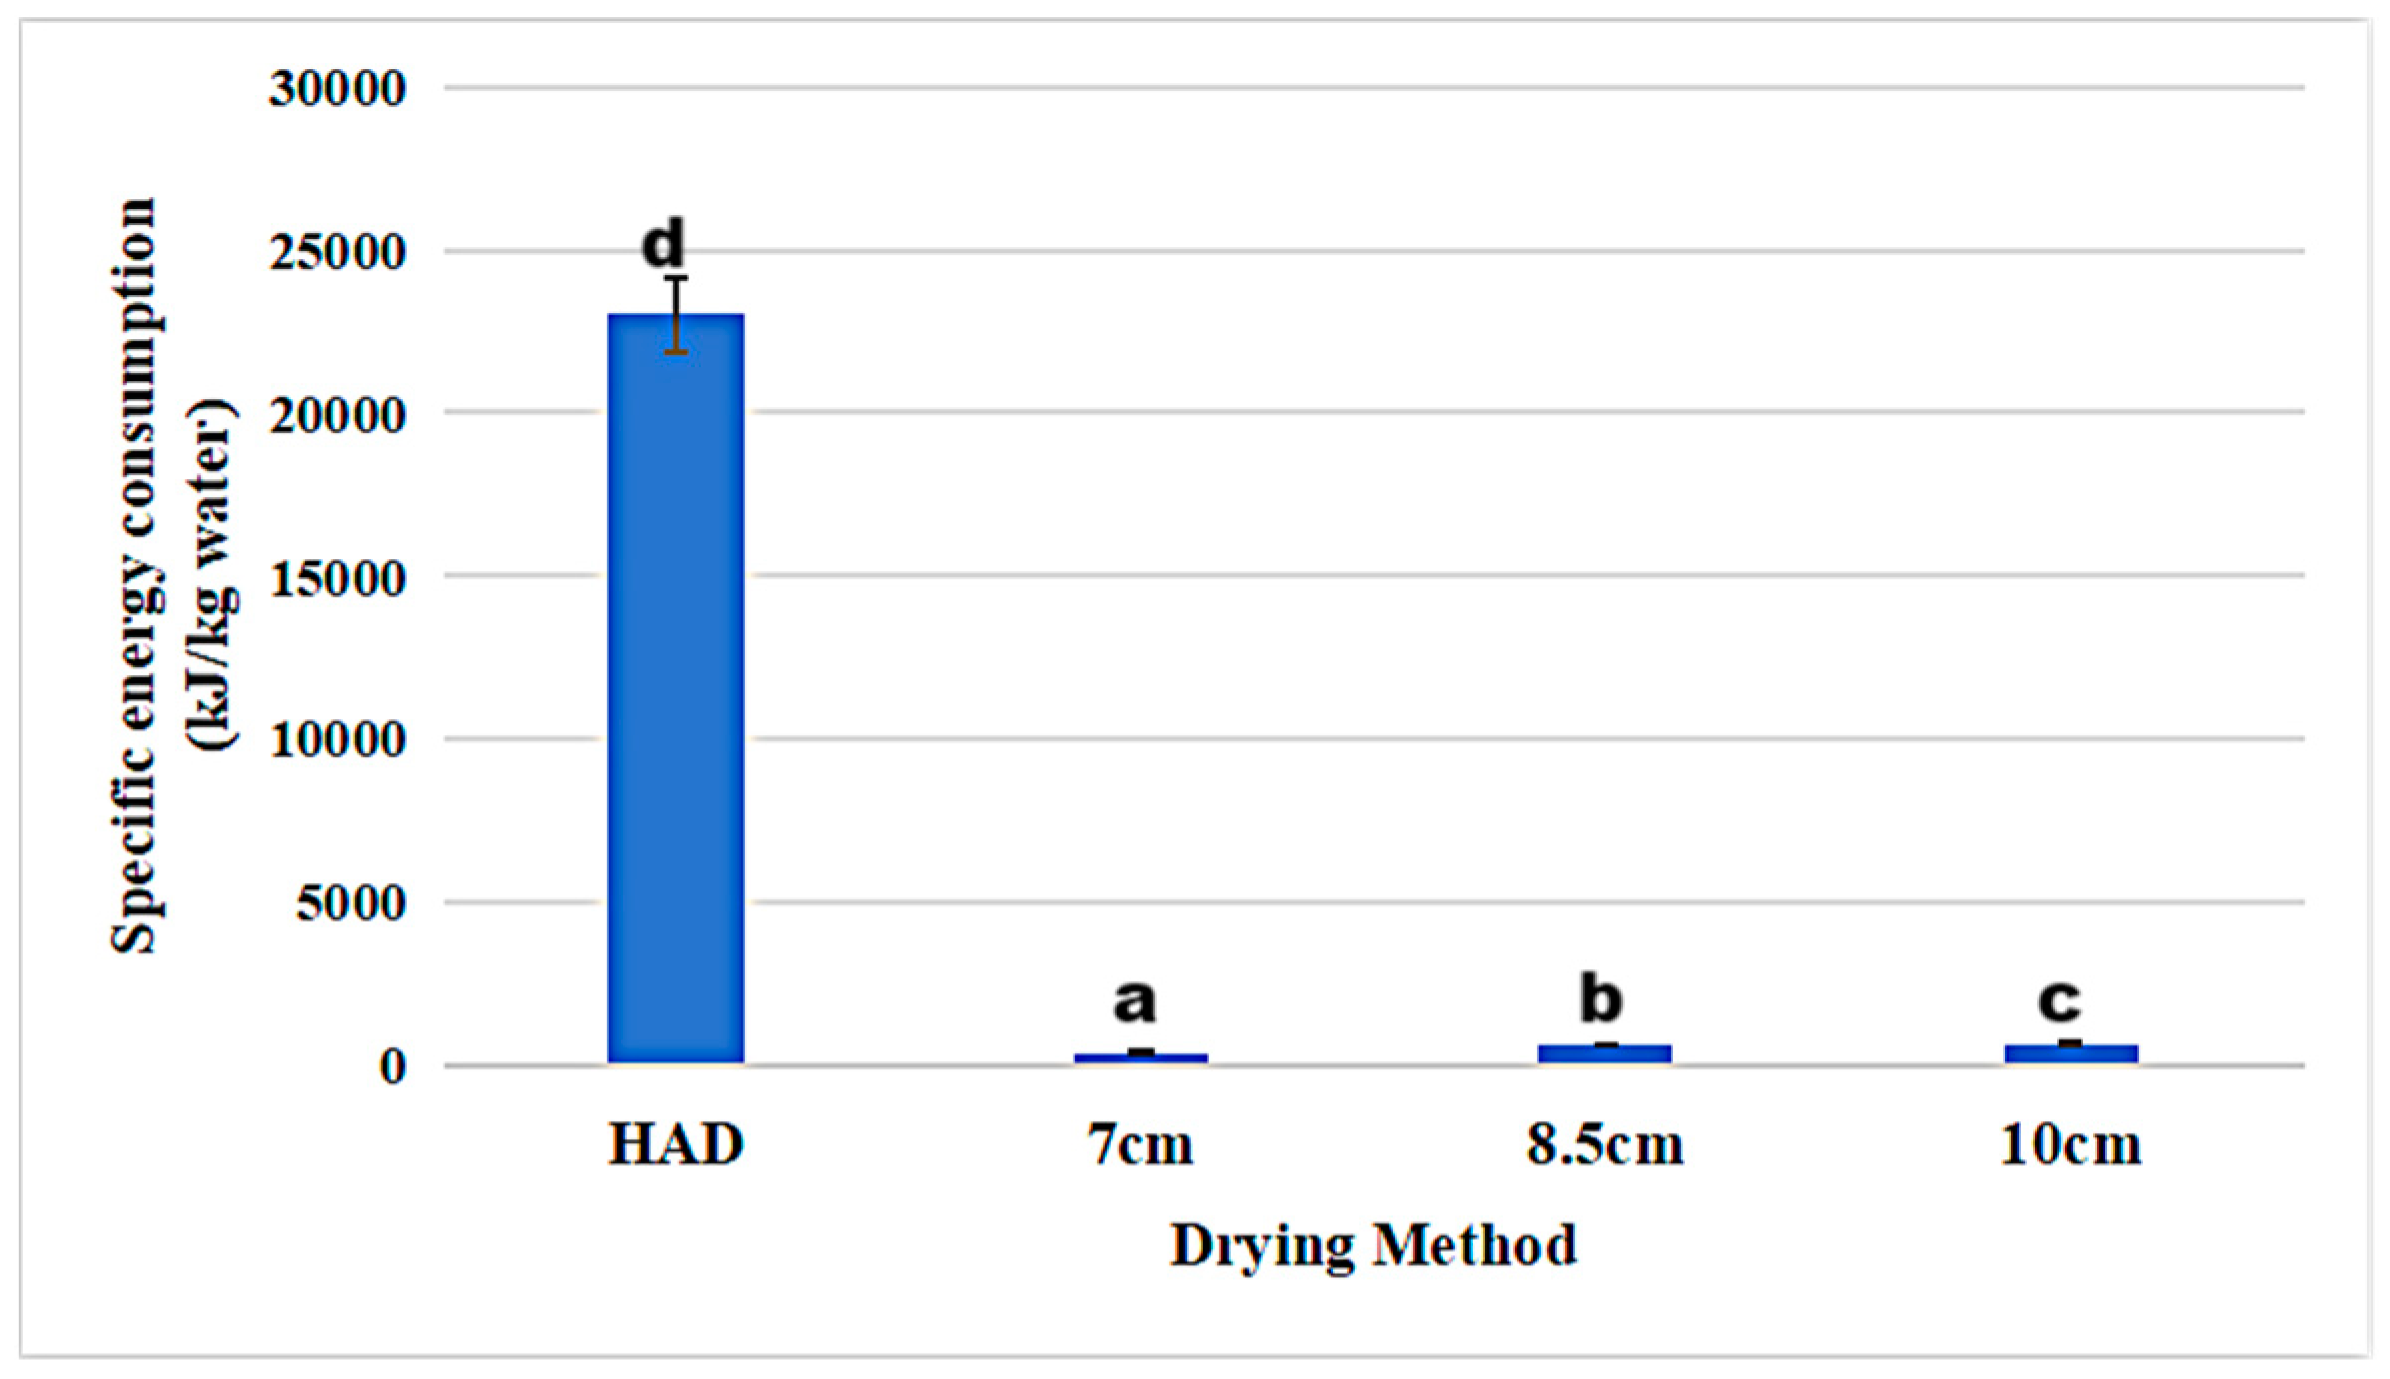
3.7. Energy Consumption

The HVCD processing of materials has garnered significant attention because of its low energy consumption, remarkable efficiency, and environmentally friendly advantages [65]. In the HVCD drying process, electric energy is efficiently utilized while maintaining material temperature stability, thereby offering advantages such as low energy consumption, energy conservation, and environmental friendliness [66]. As depicted in Figure 14, notable disparities existed in the energy consumption among the various drying methods. Specifically, the HAD group exhibited the highest energy consumption, which was 35.9–58.3 times greater than that of the HVCD groups with different air-gap spacings. Significant variations in energy consumption exist among different air-gap spacings (p < 0.05), all of which outperform the HAD group. Notably, a decrease in the electrode distance corresponded to a gradual reduction in energy consumption. The aforementioned statement is in line with the findings reported by Alex M et al. [67]. This, once again, confirms that HVCD represents an effective approach for achieving low energy utilization, high nutrient preservation, and the non-thermal treatment of forage.

4. Conclusions

In this study, it is found that, compared to the control group, HVCD treatment significantly enhances the drying and rehydration rates and improves the color of alfalfa. The application of HVCD can have a detrimental impact on lignin content, as well as the levels of neutral detergent fiber and acid detergent fiber in alfalfa. This process effectively enhances ruminant intake and utilization efficiency while concurrently improving feed palatability. By optimizing cell structure, HVCD technology effectively preserves the nutritional value of purple clover while significantly enhancing feed quality. An infrared spectroscopy analysis reveals no significant alteration in the characteristic peak positions of clover after HVCD treatment, indicating its ability to retain key components. Scanning electron microscopy demonstrates evident changes in clover’s fiber structure, with more pronounced surface wrinkles observed with a reduced air-gap spacing. Moreover, HVCD exhibits a remarkable reduction in energy consumption compared to HAD methods, thus contributing to substantial energy savings. In the subsequent phase of our research, we aim to enhance the quality of alfalfa hay through employing diverse pretreatment techniques and reducing the drying duration. Additionally, we will establish a mathematical model for processing HVCD-treated alfalfa based on acquired experimental data, thereby providing substantial theoretical support for agricultural advancement. Overall, high-voltage corona discharge treatment represents an energy-efficient and effective approach for improving both feed nutrition quality and forage quality.

Author Contributions

M.G. performed the majority of the experiments and wrote the manuscript; Y.Q. and J.Y. completed a small part of the experiment; M.G. and Z.S. contributed to the analysis of the data; and Z.S. designed and supervised the study and checked the final manuscript. All authors have read and agreed to the published version of the manuscript.

Funding

This research was funded by the Innovation and Entrepreneurship Training Program for Chinese College Students (No. 202310128002), National Natural Science Foundations of China (Nos. 12265021 and 12365023), Program for Young Talents of Science and Technology in Universities of Inner Mongolia Autonomous Region (No. NJYT23108), Natural Science Foundation of Inner Mongolia (2024MS01001), and the Basic Scientific Research Business Project of the Universities Directly of the Inner Mongolia Autonomous Region (Nos. JY20220057 and JY20240068).

Data Availability Statement

Data are contained within the article.

Conflicts of Interest

The authors declare no conflicts of interest.

Abbreviations

HVCDhigh-voltage corona discharge
HADhot air drying
ADair drying
CPcrude protein
NFCnon-fiber carbohydrate
ADFacid detergent fiber
NDFneutral detergent fiber
RFQrelative forage quality
SECspecific energy consumption

References

  1. Yan, M.; Yang, D.; He, Y.; Ma, Y.; Zhang, X.; Wang, Q.; Gao, J. Alfalfa Responses to Intensive Soil Compaction: Effects on Plant and Root Growth, Phytohormones and Internal Gene Expression. Plants 2024, 13, 953. [Google Scholar] [CrossRef] [PubMed]
  2. Ma, J.; Huang, W.; Yang, X.; Xu, J.; Zhang, Y.; Wang, Z. “King of the forage”—Alfalfa supplementation improves growth, reproductive performance, health condition and meat quality of pigs. Front. Vet. Sci. 2022, 9, 1025942. [Google Scholar]
  3. Gao, Z.; Liu, B.; La, S.; Li, D.; Zhu, X.; Sun, H.; Shi, Y. Alfalfa hay substitution for wheat straw improves beef quality via rumen microflora alteration. Heliyon 2023, 9, e20803. [Google Scholar] [CrossRef] [PubMed]
  4. Ercan, U.; Kabas, O.; Moiceanu, G. Prediction of Leaf Break Resistance of Green and Dry Alfalfa Leaves by Machine Learning Methods. Appl. Sci. 2024, 14, 1638. [Google Scholar] [CrossRef]
  5. Suwignyo, B.; Mustika, A.; Kustantinah Yusiati, L.M.; Suhartanto, B. Effect of Drying Method on Physical-Chemical Characteristics and Amino Acid Content of Tropical Alfalfa (Medicago sativa L.) Hay for Poultry Feed. Am. J. Anim. Vet. Sci. 2020, 15, 118–122. [Google Scholar] [CrossRef]
  6. Rout, S.; Srivastav, P.P. Modification of soy protein isolate and pea protein isolate by high voltage dielectric barrier discharge (DBD) atmospheric cold plasma: Comparative study on structural, rheological and techno-functional characteristics. Food Chem. 2024, 447, 138914. [Google Scholar] [CrossRef] [PubMed]
  7. Hui, Y.; Huang, C.; Liao, Y.; Wang, D.; You, Y.; Bai, X. The Medium-Blocking Discharge Vibration-Uniform Material Plasma Seed Treatment Device Based on EDEM. Agronomy 2023, 13, 2055. [Google Scholar] [CrossRef]
  8. Eric, M.; Etienne, D. Ionic wind of a needle-to-plate dielectric barrier discharge. J. Elect. 2022, 120, 103768. [Google Scholar]
  9. Wang, Y.; Guo, Z.; Wang, B.; Liu, J.; Zhang, M. Effect of high-voltage electrostatic field-assisted freeze-thaw pretreatment on the microwave freeze drying process of hawthorn. Drying Technol. 2023, 42, 477–491. [Google Scholar] [CrossRef]
  10. Karim, N.; Shishir, M.R.I.; Bao, T.; Chen, W. Effect of cold plasma pretreated hot-air drying on the physicochemical characteristics, nutritional values, and antioxidant activity of shiitake mushroom. J. Sci. Food Agric. 2021, 101, 6271–6280. [Google Scholar] [CrossRef]
  11. Seelarat, W.; Sangwanna, S.; Chaiwon, T.; Panklai, T.; Chaosuan, N.; Bootchanont, A.; Wattanawikkam, C.; Porjai, P.; Khuangsatung, W.; Boonyawan, D. Impact of Pretreatment with Dielectric Barrier Discharge Plasma on the Drying Characteristics and Bioactive Compounds of Jackfruit Slices. J. Sci. Food Agric. 2023, 104, 3654–3664. [Google Scholar] [CrossRef]
  12. Wang, Y.; Liu, Y.; Zhao, Y.; Sun, Y.; Duan, M.; Wang, H.; Dai, R.; Liu, Y.; Li, X.; Jia, F. Bactericidal efficacy difference between air and nitrogen cold atmospheric plasma on Bacillus cereus: Inactivation mechanism of Gram-positive bacteria at the cellular and molecular level. Food Res. Int. 2023, 173, 113204. [Google Scholar] [CrossRef] [PubMed]
  13. Zhang, Y.; Lu, Y.; Huang, D.; Zhao, H.; Huang, S.; Zhang, L.; Li, L. Infrared drying characteristics and optimization of ginseng. Case Stud. Therm. Eng. 2024, 57, 104334. [Google Scholar] [CrossRef]
  14. Shen, Q.; He, Z.; Ding, Y.; Sun, L. Effect of Different Drying Methods on the Quality and Nonvolatile Flavor Components of Oudemansiella raphanipes. Foods 2023, 12, 676. [Google Scholar] [CrossRef] [PubMed]
  15. Salehi, F.; Inanloodoghouz, M.; Ghazvineh, S. Influence of microwave pretreatment on the total phenolics, antioxidant activity, moisture diffusivity, and rehydration rate of dried sweet cherry. Food Sci. Nutr. 2023, 11, 7870–7876. [Google Scholar] [CrossRef] [PubMed]
  16. Aksoy, A.; Karasu, S.; Akcicek, A.; Kayacan, S. Effects of Different Drying Methods on Drying Kinetics, Microstructure, Color, and the Rehydration Ratio of Minced Meat. Foods 2019, 8, 216. [Google Scholar] [CrossRef] [PubMed]
  17. GB 6432-1986; Method for the Determination of Crude Protein in Feedstuffs. National Standard of the People’s Republic of China: Beijing, China, 1986.
  18. Digman, M.F.; Cherney, J.H.; Cherney, D.J.R. The Relative Performance of a Benchtop Scanning Monochromator and Handheld Fourier Transform Near-Infrared Reflectance Spectrometer in Predicting Forage Nutritive Value. Sensors 2022, 22, 658. [Google Scholar] [CrossRef] [PubMed]
  19. Naderi, N.; Ghorbani, G.R.; Erfani, H.; Ferraretto, L.F. Feeding Byproduct-Based Concentrates Instead of Human-Edible Feed Ingredients Increases Net Food Production and Improves Performance of High-Producing Holstein Cows. Animals 2022, 12, 2977. [Google Scholar] [CrossRef] [PubMed]
  20. Liu, X.; Wang, A.; Zhu, L.; Guo, W.; Guo, X.; Zhu, B.; Yang, M. Effect of additive cellulase on fermentation quality of whole-plant corn silage ensiling by a Bacillus inoculant and dynamic microbial community analysis. Front. Microbiol. 2024, 14, 1330538. [Google Scholar] [CrossRef]
  21. Beyza, C.; Mahmut, K.; Mevlut, A.; Selma, B.B. Assessment of nutritive value, gas and methane production, fermentation of ensiled mixtures of sorghum–cluster bean. J. Appl. Anim. Res. 2023, 51, 123–129. [Google Scholar]
  22. Fekadu, D. Nutritional Comparison of Feed Resources for Ruminant Animals Feeding in Ethiopia Using Relative Forage Quality. J. Nat. Sci.Res. 2018, 8, 1–7. [Google Scholar]
  23. Sriariyakul, W.; Swasdisevi, T.; Devahastin, S.; Soponronnarit, S. Drying of aloe vera puree using hot air in combination with far-infrared radiation and high-voltage electric field: Drying kinetics, energy consumption and product quality evaluation. Food Bioprod. Process. 2016, 100, 391–400. [Google Scholar] [CrossRef]
  24. Rubinetti, D.; Iranshahi, K.; Onwude, D.; Reymond, J.; Rajabi, A.; Xie, L.; Defraeye, T. Ionic wind amplifier for energy-efficient air propulsion: Prototype design, development, and evaluation. Clean. Eng. Technol. 2024, 19, 100728. [Google Scholar] [CrossRef]
  25. Defoort, E.; Bellanger, R.; Batiot-Dupeyrat, C.; Moreau, E. Ionic wind produced by a DC needle-to-plate corona discharge with a gap of 15 mm. J. Phys. D Appl. Phys. 2020, 53, 175202. [Google Scholar] [CrossRef]
  26. Feng, J.; Wang, C.; Wu, C.; Liu, Q. Experimental investigation on flow characteristics of ionic wind induced by wire electrode. J. Chin. Inst. Eng. 2021, 44, 22–32. [Google Scholar] [CrossRef]
  27. Jung, S.; Fang, J.; Chadha, S.T. Atmospheric pressure plasma corona enhanced by photoionizer for degradation of VOCs. J. Phys. D Appl. Phys. 2018, 51, 445206. [Google Scholar] [CrossRef]
  28. Srivastav, S.; Shah, M.; Ganorkar, P.M.; Kumar, K. Modelling of electrohydrodynamic drying kinetics for carrot at varying electrode distance. J. Food Sci. Technol. 2024, 61, 139–149. [Google Scholar] [CrossRef] [PubMed]
  29. Sumariyah, S.H.P.; Muhammad, N. Drying of Electrohydrodynamic (Ehd) on Potato Slices (Solanum Tuberosum) with Electrode Distance Variation. J. Nat. Sci. Res. 2019, 9, 21–25. [Google Scholar]
  30. Fakhreddin, S.; Sara, G.; Moein, I. Effects of edible coatings and ultrasonic pretreatment on the phenolic content, antioxidant potential, drying rate, and rehydration ratio of sweet cherry. Ultrason. Sonochem. 2023, 99, 106565. [Google Scholar]
  31. Fakhreddin, S.; Kimia, G.; Helia, R.K. Effects of different pretreatment techniques on the color indexes, drying characteristics and rehydration ratio of eggplant slices. Results Eng. 2024, 21, 101690. [Google Scholar]
  32. Xiao, A.; Ding, C. Effect of Electrohydrodynamic (EHD) on Drying Kinetics and Quality Characteristics of Shiitake Mushroom. Foods 2022, 11, 1303. [Google Scholar] [CrossRef] [PubMed]
  33. Zhang, S.; Wu, S.; Yu, Q.; Shan, X.; Chen, L.; Deng, Y.; Li, J. The influence of rolling pressure on the changes in non-volatile compounds and sensory quality of congou black tea: The combination of metabolomics, E-tongue, and chromatic differences analyses. Food Chem.-X 2023, 20, 100989. [Google Scholar] [CrossRef] [PubMed]
  34. Vishal, K.; Shekhar, S.C.; Shiva, B.; Sudhir, K.; Prakash, Y.S.; Kumar, P.V. Physicochemical and bioactive constituents, microbial counts, and color components of spray-dried Syzygium cumini L. pulp powder stored in different packaging materials under two controlled environmental conditions. Front. Nutr. 2023, 10, 1258884. [Google Scholar]
  35. Zhong, H.; Zhou, J.; Abdelrahman, M.; Xu, H.; Wu, Z.; Cui, L.; Ma, Z.; Yang, L.; Li, X. The Effect of Lignin Composition on Ruminal Fiber Fractions Degradation from Different Roughage Sources in Water Buffalo (Bubalus bubalis). Agriculture 2021, 11, 1015. [Google Scholar] [CrossRef]
  36. Chen, J.; Yu, T.; Cherney, J.H.; Zhang, Z. Optimal Integration of Optical and SAR Data for Improving Alfalfa Yield and Quality Traits Prediction: New Insights into Satellite-Based Forage Crop Monitoring. Remote Sens. 2024, 16, 734. [Google Scholar] [CrossRef]
  37. Santana, A.; Cajarville, C.; Mendoza, A.; Repetto, J.L. Including 8 hours of access to alfalfa in 1 or 2 grazing sessions in dairy cows fed a partial mixed ration: Effects on intake, behavior, digestion, and milk production and composition. J. Dairy Sci. 2023, 106, 6060–6079. [Google Scholar] [CrossRef] [PubMed]
  38. Song, S.D.; Chen, G.J.; Guo, C.H.; Rao, K.Q.; Gao, Y.H.; Peng, Z.L.; Zhu, W.L. Effects of exogenous fibrolytic enzyme supplementation to diets with different NFC/NDF ratios on the growth performance, nutrient digestibility and ruminal fermentation in Chinese domesticated black goats. Anim. Feed Sci. Technol. 2018, 236, 170–177. [Google Scholar] [CrossRef]
  39. Yanti, G.; Jamarun, N.; Elihasridas; Astuti, T. Quality Improvement of Sugarcane Top as Animal Feed with Biodelignification by Fungi on Digestibility of NDF, ADF, Cellulose and Hemicellulose. J. Phys. Conf. Ser. 2021, 1940, 012063. [Google Scholar]
  40. Chen, Q.; Cui, Y.F.; Zhang, Z.X.; Jiang, F.C.; Meng, X.Y.; Li, J.J.; Jia, J.L. Effect of alfalfa supplementary change dietary non-fibrous carbohydrate (NFC) to neutral detergent fiber (NDF) ratio on rumen fermentation and microbial function in Gansu alpine fine wool sheep (Ovis aries). Anim. Biotechnol. 2023, 35, 2262539. [Google Scholar] [CrossRef]
  41. Melo, A.H.F.; Marques, R.S.; Gouvêa, V.N.; Souza, J.; Batalha, C.D.A.; Basto, D.C.; Millen, D.D.; Drouillard, J.S.; Santos, F.A.P. Effects of dietary roughage neutral detergent fiber levels and flint corn processing method on growth performance, carcass characteristics, feeding behavior, and rumen morphometrics of Bos indicus cattle. J. Anim. Sci. 2019, 97, 3562–3577. [Google Scholar] [CrossRef]
  42. Lu, S.; Xu, Y.; Song, X.; Li, J.; Jiang, J.; Qin, C.; Wu, K.; Cui, K.; Liu, Y.; Liu, Q.; et al. Multi-omics reveal the effects and regulatory mechanism of dietary neutral detergent fiber supplementation on carcass characteristics, amino acid profiles, and meat quality of finishing pigs. Food Chem. 2024, 445, 138765. [Google Scholar] [CrossRef] [PubMed]
  43. Sartori, A.; Queaque, P.I.; Trocino, A.; Xiccato, G. Increasing dietary starch to ADF ratio in phase feeding programs for early weaned rabbits. Ital. J. Anim. Sci. 2016, 2, 432–434. [Google Scholar]
  44. Packialakshmi, M.; Palani Divya, M.; Baranidharan, K.; Geetha, S.; Nalliappan Ganesan, K.; Vijayabhama, M.; Manivasakan, S.; Hemalatha, P.; Radha, P.; Tilak, M.; et al. Exploring the Nutritional Potential of Wild Grass Fodder for Mega Herbivore (Elephas maximus) in the Foothills of Western Ghats. Animals 2022, 12, 2668. [Google Scholar] [CrossRef] [PubMed]
  45. Zhou, M.; Huo, M.; Wang, J.; Shi, T.; Li, F.; Zhou, M.; Wang, J.; Liao, Z. Identification of Tartary Buckwheat Varieties Suitable for Forage via Nutrient Value Analysis at Different Growth Stages. Int. J. Plant Biol. 2022, 13, 31–43. [Google Scholar] [CrossRef]
  46. Al-Janabi, A.H.A.; Hayati Roodbari, N.; Homayouni Tabrizi, M. Investigating the anticancer and anti-angiogenic effects of graphene oxide nanoparticles containing 6-gingerol modified with chitosan and folate. Cancer Nanotechnol. 2023, 14, 69. [Google Scholar] [CrossRef]
  47. Stefan, C.; Mateusz, P.; Anna, M. Empirically distinguished anti-aging behaviour of quercetin physically and chemically supported on cellulose carrier: In-situ examination for ethylene-norbornene copolymer. SM&T 2023, 36, e00590. [Google Scholar]
  48. Saražin, J.; Poljanšek, I.; Pizzi, A.; Šernek, M. Curing Kinetics of Tannin and Lignin Biobased Adhesives Determined by DSC and ABES. J. Renew. Mater. 2022, 10, 2117–2131. [Google Scholar] [CrossRef]
  49. Garette, S.J.; Edwin, D.R.R.; Shanmugavelayutham, V.S. Characterization of Natural Cellulosic Fiber from Coccinia Grandis Root. J. Nat. Fibers 2022, 19, 9444–9456. [Google Scholar]
  50. Caglar, A.; Faik, C.; Recai, A. Production of oyster mushroom (Pleurotus ostreatus) from some waste lignocellulosic materials and FTIR characterization of structural changes. Sci. Rep. 2023, 13, 12897. [Google Scholar]
  51. Ashrafuzzaman, M.; Ahmed, F.; Mimi, A.; Zarin, F.; Shetu, S. Ceramide: An Extravagant Prospective for Treatment of Burn Patients. IFMBE Proc. 2021, 82, 257–271. [Google Scholar]
  52. Naja, C.; Davide, O.; Federico, C.; Olander, P.H.; Fatemeh, A.; Hailu, F.A. Effect of the extraction process parameters on aquafaba composition and foaming properties. Appl. Food Res. 2023, 3, 100354. [Google Scholar]
  53. Khamidova, F.Y.; Yormatova, D.Y.; Kh Majidov, K.; Bokijonov, M.M. Features of physico-chemical parameters of local varieties of lentil grains in Uzbekistan. IOP Conf. Ser. Earth Environ. Sci. 2022, 1068, 01023. [Google Scholar] [CrossRef]
  54. Williams Ashley, E.; Hammer Nathan, I.; Fortenberry Ryan, C.; Reinemann Dana, N. Tracking the Amide I and αCOO− Terminal ν(C=O) Raman Bands in a Family of l-Glutamic Acid-Containing Peptide Fragments: A Raman and DFT Study. Molecules 2021, 26, 4790. [Google Scholar] [CrossRef] [PubMed]
  55. Dong, X.; Gao, X.; Wang, R.; Liu, C.; Wu, J.; Huang, Q. Evaluation of Polysaccharide Content in Shiitake Culinary-Medicinal Mushroom, Lentinula edodes (Agaricomycetes), via Near-Infrared Spectroscopy Integrated with Deep Learning. Int. J. Med. Mushrooms 2022, 25, 13–28. [Google Scholar] [CrossRef]
  56. Yang, H.; Li, Y.; Zhao, J.; Chen, Z.; Huang, X.; Fan, G. Regulating the composition and secondary structure of wheat protein through canopy shading to improve dough performance and nutritional index. Food Res. Int. 2023, 17, 113399. [Google Scholar] [CrossRef] [PubMed]
  57. Krawęcka, A.; Sobota, A.; Zarzycki, P. The Effect of the Addition of Low-Alkaloid Lupine Flour on the Glycemic Index In Vivo and the Physicochemical Properties and Cooking Quality of Durum Wheat Pasta. Foods 2022, 11, 3216. [Google Scholar] [CrossRef] [PubMed]
  58. Zhang, Y.; Wang, S.; Niu, D.; Huang, Z.; Gai, L.; Hang, F. Effects of moderate dielectric barrier discharge (DBD) plasma treatment on the structure, antigenicity, and digestibility of casein. Food Hydrocoll. 2024, 153, 109973. [Google Scholar] [CrossRef]
  59. Wang, X.; Han, Z.; Dong, Z.; Zhang, T.; Duan, J.; Ai, L.; Xu, Y. Atmospheric-pressure cold plasma-assisted enzymatic extraction of high-temperature soybean meal proteins and effects on protein structural and functional properties. Innov. Food Sci. Emerg. Technol. 2024, 92, 103586. [Google Scholar] [CrossRef]
  60. Wen, W.; Li, S.; Wang, J. The Effects of Tea Polyphenol on Chicken Protein Digestion and the Mechanism under Thermal Processing. Foods 2023, 12, 2905. [Google Scholar] [CrossRef]
  61. Zhu, N.; Yu, N.; Zhu, Y.; Wei, Y.; Zhang, H.; Sun, A.D. Inactivation of Pichia rhodanensis in relation to membrane and intracellular compounds due to microchip pulsed electric field (MPEF) treatment. PLoS ONE 2018, 13, e0198467. [Google Scholar] [CrossRef]
  62. Brooks, J.R.; Heiman, T.C.; Lorenzen, S.R.; Mungloo, I.; Mirfendereski, S.; Park, J.S.; Yang, R. Transepithelial Electrical Impedance Increase Following Porous Substrate Electroporation Enables Label-Free Delivery. Small 2024. [Google Scholar] [CrossRef] [PubMed]
  63. VanderBurgh, J.A.; Corso, G.T.; Levy, S.L.; Craighead, H.G. A multiplexed microfluidic continuous-flow electroporation system for efficient cell transfection. Biomed. Microdevices 2024, 26, 10. [Google Scholar] [CrossRef] [PubMed]
  64. Nyssanbek, M.; Kuzina, N.; Kondrashchenko, V.; Azimov, A. Effects of plasma treatment on biodegradation of natural and synthetic fibers. NPJ Mat. Degrad. 2024, 8, 23. [Google Scholar] [CrossRef]
  65. Du, Y.; Wang, H.; Yuan, S.; Yu, H.; Xie, Y.; Guo, Y.; Yao, W. Dielectric barrier discharge plasma pretreatment: A cleaner new way to improve energy efficiency and quality of wolfberry drying. J. Clean. Prod. 2024, 450, 141951. [Google Scholar] [CrossRef]
  66. Wang, L.; Tian, Y.; Wang, K.; Qin, Y.; Chang, Z.; Wang, J. Effects of corona discharge plasma pretreatment on the drying kinetics and quality attributes of lily (Lilium davidii var. unicolor) bulbs. LWT 2024, 200, 116192. [Google Scholar] [CrossRef]
  67. Alex, M.; Ivanna, B.; Tadeusz, K. The energy efficiency of electrohydrodynamic (EHD) drying of foods. Trends Food Sci. Technol. 2021, 118, 744–764. [Google Scholar]
Figure 1. Needle array board dielectric barrier HVCD device: ① power supply, ② voltage controller, ③ tip electrode, ④ dielectric plate, ⑤ grounding electrode, ⑥ alfalfa sample, ⑦ plastic square container, and ⑧ electrode distance.
Agronomy 14 01235 g001
Figure 2. Hot air drying equipment.
Agronomy 14 01235 g002
Figure 3. Ion wind speed at different air-gap spacings.
Agronomy 14 01235 g003
Figure 4. Voltage and current waveform diagrams.
Agronomy 14 01235 g004
Figure 5. The drying rates of different drying methods change over time.
Agronomy 14 01235 g005
Figure 6. The curve of the change in average drying time and average drying rate. Different letters indicate significant differences between sample means (p < 0.05).
Agronomy 14 01235 g006
Figure 7. Rehydration performance of alfalfa under different drying methods. Different letters indicate significant differences between sample means (p < 0.05).
Agronomy 14 01235 g007
Figure 8. Three−dimensional scatter plot of alfalfa color distribution under different drying methods.
Agronomy 14 01235 g008
Figure 9. Nutrient content under different drying methods. Different letters indicate a significant difference between the sample means (p < 0.05).
Agronomy 14 01235 g009
Figure 10. Relative forage quality of alfalfa under different drying methods. Different letters indicate a significant difference between the sample means (p < 0.05).
Agronomy 14 01235 g010
Figure 11. Infrared spectrum of alfalfa under different drying methods.
Agronomy 14 01235 g011
Figure 12. Secondary protein structure of alfalfa under different drying methods.
Agronomy 14 01235 g012
Figure 13. The microstructures of alfalfa grasses following the use of different drying methods.
Agronomy 14 01235 g013
Figure 14. The specific energy consumption of different drying methods for alfalfa. Different letters indicate a significant difference between the sample means (p < 0.05).
Agronomy 14 01235 g014
Table 1. Color indicators of alfalfa under different drying methods.
Drying MethodL*a*b*
AD43.88 ± 0.93 c−2.13 ± 1.24 ab36.60 ± 0.61 a
HAD46.81 ± 1.41 b−9.12 ± 0.46 b36.80 ± 0.61 a
7 cm48.99 ± 0.93 a−7.89 ± 0.80 d31.24 ± 0.73 d
8.5 cm46.97 ± 0.49 b−5.48 ± 1.02 c32.01 ± 1.22 c
10 cm47.04 ± 1.20 b−0.38 ± 0.92 a32.55 ± 0.86 b
Different letters indicate a significant difference between the sample means (p < 0.05). L*: brightness value; a*: red value; b*: yellow value.
Table 2. NFC/ADF ratio of alfalfa under different drying methods.
Drying MethodsADHAD7 cm8.5 cm10 cm
NFC/NDF1.22 d1.29 c1.44 a1.23 c1.31 b
Different letters indicate a significant difference between the sample means (p < 0.05).
Disclaimer/Publisher’s Note: The statements, opinions and data contained in all publications are solely those of the individual author(s) and contributor(s) and not of MDPI and/or the editor(s). MDPI and/or the editor(s) disclaim responsibility for any injury to people or property resulting from any ideas, methods, instructions or products referred to in the content.

