Article

15N Isotope Labeled Tracking of the Nitrogen Utilization of Apple under Water and Nitrogen Coupling Application in Arid and Semiarid Areas

College of Horticulture, Gansu Agricultural University, Lanzhou 730070, China
*
Author to whom correspondence should be addressed.
Agronomy 2024, 14(6), 1245; https://doi.org/10.3390/agronomy14061245
Submission received: 12 March 2024 / Revised: 1 June 2024 / Accepted: 3 June 2024 / Published: 7 June 2024
(This article belongs to the Section Plant-Crop Biology and Biochemistry)

Abstract

:
In order to solve the problem of water waste and environmental pollution in arid and semiarid areas, this study aimed to investigate the effects of different water and nitrogen treatments on the growth of apple leaves, photosynthetic physiology, nutrient uptake and nitrogen use efficiency. A two-factor experimental design was used in this experiment. The first factor was three levels of irrigation (40–50%, 50–65%, 65–80% RWC, relative water content) and the second factor was four levels of nitrogen application (0, 150, 300, 600 kg/ha), which were a completely randomized combination. The results showed that irrigation and nitrogen application had significant effects on the growth, photosynthetic rate, chlorophyl and mineral element contents of apple tree leaves, but excessive input of water and nitrogen would restrain the growth of apple tree leaves. The Ndff% of different organs for apple trees were evaluated by 15N isotope tracer technology, and the highest Ndff% value was found in leaves, ranging from 1.01–1.23‰. Next were roots with 0.29–0.43‰, and the lowest Ndff% was found in fruits with 0.03–0.08‰. The calculation results of 15N utilization in apple trees showed that nitrogen use efficiency (NUE) under the medium-water low nitrogen (W1N1) treatment had the highest value with 43.33%. In conclusion, considering the growth physiology and nitrogen utilization of apple trees, it is recommended that a water and fertilizer coupling combination scheme for apple trees in arid and semi-arid areas of the Loess Plateau should be that of a medium-water and medium-nitrogen mode (W1N2, 50–65% RWC, 300 kg/ha).

1. Introduction

China is the world’s largest apple producer and consumer in the world, and apple acreage and yield are more than 50% of the world’s aggregate [1,2]. In the past 20 years, the center of gravity of apple production has shifted from the eastern production area of Bohai Bay to the northwestern Loess Plateau. Therefore, the Loess Plateau has become the largest apple production area in China [3]. The Loess Plateau has natural conditions for producing high-quality apples, such as deep soil layer, sufficient sunlight, and few diseases and pests. However, the annual precipitation is between 400 and 500 mm in most parts of the region, and the total rainfall is low, making it a typical semi-arid region. There are many factors restricting the sustainable development of apple trees in the Loess Plateau, among which the lack of water and excessive nitrogen fertilizer input are the main limiting factors, which affect the growth and development of crops [4]. Atkinson [5] and Giuliani [6] found that improper irrigation methods and irrigation water in apple orchards reduce the utilization rate of water resources, resulting in excessive water resources waste, inhibiting the respiration of fruit tree roots and reducing the absorption of fertilizer by the roots. Jiang [7] and Hou [8] found that excessive application of nitrogen fertilizer and improper fertilization methods lead to a low utilization rate of nitrogen fertilizer and a large amount of nitrogen leaching, resulting in land fertility decline, crop nutrient imbalance and environmental pollution. Therefore, efficient water-saving irrigation and reasonable water and nitrogen management measures are effective ways to improve normal crop normal and sustainable development.
Currently, studies on the effects of water–fertilizer coupling effects on crop growth and physiology, nutrient quality, and leisin utilization have focused on rice [9], maize [10], cotton [11], vegetables [12], and some fruit trees [13]. Water and nitrogen coupling is widely used in the study of the water and fertilizer coupling effect. Previous research has found that the water–nitrogen coupling effect contributes to an increase in the leaf area index for apple trees, but some studies have shown that the interaction of water and nitrogen has no significant effect on leaves [14,15]. The photosynthetic rate, stomatal conductance (Gs) and transpiration rate (Tr) of high nitrogen treatment were higher than those of low nitrogen treatment under normal irrigation conditions, while the opposite was true under drought conditions [16]. In addition, the supply of water and nitrogen had a great influence on the chlorophyll content of crops, and the chlorophyll content of crops increased significantly under higher irrigation and nitrogen application rates [17,18]. Nitrogen and phosphorus in leaves are two important elements in plant photosynthesis. The balanced and coordinated proportional relationship between the two elements is of great significance to the photosynthetic growth of apple trees [19,20]. The study of water and fertilizer in crop fertilizer use efficiency found that, under drip irrigation and fertilization conditions, suitable water and fertilization conditions can improve the efficiency of crop fertilizer use, such as in bananas and jujubes [21,22].
Although previous studies have achieved many results in the water and fertilizer management of fruit trees, especially for apple trees, relatively few studies have been conducted on this aspect [23,24,25]. Most scholars have usually studied water and fertilizer utilization from individual aspects, such as irrigation or fertilization, and most of the nitrogen utilization was evaluated based on the total nitrogen uptake of the plant [26], which did not provide information on the specific proportion of plant fertilizer nitrogen uptake, which also limited the study of the mechanism of the water–nitrogen coupling effect in plants [27]. However, there are fewer studies on isotope tracing techniques under water–fertilizer coupling conditions. Therefore, we examined study of nitrogen utilization in apple trees under water–nitrogen coupling conditions in arid and semi-arid regions by 15N isotope labeling, with a view to providing a scientific basis for water–nitrogen management in apples in arid and semi-arid regions on the Loess Plateau.

2. Materials and Methods

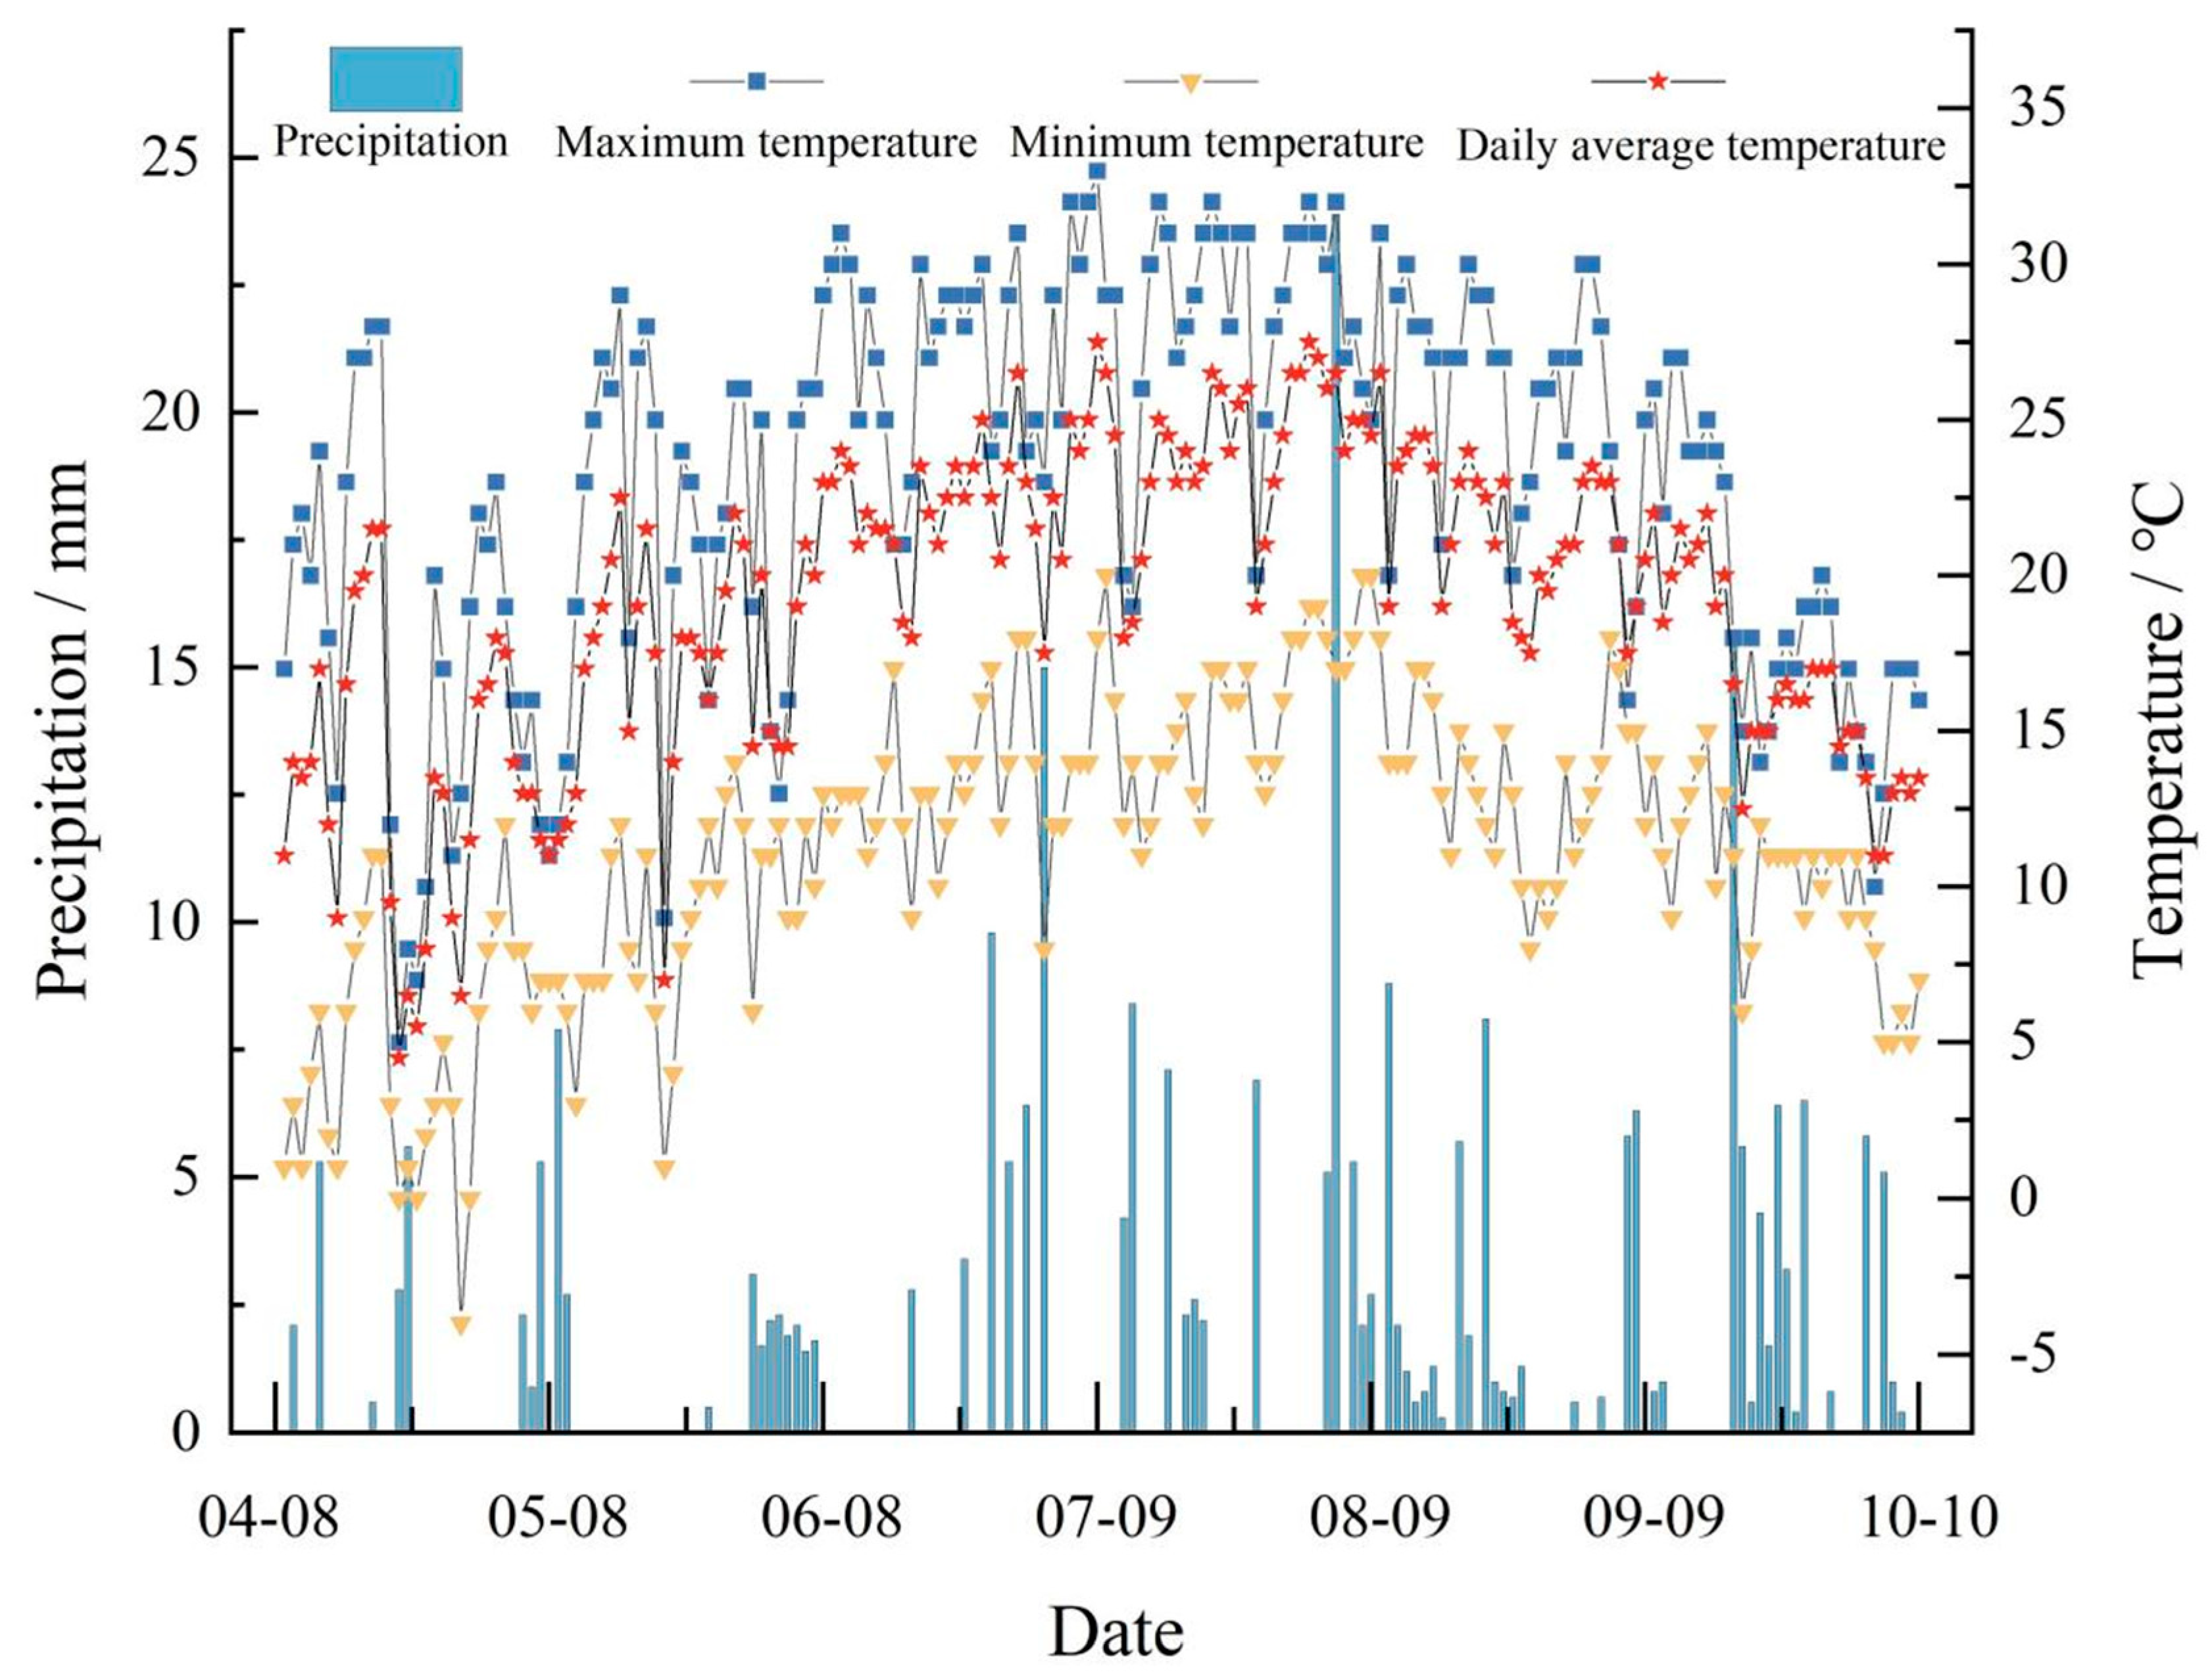
2.1. Test Location and Growing Conditions

The experiment was conducted from May to October 2023 in the orchard of Kangtian Fruit Farmers’ Specialized Cooperative, Youjia Village, Shuangxian Town, Jingning County, Pingliang City, Gansu Province (37°32′ N, 105°72′ E, 1807 m above sea level). The apple phenology period for this orchard started from 8 April to 10 October, totaling 186 days. The meteorological data of the test area showed that the average daily temperature during the apple phenology period in 2023 ranged from 7 °C to 27.5 °C, with the highest temperature being 32 °C and the lowest temperature being −4 °C (Figure 1). The total rainfall during the apple trees’ phenology period in 2023 was 275.5 mm, and the effective rainfall was 207.6 mm, which accounted for 75.35% of the total rainfall for the phenology period. The rainfall was mainly concentrated from July to September, accounting for 68.7% of the total rainfall in the phenological period. The precipitation from April to June accounted for 26.9% of the total precipitation in the phenological period. The precipitation in October accounted for 4.5% of the total precipitation in the whole phenological period (Table 1).
The 7-year-old apple tree (Yanfu No. 6) with the same growth vigor was selected as the test material. The plant height was 285–310 cm, the stem diameter was 9.30–10.50 cm, and the plant was planted in a north–south direction. The row spacing was 2 m × 4 m (101 plants/mu). The soil texture of 0–120 cm in the demonstration area was loam, the soil moisture content was 13.7% (mass moisture content), the average soil bulk density was 1.08 g/cm3, the pH was 8.1, the soil was alkaline, the effective N, P and K contents were 22.60, 11.10 and 262.3 mg·kg−1, the total N, P and K contents were 1.23, 0.59 and 13.79 g·kg−1, the organic matter content was 1.6%, and the soil was relatively barren. The rainfall and effective rainfall during the phenological period for apple trees are shown in Table 1. Irrigation date and irrigation amount for different water and nitrogen treatments in 2023 are seen in Figure S1.

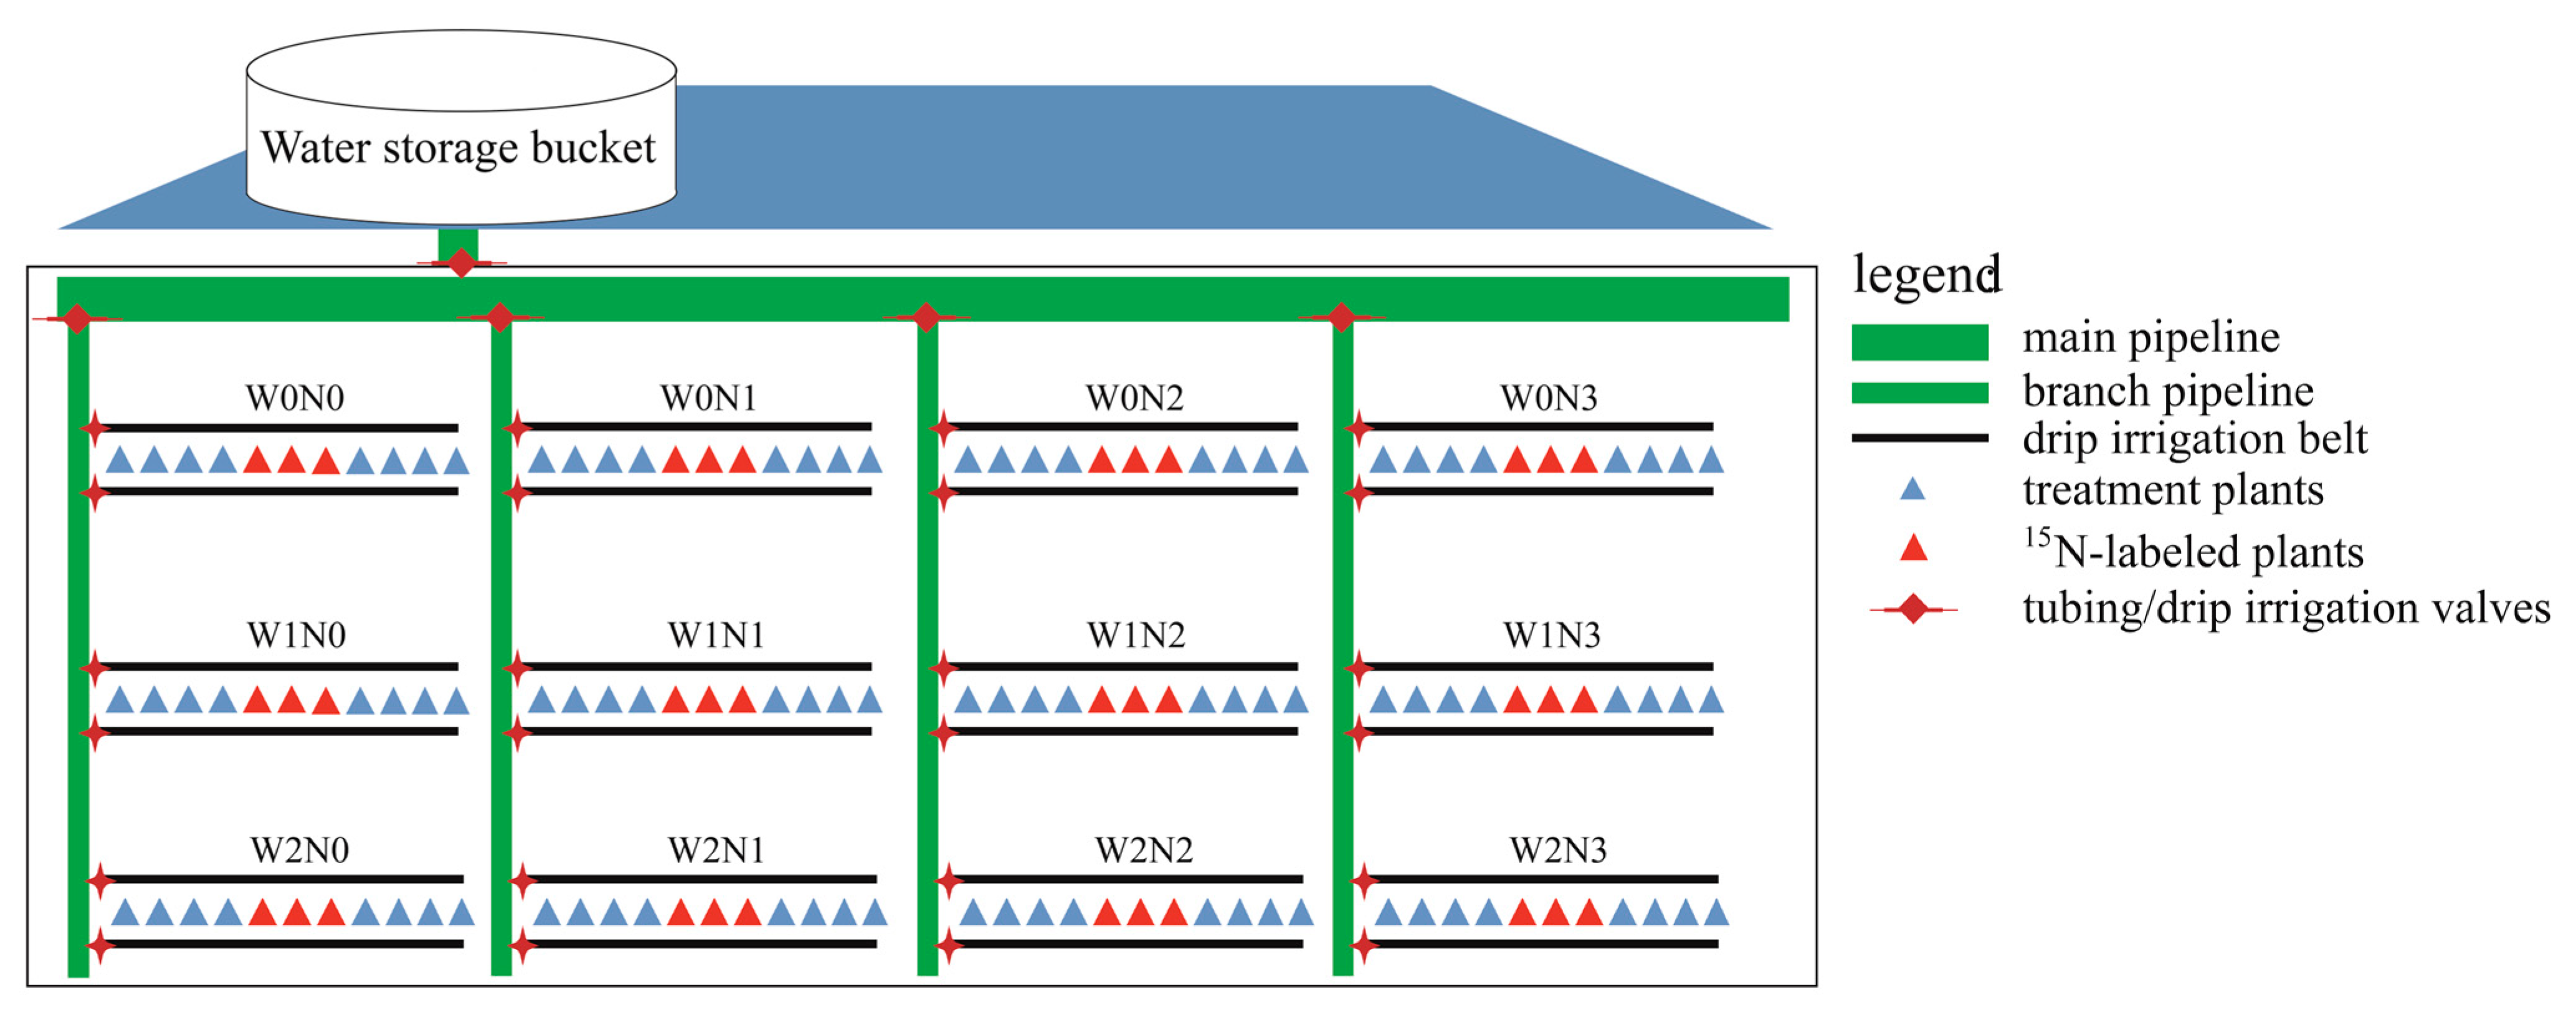
2.2. Experimental Design

The experiment adopted a two-factor experimental design (Figure 2). The first factor was that of three levels of irrigation, namely: moderate drought stress (W0): 40–50% RWC, mild drought stress (W1): 50–65% RWC, and suitable water content (W2): 65–80% RWC, regulated by drip irrigation. The second factor was that of 4 levels of nitrogen application (using urea with nitrogen content of 46.4%), including no nitrogen application (N0): 0.0 kg/ha, low nitrogen (N1): 150 kg/ha, medium nitrogen (N2): 300 kg/ha, and high nitrogen (N3): 600 kg/ha; the nitrogen fertilizer source is urea with a nitrogen content of approximately 46.4%. Phosphorus and potassium fertilizers were applied at a rate of 8 kg/acre of monopotassium phosphate, all applied at once. The experiment adopted a randomized complete block design with 12 treatments: W0N0, W0N1, W0N2, W0N3, W1N0, W1N1, W1IN2, W1N3, W2N0, W2N1, W2N2, and W2N3, each replicated 3 times. A total of 132 plants with similar growth potential and free from pests and diseases were selected, with 11 plants per treatment. Among these, 3 plants were labeled with 15N. The 15N-labeled plants were subjected to treatments N0 (0 g 15N-labeled urea/plant), N1 (1.2 g 15N-labeled urea/plant), N2 (2.4 g 15N-labeled urea/plant), and N3 (3.6 g 15N-labeled urea/plant). Four holes with a depth of 30 cm were drilled around 50 cm from the trunk, and the dissolved 15N-labeled urea was uniformly applied in four holes. Urea and 15N-labeled urea were applied simultaneously. At the young fruit expansion stage (10 June), 40% of the annual nitrogen application was applied, followed by another 40% at the rapid fruit expansion stage (4 July), and the remaining 20% was applied at the fruit color transition stage.

2.3. Determination Items and Methods

Abbreviations for all indicators in the manuscript are given in Table S1.

2.3.1. Leaf Blade Growth

In mid-August, each treatment had three biological replicates, with 100 functional leaves randomly selected from each replicate for the measurement of leaf area (LA) and one hundred leaves for thickness (HLT). The LA was measured by LA meter and the LA was measured by vernier caliper.

2.3.2. Photosynthetic Characteristics

In the fruit expansion period (12 August), the same functional leaves with no pests and diseases and good growth were selected, and the photosynthetic characteristics of leaves were measured by portable photosynthesis instrument (Li-6400). The determination time was 8:00–18:00, once every 2 h, and each one had 3 repetitions. Measurement content: net photosynthetic rate (Pn), transpiration rate (Tr), stomatal conductance (Gs), intracellular carbon dioxide concentration (Ci)and instantaneous water use efficiency (WUE).

2.3.3. Leaf Chlorophyll

Photosynthetic pigments in the leaves of harvested plants were quantified by the acetone-extraction method of Lichtenthaler and Wellburn [28]. The collected leaves were washed and wiped dry, immediately put into liquid nitrogen and brought back to the laboratory. The leaves were cut into pieces and mixed well. Then, 0.2 g fresh leaves were weighed and placed in a test tube with 80% acetone as to extract chlorophyll a (Chl a), chlorophyll b (Chl b) and carotenoids (Car). Add 10 mL 80% acetone, cover with a cork, at room temperature in the dark overnight, and shake 3–4 times during the period. The next day, the test tube was taken out, and the leaf tissue was observed to have all turned white. When the chlorophyll had been completely dissolved in the extract, the acetone (80%) was used make the volume constant at 15 mL. Then, 2 mL of the supernatant was extracted, and the absorbance values were measured at 663 nm (Chl a absorption peak), 646 nm (Chl b absorption peak) and 470 nm (Car) by ultraviolet spectrophotometer (UV-1200, American Spectrum, China), and then the concentrations of Chl a, Chl b, and Car were calculated according to the following Equations (1)–(3):
Chl a concentration: Ca = 12.21 (A663) − 2.81 (A646)
Chl b concentration: Cb = 20.13 (A646) − 5.03 (A663)
Car concentration: Cr = (1000 × A470 − 3.27 × Ca − 104 × Cb)/229
In the Formulas (1)–(3), A663, A646 and A470 are the absorbance values at the corresponding wavelengths, V is the volume of the extract, W is the fresh weight of the leaves, and the unit of chlorophyll content is mg·g−1 FW.

2.3.4. Determination of Mineral Elements and 15N in Leaves

At the maturity stage of the fruit, the leaves of the upper, middle and lower layers of the apple tree and the four directions east, west, south and north were selected for sampling. Each treatment had three replicates, and 30 leaves were taken from each replicate. After the fresh weight was taken, it was sealed and quickly brought back to the laboratory, and deactivated at 105 °C for 30 min. Then it was dried at 80 ° C, and the dry weight was weighed. It was crushed by stainless steel electric mill and passed through a 0.25 mm mesh sieve. The sieved sample was ball milled and bagged for later use.
A dry sample of 0.5 g of milled apple leaves was weighed, moistened with a small amount of ultrapure water and then 5 mL of concentrated sulfuric acid was added. After adding 30% H2O2, the digestion solution was filtered into a 50 mL volumetric flask and set aside for use. 25 mL of the decoction solution was put into a digestion tube, and the total nitrogen (TN) concentration of the sample solution was determined using the Kjeldahl nitrogen method [29].
Total phosphorus (TP) content was determined using the molybdenum–antimony colorimetric method [30], The decoction of the sample was the same as the above determination of total nitrogen, and 1 mL of decoction was removed from a 25 mL volumetric flask, 1 drop of dinitrophenol indicator was added, and the pH was conditioned with 240 g/L sodium hydroxide solution and 2 mol/L dilute sulfuric acid solution until the solution was slightly yellow. Add 2 mL of molybdenum antimony anti-colorant and shake well, the distilled water was fixed. After resting for 30 min, the color was measured at 700 nm on an enzyme meter. Determine and plot the standard curve with phosphorus standard solution, find the regression equation and calculate the total phosphorus content.
Total potassium (TK) content was determined using the flame photometer method proposed by Kacar [30], On a ZEEnit 700P atomic absorption spectrometer, the detector reading was adjusted to zero with a reagent blank solution as reference, and then the detector reading of potassium was measured directly with the filtrate of the leaf sample to be tested. The potassium standard solution was prepared with potassium chloride, measured, and a working curve was made to calculate the whole potassium content.

2.3.5. Nitrogen Use Efficiency

The abundance of 15N was determined by DELTA V Advantage Isotope Ratio Mass Spectrometer (Isotope Ratio Mass Spectrometer) (Shenzhen Huake Jingxin Detection Technology Co., Ltd., Shenzhen, China). Nitrogen utilization efficiency was calculated using Equations (4)–(7) with reference to Hou et al. [8]:
Total nitrogen (g) = dry matter (g) × N (%)
Ndff% = (15N abundance in sample − natural 15N abundance)/(15N abundance in fertilizer − natural 15N abundance) × 100
15N uptake (mg) = total nitrogen (g) × Ndff% × 1000
Nitrogen use efficiency(NUE) (%) = 15N uptake (g)/nitrogen application (g) × 100
In the Formula (5), Ndff% is the percentage of nitrogen absorbed by the plant from the fertilizer, which reflects the ability of plant organs to compete for fertilizer nitrogen uptake and can be calculated directly from data measured by the tracer method. In the Formula (6), 15N uptake is the Amount of 15N taken up by plants from 15N-labeled urea.

2.3.6. Data Statistical Analysis

Microsoft Excel 2010 and origin 2022 were used for data processing, calculation and drawing. IBM SPSS Statistics 26 statistical analysis software was used for correlation analysis, principal component analysis and variance analysis.

3. Results and Analysis

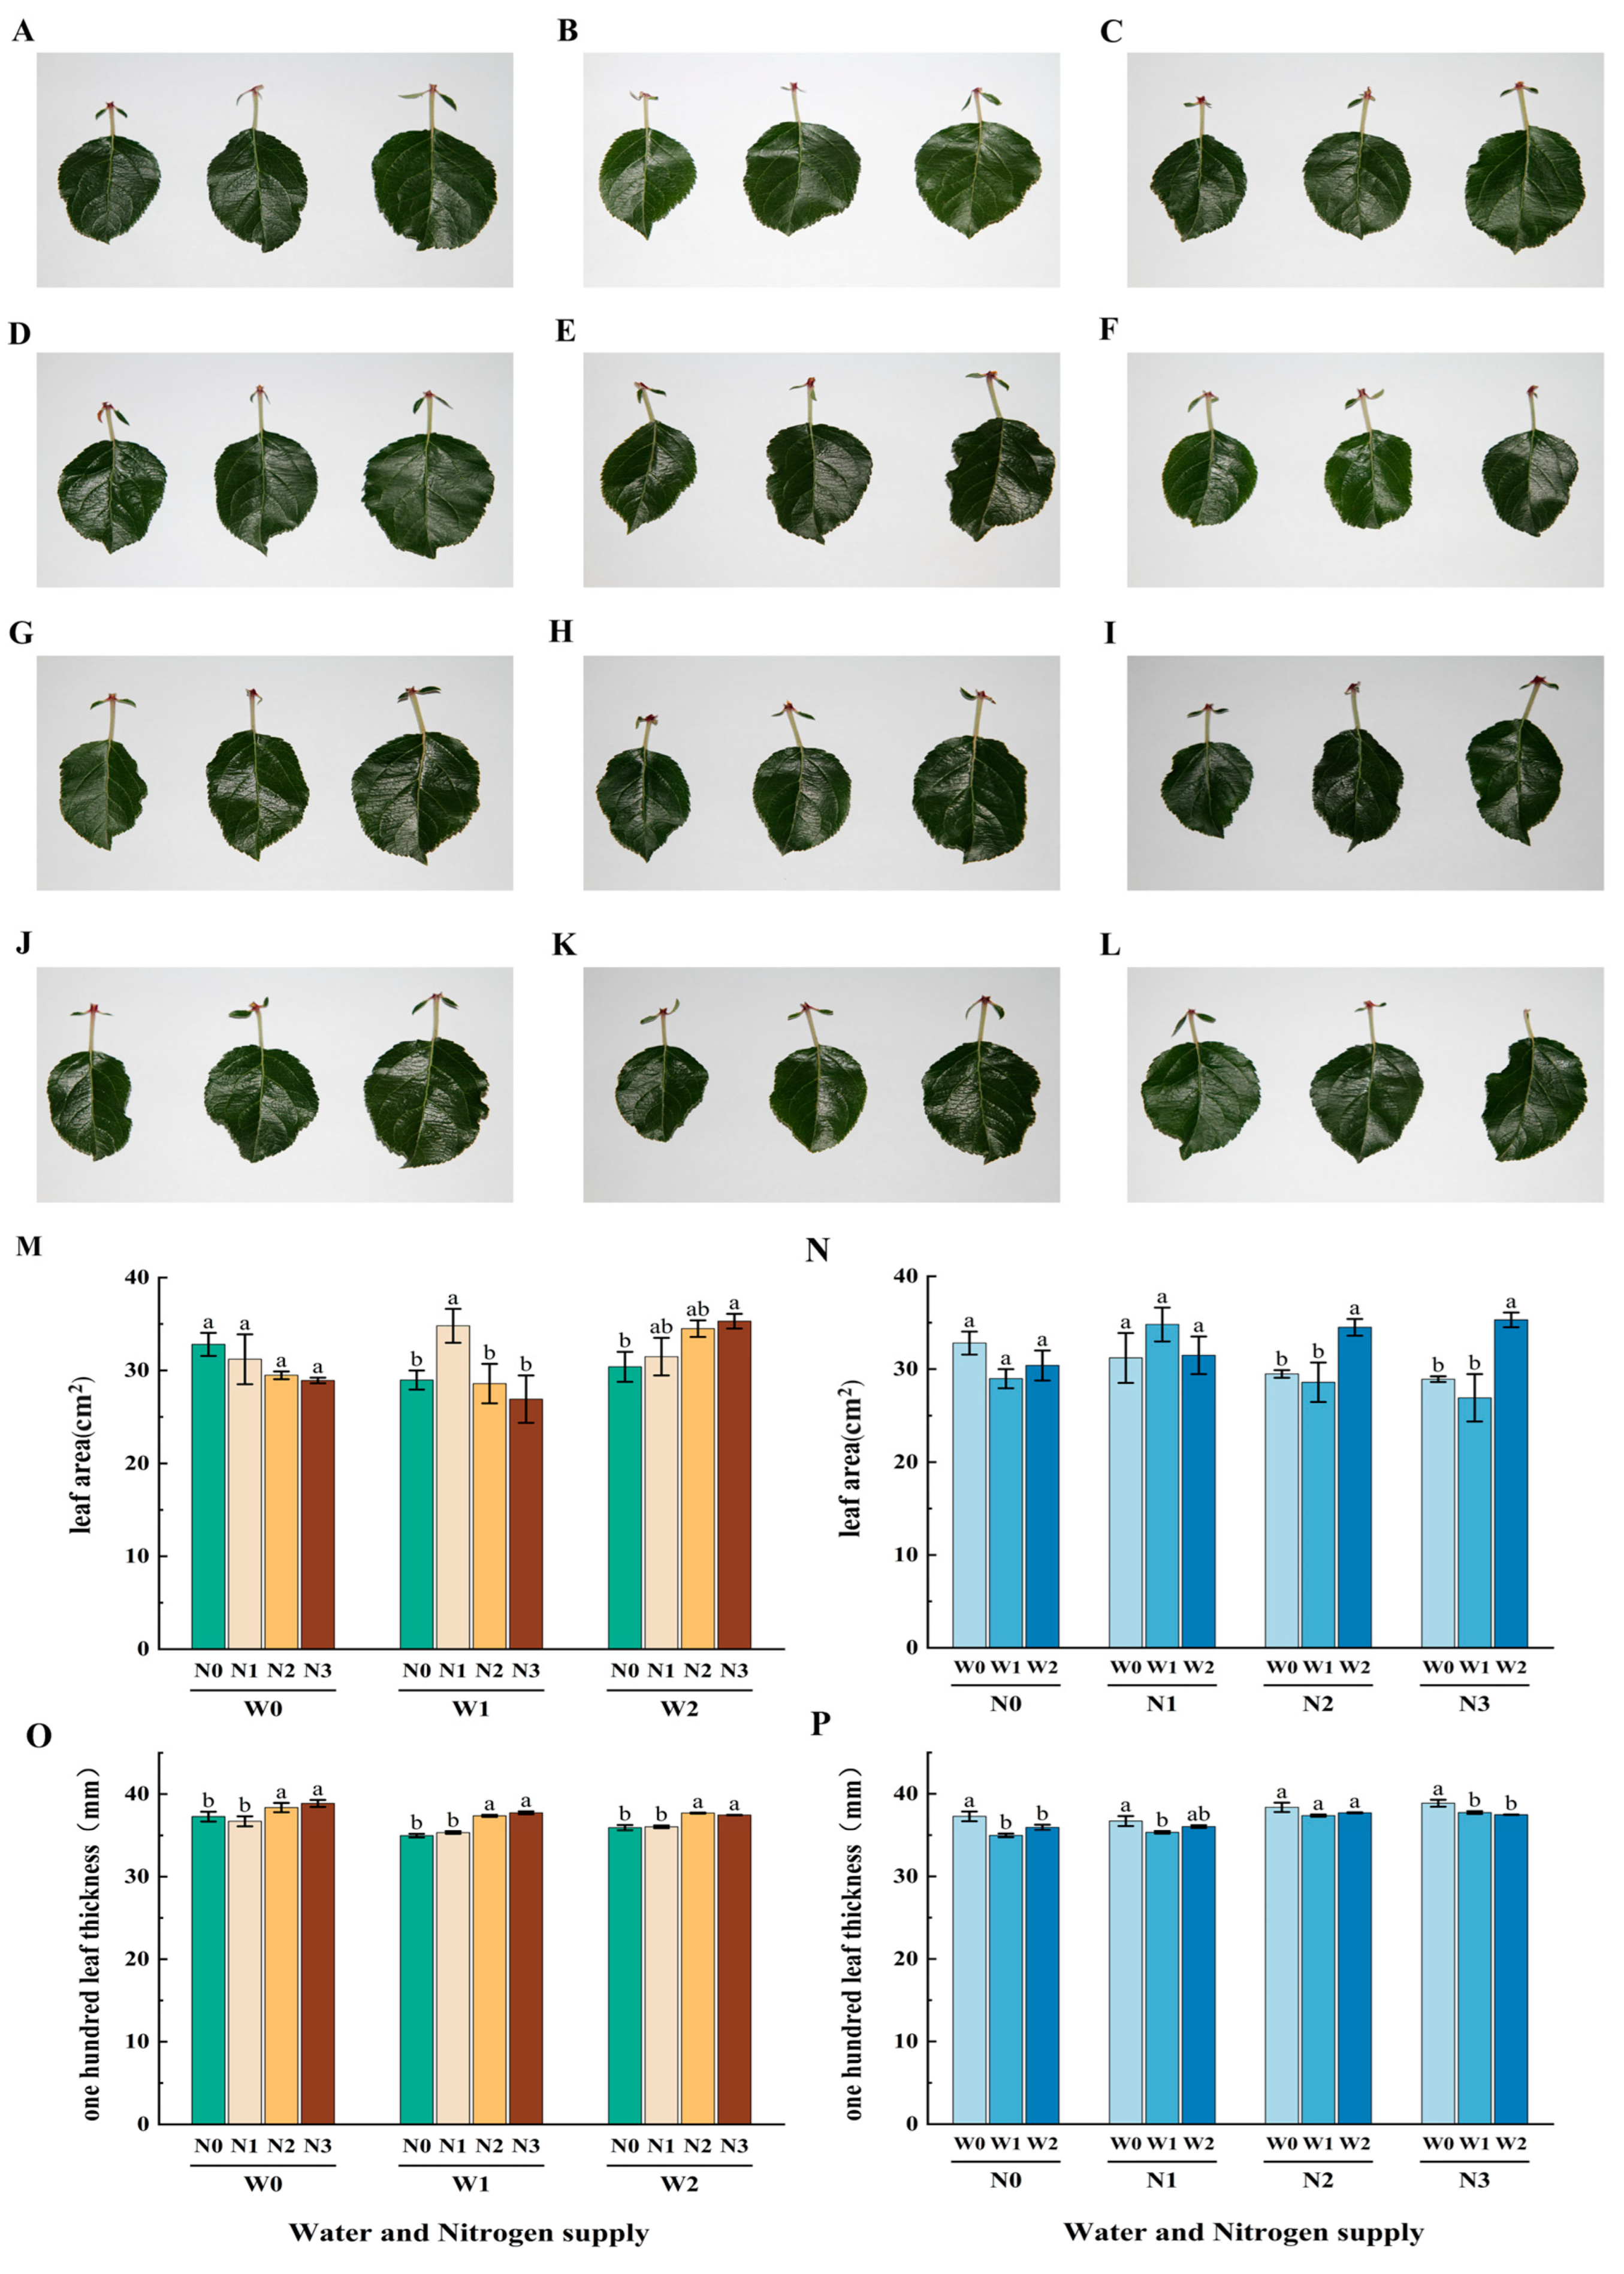
3.1. Effects of Different Water and Nitrogen Treatments on the Growth of Apple Leaves

A comparison was made of the morphology of mature functional leaves under different water and nitrogen treatments (Figure 3A–L). The analysis of apple LA and HLT under different water and nitrogen treatments showed that, at the same irrigation level, and at the W0 level, the LA gradually decreased with the increase in nitrogen application rate, and there was no significant difference between different nitrogen application rates. Under W1 level, the highest LA of 34.80 cm2 was recorded under W1N1, which was 20.08%, 21.72% and 29.32% higher compared to W1N0, W1N2 and W1N3, respectively. Under W2 level, the highest LA of 35.30 cm2 was recorded under W2N3, which was 16.12%, 12.13% and 2.35% higher compared to W2N0, W2N1 and W2N2, respectively. Under the same nitrogen level, there was no significant difference between different irrigation treatments at N0 and N1 levels. Under N2 and N3 levels, the LA under W2 treatment was significantly higher than that under W0 and W1. Among these, W2N2 was 34.49 cm2, which was 16.99% and 20.64% higher compared to W0N2 and W1N2, W2N3 was 35.3 cm2, and which was 22.06% and 31.18% higher compared to W0N3 and W1N3 (Figure 3M,N).
By measuring the HLT, it was found that, under the same irrigation level, the HLT under N2 and N3 treatments was significantly higher than that under N0 and N1 treatments. W0N2 was 38.37 cm2, which was 2.95% and 4.55% higher compared to W0N0 and W0N1, W0N2 and W0N3 were not significantly different. W1N2 was 37.37 cm2, which was 6.86% and 5.77% higher compared to W1N0 and W1N1, W1N2 and W1N3 were not significantly different. W2N2 was 37.7 cm2, which was 4.93% and 4.64% higher compared to W2N0 and W2N1, and W2N2 and W2N3 were not significantly different. Under the same nitrogen application level, the HLT under W0 treatment was higher. Among them, W0N0 was 37.27 cm2, which was 6.58% and 3.73% higher compared to W1N0 and W2N0; W0N1 was 36.7 cm2, which was 3.88% and 1.86% higher compared to W1N1 and W2N1; W0N2 was 38.37 cm2, which was 2.68% and 1.78% higher compared to W1N2 and W2N2; and W0N3 was 38.87 cm2, which was 3.02% and 3.74% higher compared to W1N3 and W2N3 (Figure 3O,P).

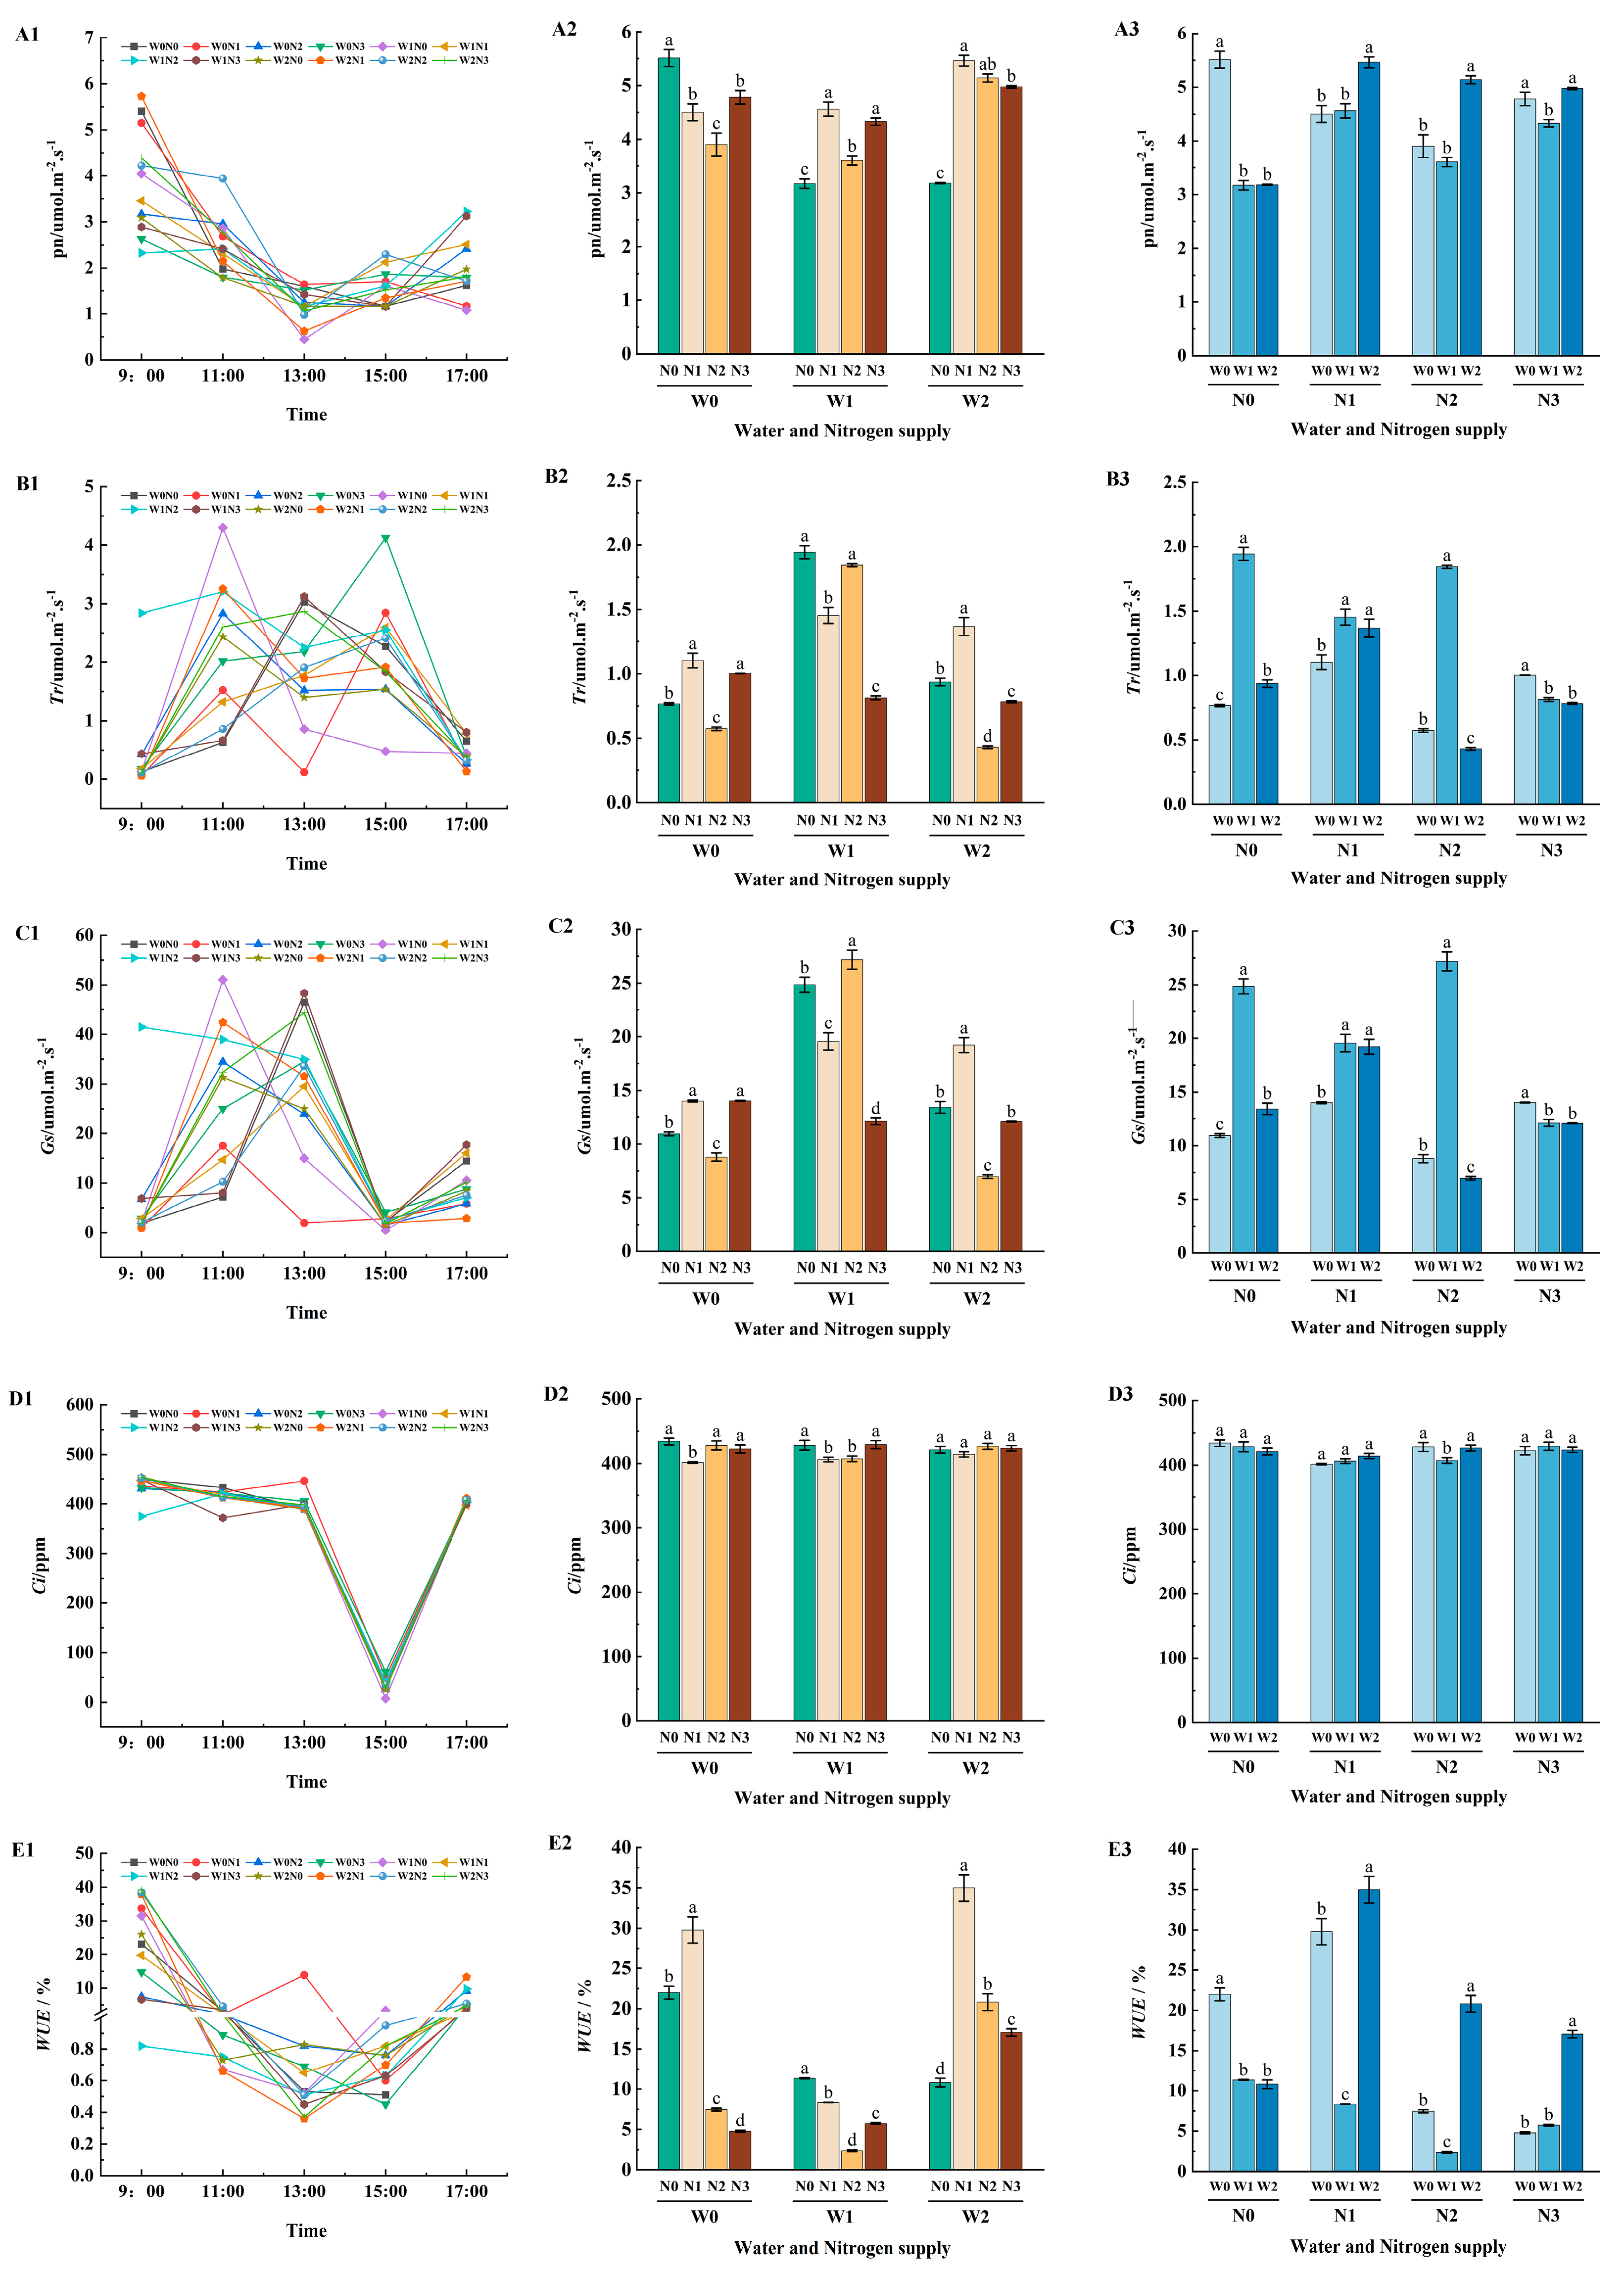
3.2. Effects of Different Water and Nitrogen Treatments on Photosynthetic Efficiency of Apple Leaves

On 12 August, a significant ‘noon break’ phenomenon was observed in the diurnal variation of apple leaves Pn (Figure 4(A1,B1,C1,D1,E1)). By analyzing the photosynthetic efficiency of leaves at 9–10 am, it can be seen that, among the 12 treatments, the Pn of W0N0 treatment is highest at the N0 level, which was 5.51 umol·m−2·s−1. The Pn of W1N0 and W2N0 treatment were lower, which were 3.17 umol·m−2·s−1 and 3.18 umol·m−2·s−1, respectively. The Pn of W0N0 treatment was 73.8% and 73.3% higher than that of W1N0 and W2N0. At the W2 level, the Pn of W2N1 and W2N2 treatments was higher, 5.46 umol·m−2·s−1 and 5.14 umol·m−2·s−1, respectively, and the Pn of W2N0 treatment was lower, at 3.18 umol·m−2·s−1. W2N1 and W2N2 treatment were 71.7% and 61.6% higher than W2N0, respectively, indicating that, at the N0 level, with the increase in irrigation amount, the Pn of leaves decreased significantly. At the W2 level, the Pn of leaves increased significantly with the increase in nitrogen application rate, and the nitrogen application rate was too large. The Pn of leaves decreased significantly (Figure 4(A2,A3)).
The study of different water and nitrogen treatments on the Tr of apple trees found that, at the N0 level, the Tr of W1N0 treatment was the highest, which was 1.94 umol·m−2·s−1, and the Trs of W0N0 and W2N0 treatments were lower, which were 0.78 umol·m−2·s−1, and 0.94 umol·m−2·s−1, respectively. W1N0 was 148.7% and 106.4% higher than W0N0 and W2N0. At the W2 level, the Tr of W2N1 treatment was the highest, which was 1.37 umol·m−2·s−1. The Tr of W2N0 and W2N2 treatments were lower, which were 0.94 umol·m−2·s−1, and 0.43 umol·m−2·s−1, respectively. W2N1 was 45.7% and 218.6% higher than W2N0 and W2N2. This shows that, under the level of N0, the Tr of leaves increases significantly with the increase in irrigation amount, and the Tr of leaves decreases significantly with the increase in irrigation amount. At the W2 level, the Tr of leaves increased significantly with the increase in nitrogen application rate, and the Tr of leaves decreased significantly with the increase in nitrogen application rate (Figure 4(B2,B3)).
Studies have shown that the Gs of apple tree leaves is affected by different water and nitrogen treatments. Among the 12 treatments, at the N0 level, W1N0 treatment had the highest Gs of 24.9 umol·m−2·s−1, whereas W0N0 and W2N0 treatments had lower Gs of 10.9 umol·m−2·s−1 and 13.4 umol·m−2·s−1, respectively. W1N0 was 128.4% and 85.8% higher than W0N0 and W2N0. At the W2 level, the Gs of W2N1 treatment was the highest, which was 19.2 umol·m−2·s−1. The Gs of W2N0 and W2N2 treatments was lower, which was 13.4 umol·m−2·s−1 and 7.0 umol·m−2·s−1, respectively. The Gs of W2N1 was 43.3% and 174.3% higher than that of W2N0 and W2N2. This shows that, under the N0 level, the Gs of the leaves increases significantly with a moderate increase in irrigation amount, and the Gs of the leaves decreases significantly with an excessive irrigation amount. At W2 level, the Gs of leaves increased significantly with the increase in nitrogen application rate (Figure 4(C2,C3)).
The effects of water and nitrogen treatments on Ci in apple leaves were studied. The results showed that, at the N0 level, the Ci of W0N0 treatment was the highest, which was 434.1 PPM. The Ci of W1N0 treatment and W2N0 treatment was lower, which was 428.3 PPM and 421.2 PPM, respectively. W0N0 was 1.4% and 3.1% higher than W1N0 and W2N0. At the W2 level, the Ci of leaves decreased significantly with the increase in nitrogen application rate. The effect of W2N2 treatment was the highest, which was 426.5 PPM in different water and nitrogen treatments. The Ci of W2N0 and W2N1 treatments was lower, at 421.2 PPM and 414.2 PPM, respectively. W2N2 was 1.3% and 3.0% higher than W2N0 and W2N1. This showed that, under the N0 level, with the increase in irrigation amount, the decrease in Ci in leaves was not significant. Under the W2 level, the Ci of the leaves did not increase significantly with a moderate increase in nitrogen application (Figure 4(D2,D3)).
The study on the WUE of apple leaves under different water and nitrogen treatments showed that at the N0 level, the WUE of W0N0 treatment was the highest, which was 22.0%, and the WUE of W1N0 treatment and W2N0 treatment was lower, which was 11.3% and 10.8%, respectively. W0N0 was 94.7% and 103.7% higher than W1N0 and W2N0. Under the W2 level, the WUE of W2N1 treatment was the highest, which was 35.0%. The WUE of W2N0 and W2N2 treatments was lower, which was 10.8% and 20.8%, respectively. W2N1 was 224.1% and 68.3% higher than W2N0 and W2N2. It shows that under the N0 level, the WUE of leaves decreases significantly with the increase in irrigation amount. Under the W2 level, the WUE of leaves increased significantly with the increase in nitrogen application rate, and the WUE of leaves decreased significantly with the increase in nitrogen application rate (Figure 4(E2,E3)).
From the above, it can be seen that, under the condition of no nitrogen application, appropriate increase in irrigation amount or under high water conditions, appropriate increase in nitrogen application amount will promote the Pn of leaves. Under the condition of no nitrogen application, excessive irrigation amount or under high water conditions, excessive nitrogen application will inhibit the Pn of leaves. In this experiment, W1N0 and W2N1 treatments demonstrate a strong photosynthetic rate in leaves, indicating that the coupling effect of water and nitrogen has a significant effect on the photosynthetic rate of leaves. Therefore, it is necessary to improve the Pn of leaves by applying nitrogen according to water, or controlling water according to nitrogen in production (Figure 4).

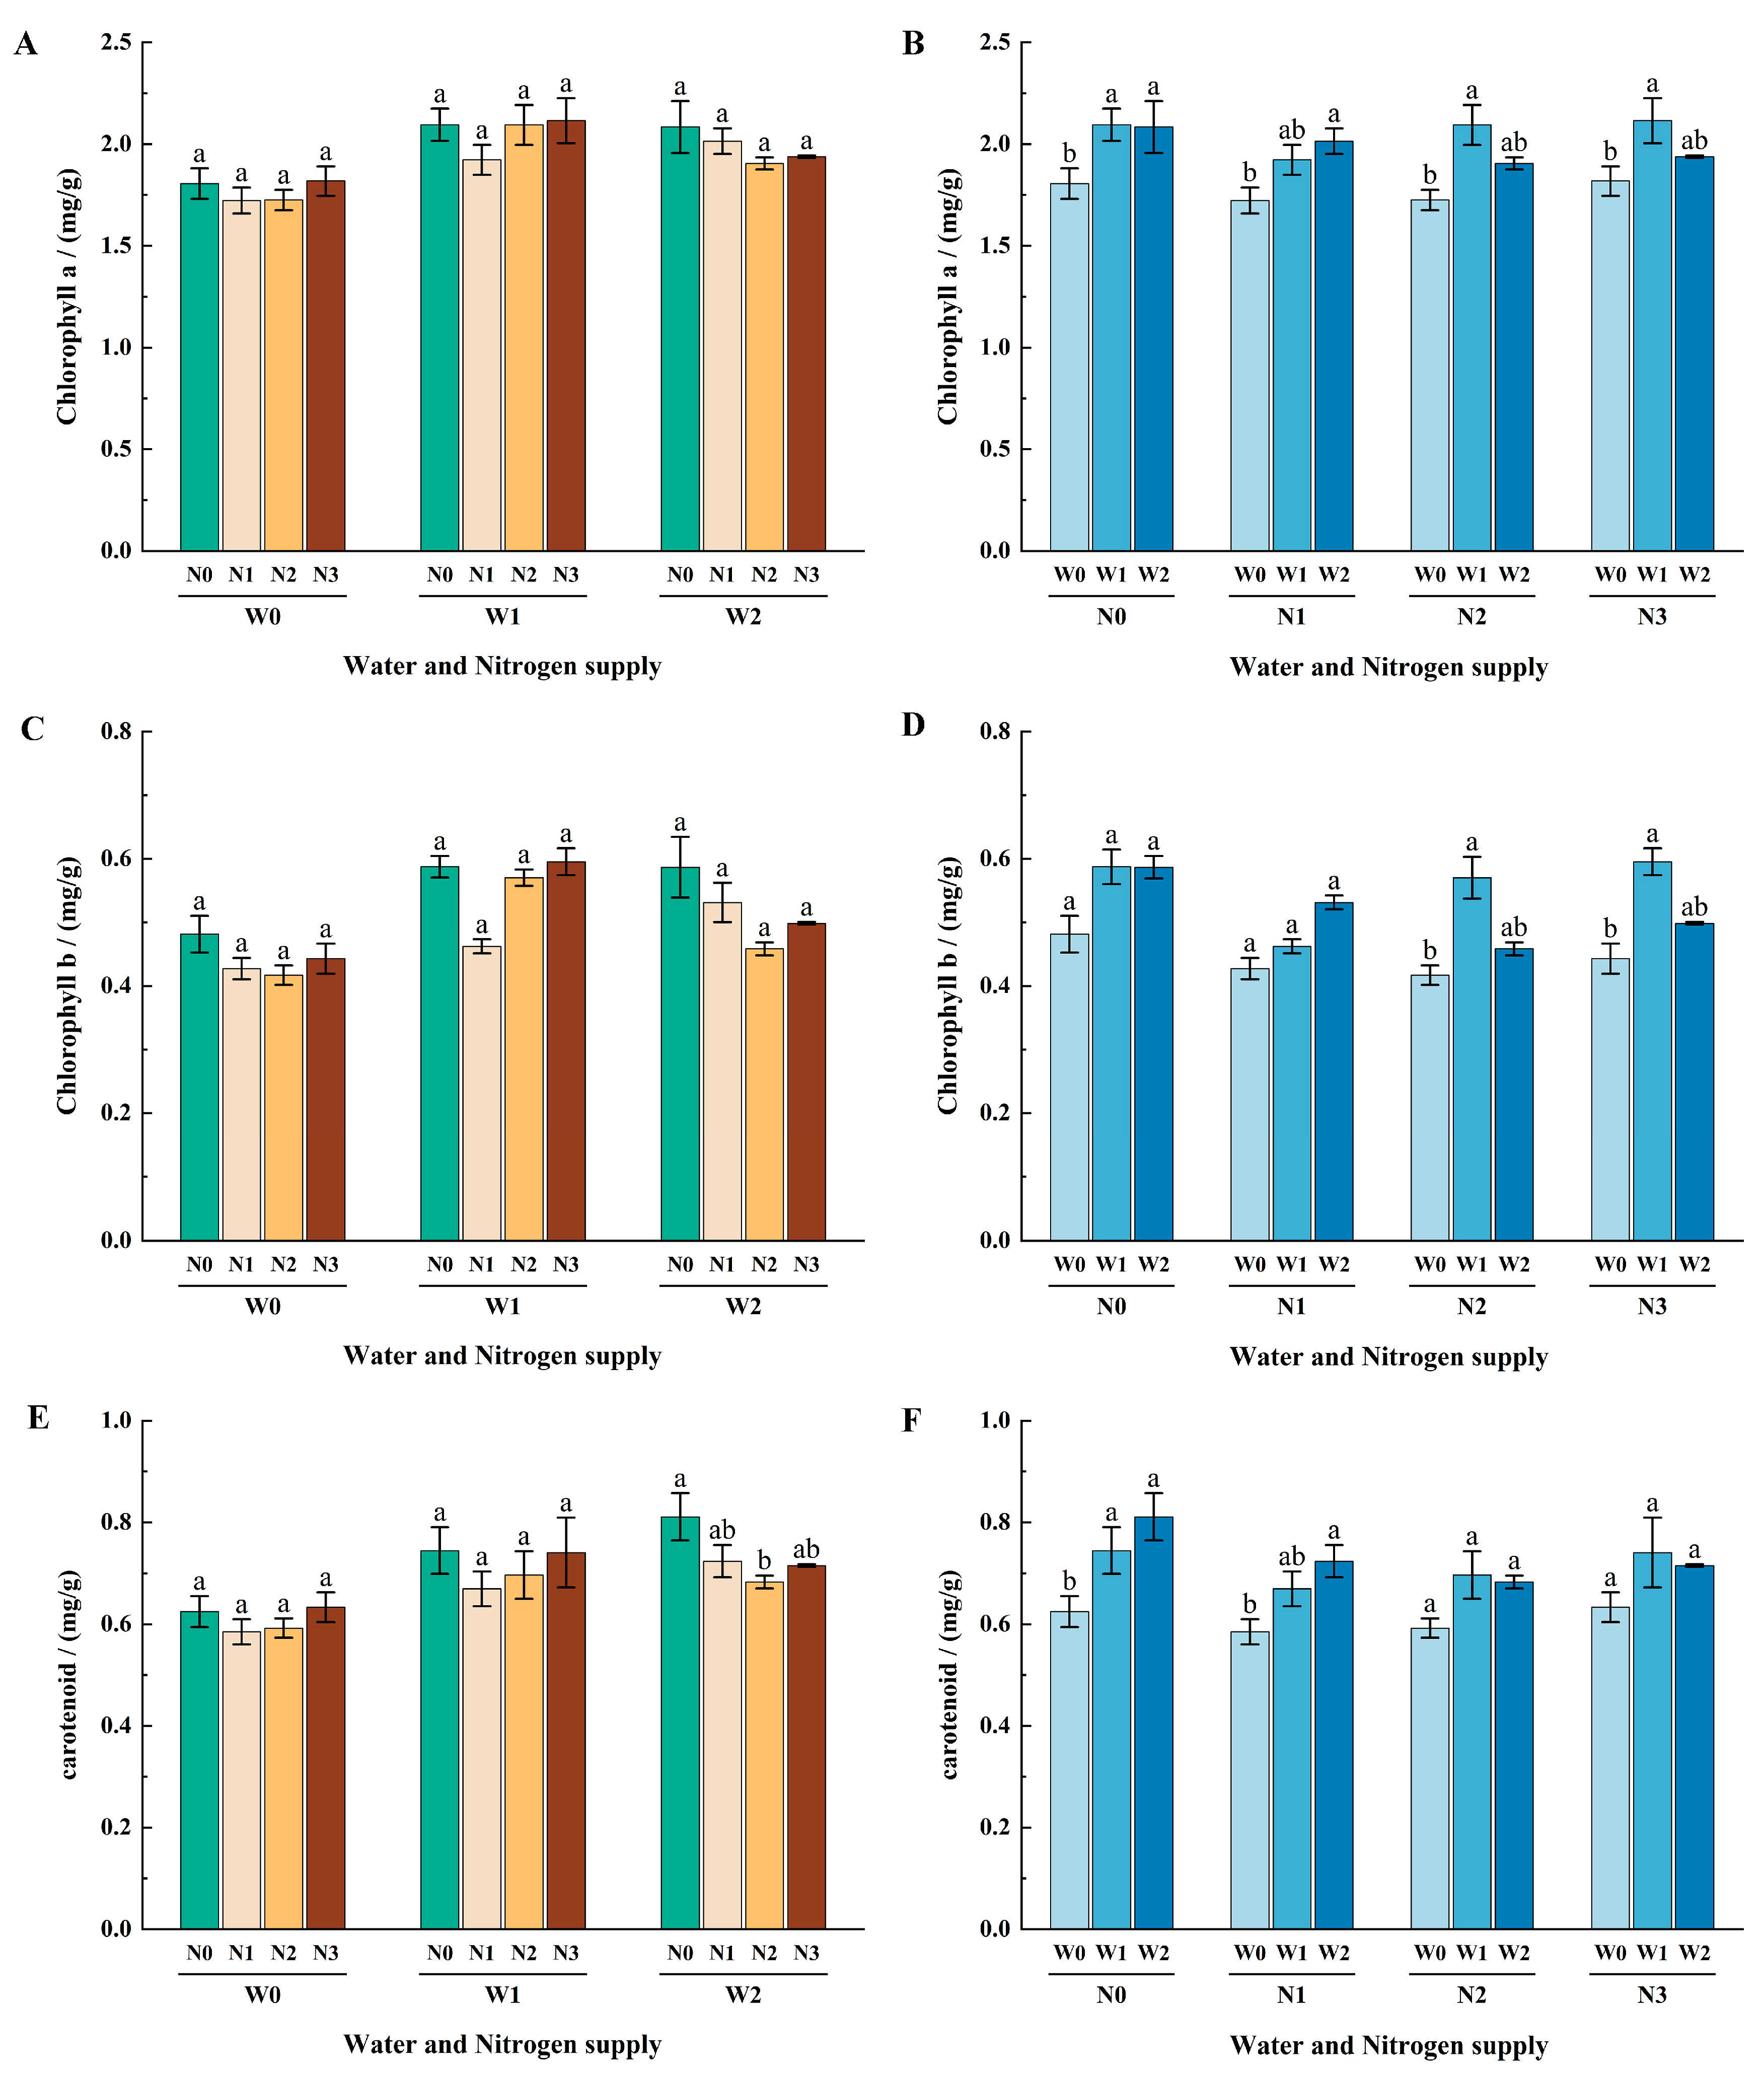
3.3. Effects of Different Water and Nitrogen Treatments on Chlorophyll Content in Apple Leaves

Under the same irrigation level, there was no significant difference in Chl a content between different nitrogen application levels, and the overall trend first decreased and then increased. Under the same nitrogen application level, there was a significant difference in Chl a content between different irrigation levels. There was no significant difference between W2 and W1 at the N0 and N1 levels, but W2 was significantly higher than W0, with W2N0 at 2.08 mg/g, 15.3% higher compared to W0N0, and W2N1 at 2.01 mg/g, 16.9% higher compared to W0N1. At N2 and N3 levels, there was no significant difference between W1 and W2, but W1 was significantly higher than W0. In particular, W1N2 was 2.09 mg/g, which was 21.4% higher compared to W0N2, and W1N3 was 2.12 mg/g, which was 16.3% higher compared to W0N3. Under the same irrigation level, there was no significant difference in chlorophyll content between different nitrogen application levels, and the overall trend first decreased and then increased (Figure 5A,B).
Under the same nitrogen application level, there were differences in Chl b content between different irrigation levels. Among them, there was no significant difference between different irrigation levels at N0 and N1 levels. At N2 and N3 levels, there was no significant difference between W1 and W2, but W1 was significantly higher than W0. In particular, W1N2 was 0.17 mg/g, which was 36.7% higher compared to W0N2, and W1N3 was 0.19 mg/g, which was 34.3% higher compared to W0N3 (Figure 5C,D).
Under the same irrigation level, there were differences in Car content between different nitrogen application levels. Under W0 and W1 levels, there was no significant difference between different nitrogen application levels. With the increase in nitrogen application rate, this first decreased and then increased. Under W2 level, there was a significant difference between different nitrogen application levels. N2 was significantly lower than N0, and W2N2 was 0.03 mg/g, which is 15.8% lower compared to W2N0. Under the same nitrogen application level, there were differences in Car content between different irrigation levels. At the N0 level, W1 and W2 were significantly higher than W0 with 0.08 mg/g for W1N0, 19.2% higher compared to W0N0 and 0.13 mg/g for W2N0, 29.8% higher compared to W0N0, and at the N1 level, W2 was significantly higher than W0 with 0.06 mg/g for W2N1, 15.8% higher compared to W0N1. Under N2 and N3 levels, there was no significant difference between different irrigation levels, and the interaction between irrigation and nitrogen application had a significant effect on Car content (Figure 5E,F).
It can be seen from the above that, under the condition of no nitrogen application, increasing the amount of irrigation will significantly increase the chlorophyll content of the leaves. Under low water conditions, increasing the amount of nitrogen application has no significant effect on the chlorophyll content of the leaves. In this experiment, the chlorophyll content of the leaves was higher under W1N2 treatment, indicating that the coupling effect of water and nitrogen had a significant effect on the chlorophyll content of the leaves (Figure 5).

3.4. Effects of Different Water and Nitrogen Treatments on Mineral Elements in Apple Leaves

Changes of TN element: Among the 12 treatments, the contents of TN element in W0N1, W1N2 and W2N2 were higher, at 26.0 g/kg, 28.9 g/kg and 28.5 g/kg, respectively. The contents of TN element in W0N0, W0N3 and W2N3 were lower, at 23.0 g/kg, 23.0 g/kg and 23.3 g/kg, respectively. Among them, W0N1 was 13.0% higher than W0N0, and W2N2 was 22.3% higher than W2N3. It can be seen from the above that, under the same irrigation or nitrogen application level, the content of TN element in leaves increased significantly with the increase in nitrogen application rate or irrigation amount, but too much nitrogen application rate or irrigation amount would reduce the content of TN element in leaves. In this experiment, the TN content of W0N1, W1N2 and W2N2 treatments showed that the interaction effect of water and nitrogen also had a significant effect on the TN content of leaves (Table 2).
Changes of TP element: Among the 12 treatments, the contents of TP element in W0N2, W0N3 and W1N2 treatments were higher, at 1.1 g/kg, 1.0 g/kg and 1.0 g/kg, respectively. The contents of TP element in W0N1, W1N1 and W2N3 treatments were lower, at 0.6 g/kg, 0.6 g/kg and 0.6 g/kg, respectively. Among them, W0N2 was 2.2% higher than W0N0, and W0N3 was 66.7% higher than W2N3. From the above, it can be seen that, under the same irrigation or nitrogen application level, with the increase in nitrogen application or irrigation amount, the content of TP element in leaves decreases. In this experiment, the content of TP element in W0N1, W1N1 and W2N3 treatments was low, indicating that the interaction effect of water and nitrogen also had a significant effect on the content of TP element in leaves (Table 2).
The change of TK element: Among the 12 treatments, the contents of TK element in W0N0, W0N2 and W1N3 treatments were higher, at 14.6 g/kg, 12.1 g/kg and 12.1 g/kg, respectively. The contents of TK element in W1N0, W2N2 and W2N3 treatments were lower, at 3.8 g/kg, 5.3 g/kg and 5.4 g/kg, respectively. Among them, W1N3 was 218.4% higher than W1N0, W0N0 was 284.2% higher than W1N0, and W0N2 was 128.3% higher than W2N2. W1N3 was 124.1% higher than W2N3. It can be seen from the above that, under the same irrigation level, the content of TK element in leaves increased significantly with the increase in nitrogen application rate. Under the same nitrogen application level, the content of TK element in leaves decreased significantly with the increase in irrigation amount. In this experiment, the content of TK element in W1N0, W2N2 and W2N3 was lower, indicating that the interaction effect of water and nitrogen also had a significant effect on the content of TK element in leaves (Table 2).

3.5. Correlation Analysis of Functional Structure, Functional Traits and Nitrogen Use Efficiency of Apple Leaves under Different Water and Nitrogen Treatments

Under different water and nitrogen treatments, correlation analysis of leaf indicators revealed a highly significant positive correlation between Chl a, Chl b, and Car (p ≤ 0.01). Leaf Pn showed a significant positive correlation with WUE, with a correlation coefficient of 0.68, and a significant negative correlation with TP, with a correlation coefficient of −0.48. Leaf Tr exhibited a significant positive correlation with Gs, with a correlation coefficient of 0.98, and significant negative correlations with Ci and HLT, with correlation coefficients of −0.61 and −0.49, respectively. The leaf Gs showed a significant negative correlation with Ci, with a correlation coefficient of −0.55, and a significant negative correlation with HLT, with a correlation coefficient of −0.42. Leaf Ci exhibited a significant positive correlation with HLT, with a correlation coefficient of 0.45. Leaf WUE showed significant negative correlations with TP and HLT, with correlation coefficients of −0.44 and −0.42, respectively. Leaf TP exhibited a significant negative correlation with LA, with a correlation coefficient of −0.50, and a significant positive correlation with HLT, with a correlation coefficient of 0.48. Leaf TK showed a significant negative correlation with LA, with a correlation coefficient of −0.39. From the above analysis, it can be inferred that the Pn of leaves increased, while Tr and Gs decreased, and Ci and WUE increased. Moreover, leaf TP and TK content increased, while LA significantly decreased. Additionally, increased leaf Tr, Gs, and WUE, along with decreased Ci and TP content, all contributed significantly to the reduction in HLT (Figure 6).
Leaf Tr, Gs and WUE were significantly positively correlated with NUE, and the correlation coefficients were 0.60, 0.51 and 0.58, respectively. Ci was significantly negatively correlated with NUE, and the correlation coefficient was −0.67. TN and TK in leaf mineral elements were positively correlated with NUE, TP was negatively correlated with NUE, and LA was positively correlated with NUE in leaf growth. There was a significant negative correlation between HLT and NUE, and the correlation coefficient was −0.77. From the above analysis, it can be inferred that there was no significant correlation between leaf NUE and chlorophyll content, but a significant positive correlation was observed with photosynthetic efficiency. Additionally, this showed positive correlations with TN, TP, and LA, and negative correlations with TP and HLT (Figure 6).

3.6. Effects of Different Water and Nitrogen Treatments on the Absorption and Utilization of 15N-Urea in Apple Tree Tissues and Organs

3.6.1. Ndff% of Different Organs of Apple Plant under Different Water and Nitrogen Treatments

The Ndff% of apple plant organs, including leaves, annual branches, perennial branches, roots, and fruits, varies differently with increasing nitrogen application and irrigation levels under different water and nitrogen treatments. The results are as follows.
Under the W0 irrigation level, with the increase in nitrogen application rate, Ndff% of leaves, annual branches, roots and fruits increased, and Ndff% of perennial branches decreased significantly. Among these, the Ndff% of W0N3 leaves, annual branches and roots were higher, respectively, at 1.23‰, 0.45‰, and 0.43‰. while W0N1 perennial meristems had the highest Ndff% at 0.60‰, and W0N1, W0N2 fruits had the highest Ndff% at 0.06‰. At W1 irrigation level, Ndff% of leaves, perennial branches, roots and fruits showed a trend of ‘increase first, then decrease later’ with increasing rate of nitrogen increase, with the highest Ndff% of, respectively, 1.22‰, 1.16‰, 0.42‰ and 0.08‰ in W1N2 treatment, the Ndff% of annual branch showed a ‘decreasing’ trend, and W1N1 treatment was the highest at 0.45‰. Under W2 irrigation level, with the increase in nitrogen application rate, the nitrogen content of leaf and root fertilizer first decreased fand then increased (Table 3).
Under the same level of nitrogen application, leaf Ndff% showed an ‘increasing’ trend with increasing irrigation at N1, where W2N1 treatment was the highest at 1.13‰, and annual branches and root Ndff% showed a ‘increasing and then decreasing’ trend, of which W1N1 treatment was the highest at 0.45‰ and 0.41‰, respectively, and fruit Ndff% showed a ‘decreasing’ trend, of which W0N1 treatment was the highest at 0.06‰. Under N2 nitrogen application level, with the increase in irrigation amount, Ndff% of leaves, perennial branches, roots and fruits first increased and then decreased, W1N2 treatment was the highest, at 1.22‰, 1.16‰, 0.42‰ and 0.08‰, respectively, and Ndff% of annual branches showed an increasing trend, and W2N2 treatment was the highest at 0.30‰. Under the N3 nitrogen application level, with the increase in irrigation amount, the leaves and roots showed a trend of first decreasing and then increasing, and the nitrogen content of annual branches, perennial branches and fruits showed a decreasing trend, W0N3 treatment was the highest with 1.23‰, 0.45‰, 0.41‰, 0.43‰ and 0.05‰, respectively (Table 3).
The above results showed that the Ndff% in leaves and roots was the highest under W0N3 treatment, at 1.23‰ and 0.43‰, respectively. The Ndff% in leaves was the lowest under W0N1 treatment, at 1.01‰, and the Ndff% in roots was the lowest under W1N3 treatment, at 0.29‰. The leaf Ndff% of W0N3 treatment was 21.8% higher than that of W0N1 treatment, and the leaf Ndff% of W0N3 treatment was 12.8% higher than that of W1N3 treatment. Ndff% of annual branches of W1N1 treatment was the highest, at 0.45‰. Ndff% of annual branches of W2N3 treatment was the lowest, at 0.06‰. W1N1 was 650% higher than W2N3. Ndff% of perennial branches and fruits of W1N2 treatment was the highest, at 1.16‰ and 0.08‰. Ndff% of perennial branches of W2N1 treatment was the lowest, at 0.12‰. The fruit Ndff% in W1N1 treatment was the lowest, at 0.03‰. Ndff% of perennial branches treated with W1N2 was 866.7% higher than that of perennial branches treated with W2N1, and Ndff% of fruits treated with W1N2 was 166.7% higher than that of fruits treated with W1N1 (Table 3).
It follows from the above that, under W0, Ndff% of leaves increased significantly with the increase in nitrogen application rate. Under the condition of N3 fertilization, Ndff% of roots decreased significantly with the increase in irrigation amount. Under W1, Ndff% of fruits increased significantly with the increase in nitrogen application rate. In summary, Ndff% of leaves, perennial branches, roots and fruits under W1N2 treatment were significantly higher than that of W0N1 treatment, at 1.22‰, 1.16‰, 0.42‰ and 0.08‰, respectively, which was higher than the sum of the added value of water and nitrogen by single increase, indicating that the coupling of water and nitrogen made most of the organs of the plant have a stronger ability to absorb and regulate nitrogen, and promoted the absorption of fertilizer nitrogen by plants (Table 3).

3.6.2. Effects of Different Water and Nitrogen Treatments on TN Content, 15N Uptake and 15N Utilization Rate of Plants

The results of plant TN content under different water and nitrogen treatments showed that the treatment with the highest TN content was W1N2, followed by W0N3, and the lowest was W2N3. With the increase in nitrogen application rate and irrigation amount, the TN content of plants was different. At this time, nitrogen application rate and irrigation amount were the key factors affecting the TN content of plants (Table 4).
Under the same irrigation level, with the increase in nitrogen application rate, there were significant differences in 15N uptake between different treatments. Under different irrigation conditions, with the increase in nitrogen application rate, the increase in 15N uptake was also different. Under the W0 level, W0N3 was the highest at 0.6 mg, 33.3% higher than W0N1; under W1 level, W1N2 was the highest at 0.65 mg, 25.0% higher than W1N1. Under the W2 level, W2N3 was 0.5 mg, 4.2% higher than W2N1. Under the same nitrogen application level, with the increase in irrigation amount, there were significant differences in 15N uptake among different treatments. Under different nitrogen application levels, with the increase in irrigation amount, the increase in 15N uptake was also different. Under N1 level, W1N1 was the highest at 0.52 mg, 15.6% higher than W0N1; under N2 level, W1N2 was the highest at 0.65 mg, 47.7% higher than W0N2; under N3 level, W0N3 was the highest at 0.60 mg, 33.3% higher than W1N3. Among the 12 treatments, the 15N uptake of W1N2 treatment was the highest at 0.65 mg, an increase of 25.0% compared with W1N1, and of 47.7% compared with W0N2, indicating that the synergistic effect of water and nitrogen coupling significantly increased the absorption of 15N urea by apple roots under W1 and N1 treatment (Table 4).
Under the same irrigation level, with the increase in nitrogen application rate, there were significant differences in 15N-urea utilization rate between different treatments. Under different irrigation conditions, with the increase in nitrogen application rate, the 15N-urea utilization rate of plants decreased significantly. Under W0 level, W0N3 was the lower at 16.62%, 56.0% lower than W0N1; under W1 level, W1N3 was the lower at 12.59%, 73.3% lower than W1N1; under W2 level, W2N3 was lower at 13.89%, 65.0% lower than W2N1. Under the same nitrogen application level, with the increase in irrigation amount, there were significant differences in 15N-urea utilization rate among different treatments. Under different nitrogen application levels, with the increase in irrigation amount, the 15N-urea utilization rate of plants was also different. Under N1 level, W1N1 was the highest at 43.33%, 14.7% higher than W0N1; under N2 level, W1N2 was the highest at 26.94%, 47.5% higher than W0N2; under N3 level, W2N3 was the lower at 13.89%, 19.6% lower than W0N3 (Table 4).
Among the 12 treatments, the 15N-urea utilization rate of W0N1, W1N1 and W2N1 was higher, at 37.78%, 43.33% and 39.72%, respectively. The 15N-urea utilization rate of W0N3, W1N3 and W2N3 was lower, at 16.62%, 12.59% and 13.89%, respectively, which was significantly lower than that of N1 treatment. It can be seen from the above that, under the same irrigation level, the nitrogen use efficiency of plants decreased significantly with the increase in nitrogen application rate, but there was no significant difference between N2 and N3. Under the condition of N2 treatment, with the increase in irrigation amount, the nitrogen absorption and utilization efficiency of each treatment increased significantly, but there was no significant difference between W1 and W2 (Table 4).
In summary, the 15N-urea utilization rate of W1N1 treatment was the highest, indicating that, under W0 and N0 treatment, a reasonable increase in nitrogen application rate and irrigation amount can significantly improve the 15N-urea utilization rate of apples. Therefore, in relatively arid and barren orchards with insufficient fertilizer, the amount of irrigation and nitrogen application can be appropriately increased to improve the absorption and utilization of nitrogen by apples (Table 4).

3.7. Economic Analysis of Irrigation Nitrogen Coupling

The integrated technology of membrane subsurface drip irrigation fertilization combines mulching and drip irrigation techniques to maintain optimal soil moisture levels in the crop root zone, reducing water evaporation and pipeline aging. This technology allows for on-demand control of water and fertilizer application, addressing high production costs and cumbersome water-fertilizer management, making it suitable for mountain orchards. The coupling effect of water and nitrogen synchronizes their supply, promoting the absorption of water and nutrients by tree roots, with the W1N2 treatment performing the best. However, excessive water and nitrogen inputs can inhibit tree growth. The costs of irrigation and nitrogen application under different treatments range from 16.82 dollar to 77.83 dollar per hectare, with W0N0 being the lowest, W1N2 moderate, and W2N3 the highest. Therefore, in arid and semi-arid regions of the Loess Plateau, adopting the W1N2 treatment can achieve good growth and moderate economic benefits, enhancing farmers’ income and land value.

4. Discussion

4.1. Effects of Different Water and Nitrogen Treatments on the Growth of Apple Leaves

Under drought conditions, increasing irrigation appropriately can produce a compensatory effect on plant growth [31,32]. Studies have shown that dry soil can affect crop photosynthesis, material production and energy transfer capacity, thereby affecting the crop’s normal growth and development [33]. Meanwhile, nitrogen fertilizer can affect the nutrient absorption, distribution and material accumulation of crops under soil drought conditions, thereby altering crop yield and quality [34]. Therefore, suitable water and nitrogen management is the key measure to regulate the growth and development, yield and fruit quality of fruit trees.
Water and nitrogen can stress leaf growth [35]. This study found that an appropriate increase in irrigation and nitrogen had a significant compensation effect on the growth of apple leaves. Among them, increasing irrigation under N1 conditions and applying appropriate nitrogen under high water conditions can significantly increase the apple leaf area. In addition, HLT under medium and N3 treatments was significantly higher than that under no nitrogen and N1 treatments (Figure 1).
The diurnal variation process of plant photosynthesis demonstrates an obvious ‘midday’ phenomenon. Studies have shown that the diurnal variation of Pn apple leaves shows a bimodal curve [36]. In this study, it was found that the diurnal variation of Pn apple leaves generally showed an ‘inverted parabola’ trend. The peak appeared at about 9:00 a.m., decreased to the lowest point at 13:00 noon, and began to rise slowly in the afternoon (Figure 2). This may be due to the different temperature, altitude and photosynthetic determination time periods in the region.
Soil nitrogen and water are the key factors affecting plant photosynthesis. Increasing soil water and nitrogen significantly increased Pn, Gs, WUE and chlorophyll content, and decreased Ci [37]. Studies have shown that nitrogen application rate affects the relative chlorophyll content (SPAD) of leaves but has little effect on Pn for leaves [38]. This study found that water–nitrogen interaction had a significant effect on Tr, Gs and water use efficiency. Under the N2 level, the Tr and Gs of the medium water treatment were significantly higher than those of the high water and low water treatment, but the use efficiency of water was significantly reduced (Figure 2). Chlorophyll plays a vital role in photosynthesis, and chlorophyll content can affect the absorption and utilization efficiency of light energy by plants. This study found that increasing irrigation will significantly increase the chlorophyll content of leaves under the same nitrogen application level but, under medium and N3 levels, chlorophyll content which is over-irrigated will decrease, indicating that, under appropriate water conditions, plants can more effectively conduct photosynthesis (Figure 3), thereby promoting chlorophyll synthesis and stability [39]. Meanwhile, photosynthesis is an important route for plant nutrient absorption and utilization, affecting the transport, consumption and accumulation of nutrients. Nitrogen addition can significantly increase the leaf nitrogen content of plants [40]. This study found that, with the increase in nitrogen application and irrigation, the nitrogen content in the leaves significantly increased, but excessive nitrogen application and irrigation reduced the nitrogen content in the leaves (Table 1). In short, the Tr, Gs, chlorophyll and nitrogen content of leaves were higher under nitrogen treatment in reclaimed water, indicating that plants had stronger ability to capture resources and utilize substances.

4.2. Effects of Different Water and Nitrogen Treatments on Functional Traits and Nitrogen Use Efficiency of Apple Leaves

Plants capture more light resources by adjusting leaf functional traits [41]. Studies have shown that there is a close relationship between the functional traits of plant leaves (LA, leaf thickness, chlorophyll, photosynthetic rate), which jointly influence the survival and adaptability of plants [42,43,44]. Meanwhile, the total nitrogen content of leaves had a significant correlation with photosynthetic rate [45,46,47,48]. The results showed that the total nitrogen of leaves was positively correlated with Tr and Gs of leaves, and negatively correlated with Ci, which was similar to the results of Zhao et al. [49]. Nitrogen content of leaves was significantly positively correlated with Tr and Ci of leaves. The possible causes were derived from the species, climatic environment, and regional differences in the experimental study (Figure 4). This study showed that chlorophyll content was negatively correlated with HLT (Figure 4), indicating that thicker leaves may lead to a decrease in chloroplast surface area, thereby reducing Pn [50]. Previous studies have found that nitrogen use efficiency is negatively correlated with phosphorus concentration in plant leaves, and positively correlated with photosynthetic rate and LA [51,52,53]. This study also showed that there was no significant correlation between nitrogen use efficiency and chlorophyll content, but it was positively correlated with photosynthetic efficiency, TN, TP and LA, and negatively correlated with TP and HLT (Figure 4). The above results showed that there was a certain correlation between leaf growth, photosynthetic physiology, mineral elements, and nitrogen use efficiency. This provides a theoretical basis for further understanding the physiological mechanisms of plant growth and is of great significance for optimizing apple tree nutrition management, improving fruit quality and yield.

4.3. Effects of Different Water and Nitrogen Treatments on 15N (Ndff%) and Nitrogen Use Efficiency in Different Organs of Apple Plants

The 15N (Ndff%) in plant organs reflects the contribution of fertilizer nitrogen to the total nitrogen content of each organ and represents the nitrogen absorption capacity of plants [54,55,56]. This study found that there were significant differences in Ndff% in different organs of mature apple trees, with the highest in leaves, followed by roots, 1-year-old branches and perennial branches, and the lowest in fruits (Table 2). This is similar to the results of Zhang et al. [57], who found that the trunk, main root and coarse root absorbed the most 15N, and the fine root and 2-year-old branch absorbed less [58]. The results of this study showed that the Ndff% of fruit was the highest in all organs of apple, followed by 1-year-old branches, leaves and roots, which is contrary to the results of Chen et al. The possibility of this difference comes from factors such as experimental treatment, tree species and sampling period. Meanwhile, this study also found that with the increase in nitrogen application rate at middle water level, the Ndff% in leaves significantly increased. Under N3 level, with the increase in irrigation amount, root Ndff% decreased significantly. At high water level, with the increase in nitrogen application rate, the Ndff% of fruit increased significantly. It is worth noting that, under the condition of water and nitrogen coupling (W1N2 treatment), the Ndff% increase in most organs exceeded the single water and nitrogen application level, indicating that water and nitrogen coupling promoted the absorption of nitrogen by plants and enhanced the absorption capacity of 15N in various organs of plants, which provided important insights for understanding the effect of water and nitrogen coupling on plant nitrogen absorption and utilization (Table 2).
The increase in nitrogen application rate will lead to a decrease in nitrogen use efficiency (NUE), which conforms to the ‘law of diminishing returns’ [59]. Through the analysis of nitrogen use efficiency in fruit trees, it was found that, under the same irrigation level, with the increase in nitrogen application rate, the nitrogen use efficiency of plants decreased significantly, indicating that there was a threshold amount of nitrogen fertilizer in the response of leaves to nitrogen fertilizer. Apple trees in N1 state were more effective in absorbing and mobilizing nitrogen than apple trees in N3 state [60,61] (Table 3). In addition, under the N2 level, with the increase in irrigation amount, the nitrogen absorption and utilization rate of each treatment increased significantly indicating that, under the condition of high nitrogen fertilizer use, increasing the irrigation amount can significantly improve the nitrogen utilization rate, which is consistent with the results of Du et al. [62]. At the same time, this study also found that, under the treatment of low water and low nitrogen (W1N1), the nitrogen utilization rate of apple plants was higher (Table 2), indicating that suitable water and fertilization conditions could improve the utilization efficiency of fertilizer, which was consistent with the research results in cotton, sugarcane and tomato [63,64,65]. The above results indicate that reasonable water and fertilizer management in orchard production is one of the effective measures to improve the nitrogen use efficiency of apple trees.
Water and nitrogen are two important factors regulating the growth of apple trees and, in the arid and semi-arid region on the Loess Plateau, where the spring drought is more serious, in response to the problem of uncoordinated supply and demand of water and nitrogen, we carried out a study related to water-nitrogen coupling on the nitrogen utilization of apple plants, elucidating the mechanism by which water–nitrogen coupling regulates the growth physiology of apple trees, In the next step, we will build on this research to carry out research on the evaluation of fruit quality and the identification and screening of genes that respond to drought stress and nitrogen stress. By establishing a model of efficient water–nitrogen management for apple orchards in arid and semi-arid areas, a theoretical basis and technological support are provided for the high-quality development of apples on the Loess Plateau.

5. Conclusions

Excessive water and nitrogen inputs increase LA, decrease HLT, and decrease photosynthetic rate, chlorophyll content and mineral nutrients in the leaves of apple trees. Leaf NUE was highly significantly positively correlated with Tr, Gs and WUE, and highly significantly negatively correlated with Ci and HLT. Ndff% was highest in leaves, followed by roots, and lowest in fruits in different tissues and organs. TN content and 15N uptake were highest in plants under W1N2 treatment. NUE was greatest under the W1N1 treatment. Excessive irrigation and nitrogen application can reduce NUE. In summary, appropriate irrigation and nitrogen application can promote the growth physiology and nitrogen absorption and utilization of fruit trees, and at the same time save production costs, and reduce water waste and environmental pollution. Therefore, the optimal combination of water and nitrogen coupling recommended for orchards in the arid and semi-arid areas of the Loess Plateau is W1N2 (50–65% RWC, 300 kg/ha).

Supplementary Materials

The following supporting information can be downloaded at: https://www.mdpi.com/article/10.3390/agronomy14061245/s1, Figure S1: Irrigation date and irrigation amount of different water and nitrogen treatments in 2023. Dates of irrigation for the experiment (10 June, 22 June, 4 July, 22 July, 10 August, 25 August and 12 September). Experimental irrigation level and total irrigation amount (W0, 791.4 m3/hm2; W1, 1076.7 m3/hm2; W2, 1432.2 m3/hm2); Table S1: A list of abbreviations and mandatory nomenclature. Abbreviations and their explanations, as well as the relevant units of quantity, are listed in the table. References [66,67,68] are cited in Supplementary Materials file.

Author Contributions

G.L.: Writing—original draft, Conceptualization, Methodology. Y.F.: Data curation, Visualization, Methodology. T.F.: Data curation, Software. W.M.: Visualization, Formal analysis. Y.L.: Visualization, Formal analysis. J.M.: Supervision, Validation. B.C.: Writing—review and editing. All authors have read and agreed to the published version of the manuscript.

Funding

This research was supported by grants from the Science and Technology Major Project of Gansu Province (22ZD6NA045) and the National Key Research and Development Program of China (2022YFD1602106).

Data Availability Statement

Data will be made available on request.

Conflicts of Interest

The authors declare no conflict of interest.

References

  1. Hou, X.; Fahad, S.; Zhao, P.; Yan, B.; Liu, T. The Trilogy of the Chinese Apple Futures Market: Price Discovery, Risk-Hedging and Cointegration. Sustainability 2022, 14, 12864. [Google Scholar] [CrossRef]
  2. Fan, K.; Fu, L.; Liu, H.; Qu, J.; Zhang, G.; Zhang, S.; Qiao, K. Reduced Sensitivity to Tebuconazole in Botryosphaeria dothidea Isolates Collected from Major Apple Production Areas of China. Plant Dis. 2022, 106, 2817–2822. [Google Scholar] [CrossRef] [PubMed]
  3. Wang, J.; Liu, T. Spatiotemporal evolution and suitability of apple production in China from climate change and land use transfer perspectives. Food Energy Secur. 2022, 11, e386. [Google Scholar] [CrossRef]
  4. Dai, Z.; Fei, L.; Zeng, J.; Huang, D.; Liu, T. Optimization of water and nitrogen management for surge-root irrigated apple trees in the Loess Plateau of China. J. Integr. Agric. 2021, 20, 260–273. [Google Scholar] [CrossRef]
  5. Atkinson, J.C.; Taylor, L.; Taylor, M.J. The influence of temperature and water supply on apple fruit growth and the development of orchard-grown trees. J. Hortic. Sci. 2015, 70, 691–703. [Google Scholar]
  6. Giuliani, N.; Aguzzoni, A.; Penna, D.; Tagliavini, M. Estimating uptake and internal transport dynamics of irrigation water in apple trees using deuterium-enriched water. Agric. Water Manag. 2023, 289, 108532. [Google Scholar]
  7. Jiang, C.; Lu, D.; Zu, C.; Shen, J.; Wang, S.; Guo, Z.; Zhou, J.; Wang, H. One-time root-zone N fertilization increases maize yield, NUE and reduces soil N losses in lime concretion black soil. Sci. Rep. 2018, 8, 10258. [Google Scholar] [CrossRef] [PubMed]
  8. Hou, M.M.; Shao, H.X.; Chen, H.L.; Chang, T.T.; Wang, W.N.; Yang, Q.; Wang, Y.F. Study on Nitrogen Utilization Efficiency of Flue-Cured Tobacco with 15N Tracing Technique. Adv. Mater. Res. 2012, 1793, 520–524. [Google Scholar] [CrossRef]
  9. Haefele, S.M.; Jabbar, S.M.A.; Siopongco, J.; Tirol-Padre, A.; Amarante, S.T.; Sta Cruz, P.C.; Cosico, W.C. Nitrogen use efficiency in selected rice (Oryza sativa L.) genotypes under different water regimes and nitrogen levels. Field Crops Res. 2008, 107, 137–146. [Google Scholar] [CrossRef]
  10. Guo, J.; Fan, J.; Xiang, Y.; Zhang, F.; Yan, S.; Zhang, X.; Zheng, J.; Li, Y.; Tang, Z.; Li, Z. Coupling effects of irrigation amount and nitrogen fertilizer type on grain yield, water productivity and nitrogen use efficiency of drip-irrigated maize. Agric. Water Manag. 2022, 261, 107389. [Google Scholar] [CrossRef]
  11. Li, X.; Liu, H.; He, X.; Gong, P.; Lin, E. Water–nitrogen coupling and multi-objective optimization of cotton under mulched drip irrigation in arid northwest China. Agronomy 2019, 9, 894. [Google Scholar] [CrossRef]
  12. Badr, M.A.; El-Tohamy, W.A.; Zaghloul, A.M. Yield and water use efficiency of potato grown under different irrigation and nitrogen levels in an arid region. Agric. Water Manag. 2012, 110, 9–15. [Google Scholar] [CrossRef]
  13. Ma, Z.; Yin, J.; Yang, Y.; Sun, F.; Yang, Z. Effect of water and nitrogen coupling regulation on the growth, physiology, yield, and quality attributes and comprehensive evaluation of wolfberry (Lycium barbarum L.). Front. Plant Sci. 2023, 14, 1130109. [Google Scholar] [CrossRef] [PubMed]
  14. Shaikh, H.M.A.A.; Wang, L.; Liu, H. Improved greenhouse cucumber production under deficit water and fertilization in Northern China. Int. J. Agric. Biol. Eng. 2018, 11, 42–46. [Google Scholar]
  15. Li, G.H.; Liu, P.P.; Zhao, B.; Dong, S.T.; Liu, P.; Zhang, J.W.; Tian, C.X.; He, Z.J. Effects of water conditions and controlled release urea on yield and leaf senescence physiological characteristics in summer maize. Ying Yong Sheng Tai Xue Bao 2017, 28, 571–580. [Google Scholar] [PubMed]
  16. Cui, Q.Q.; Dong, Y.H.; Li, M.; Zhang, W.D.; Liu, B.B.; Ai, X.Z.; Bi, H.G.; Li, Q.M. Effect of water-nitrogen coupling on photosynthesis and ultrastructure of cucumber leaves under CO2 enrichment. Ying Yong Sheng Tai Xue Bao 2017, 28, 1237–1245. [Google Scholar] [PubMed]
  17. Zhou, C.; Le, J.; Hua, D.; He, T.; Mao, J. Imaging Analysis of Chlorophyll Fluorescence Induction for Monitoring Plant Water and Nitrogen Treatments. Measurement 2018, 136, 478–486. [Google Scholar] [CrossRef]
  18. Liu, Y.; Bai, M.; Li, Y.; Zhang, B.; Wu, X.; Shi, Y.; Liu, H. Evaluating the Combined Effects of Water and Fertilizer Coupling Schemes on Pear Vegetative Growth and Quality in North China. Agronomy 2023, 13, 867. [Google Scholar] [CrossRef]
  19. Koerselman, W.; Meuleman, A.F.M. The vegetation N:P ratio: A new tool to detect the nature of nutrient limitation. J. Appl. Ecol. 1996, 33, 1441–1450. [Google Scholar] [CrossRef]
  20. Tessier, J.T.; Raynal, D.J. Use of nitrogen to phosphorus ratios in plant tissue as an indicator of nutrient limitation and nitrogen saturation. J. Appl. Ecol. 2003, 40, 523–534. [Google Scholar] [CrossRef]
  21. Pan, N.; Shen, H.; Wu, D.M.; Deng, L.S.; Tu, P.F.; Gan, H.H.; Liang, Y.C. Mechanism of improved phosphate uptake efficiency in banana seedlings on acidic soils using fertigation. Agric. Water Manag. 2010, 98, 632–638. [Google Scholar] [CrossRef]
  22. Dai, Z.; Fei, L.; Huang, D.; Zeng, J.; Chen, L.; Cai, Y. Coupling effects of irrigation and nitrogen levels on yield, water and nitrogen use efficiency of surge-root irrigated jujube in a semiarid region. Agric. Water Manag. 2019, 213, 146–154. [Google Scholar] [CrossRef]
  23. Zhang, S.; Chen, S.; Hu, T.; Geng, C.; Liu, J. Optimization of irrigation and nitrogen levels for a trade-off: Yield, quality, water use efficiency and environment effect in a drip-fertigated apple orchard based on TOPSIS method. Sci. Hortic. 2023, 309, 111700. [Google Scholar] [CrossRef]
  24. Cai, S.; Zheng, B.; Zhao, Z.; Zheng, Z.; Yang, N.; Zhai, B. Precision Nitrogen Fertilizer and Irrigation Management for Apple Cultivation Based on a Multilevel Comprehensive Evaluation Method of Yield, Quality, and Profit Indices. Water 2023, 15, 468. [Google Scholar] [CrossRef]
  25. He, Z.; Cao, H.; Hu, Q.; Zhang, Y.; Nan, X.; Li, Z. Optimization of apple irrigation and N fertilizer in Loess Plateau of China based on ANP-EWM-TOPSIS comprehensive evaluation. Sci. Hortic. 2023, 311, 111794. [Google Scholar] [CrossRef]
  26. Wang, Q.; Liu, C.; Huang, D.; Dong, Q.; Li, P.; Ma, F. High-efficient utilization and uptake of N contribute to higher NUE of ‘Qinguan’ apple under drought and N-deficient conditions compared with ‘Honeycrisp’. Tree Physiol. 2019, 39, 1880–1895. [Google Scholar] [CrossRef] [PubMed]
  27. Hou, M.; Zhong, F.; Jin, Q.; Liu, E.; Feng, J.; Wang, T.; Gao, Y. Fate of nitrogen-15 in the subsequent growing season of greenhouse tomato plants (Lycopersicon esculentum Mill) as influenced by alternate partial root-zone irrigation. RSC Adv. 2017, 7, 34392–34400. [Google Scholar] [CrossRef]
  28. Hartmut, K.; Alan, R.W. Determinations of total carotenoids and chlorophylls b of leaf extracts in different solvents. Analysis 1983, 4, 142–196. [Google Scholar]
  29. Kacar, B. Chemical analyses of plant and soil. II Bitki Analizleri. Agric. Fac. Publ. 1972, 453, 646. [Google Scholar]
  30. Kitson, R.E.; Mellon, M.G. Colorimetric determination of phosphorus as molybdivanadophosphoric acid. Ind. Eng. Chem. Anal. Ed. 1944, 16, 379–383. [Google Scholar] [CrossRef]
  31. Wang, C.; Isoda, A.; Li, M. Growth and eco-physiological performance of cotton under water stress conditions. Agric. Sci. China 2007, 6, 949–955. [Google Scholar] [CrossRef]
  32. Feng, X.; Li, Y.; Gu, J.; Zhuo, Y.; Yang, H. Error thresholds for quasispecies on single peak Gaussian-distributed fitness landscapes. J. Theor. Biol. 2007, 246, 28–32. [Google Scholar] [CrossRef] [PubMed]
  33. Liang, B.; Shi, Y.; Yin, B.; Zhou, S.; Li, Z.; Zhang, X.; Xu, J. Effect of different dwarfing interstocks on the vegetative growth and nitrogen utilization efficiency of apple trees under low-nitrate and drought stress. Sci. Hortic. 2022, 305, 111369. [Google Scholar] [CrossRef]
  34. Cabello, M.J.; Castellanos, M.T.; Romojaro, F.; Martínez-Madrid, C.; Ribas, F. Yield and quality of melon grown under different irrigation and nitrogen rates. Agric. Water Manag. 2008, 96, 866–874. [Google Scholar] [CrossRef]
  35. Khaembah, E.N.; Maley, S.; Gillespie, R.; George, M.; Michel, A.J.; Chakwizira, E.; de Ruiter, J.; Teixeira, E. Water and nitrogen stress effects on canopy development and biomass allocation in fodder beet (Beta vulgaris L.). N. Z. J. Agric. Res. 2022, 65, 63–81. [Google Scholar] [CrossRef]
  36. Yang, M.; Li, Z.; Liu, Y.; Huang, L.; Yang, Y.; Geng, F. Study on diurnal variation of photosynthesis in Magnolia grandiflora L. and Magnolia denudata Desr. Acta Hortic. 2008, 769, 433–440. [Google Scholar] [CrossRef]
  37. Liu, M.; Wang, J. Effects of Water and Nitrogen Coupling on Photosynthesis and Chlorophyll Content of Hybrid Broussonetia papyrifera in Red Soil Area. J. Agric. Hortic. 2021, 3, 1–9. [Google Scholar]
  38. Zhao, D.; Glaz, B.; Comstock, C.J. Physiological and Growth Responses of Sugarcane Genotypes to Nitrogen Rate on a Sand Soil. J. Agron. Crop Sci. 2014, 200, 290–301. [Google Scholar] [CrossRef]
  39. Ahmed, U.S.; Senge, M.; Ito, K.; Adomako, T.J. Effects of Water Stress on Soil Plant Analytical Development (SPAD) Chlorophyll Meter Reading and its Relationship to Nitrogen Status and Grain Yield of Soybean under Different Soil Types. J. Rainwater Catchment Syst. 2010, 15, 33–38. [Google Scholar] [CrossRef]
  40. Han, X.; Sistla, S.A.; Zhang, Y.H.; Lü, X.T.; Han, X.G. Hierarchical responses of plant stoichiometry to nitrogen deposition and mowing in a temperate steppe. Plant Soil 2014, 382, 175–187. [Google Scholar] [CrossRef]
  41. Boardman, N.K. Comparative photosynthesis of sun and shade plants. Annu. Rev. Plant Physiol. 1977, 28, 355–377. [Google Scholar] [CrossRef]
  42. Takashima, T.; Hikosaka, K.; Hirose, T. Photosynthesis or persistence: Nitrogen allocation in leaves of evergreen and deciduous Quercus species. Plant Cell Environ. 2004, 27, 1047–1054. [Google Scholar] [CrossRef]
  43. Wright, I.J.; Reich, P.B.; Westoby, M.; Ackerly, D.D.; Baruch, Z.; Bongers, F.; Cavender-Bares, J.; Chapin, T.; Cornelissen, J.H.; Diemer, M.; et al. The worldwide leaf economics spectrum. Nature 2004, 428, 821–827. [Google Scholar] [CrossRef] [PubMed]
  44. Hikosaka, K. Interspecific difference in the photosynthesis-nitrogen relationship: Patterns, physiological causes, and ecological importance. J. Plant Res. 2004, 117, 481–494. [Google Scholar] [CrossRef] [PubMed]
  45. Mooney, H.A.; Field, C.; Gulmon, S.L.; Bazzaz, F.A. Photosynthetic capacity in relation to leaf position in desert versus old-field annuals. Oecologia 1981, 50, 109–112. [Google Scholar] [CrossRef]
  46. Gulias, J.; Flexas, J.; Mus, M.; Cifre, J.; Lefi, E.; Medrano, H. Relationship between maximum leaf photosynthesis, nitrogen content and specific leaf area in Balearic endemic and non-endemic Mediterranean species. Ann. Bot. 2003, 92, 215–222. [Google Scholar] [CrossRef] [PubMed]
  47. Garnier, E.; Salager, J.L.; Laurent, G.; Sonié, L. Relationships between photosynthesis, nitrogen and leaf structure in 14 grass species and their dependence on the basis of expression. New Phytol. 1999, 143, 119–129. [Google Scholar] [CrossRef]
  48. Reich, P.B.; Walters, M.B.; Ellsworth, D.S.; Uhl, C. Photosynthesis-nitrogen relations in Amazonian tree species: I. Patterns among species communities. Oecologia 1994, 97, 62–72. [Google Scholar] [CrossRef] [PubMed]
  49. Zhao, S.; Zhao, X.; Li, Y. Relationship between the trait response of aboveground and belowground parts of dominant plant species to groundwater depth change in Horqin Sandy Land, eastern China. Ecol. Indic. 2023, 156, 111001. [Google Scholar] [CrossRef]
  50. Xiong, D.L.; Liu, X.; Liu, L.M.; Douthe, C.; Li, Y.; Peng, S.B.; Huang, J.L. Rapid responses of mesophyll conductance to changes of CO2 concentration, temperature and irradiance are affected by N supplements in rice. Plant Cell Environ. 2015, 38, 2541–2550. [Google Scholar] [CrossRef] [PubMed]
  51. Liu, C.; Sun, Y.; Wu, G.; Wang, X.; Yuan, M.; Wang, J.; He, W.; Chen, F.; LeCocq, K.; Wang, L.; et al. Amendment with controlled release urea increases leaf morpho-physiological traits, grain yield and NUE in a double-cropping rice system in southern China. J. Sci. Food Agric. 2023, 103, 1692–1703. [Google Scholar] [CrossRef] [PubMed]
  52. Peng, C.; Zhang, Z.; Li, Y.; Zhang, Y.; Dong, H.; Fang, Y.; Han, L.; Xu, W.; Hu, L. Genetic improvement analysis of nitrogen uptake, utilization, translocation, and distribution in Chinese wheat in Henan Province. Field Crops Res. 2022, 277, 108406. [Google Scholar] [CrossRef]
  53. Ma, S.; Yue, J.; Wang, J.; Jia, Z.; Li, C.; Zeng, J.; Liu, X.; Zhang, J. Arbuscular Mycorrhizal Fungi Alleviate Salt Stress Damage by Coordinating Nitrogen Utilization in Leaves of Different Species. Forests 2022, 13, 1568. [Google Scholar] [CrossRef]
  54. Gu, M.R.; Shu, H.R.; Zhou, H.W. Apple N nutrition research IV. Storage 15N and distribution characteristics. Acta Hortic. Sin. 1986, 13, 25–30. [Google Scholar]
  55. Li, H.; Ge, S.; Jiang, Y.; Peng, F.; Wei, S.; Fang, X. Characteristics of absorption, utilization and distribution of 15N-urea application in different depths in Gala/Malus hupehensis. Agric. Sci. China 2011, 44, 1408–1414. [Google Scholar]
  56. Zhao, L.; Jiang, Y.; Peng, F.; Li, P.; Wang, L.; Li, H. Characteristics of absorption, utilization and distribution of spring soil 15N-urea application for Gala apple tree. Plant Nutr. Fertil. Sci. 2009, 15, 1439–1443. [Google Scholar]
  57. Zhang, L.; Han, M.; Zhao, C.; Liu, C.; Zhang, F.; Zhang, L.; Li, B. 15nitrogen study on absorption, distribution and utilization of nitrogen applied in early summer in red fuji apple. J. Plant Nutr. 2012, 35, 1557–1571. [Google Scholar] [CrossRef]
  58. Chen, Q.; Liu, Z.X.; Xing, Y.; Wu, X.X.; Ge, S.F.; Jiang, Y.M. Effects of split combined application of organic-inorganic fertilizers on plant growth, 15N absorption, utilization and loss of Gala apple tree. Ying Yong Sheng Tai Xue Bao 2019, 30, 1367–1372. (In Chinese) [Google Scholar] [PubMed]
  59. Zhang, X.; Davidson, E.A.; Mauzerall, D.L.; Searchinger, T.D.; Dumas, P.; Shen, Y. Managing nitrogen for sustainable development. Nature 2015, 528, 51–59. [Google Scholar] [CrossRef] [PubMed]
  60. Cheng, L.; Dong, S.; Fuchigami, L.H. Urea uptake and nitrogen mobilization by apple leaves in relation to tree nitrogen status in autumn. J. Hortic. Sci. Biotechnol. 2002, 77, 13–18. [Google Scholar] [CrossRef]
  61. Li, H.; Zhu, X.; Wang, J.; Wei, Y.; Nai, F.; Yu, H.; Wang, X. Unraveling differential characteristics and mechanisms of nitrogen uptake in wheat cultivars with varied nitrogen use efficiency. Plant Physiol. Biochem. 2023, 206, 108278. [Google Scholar] [CrossRef] [PubMed]
  62. Du, Y.; Cao, H.; Liu, S.; Gu, X.; Cao, Y. Response of yield, quality, water and nitrogen use efficiency of tomato to different levels of water and nitrogen under drip irrigation in Northwestern China. J. Integr. Agric. 2016, 16, 1153–1161. [Google Scholar] [CrossRef]
  63. Scheer, C.; Rowlings, D.W.; Antille, D.L.; De Antoni Migliorati, M.; Fuchs, K.; Grace, P.R. Improving nitrogen use efficiency in irrigated cotton production. Nutr. Cycl. Agroecosyst. 2022, 125, 95–106. [Google Scholar] [CrossRef]
  64. Navnit, K.; Geeta, K.; Anil, K.; Sudhir, P. Influence of manuring and irrigation scheduling on system productivity, resource use efficiency, nutrient uptake and incidence of early shoot-borer (Chilo infuscatellus) in sugarcane (Saccharum spp. hybrid complex) and garlic (Allium sativum) intercropping system. Indian J. Agron. 2017, 61, 297–306. [Google Scholar]
  65. Liu, R.; Yang, Y.; Wang, Y.; Wang, S.Y.; Wang, X.C.; Rengel, Z.; Zhang, W.J.; Shu, L.Z. Alternate partial root-zone drip irrigation with nitrogen fertigation promoted tomato growth, water and fertilizer-nitrogen use efficiency. Agric. Water Manag. 2020, 233, 106049. [Google Scholar] [CrossRef]
  66. Wang, F.; Sha, J.; Chen, Q.; Xu, X.; Zhu, Z.; Ge, S.; Jiang, Y. Exogenous abscisic acid regulates distribution of 13C and 15N and anthocyanin synthesis in ‘Red Fuji’apple fruit under high nitrogen supply. Front. Plant Sci. 2020, 10, 504382. [Google Scholar] [CrossRef] [PubMed]
  67. San-Martino, L.; Sozzi, G.O.; San-Martino, S.; Lavado, R.S. Isotopically-labelled nitrogen uptake and partitioning in sweet cherry as influenced by timing of fertilizer application. Sci. Hortic. 2010, 126, 42–49. [Google Scholar] [CrossRef]
  68. International Atomic Energy Agency. Use of Isotope and Radiation Methods in Soil and Water Management and Crop Nutrition; Training Course Series 14; FAO/IAEA: Vienna, Austria, 2001. [Google Scholar]
Figure 1. Precipitation and temperature map of apple phenological period in 2023 in the experimental area. The left and right ordinates represent rainfall and temperature, respectively, and the abscissa represents the apple phenological period, in which 04-08 is 8 April, etc.
Agronomy 14 01245 g001
Figure 2. Experimental design distribution chart. The experiment employs a two-factor design, with Factor 1 comprising 3 RWC gradients (W1, W2, and W3), and Factor 2 comprising 4 N levels (N0, N1, N2, and N3), with completely randomized combinations: W0N0, W0N1, W0N2, W0N3, W0N3, W1N0, W1N1, W1N2, W1N3, W2N0, W2N1, W2N2, and W2N3, totaling 12 treatments. 15N is A stable isotope of nitrogen in nature, which contains 7 protons and 8 neutrons and has a mass of 15. It has gained wide application as a tracer atom for nitrogen compounds in agriculture.
Agronomy 14 01245 g002
Figure 3. Comparison of mature functional leaf growth under different water and nitrogen treatments. (A) (W0N0), (B) (W0N1), (C) (W0N2), (D) (W0N3), (E) (W1N0), (F) (W1N1), (G) (W1N2), (H) (W1N3), (I) (W2N0), (J) (W2N1), (K) (W2N2), (L) (W2N3), (M) (LA under the same irrigation level), (N) (LA under the same nitrogen level), (O) (HLT under the same drought stress level), (P) (HLT under the same nitrogen application level). Statistical significance was analyzed via one-way ANOVA. Error bars represent the mean ± SE from three biological repeats. Different lowercase letters denote significant differences, whereas the same lowercase letters indicate no statistical difference (p < 0.05).
Agronomy 14 01245 g003
Figure 4. Effects of different water and nitrogen treatments on photosynthetic efficiency of apple leaves. (A1) Daily Pn changes under different water and nitrogen treatments. (A2) Pn under the same irrigation level. (A3) Pn under the same nitrogen application level. (B1) Daily Tr changes under different water and nitrogen treatments. (B2) Tr under the same irrigation level. (B3) Tr under the same nitrogen application level. (C1) Daily Gs changes under different water and nitrogen treatments. (C2) Gs under the same irrigation level. (C3) Gs under the same nitrogen application level. (D1) Diurnal variation of Ci under different water and nitrogen treatments. (D2) Ci under the same irrigation level. (D3) Ci under the same nitrogen application level. (E1) Daily instantaneous WUE under different water and nitrogen treatments. (E2) Instantaneous WUE under the same irrigation level. (E3) Instantaneous WUE under the same nitrogen application level. Statistical significance was analyzed via one-way ANOVA. Error bars represent the mean ± SE from three biological repeats. Different lowercase letters denote significant differences, whereas the same lowercase letters indicate no statistical difference (p < 0.05).
Agronomy 14 01245 g004
Figure 5. Effects of different water and nitrogen treatments on chlorophyll content in apple leaves. (A) Chl a content under the same irrigation level. (B) Chl a content under the same nitrogen application level. (C) Chl b content under the same irrigation level. (D) Chl b content under the same nitrogen application level. (E) Car content under the same irrigation level. (F) Car content under the same nitrogen application level. Statistical significance was analyzed via one-way ANOVA. Error bars represent the mean ± SE from three biological repeats. Different lowercase letters denote significant differences, whereas the same lowercase letters indicate no statistical difference (p < 0.05).
Agronomy 14 01245 g005
Figure 6. Correlation analysis of functional structure, functional traits and nitrogen use efficiency of apple leaves under different water and nitrogen treatments. Blue indicates positive correlation, red indicates negative correlation, and white indicates no correlation. The darker the color, the larger the circle and the stronger the correlation, and vice versa. p ≤ 0.05, indicating significant correlation, p ≤ 0.01, indicating extremely significant correlation.
Agronomy 14 01245 g006
Table 1. Rainfall and effective rainfall during the phenological period of apple trees, in which 4.8–5.2 is 8 April–2 May, etc.
Phenological PeriodNameBudding and Leafing PeriodFlowering and Fruiting PeriodYoung Fruit Swelling PeriodFruit Rapid Expansion PeriodFruit Color Conversion PeriodWhole Growth Period
Date4.8~5.25.3~5.225.23~6.307.1~8.248.25~10.104.8~10.10
Rainfall/mm16.419.138.5126.874.7275.5
Effective rainfall/mm10.913.225.6100.757.2207.6
Table 2. Effects of different water and nitrogen treatments on mineral elements in apple leaves.
TreatmentTN (g/kg)TP (g/kg)TK (g/kg)
W0N023.0 ± 0.01 d0.9 ± 0.4 abc14.6 ± 0.9 a
W0N126.0 ± 0.4 bc0.6 ± 0.1 c10.8 ± 1.6 bc
W0N225.8 ± 0.3 bc1.1 ± 0.1 a12.1 ± 0.4 b
W0N323.0 ± 0.6 d1.0 ± 0.3 abc7.9 ± 0.8 de
W1N025.0 ± 0.3 c0.6 ± 0.2 bc3.8 ± 0.8 g
W1N126.5 ± 0.1 b0.6 ± 0.1 bc8.0 ± 1.3 de
W1N228.9 ± 1.4 a1.0 ± 0.3 ab7.0 ± 0.8 ef
W1N326.7 ± 0.4 b0.7 ± 0.2 abc12.1 ± 0.8 b
W2N025.1 ± 0.5 c0.8 ± 0.3 abc7.3 ± 0.4 e
W2N127.9 ± 1.0 a0.7 ± 0.1 abc9.3 ± 0.9 cd
W2N228.5 ± 0.5 a0.7 ± 0.1 abc5.3 ± 0.5 fg
W2N323.3 ± 0.3 d0.6 ± 0.0 bc5.4 ± 1.7 fg
Note: Statistical significance was analyzed via one-way ANOVA. Values in tables represent the mean ± SE from three biological repeats. Different lowercase letters denote significant differences, whereas the same lowercase letters indicate no statistical difference (p < 0.05).
Table 3. The Ndff% value of different organs under different irrigation and nitrogen treatment (unit: ‰).
TreatmentLeafAnnual BranchesPerennial BranchesRootFruit
W0N11.01 ± 0.12 a0.31 ± 0.02 b0.60 ± 0.04 b0.36 ± 0.07 ab0.06 ± 0.03 ab
W0N21.04 ± 0.15 a0.24 ± 0.04 b0.26 ± 0.04 d0.37 ± 0.08 ab0.06 ± 0.03 ab
W0N31.23 ± 0.11 a0.45 ± 0.06 a0.41 ± 0.03 c0.43 ± 0.06 a0.05 ± 0.03 ab
W1N11.12 ± 0.09 a0.45 ± 0.08 a0.36 ± 0.02 c0.41 ± 0.09 a0.03 ± 0.00 b
W1N21.22 ± 0.06 a0.28 ± 0.04 b1.16 ± 0.11 a0.42 ± 0.09 a0.08 ± 0.02 a
W1N31.09 ± 0.09 a0.31 ± 0.02 b0.16 ± 0.03 ef0.29 ± 0.01 b0.05 ± 0.01 ab
W2N11.13 ± 0.21 a0.29 ± 0.04 b0.12 ± 0.02 f0.37 ± 0.07 ab0.04 ± 0.02 ab
W2N21.04 ± 0.09 a0.30 ± 0.02 b0.24 ± 0.04 de0.35 ± 0.03 ab0.04 ± 0.02 ab
W2N31.20 ± 0.05 a0.06 ± 0.02 c0.18 ± 0.02 def0.36 ± 0.03 ab0.05 ± 0.01 ab
Note: Statistical significance was analyzed via one-way ANOVA. Values in tables represent the mean ± SE from three biological repeats. Different lowercase letters denote significant differences, whereas the same lowercase letters indicate no statistical difference (p < 0.05).
Table 4. Plant TN, 15N-urea uptake and 15N-urea use efficiency under different water and nitrogen treatments.
TreatmentTN Content of Plant/g15N Absorbed from 15N-Urea/mg15N-Urea Utilization Rate %
W0N168.98 ± 2.37 bc0.45 ± 0.06 c37.78 ± 5.29 a
W0N264.34 ± 3.86 cd0.44 ± 0.07 c18.27 ± 2.79 c
W0N375.24 ± 4.18 b0.6 ± 0.06 ab16.62 ± 1.62 c
W1N168.94 ± 1.23 bc0.52 ± 0.04 bc43.33 ± 3.6 a
W1N283.22 ± 3.13 a0.65 ± 0.02 a26.94 ± 0.71 b
W1N361.07 ± 2.93 d0.45 ± 0.05 c12.59 ± 1.48 c
W2N161.83 ± 4.84 d0.48 ± 0.1 c39.72 ± 8.31 a
W2N262.67 ± 2.77 cd0.43 ± 0.05 c17.88 ± 2.13 c
W2N359.96 ± 0.71 d0.5 ± 0.02 bc13.89 ± 0.6 c
Note: Statistical significance was analyzed via one-way ANOVA. Values in tables represent the mean ± SE from three biological repeats. Different lowercase letters denote significant differences, whereas the same lowercase letters indicate no statistical difference (p < 0.05).
Disclaimer/Publisher’s Note: The statements, opinions and data contained in all publications are solely those of the individual author(s) and contributor(s) and not of MDPI and/or the editor(s). MDPI and/or the editor(s) disclaim responsibility for any injury to people or property resulting from any ideas, methods, instructions or products referred to in the content.

