Article

Screening of Miscanthus Genotypes for Sustainable Production of Microcrystalline Cellulose and Cellulose Nanocrystals

1
Hunan Provincial Key Laboratory of Crop Germplasm Innovation and Utilization, College of Bioscience & Biotechnology, Hunan Agricultural University, Changsha 410128, China
2
Hunan Branch, National Energy R & D Center for Non-Food Biomass, Hunan Agricultural University, Changsha 410128, China
3
Hunan Engineering Laboratory of Miscanthus Ecological Applications, College of Bioscience & Biotechnology, Hunan Agricultural University, Changsha 410128, China
4
Hunan Institute of Agricultural Information and Engineering, Hunan Academy of Agricultural Sciences, Hunan Intelligent Agriculture Engineering Technology Research Center, Hunan Industrial Technology Basic Public Service Platform, Changsha 410125, China
5
Key Laboratory of Agricultural Engineering in Structure and Environment, Ministry of Agriculture and Rural Affairs, College of Water Resources and Civil Engineering, China Agricultural University, Beijing 100083, China
*
Author to whom correspondence should be addressed.
These authors contributed equally to this work.
Agronomy 2024, 14(6), 1255; https://doi.org/10.3390/agronomy14061255
Submission received: 12 April 2024 / Revised: 28 May 2024 / Accepted: 31 May 2024 / Published: 11 June 2024

Abstract

:
Miscanthus spp. has been regarded as a promising industrial plant for the sustainable production of bio-based materials. To assess its potential for microcrystalline cellulose (MCC) and cellulose nanocrystals (CNCs) production, 50 representative clones of M. sinensis and M. floridulus were selected from a nationwide collection showcasing the extensive diversity of germplasm resources. Descriptive analysis indicates that the dry biomass weight of M. floridulus is advantageous whereas M. sinensis demonstrates higher MCC and CNCs yields as well as a smaller CNCs particle size. Correlation analyses indicated that MCC yield is solely influenced by the cellulose content whereas the yield of CNCs is affected by both the cellulose content and CrI. Comparative analyses of the chemical composition, physical features (degree of polymerization, crystalline index, particle size distribution and zeta potential), and scanning electron microscopy indicated that the MCC and CNCs extracted from M. sinensis and M. floridulus exhibited remarkable stability and quality. Additionally, the CNCs derived from M. sinensis and M. floridulus exhibited a distinctive ball-shaped structure. Notably, machine learning has demonstrated its efficacy and effectiveness in the high-throughput screening of large populations of Miscanthus spp. for predicting the yield of MCC and CNCs. Our results have also laid the theoretical foundation for the exploration, cultivation, and genetic breeding of M. sinensis and M. floridulus germplasm resources with the purpose of MCC and CNCs preparation.

1. Introduction

The pursuit of bio-based functional materials with exceptional mechanical properties and cost-effective production, while maintaining their renewable and sustainable nature, is currently gaining momentum [1]. Cellulose, recognized as the most abundant natural polymer on earth, holds great potential in meeting the demand for alternative petroleum resources and forming the foundation of a future bioeconomy focused on energy and material efficiency [2]. Over centuries, cellulose has been extensively utilized in various forms such as fibers, paper, or derivatives for a wide range of everyday products and materials [3]. In fact, modified cellulose was among the pioneering instances of polymer usage in technical contexts; however, it was subsequently replaced by synthetic polymers derived from petroleum sources [4].
Microcrystalline cellulose (MCC) is a modified cellulose derived from lignocellulosic biomass through alkaline peroxide pretreatment and finds applications in various applications in adsorbents, food packaging, pharmaceuticals, and biomedical fields and serves as a strength additive in biocomposite materials [5]. Now-a-days, cellulose nanocrystals (CNCs) extracted using MCC have gained significant attention from researchers and scientists in the materials science community due to their exceptional crystallinity, remarkable surface properties, and impressive tensile strength (particularly reaching up to 150 and 10 Gpa, as reported) [6]. In addition to these properties, their exceptional chemical stability, biocompatibility, renewability, non-toxicity, abundant availability from economic sources, low gas permeability, and functional surfaces are highly valued for a wider range of applications including polymer nanocomposites, packaging materials, lithium-ion batteries, drug delivery systems, tissue engineering scaffolds, and protective coatings [7]. Generally, acid hydrolysis is the most popular method for preparing CNCs because of its low cost, short reaction time, and high yield [8]. Recent studies have demonstrated that the properties of bio-based materials, such as biofuels and biochar, are influenced not only by the preparation method but also by the biomass quality traits (chemical composition and physical features) of the specific plant utilized for extraction [2,9]. In the process of cell growth and differentiation, three main cell wall components, i.e., cellulose, hemicellulose, and lignin, along with others like pectin, are closely linked to form a complex spatial structure under a certain genetic influence, resulting in variations in biomass quality traits among different types and varieties of the same genus [10]. However, to date, there have been limited studies investigating the impact of chemical composition and physical features of biomass feedstock on the yield and quality of MCC and CNCs. Currently, MCC and CNCs can be obtained from various agricultural waste sources such as sugarcane bagasse [11], Cucumis sativus peels [12], dunchi fiber, etc. [13]. Recently, industrial crops have indeed been becoming increasingly important bioresources for the production of MCC and CNCs due to their superior and more predictable biomass quality traits (chemical composition and physical features) compared to agricultural waste [14,15,16].
Miscanthus spp., a C4 perennial herbaceous grass belonging to the Poaceae family, exhibits robust tolerance to high saline–alkaline and acidic soil environments and is widely distributed in subtropical and tropical regions [17]. The exceptional traits of stable yield potential, rapid growth rate, high water-use efficiency, significant cellulose content, and superior fiber quality make it widely recognized as one of the most promising industrial crops for biorefining [18,19]. China is globally recognized as a prominent origin center of the Miscanthus spp., boasting abundant germplasm resources and genetic diversity [20]. Notably, M. sinensis and M. floridulus are considered as the major varieties and are widely distributed along East, Central, South, and Southwest China, exhibiting immense potential for industrial exploitation [17]. To explore the potential utilization of bio-based materials, the Hunan Engineering Laboratory for Miscanthus Ecological Applications initiated a long-term project, spanning from 2006 to 2019, aimed at the nationwide collection and identification of germplasm resources for Miscanthus spp. [20]. The results demonstrated that the selected 224 and 143 Miscanthus spp. exhibited significant diversity in germplasm resources pertaining to agronomic traits and biomass quality traits [21]. Paradoxically, despite extensive research comparing the potential of M. sinensis and M. floridulus for biofuel production, there has been a significant oversight in evaluating their potential for the preparation of bio-based materials such as MCC and CNCs [18]. Babicka et al. [9] conducted a comparative analysis of the properties of CNCs derived from M. sinensis, M. sacchariflorus, and Sorghum using an ionic liquids method, highlighting that the properties of CNCs are influenced not only by the specific type of ionic liquid employed but also by the plant’s type and species. Pires et al. [22] suggested that the MCC and CNCs derived from Miscanthus × giganteus could enhance the majority properties of chitosan films. Cudjoe et al. [23] reported that the CNCs obtained from Miscanthus × giganteus were at least as good. Therefore, to date, a limited number of studies have provided evidence for the exceptional properties of MCC or CNCs derived from various samples of Miscanthus spp.; however, there is currently no research exploring the potential of M. sinensis and M. floridulus species in terms of the species-specific preparation of MCC or CNCs. Moreover, additionally, since alkaline peroxide-assisted acid hydrolysis is currently the only method that has been commercialized for CNC production, it is more suitable for the fair selection of germplasm resources [21]. Therefore, the initial assessment of MCC and CNC preparation for M. sinensis and M. floridulus represents a crucial first step towards developing a promising bioresource and promoting widespread industrial applications for a sustainable bioeconomy. Simultaneously, the highly diverse germplasm resources of M. sinensis and M. floridulus represent an ideal sample group to investigate the impact of chemical composition and physical properties of raw biomass on MCC and CNC yield and quality.
Establishing a high-throughput approach for predicting bio-based material yield is increasingly imperative to effectively select optimal varieties from extensive germplasm resources of industrial crops [24]. Successful screening will guide the development of breeding and genetic modification programs for M. sinensis and M. floridulus, ultimately facilitating the achievement of high MCC and CNC yields at a low cost [10]. However, to our best knowledge, no studies have reported on the establishment of high-throughput models to predict MCC and CNC yield based on the biomass quality traits of Miscanthus spp. In this sector, numerous published studies have relied on linear approaches to evaluate the yield of industrial products in relation to biomass characteristics. However, as the number of features and datasets increases, it is becoming increasingly recognized that linear regression models have limitations in accurately capturing nonlinear relationships [25]. The Extra Trees algorithm is an innovative ensemble method in machine learning that utilizes decision trees specifically designed for regression or classification tasks [26]. It has demonstrated superior performance compared to linear modeling approaches in various applications involving high-dimensional data, exhibiting reduced mean squared errors and improved prediction accuracy [27]. Hence, it is imperative to assess the efficacy of machine learning methodologies, such as the Extra Trees algorithm, in facilitating the high-throughput quantitative analysis of MCC and CNC yield.
The objectives of this study were as follows: (1) to screen 50 clones each of M. sinensis and M. floridulus to explore their agronomic traits, biomass quality traits, and potential for MCC and CNC preparation; (2) to investigate the impacts of chemical composition and physical characteristics on the yields of MCC and CNCs; (3) to compare the differences in the chemical composition and physical features of MCC and CNCs prepared from M. sinensis and M. floridulus using representative samples; and (4) to assess the efficacy of the Extra Trees algorithm in predicting the yields of MCC and CNCs.

2. Materials and Methods

2.1. Sampling

Since 2006, a total of 224 M. sinensis and 142 M. floridulus germplasms collected from 18 provinces in China were cultivated and managed in The Nursery Garden of Miscanthus Germplasm (113°4′50.12400″ E, 28°11′5.67600″ N) at Hunan Agricultural University [21]. From 2015 to 2017, agronomic traits of canopy height, leaf length, leaf width, stem diameter, base diameter, tiller number, base circumference, moisture content, and leaf/stem ratio were measured and recorded in the Miscanthus Germplasm Database (MGDB) annually [20]. Since agronomic traits are the macroscopic expression of microscopic structural and chemical changes in plant cell walls, the total aboveground biomass of individual plants was used to estimate the dry biomass weight instead of relative weight per unit in this study. Based on the data from MGDB in 2015, 50 clones each of M. sinensis and M. floridulus were selected as representative germplasm resources using principal component analysis (PCA) coupled with k-means clustering analysis.
In 2020, the agronomic traits of 100 selected clones were measured according to our previous study and their aboveground biomass was harvested and sampled for further analysis. The samples were first dried at 65 °C for 72 h and then ground into powders using an 80-mesh (0.180 mm × 0.180 mm) screen according to sample preparation method described by Li et al. [28] and then stored in a dry container until use.

2.2. Extraction of MCC

The MCC was isolated from dried and powdered M. sinensis and M. floridulus through the modified alkaline peroxide pretreatment according to Wang et al. with modifications [21]. Firstly, the hemicellulose was removed via repeated base washes. The raw biomass of M. sinensis and M. floridulus was placed in sealed beaker with 20% NaOH at the liquid-to-solid ratio 10:1 and oil-bathed at 100 °C for 1 h, 140 °C for 30 min, and 160 °C for 30 min to obtain the pulp. Obtained pulp was washed with distilled water. This process was repeated until the water was at a neutral pH, i.e., about 6 times. For the next step, the lignin was removed via repeated hydrogen peroxide solution washes. The pulp was washed with 20% H2O2 at liquid-to-solid ratio of 10:1, under 90 °C for 3 h, to remove lignin. The solid and liquid were centrifugated to obtain precipitate. The precipitate was oven-dried, measured, and preserved with sealed plastic in sealed plastic bags under room temperature. The yield of MCC was calculated using the following formula:
MCC = (Wc × (1 − mc))/(Wb × (1 − mb)) × 100 [%]
Here, MCC was microcrystalline cellulose yield (%), Wc was the weight of MCC (g), mc was the moisture content of MCC (%), Wb was the weight of raw biomass (g), and mb was the moisture content of raw biomass (%).

2.3. Extraction of CNCs

The isolated cellulose was used to prepare CNCs using H2SO4 via acid hydrolysis method [21]. Briefly, 0.5 g of dried cellulose powder was dissolved in 10 mL of 54 wt.% H2SO4 solution and continuously stirred for 90 min at 75 °C. The reaction was stopped by adding 30 mL of cold distilled water. The hydrolyzed cellulose solution was dialyzed with periodic water replacement to achieve a neutral pH. The dialyzed cellulose solution was subjected to ultrasonic treatment with an ultrasonic disintegrator (KS-1000KDE, Kushan Jielimei Ultrasonic Instrument Co., Ltd., Kunshan, China) at 40 kHz, 300 W for 15 min, following filtration using 1-micrometer-aperture filter paper. A CNC solution of 1 mL was transferred from the volumetric flask to a beaker and diluted fiftyfold with distilled water for the determination of CNC size. The remaining solution in the flask was frozen in a refrigerator at −20 °C for 12 h, then dried in a freezer dryer (LC-12N-80C, Shanghai Lichenbangxi Instrument Science Technology Co., Ltd., Shanghai, China). The freeze-dried CNCs were preserved using sealed plastic bags. The yield of CNCs was calculated according to following equation.
CNC = Wn/(Wc × (1 − mc)) × 100 [%]
Here, CNC was cellulose nanocrystal yield (%), Wn was the weight of CNC (g), mc was the moisture content of CNCs (%), and Wc was the weight of raw biomass (g).

2.4. Measurement of Chemical Composition and Physical Features

The soluble contents in ethyl alcohol extracts, ash, cellulose, hemicellulose, and lignin and moisture in the dried powder from the 50 M. sinensis and 50 M. floridulus accessions were estimated according to Li et al. with modifications [28]. All experiments were performed in technique triplicates.
The soluble contents in ethyl alcohol extracts of M. sinensis and M. floridulus were extracted from raw biomass with 75% ethyl alcohol at 100 °C, and after six cycles, the value was determined through the difference between the weight of the biomass feedstock and the weight of the biomass feedstock after extraction according to Li et al. [28]. The soluble content was calculated according to equation:
SC = (Wap × (1 − map)/(Wb × (1 − mb)) × 100 [%]
Here, SC was soluble content (%), Wap was the weight of biomass feedstock after extraction (g), map was the moisture content of biomass feedstock after extraction (%), Wb was the weight of biomass feedstock (g), and mb was the moisture content of biomass feedstock (%).
Dry matter (0.5 g per sample) was added to ceramic crucibles (15 mL volume) to determine ash content after incineration in the muffle furnace (SX-4-10, Tianjin Taisite Instrument Co., Ltd., Tianjin, China) [29]. The ash content was calculated as follows.
AC = (WarWr)/(Wb × (1 − mb)) × 100 [%]
Here, AC was ash content (%), War was the weight of crucible and ash after calcination (g), Wr was the weight of crucible (g), Wb was the weight of biomass feedstock (g), and mb was the moisture content of biomass feedstock (%).
A two-step sulfuric acid hydrolysis process was used to extract cellulose, hemicellulose, and lignin [30]. Structural carbohydrates (i.e., glucose, xylose, and arabinose) were measured using an HPLC system (LC-40, SHIMADZU Co., Ltd., Kyoto, Japan) equipped with an Aminex HPX-87H chromatography column (300 mm × 7.8 mm, particle size 9 μm, Bio-Rad Laboratories, Hercules, CA, USA) and a refractive index detector (RID 20A, SHIMADZU Co., Ltd., Kyoto, Japan). The lignin content (acid-soluble lignin and acid-insoluble lignin) was measured using a UV-VIS spectrometer (A590, Aoyi Instrument Shanghai Co., Ltd., Shanghai, China) and the same muffle furnace mentioned above. The cellulose content and hemicellulose content were calculated as follows:
Y = C × e × V × X 1000 × W × ( 1 b ) × f × 100 [ % ]
Here, Y was cellulose content (%) or hemicellulose content (%), C was the concentration of fiber polysaccharides (mg/mL), e was the mass conversion coefficient for polysaccharides being converted into monosaccharides via dehydration, V was the hydrolysate volume (mL), X was the extraction residue rate (%), W was the weight of sample (g), b was the moisture content of sample (%), and f was the recovery coefficient of chromatographic correction standard sample.
The lignin content was calculated according to following equation:
L = U × V × n × X 1000 × ε × W × ( 1 b ) + ( W L ) × X W × 1 b × 100 [ % ]
Here, L was lignin content (%), U was the absorbance of neutral hydrolysate at 320 nm, V was the hydrolysate volume (mL), n was the dilution ratio of hydrolysate, X was the extraction residue rate (%), b was the moisture content of sample (%), ε was the light absorption rate of hydrolysate (L/(g·cm)), and WL was the weight of precipitation (g).
The cellulose crystalline index of raw biomass, CNCs, and MCC was determined via X-ray diffraction (XRD) using an X-ray diffractometer (XRD-6000, SHIMADZU Co., Ltd., Kyoto, Japan) using Segal peak height method with minor modifications [28]. The raw biomass was laid on the glass sample holder and analyzed under plateau conditions. Ni-filtered Cu Ka radiation (k = 0.15406 nm) was generated at a voltage of 40 kV and a current of 30 mA and scanned at a speed of 5°/min from 10° to 35°. The CrI was estimated using the intensity of the 200 peak (I200, 2θ = 22.5°) and the intensity at the minimum between the 200 and 110 peaks (Iam, h = 18.5°) as follows (7):
CrI = (I200Iam)/I200 × 100 [%]
Here, CrI was the cellulose crystallinity index, I200 represented intensity of the peak at 22.5°, and Iam was the intensity of the minimum between the 200 and 110 peaks at 18.5°.
The degrees of polymerization (DPs) of raw biomass, CNCs, and MCC were measured using the viscosity method [28]. All experiments were performed using Ubbelohde viscosity meter and copper(II) ethylenediamine complex (0.5 M solution in H2O). Since the viscosity of the copper ammonia solution was easily affected by temperature, the value of the measured polymerization degree generally decreased with the increased in temperature to ensure the reaction temperature was strictly controlled at 25 °C. The intrinsic viscosity was calculated through interpolation using the USP table (USP, 2002) that lists the predetermined values of the product of intrinsic viscosity and concentration, ([ŋ]C), for cellulose samples exhibiting relative viscosity (ŋrel) values between 1.1 and 9.9. ŋrel was calculated using the relationship ŋrel = t/t0, where t and t0 were the efflux times for the cellulose solution and Cuen solvent, respectively.
In addition, the concentration of the sample was calculated by following formula:
C = ( W 0 W ) / V
Here, C was the concentration of sample (g/mL); W0 was the quality of the standard sample (g); W was the quality of undissolved standard samples (g); V was the volume of Copper ammonia solution (mL).
DP was calculated by following formula:
D P 0.905 = 0.75 × [ η ]
Here, DP0.905 was the degree of polymerization of lignocellulosic biomass; [η] was the characteristic viscosity of sample solution.
Based on electrophoretic and dynamic light scattering, the zeta potential and particle size distribution of CNCs were measured using nanometer particle size meter (ZETASIZER NANO ZS, Malvern Panalytical, Ltd., Birmingham, UK). The morphology of CNCs was observed with a scanning electron microscope (SEM) (ZEISS Sigma 300, Carl Zeiss AG, Oberkochen, Germany) and a digital camera (Canon EOS M50, Tokyo, Japan).
The following process (Figure 1) illustrates the path from the plant to the MCC and CNCs.

2.5. The Development of Extra Trees Models

The prediction performance of Extra Trees model was evaluated using the regression coefficient (R2), mean squared error (MSE), root mean squared error (RMSE), mean absolute error (MAE), and mean absolute percentage error (MAPE) in the test sets. The more the value of R2 was close to 1, the lower MSE, RMSE, MAE, and MAPE were and the more accurate the forecasting of the model was. The calculation formulas of R2, MSE, RMSE, MAE, and MAPE are shown as follows:
R 2 = 1 i = 1 M ( β i β i , m o d e l ) 2 i = 1 M ( β i β i ¯ ) 2
M S E = 1 M i = 1 M ( β i β i , m o d e l ) 2
R M S E = 1 M i = 1 M β i β i , m o d e l
M A E = 1 M i = 1 M β i β i , m o d e l
M A P E = 1 M i = 1 M β i β i , m o d e l β i , m o d e l
Here, M was the sum of data points, βi was the actual value from the dataset, βi,model was the forecast value of the model, and β i ¯ was the mean value of βi. In this study, Extra Trees algorithm was constructed by applying the Scikit–learn library in the Python programming language (Python 3.11).
The hyper parameters of the Extra Trees algorithms were tuned, including the number of decision trees, the max depth of each tree, the number of features to be accounted for when looking for the optimal segmentation, limit of sample number after child node splitting, and minimum number of samples required for leaf splitting.

2.6. Statistical Analysis

All chemical assays were conducted in triplicate and the average values are presented as percentages of dry weight. The cellulose was determined via the amount of glucose. Hemicellulose content was calculated as the sum of xylose and arabinose contents. Lignin content was calculated as the sum of acid-soluble lignin and acid-insoluble lignin contents. Word Processing System (WPS) Office software (v2021) was used to calculate the percentages of soluble content, cellulose content, hemicellulose content, lignin content, and ash content of different samples. SPSS 25.0 software was used for data, variance analysis, and correlation coefficients, which were calculated by performing Pearson rank correlation analysis, and one-way ANOVA was used to test the difference between the contents of each component wherein statistical significance was defined as p < 0.01. Origin 2022 was used to draw the chemical composition and physical properties in different samples.

3. Results

3.1. Selection of Representative Clones of M. sinensis and M. floridulus

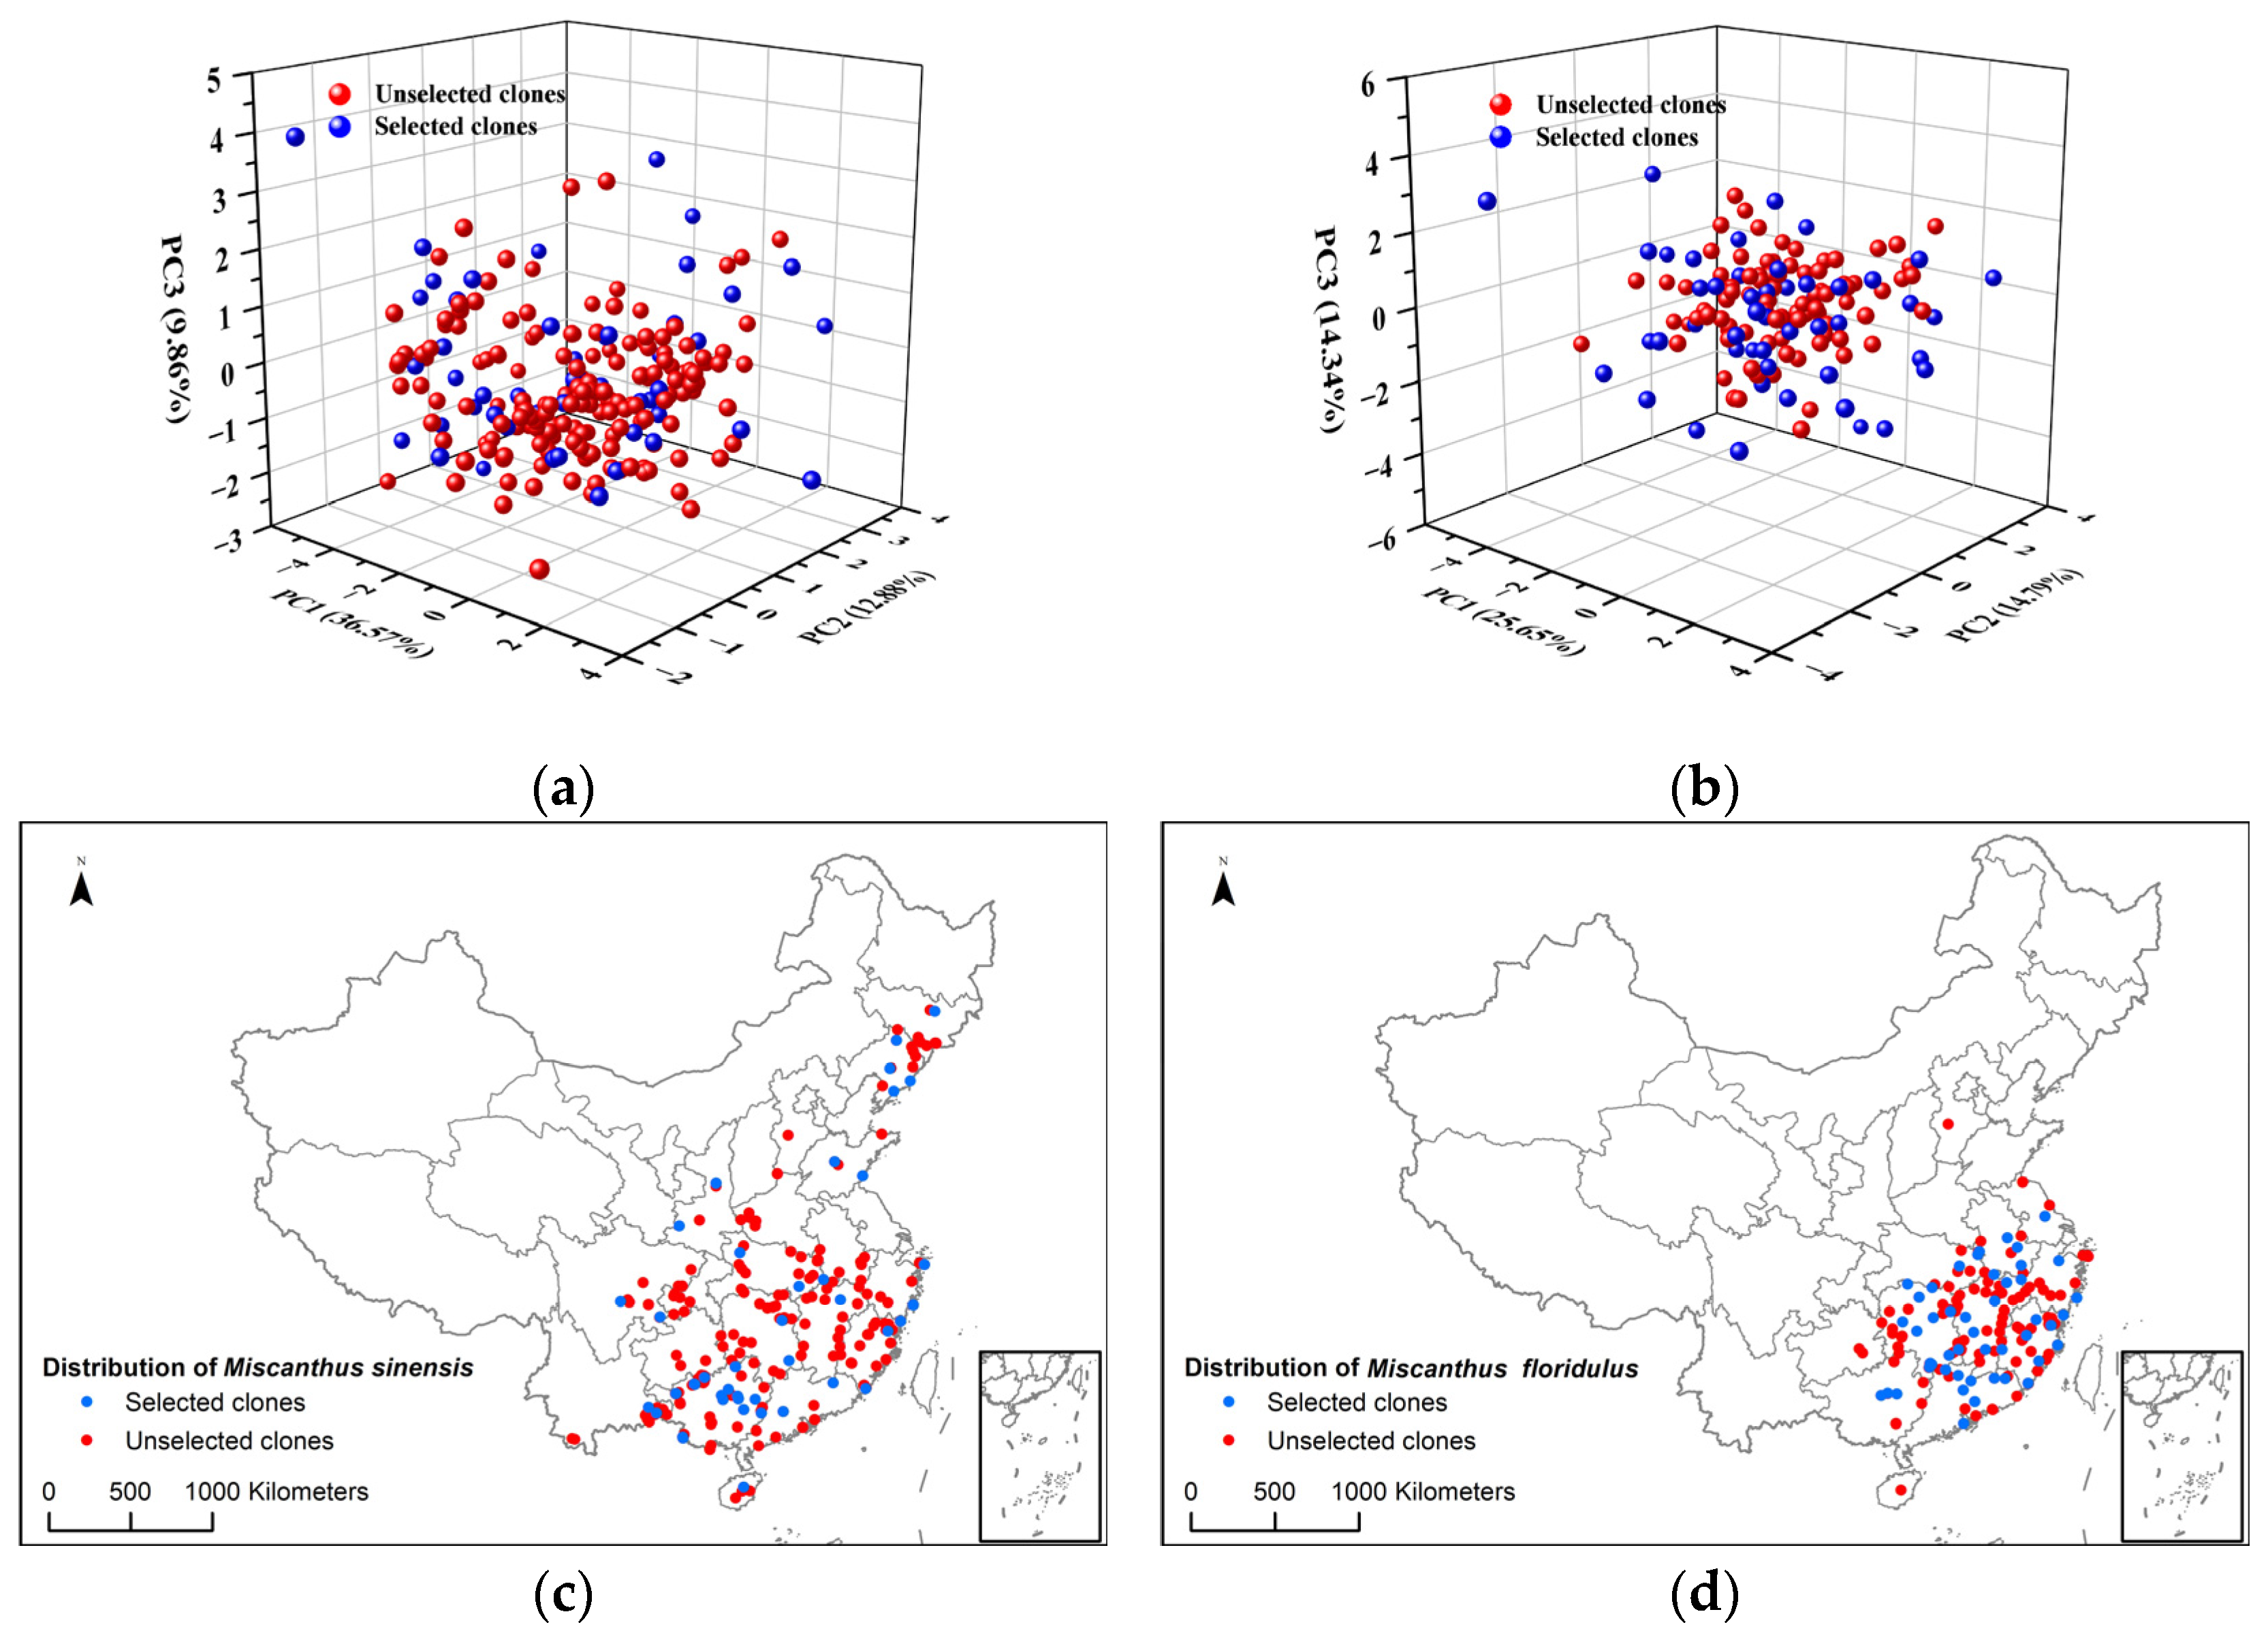
In this study, 50 clones each of M. sinensis and M. floridulus were initially screened using principal component analysis (PCA) coupled with cluster analysis (CA). Overall, the PCA score plots of selected clones of M. sinensis and M. floridulus displayed a uniformly mixed and symmetrical distribution consistent with their sample populations (Figure 2a,b). Histograms of selected clones for canopy height, leaf length, leaf width, stem diameter, base diameter, tiller number, base circumference, moisture content, dry biomass weight, and leaf/stem ratio are presented here (Figure S1). As expected, each agronomic trait of selected clones of both M. sinensis and M. floridulus represented nearly the same distributions as those of the corresponding sample populations. Similarly, the geographical distribution of the selected clones of M. sinensis and M. floridulus was consistent with those of the sample populations (Figure 2c,d). Previous studies suggested that selecting samples with representative genetic, environment, and cultivation backgrounds makes statistical data for genetic diversity analysis more convincing and enables the better development and utilization of Miscanthus spp. [20]. Therefore, the combination of PCA and CA can effectively screen representative germplasm resources, making the selected clones suitable for subsequent diversity analysis of germplasm resources for agronomic traits, biomass quality traits, and MCC and CNC yield.

3.2. Diversity Analysis of Agronomic Traits and Biomass Quality Traits of Representative Clones of M. sinensis and M. floridulus

Agronomic traits are the external expressions of plant genes under certain environmental conditions and are significantly related to biomass quality traits, thus affecting the production potential of bio-based products [10]. The genotype diversity of the representative clones was manifested by the varied agronomic trait levels from 2020 (presented in Table 1). In general, the average values of each agronomic trait of M. floridulus were significantly higher than those of M. sinensis, especially for the dry biomass weight. Since it was the most important agronomic trait affecting the yield of bio-based materials, M. floridulus was a more ideal biomass feedstock than M. sinensis in terms of dry biomass weight in commercial application [20]. Additionally, a significant degree of variability in the dry biomass weight was observed among the representative clones of both M. floridulus and M. sinensis, indicating greater potential for genetic breeding improvement.
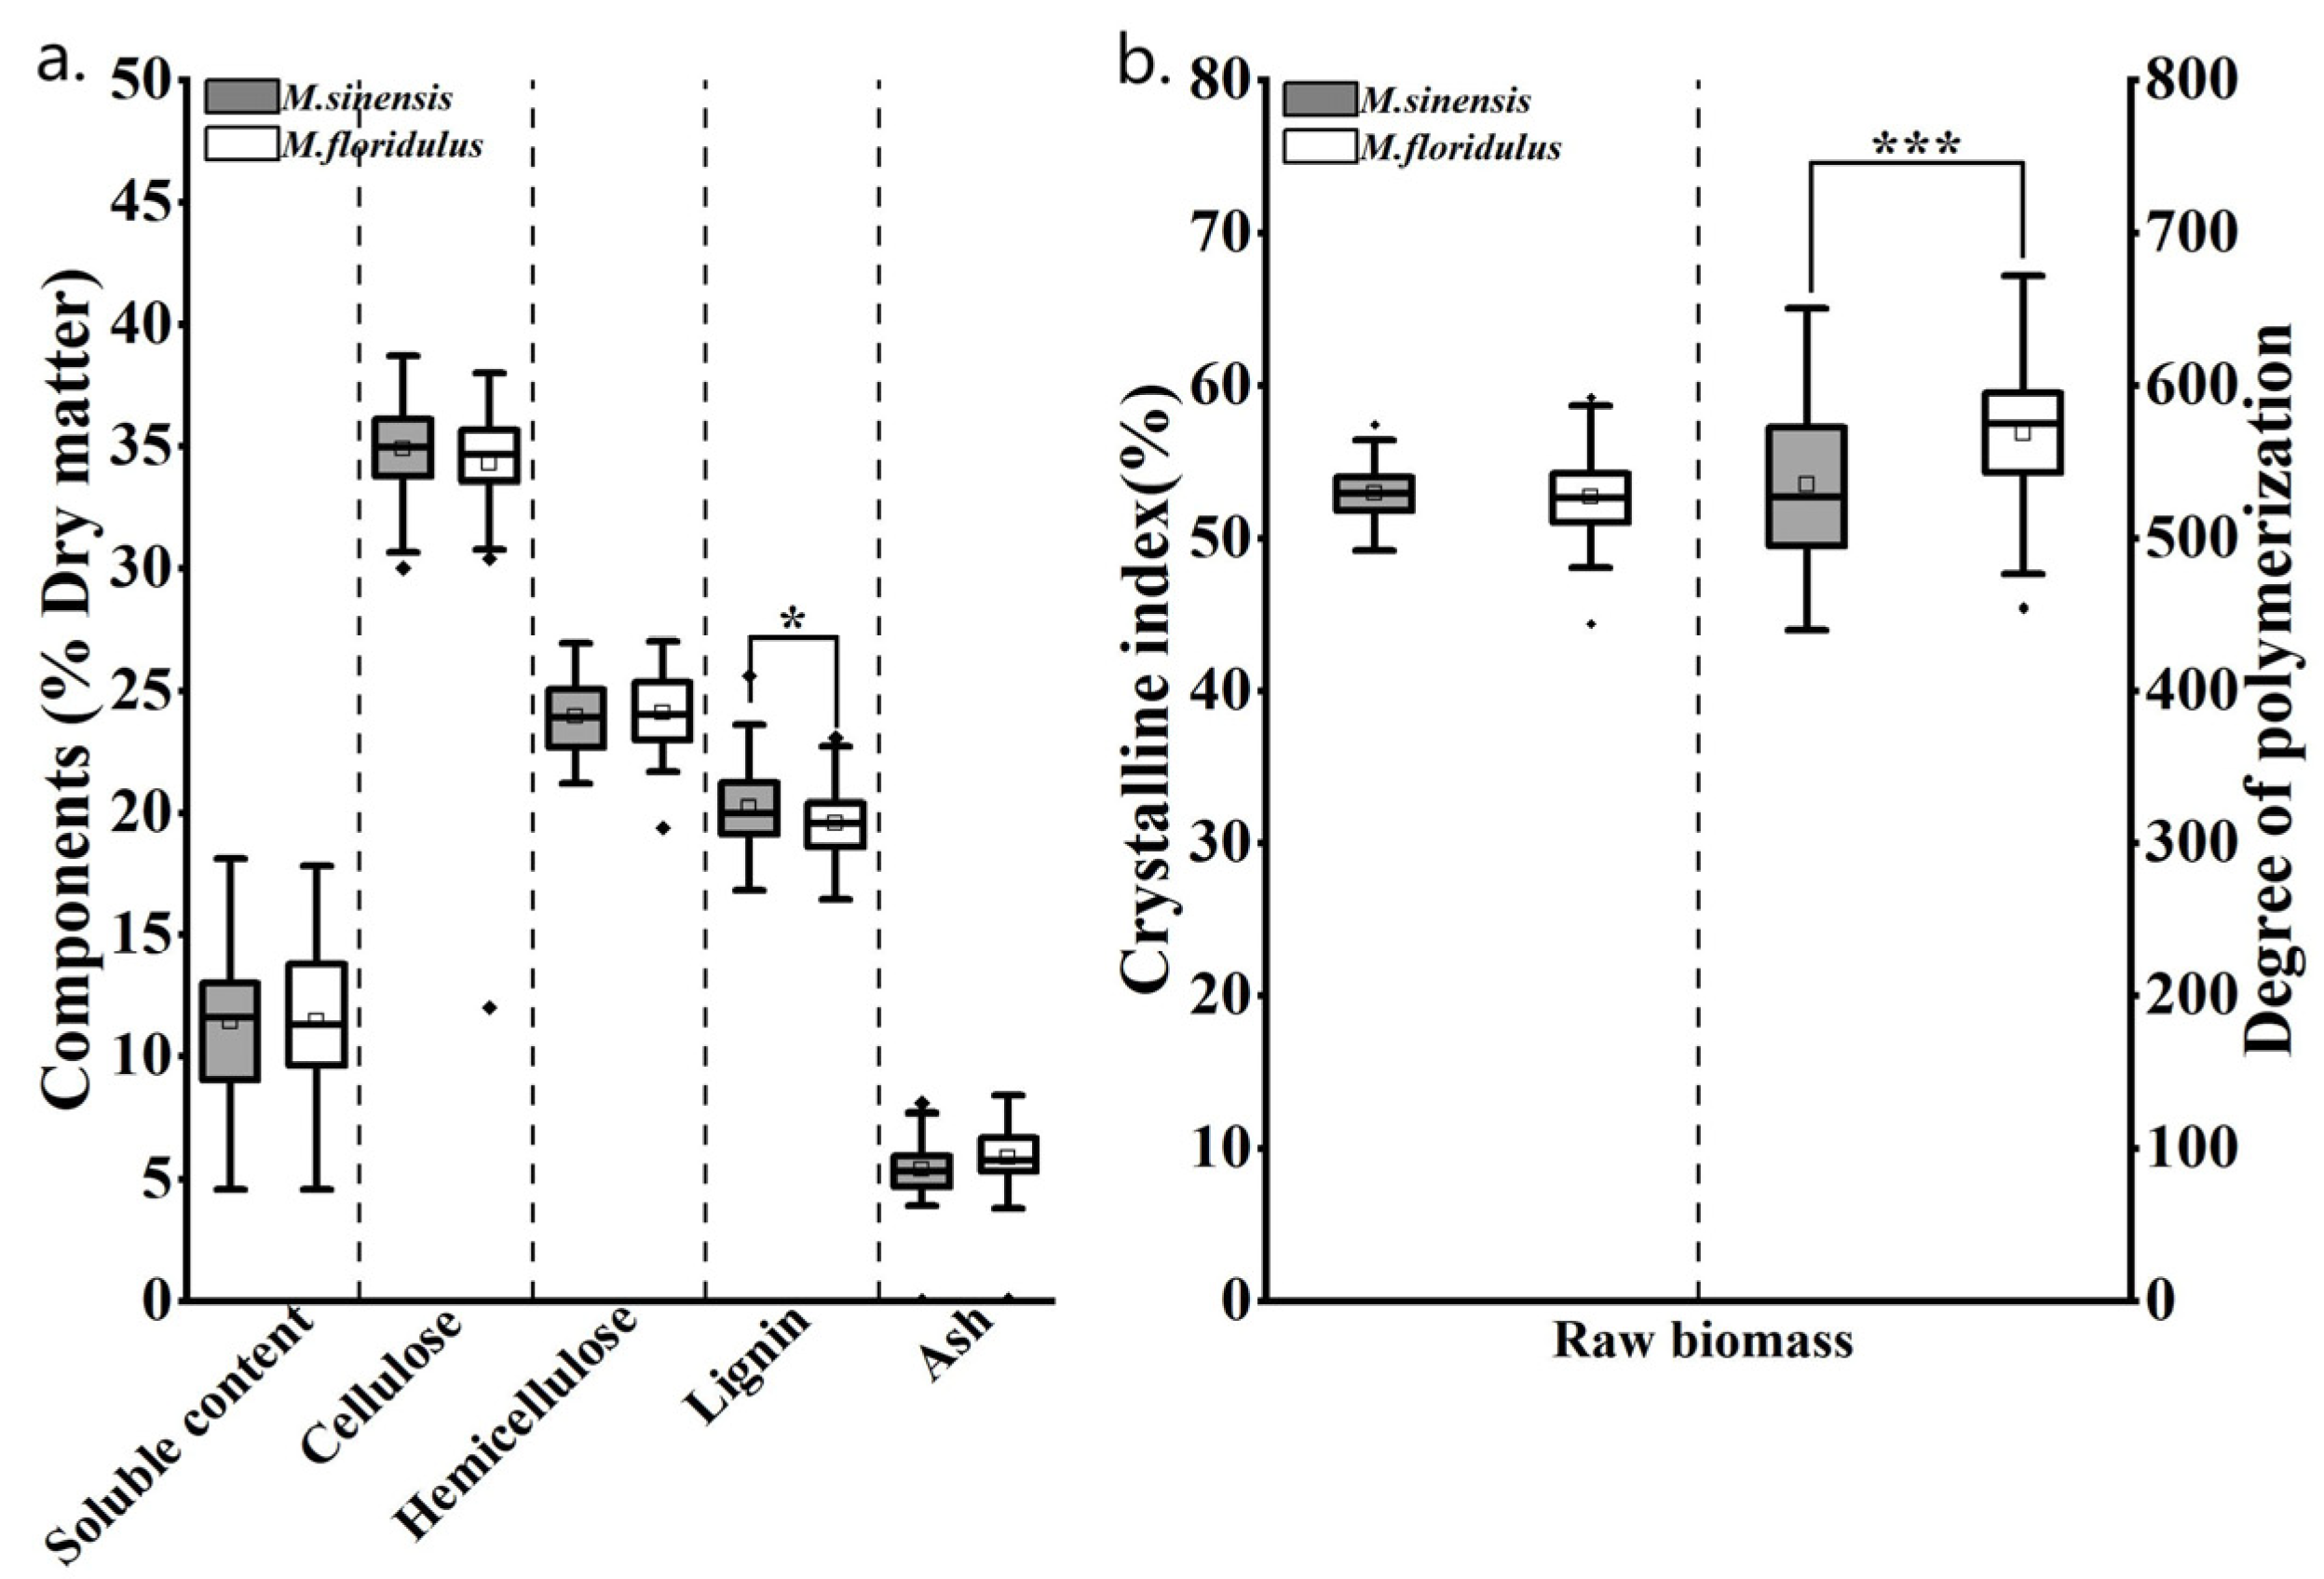
Owing to genotype diversity, both M. sinensis and M. floridulus representative clones exhibited significant variations in terms of biomass quality traits, resulting in a wider distribution (Figure 3a). Specifically, the soluble content in M. sinensis ranged from 4.6% to 17.8%, cellulose content ranged from 32.0% to 38.0%, hemicellulose content ranged from 19.4% to 23.0%, lignin content ranged from 16.4% to 23.7%, and ash content ranged from 0.1% to 8.4%. And the soluble content in M. floridulus ranged from 4.6% to 18.1%, cellulose content ranged from 30.0% to 38.7%, hemicellulose content ranged from 21.2% to 27.0%, lignin content ranged from 17.0% to 25.6%, and ash content ranged from 0.1% to 8.1%. Different from the results of agronomic trait analysis, ANOVA analysis shown no significant difference in the contents of most chemical components between M. sinensis and M. floridulus except for lignin (p < 0.05). The most obvious finding to emerge from the analysis was that the cellulose contents of M. sinensis and M. floridulus were significantly higher than those of agricultural residues such as bean stalk (31.1%), rice straw (38.8%) and corn stover (32.8%) [19]. Moreover, hemicellulose and lignin were regarded as the major non-cellulosic components inhibiting cellulose isolation from lignocellulosic biomass [28]. In this study, the non-cellulosic components of representative clones were lower than those of rice straw, rice husk, wheat straw, pine nut shell, and Moso bamboo, indicating their higher yield potential as cellulose functional materials [13]. With respect to physical features, it has been widely accepted that cellulose comprises alternating regions of highly crystalline and amorphous structures, and its CrI and DP are considered to be key factors that may affect the yield and quality of MCC and CNCs [12]. Notably, the CrI and DP values of both M. sinensis and M. floridulus, as shown in Figure 3b, were significantly higher than those of typical agricultural and forestry wastes [31]. In addition, ANOVA analysis suggested that the DP values of M. floridulus were significantly higher than those of M. sinensis, indicating that the molecular chains of the former are longer.
Therefore, this extensive collection of M. sinensis and M. floridulus exhibited remarkable levels of desired agronomic and biomass quality traits, suggesting the potential of these plants as industrial crops for the production of MCC and CNCs.

3.3. Analysis of the Yield Potentials of MCC and CNCs in M. sinensis and M. floridulus

The exceptional yield and quality played a pivotal role in facilitating the development of an industrially viable biomass resource for bio-based material [32]. To confirm the yield potential of cellulose functional materials of Miscanthus spp., we further carried out tests on MCC and CNCs originating from M. sinensis and M. floridulus in this work. In particular, the yields of MCC and CNCs from the two species of Miscanthus spp. were significantly higher than those of agricultural residues [33]. To be specific, the yields of MCC and CNCs from M. sinensis ranged from 17.0% to 34.7% and 7.7% to 27.7%, respectively (Figure 4a). Meanwhile, the yields of MCC and CNCs from M. floridulus ranged from 14.4% to 32.7% and 8.0% to 27.9%, respectively. Interestingly, although no significant differences were observed in cellulose contents and CrI between M. sinensis and M. floridulus, the yields of MCC and CNCs in the former were significantly higher than those in the latter. Meanwhile, as depicted in Figure 4b, the average CNC particle size of M. sinensis exhibited a statistically significant reduction compared to that of M. floridulus. Previous studies have shown that CNCs may be extracted from the crystalline part of cellulose by hydrolyzing the non-crystalline region [2,3,4,7]. In conjunction with the results of DP analysis, our findings demonstrated that the cellulose molecular chain in M. sinensis exhibits a shorter length compared to that in M. floridulus and is characterized by relatively small interconnecting crystalline and amorphous regions. Recent evidence has suggested that particle size is the most critical factor affecting the properties of nanocellulose [30]. Therefore, this observation might support the hypothesis that M. sinensis is a more favorable candidate for MCC and CNC extraction in comparison to M. floridulus, potentially leading to higher yields of MCC or CNCs and exceptional properties of CNCs.
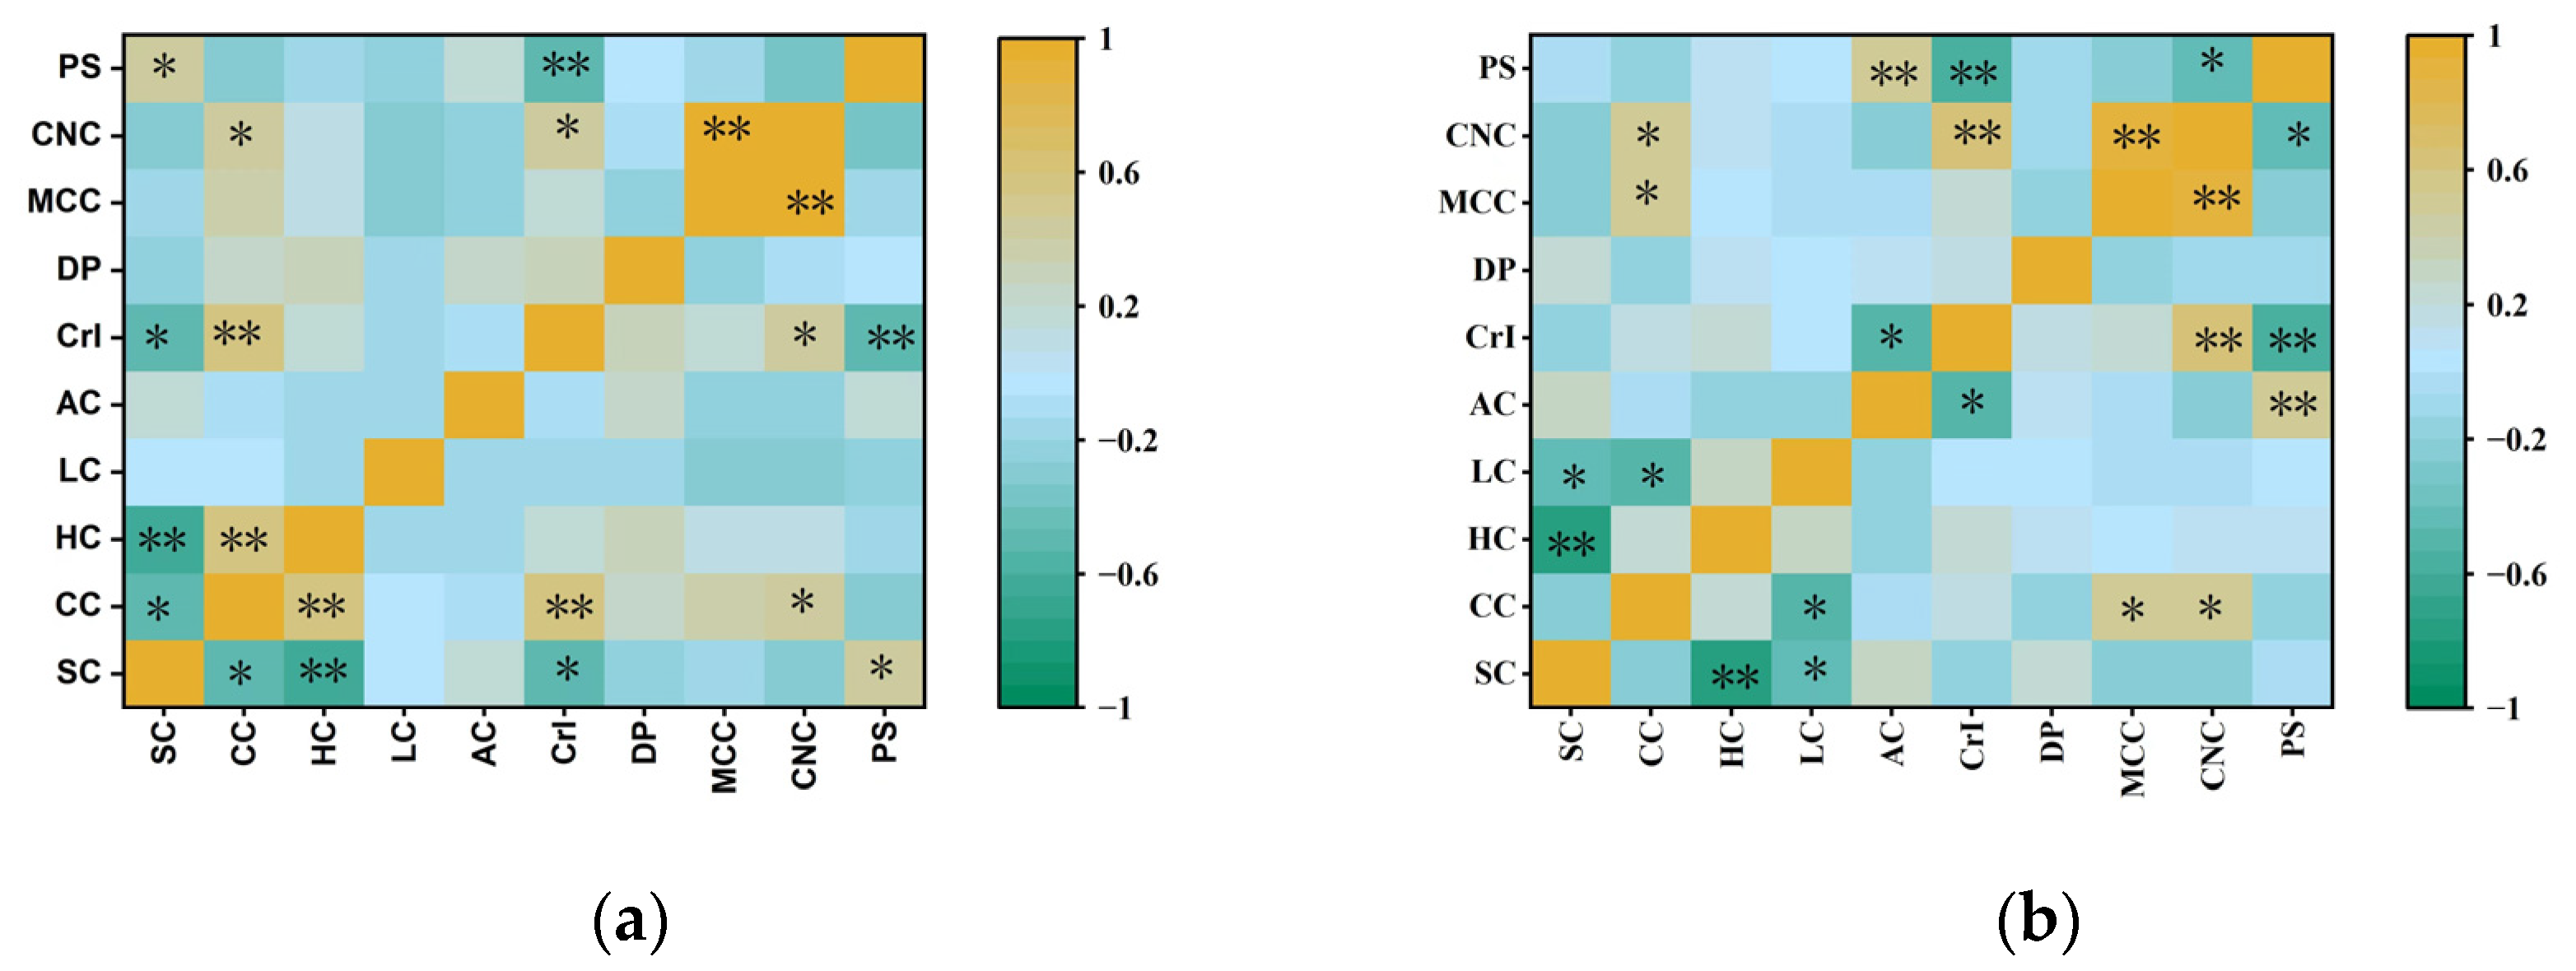
Previous studies have primarily focused on the relationship between agronomic traits and biomass quality traits, but there has been insufficient analysis of biomass quality traits specifically for MCC and CNC production. To confirm the effect of chemical component and cellulose feature alteration on MCC and CNC production, correlation analyses was further performed in this study (Figure 5). It was not surprising to see that cellulose content showed significantly positive correlations with the MCC and CNC yields in M. sinensis and M. floridulus at p < 0.05, respectively. Meanwhile, we observed no significant correlation between CrI or DP and MCC yield, suggesting that alterations in cellulose features do not influence MCC extraction from lignocellulosic biomass. In contrast, the correlation between CrI and CNC yield was found to be statistically strongly significant in both M. sinensis and M. floridulus. Additionally, the yield of CNCs in M. sinensis exhibited a negative correlation with particle size whereas in M. floridulus, this negative correlation with particle size was observed at a highly significant level. Therefore, it can be inferred from the above results that the average size of individual crystalline regions in cellulose of lignocellulosic biomass was a key factor in determining its CNC yield and properties.

3.4. Comparison of Chemical Composition and Physical Features of MCC and CNCs in Representative Clones

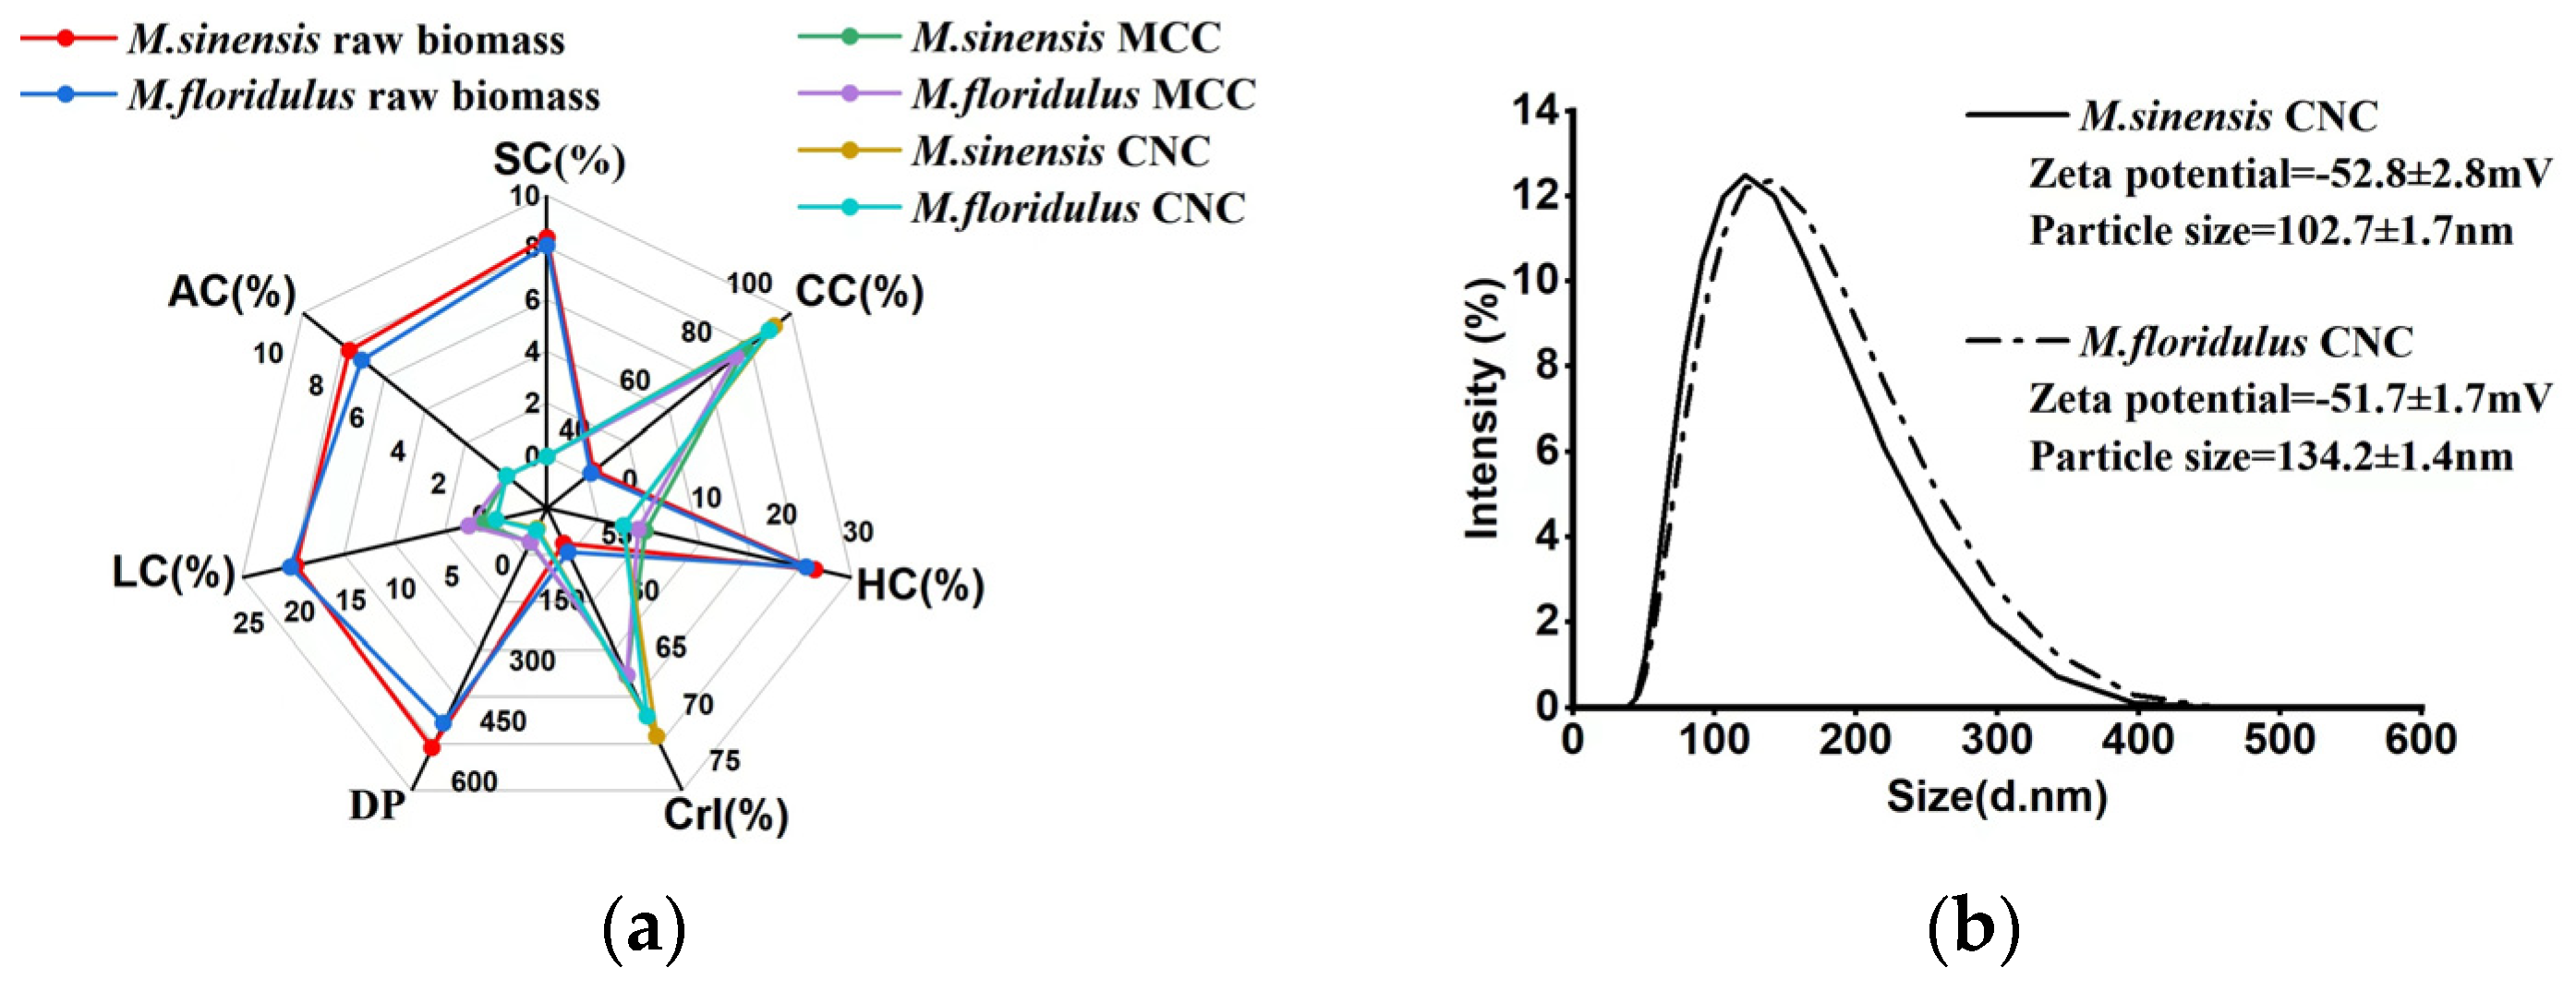
In our study, two representative clones were further selected based on their outstanding DBW to investigate the impact of these species on the characteristics of the obtained MCC and CNCs. The results of chemical composition and cellulose feature analysis showed that there was no significant difference in the biomass quality traits of raw biomass between the selected samples of M. sinensis and M. floridulus (Figure 6a). Significantly, the DP values of CNCs in M. sinensis and M. floridulus were less than 1/6 and 1/7 of their raw biomasses, respectively. In addition, the raw biomass of two clones had the characteristics of high CrI, which was similar to what had been found in Miscanthus lutarioriparius and Miscanthus × giganteus [21]. Moreover, the CrI values of CNCs were further increased and the DP values were decreased when compared with MCC. This verified that the preparation principle of CNCs was to remove the non-crystalline polymers and retain the crystalline cellulose. As might be expected, the MCC and CNC yields of M. sinensis were similar to those of M. floridulus.
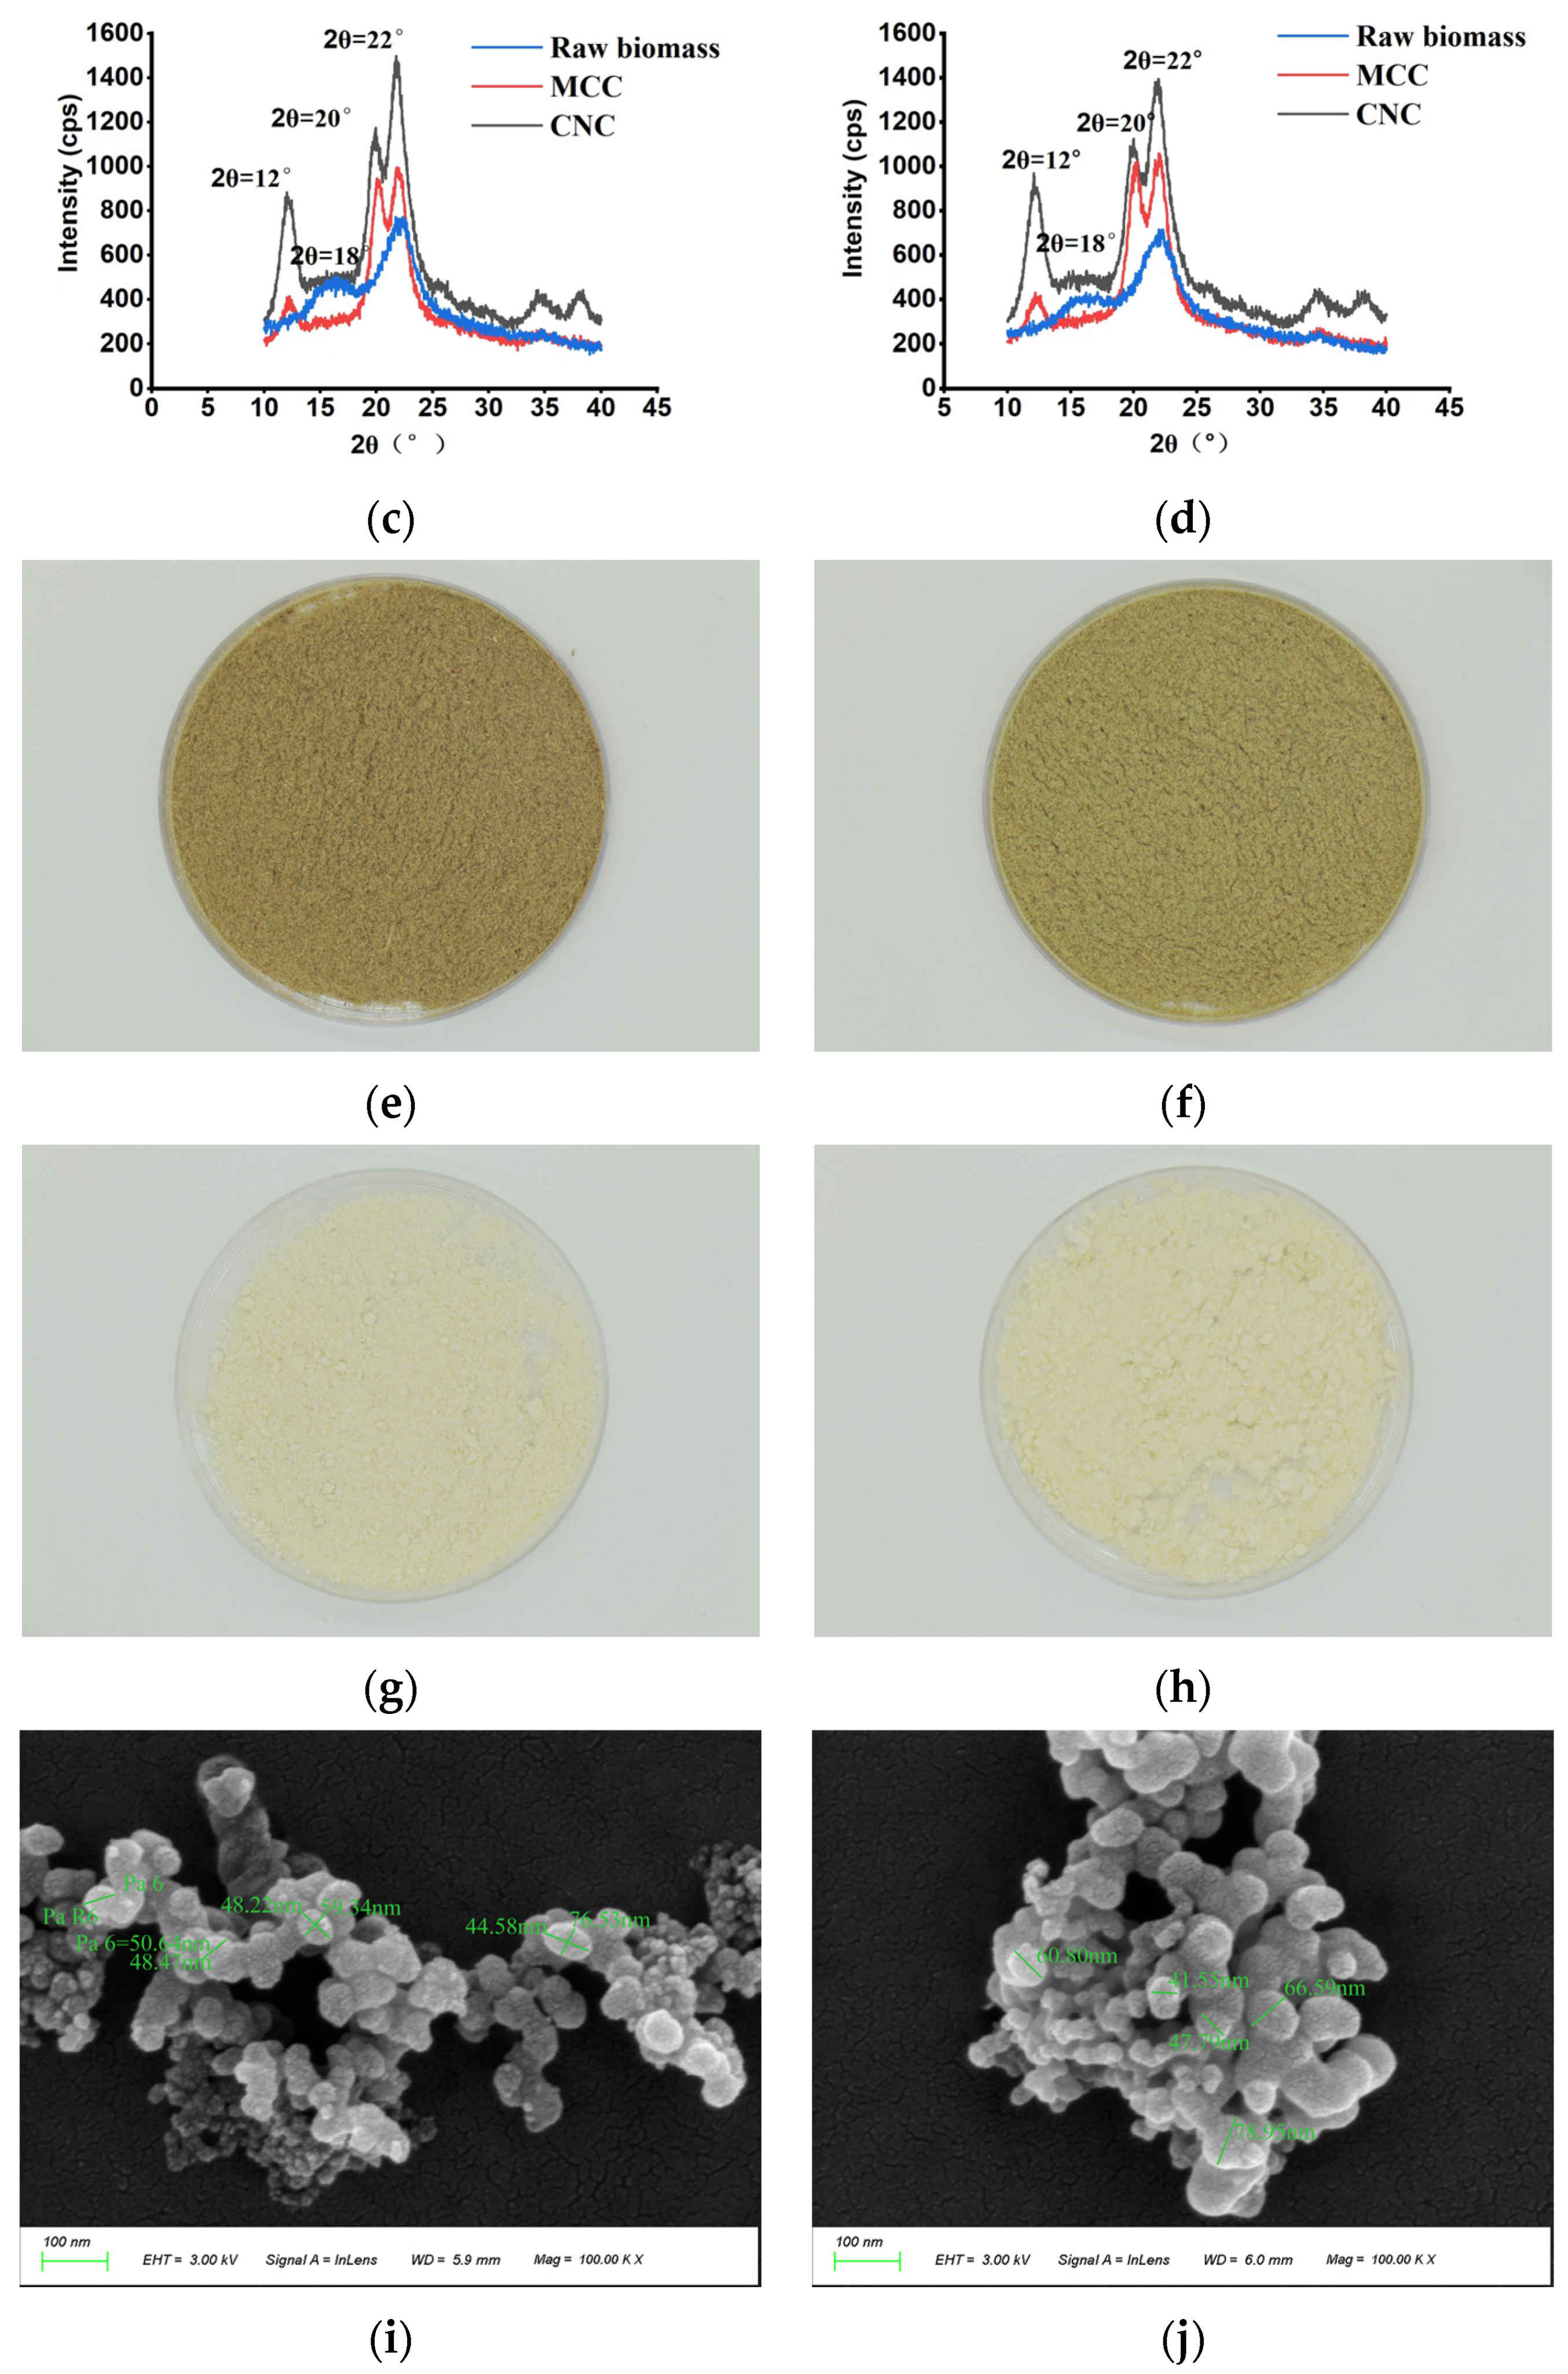
The diffraction patterns of MCC and CNCs isolated from the raw biomass of M. sinensis and M. floridulus are presented in Figure 6b and Figure 6c, respectively. Firstly, the diffraction patterns of the two raw biomass show similar peaks at 2θ values of about 15°, 17°, and 22° (peaks marked in blue), which is consistent with the 1–10, 110, and 200 planes of cellulose I [34]. Notably, the diffraction patterns of MCC and CNCs contain three maxima at the diffraction angles of 12°, 20°, and 22°, which were ascribed to lattice planes at 110, 110, and 020 of cellulose II, respectively (peaks marked in red or black). Taken together, these findings suggest that the utilization of alkaline peroxide pretreatment enables the conversion of cellulose I to cellulose II during MCC isolation whereas subsequent CNC isolation using acid hydrolysis pretreatment does not alter the cellulose type. Moreover, the CrI values of the two representative samples showed the same trend of conversion from raw biomass to MCC and then to CNCs, suggesting that the CrI value of raw biomass plays a significant role in determining the CrI value of both MCC and CNCs. Figure 6d presents the particle size distribution and zeta potential of CNCs in M. sinensis and M. floridulus. Although the CNC yields of the two representative samples were comparable, the average particle size of the M. sinensis was significantly smaller than that of the M. floridulus, suggesting superior nanomaterial properties in the former. Meanwhile, zeta potential behavior demonstrated the CNC colloidal systems of both M. sinensis and M. floridulus were stable, and both were lower than −50 mV. Previous studies showed that the suspension that has the higher zeta has to be stable as the charged particles repel each other, and this force overcomes the natural tendency to aggregate [2,12,15]. Therefore, the particle size uniformity and zeta potential stability of CNCs were important for their processability to further prepare advanced materials. Figure 6i,j show SEM images of CNCs after 100,000-times magnification, providing additional evidence that both M. sinensis and M. floridulus CNCs reach the nanoscale, exhibiting irregular shapes composed of spherical particles with diameters from 41.55 to 78.95 nm. Generally speaking, the CNCs should be rod-shaped, and the CNCs prepared in this study were ball-shaped. However, no obvious rod-like structure was found in the background region of the figure, which ruled out the possibility that the CNCs prepared by M. sinensis and M. floridulus comprised spheres composed of small rod-like CNCs. The reason may be related to the shape of the cellulose crystallization region of the material itself. Taken together, these studies support the notion that M. sinensis and M. floridulus exhibited exceptional potential as sustainable biomass feedstock for the production of MCC and CNCs.

3.5. Extra Trees Modeling for Yields of MCC and NCC

To predict the yields of MCC and CNCs, we further optimize the hyper parameters and maximum depth of the estimator, followed by an evaluation of the prediction performance using the Extra Trees algorithm. Summary statistics for the hyper parameters of each product with the best prediction performance are presented in Table 2. To ensure a fair comparison, the number of estimators and hyper parameters for max depth were kept consistent between the two models. In general, the CNC model demonstrated superior predictive accuracy compared to the MCC model for each target variable in both the training and test datasets. Furthermore, the scatter charts presented in Figure 7 depict the predicted and actual data for each target variable, with R2 values as high as 0.877 for the MCC model and 0.895 for the CNC model. Together, these results provide important insights into how the Extra Trees algorithm could significantly enhance both the stability and accuracy of predicting models for MCC and CNCs. Such models form the basis of a precise and efficient methodology for predicting both MCC and CNC yields of lignocellulosic biomass of Miscanthus spp.
With complex and multi-dimensional processes, biomass utilization is difficult to predict, and ML has been applied in parts of biomass utilization [35]. To our best knowledge, there have been no studies on MCC and CNC synthesis prediction using machine learning; we implemented the first application of predicting CNC yields based on biomass quality traits. Still, this model was limited by its sample count, which may affect the universality and interpretation of the results. Furthermore, the model explainer is considered a powerful tool to explain the model and reveal the reaction mechanism [36]. If the quantity of data can be expanded and the explainer can be rationally applied, it will shorten a lot of time for the germplasm screening of Miscanthus spp. and save a lot of money for the cultivation of industrial varieties.

4. Discussion

Despite the fact that M. sinensis and M. floridulus have been regarded as advantageous renewable bioenergy feedstock, the research on their potential for the preparation of bio-based materials such as MCC and CNCs has been insufficient [21]. The estimation of their values in terms of MCC and CNC preparation was the first step of industrialization popularization; therefore, it was important to explore the potential of preparing MCC and CNCs. Meanwhile, the rich genetic diversity of M. sinensis and M. floridulus provides a rich material basis for carrying out studies on the impact of chemical composition and physical properties of raw biomass on the yield potential and properties of MCC and CNCs.
In this study, the combination of PCA and CA proved to be highly efficient in screening representative clones. As expected, the selected germplasm resource of two Miscanthus spp. exhibited significant diversity in terms of MCC and CNCs, thus further underscoring their suitability for genetic enhancement. Previous studies have shown that cellulose content is one of the most critical factors affecting the yield potential of MCC and CNCs [5,6,7]. This study further demonstrated, through correlation analysis, that the yield and properties of CNCs extracted from M. sinensis and M. floridulus were not only affected by cellulose content but also by CrI. These results make it conceivable to hypothesize that the extraction of CNCs occurred specifically from the crystalline regions of cellulose, the average size of individual crystalline regions in cellulose of lignocellulosic biomass was a key factor in determining its CNC yield and properties.
As described in this paper, we further performed a comparative analysis of MCC and CNCs extracted from representative samples of M. sinensis and M. floridulus with similar biomass quality traits. The XRD results show that the process of CNC isolation caused the transformation of cellulose Ⅰ into cellulose Ⅱ while the CrI values of both MCC and CNCs were determined via the CrI values of raw biomass. The particle size distribution and SEM images provide compelling evidence that the CNCs extracted from both M. sinensis and M. floridulus exhibit nanoscale properties. Furthermore, the zeta potential behavior demonstrated that the CNC colloidal systems were stable. These analyses support the notion that M. sinensis and M. floridulus provide a new competitive biomass feedstock for MCC and CNCs.
Moreover, the Extra Trees algorithm demonstrated its efficacy and effectiveness for the prediction of MCC and CNC yields. To the best of my knowledge, this study represents the pioneering application of machine learning algorithms for predicting the potential suitability of Miscanthus as a raw material for modified cellulose production.

5. Conclusions

The sample diversity of M. sinensis and M. floridulus was clearly demonstrated by the varying levels of agronomic traits, biomass quality traits, and MCC and CNC yields. Firstly, M. floridulus exhibited much higher dry biomass weight than did M. sinensis while M. sinensis was superior in MCC and CNC yields as well as in nanomaterial properties. It is worth noting that the average size of individual crystalline regions in cellulose is hypothesized to be a crucial factor in determining its CNC yield and performance. Furthermore, the CNCs extracted from the two species exhibited remarkable stability and quality. Finally, the Extra Trees algorithm proved its efficacy and effectiveness for the prediction of MCC and CNC yields. The prediction R2 of the MCC model reached 0.67 and the CNC model prediction set R2 reached 0.70.

Supplementary Materials

The following supporting information can be downloaded at: https://www.mdpi.com/article/10.3390/agronomy14061255/s1, Figure S1: Histogram of agronomic traits of full samples of database and representative samples. (a) Histogram of agronomic traits of 50 M. sinensis and full M. sinensis samples from database. (b) Histogram of agronomic traits of 50 M. floridulus and full M. floridulus samples from database.

Author Contributions

Conceptualization: W.L. and M.L.; methodology: W.L. and S.W.; resources: Z.Y.; investigation: Y.I.; data curation, W.L., L.Y. and J.L.; writing—original draft preparation, W.L. and L.Y.; writing—review and editing, M.L. and S.W.; supervision, S.X., Z.C., B.S. and T.F.; project administration, Z.Y. All authors have read and agreed to the published version of the manuscript.

Funding

This research was funded by the National Natural Science Foundation of China (grant numbers 32000260 and 31471557), Natural Science Foundation of Hunan Province (grant number 2020JJ5228 and 2023JJ40311), Foundation for the Construction of Innovative Hunan (grant number 2019NK2021), China Postdoctoral Science Foundation (grant number 2020M682566), Changsha Natural Science Foundation (kq2208068).

Data Availability Statement

The original contributions presented in the study are included in the article, further inquiries can be directed to the corresponding author.

Acknowledgments

We express our deepest gratitude to the Hunan Engineering Laboratory of Miscanthus Ecological Applications of Hunan Province for providing support and permission to conduct this research. The authors thank Weihong Du, Yao Li, Yanchen He, Cheng Zheng, Yanmei Tang, Shicheng Li, Jianfeng Liao, Yan Yuan, Yinghong Lang, Zhenlei Tang, Qingshan Wang, and other colleagues for their assistance in data collection.

Conflicts of Interest

The authors declare that they have no competing interests.

References

  1. Karnaouri, A.; Chorozian, K.; Zouraris, D.; Karantonis, A.; Topakas, E.; Rova, U.; Christakopoulos, P. Lytic polysaccharide monooxygenases as powerful tools in enzymatically assisted preparation of nano-scaled cellulose from lignocellulose: A review. Bioresour. Technol. 2022, 345, 126491. [Google Scholar] [CrossRef] [PubMed]
  2. Jonoobi, M.; Oladi, R.; Davoudpour, Y.; Oksman, K.; Dufresne, A.; Hamzeh, Y.; Davoodi, R. Different preparation methods and properties of nanostructured cellulose from various natural resources and residues: A review. Cellulose 2015, 22, 935–969. [Google Scholar] [CrossRef]
  3. Rana, A.K.; Frollini, E.; Thakur, V.K. Cellulose nanocrystals: Pretreatments, preparation strategies, and surface functionalization. Int. J. Biol. Macromol. 2021, 182, 1554–1581. [Google Scholar] [CrossRef] [PubMed]
  4. Kontturi, E.; Laaksonen, P.; Linder, M.B.; Nonappa; Gröschel, A.H.; Rojas, O.J.; Ikkala, O. Advanced Materials through Assembly of Nanocelluloses. Adv. Mater. 2018, 30, e1703779. [Google Scholar] [CrossRef] [PubMed]
  5. Randis, R.; Darmadi, D.B.; Gapsari, F.; Sonief, A.A. Isolation and characterization of microcrystalline cellulose from oil palm fronds biomass using consecutive chemical treatments. Case Stud. Chem. Environ. Eng. 2024, 9, 100616. [Google Scholar] [CrossRef]
  6. Xing, J.; Tao, P.; Wu, Z.; Xing, C.; Liao, X.; Nie, S. Nanocellulose-graphene composites: A promising nanomaterial for flexible supercapacitors. Carbohydr. Polym. 2019, 207, 447–459. [Google Scholar] [CrossRef] [PubMed]
  7. De France, K.J. Chiral nematic cellulose nanocrystal composites: An organized review. Can. J. Chem. Eng. 2024, 25253. [Google Scholar] [CrossRef]
  8. Johar, N.; Ahmad, I.; Dufresne, A. Extraction, preparation and characterization of cellulose fibres and nanocrystals from rice husk. Ind. Crops Prod. 2012, 37, 93–99. [Google Scholar] [CrossRef]
  9. Babicka, M.; Woźniak, M.; Bartkowiak, M.; Peplińska, B.; Waliszewska, H.; Zborowska, M.; Borysiak, S.; Ratajczak, I. Miscanthus and Sorghum as sustainable biomass sourcesfor nanocellulose production. Ind. Crops Prod. 2022, 186, 115177. [Google Scholar] [CrossRef]
  10. Wang, Y.; Fan, C.; Hu, H.; Li, Y.; Sun, D.; Wang, Y.; Peng, L. Genetic modification of plant cell walls to enhance biomass yield and biofuel production in bioenergy crops. Biotechnol. Adv. 2016, 34, 997–1017. [Google Scholar] [CrossRef]
  11. Mandal, A.; Chakrabarty, D. Isolation of nanocellulose from waste sugarcane bagasse (SCB) and its characterization. Carbohydr. Polym. 2011, 86, 1291–1299. [Google Scholar] [CrossRef]
  12. Sai Prasanna, N.; Mitra, J. Isolation and characterization of cellulose nanocrystals from Cucumis sativus peels. Carbohydr. Polym. 2020, 247, 116706. [Google Scholar] [CrossRef] [PubMed]
  13. Lunardi, V.B.; Soetaredjo, F.E.; Putro, J.N.; Santoso, S.P.; Yuliana, M.; Sunarso, J.; Ju, Y.; Ismadji, S. Nanocelluloses: Sources, Pretreatment, Isolations, Modification, and Its Application as the Drug Carriers. Polymers 2021, 13, 2052. [Google Scholar] [CrossRef] [PubMed]
  14. Sebastian, J.; Rouissi, T.; Brar, S.K. Miscanthus sp.—Perennial lignocellulosic biomass as feedstock for greener fumaric acid bioproduction. Ind. Crops Prod. 2022, 175, 114248. [Google Scholar] [CrossRef]
  15. El Achaby, M.; El Miri, N.; Hannache, H.; Gmouh, S.; Trabadelo, V.; Aboulkas, A.; Ben Youcef, H. Cellulose nanocrystals from Miscanthus fibers: Insights into rheological, physico-chemical properties and polymer reinforcing ability. Cellulose 2018, 25, 6603–6619. [Google Scholar] [CrossRef]
  16. Sakovich, G.V.; Skiba, E.A.; Gladysheva, E.K.; Golubev, D.S.; Budaeva, V.V. Miscanthus as a Feedstock for the Production of Bacterial Nanocellulose. Dokl. Chem. 2020, 495, 205–208. [Google Scholar] [CrossRef]
  17. Abreu, M.; Silva, L.; Ribeiro, B.; Ferreira, A.; Alves, L.; Paixao, S.M.; Gouveia, L.; Moura, P.; Carvalheiro, F.; Duarte, L.C.; et al. Low indirect land use change (ILUC) energy crops to bioenergy and biofuels—A Review. Energies 2022, 15, 4348. [Google Scholar] [CrossRef]
  18. Brosse, N.; Dufour, A.; Meng, X.; Sun, Q.; Ragauskas, A. Miscanthus: A fast-growing crop for biofuels and chemicals production. Biofuels Bioprod. Biorefining 2012, 6, 580–598. [Google Scholar] [CrossRef]
  19. Riseh, R.S.; Vazvani, M.G.; Hassanisaadi, M.; Thakur, V.K. Agricultural wastes: A practical and potential source for the isolation and preparation of cellulose and application in agriculture and different industries. Ind. Crops Prod. 2024, 208, 117904. [Google Scholar] [CrossRef]
  20. Xiang, W.; Xue, S.; Liu, F.; Qin, S.; Xiao, L.; Yi, Z. MGDB: A database for evaluating Miscanthus spp. to screen elite germplasm. Biomass Bioenergy 2020, 138, 105599. [Google Scholar] [CrossRef]
  21. Wang, S.; Yi, Z.; Iqbal, Y.; Chen, Z.; Xue, S.; Fu, T.; Li, M. Polyploid Miscanthus Lutarioriparius: A Sustainable and Scalable Biomass Feedstock for Cellulose Nanocrystal Preparation in Biorefinery. Agronomy 2022, 12, 1057. [Google Scholar] [CrossRef]
  22. Pires, J.R.A.; Souza, V.G.L.; Gomes, L.A.; Coelhoso, I.M.; Godinho, M.H.; Fernando, A.L. Micro and nanocellulose extracted from energy crops as reinforcement agents in chitosan films. Ind. Crops Prod. 2022, 186, 115247. [Google Scholar] [CrossRef]
  23. Cudjoe, E.; Hunsen, M.; Xue, Z.; Way, A.E.; Barrios, E.; Olson, R.A.; Hore, M.J.A.; Rowan, S.J. Miscanthus Giganteus: A commercially viable sustainable source of cellulose nanocrystals. Carbohyd. Polym. 2017, 155, 230–241. [Google Scholar] [CrossRef] [PubMed]
  24. Xiao, L.; Wei, H.; Himmel, M.E.; Jameel, H.; Kelley, S.S. NIR and Py-mbms coupled with multivariate data analysis as a high-throughput biomass characterization technique: A review. Front. Plant Sci. 2014, 5, 388. [Google Scholar] [CrossRef] [PubMed]
  25. Onsree, T.; Tippayawong, N.; Phithakkitnukoon, S.; Lauterbach, J. Interpretable machine-learning model with a collaborative game approach to predict yields and higher heating value of torrefied biomass. Energy 2022, 249, 123676. [Google Scholar] [CrossRef]
  26. Geurts, P.; Ernst, D.; Wehenkel, L. Extremely randomized trees. Mach. Learn. 2006, 63, 3–42. [Google Scholar] [CrossRef]
  27. Jose, D.M.; Vincent, A.M.; Dwarakish, G.S. Improving multiple model ensemble predictions of daily precipitation and temperature through machine learning techniques. Sci. Rep. 2022, 12, 4678. [Google Scholar] [CrossRef]
  28. Li, M.; Wang, J.; Yang, Y.; Xie, G. Alkali-based pretreatments distinctively extract lignin and pectin for enhancing biomass saccharification by altering cellulose features in sugar-rich Jerusalem artichoke stem. Bioresour. Technol. 2016, 208, 31–41. [Google Scholar] [CrossRef]
  29. Sluiter, A.; Hames, B.; Ruiz, R.; Scarlata, C.; Sluiter, J.; Templeton, D.; Crocker, D. Determination of Ash in Biomass. Available online: https://www.nrel.gov/docs/gen/fy08/42622.pdf (accessed on 18 March 2022).
  30. Sluiter, A.; Hames, B.; Ruiz, R.; Scarlata, C.; Sluiter, J.; Templeton, D.; Crocker, D. Determination of Structural Carbohydrates and Lignin in Biomass. Available online: https://www.nrel.gov/docs/gen/fy13/42618.pdf (accessed on 18 March 2022).
  31. Lee, H.V.; Hamid, S.B.A.; Zain, S.K.; Geng, A. Conversion of Lignocellulosic Biomass to Nanocellulose: Structure and Chemical Process. Sci. World 2014, 2014, 631013. [Google Scholar] [CrossRef]
  32. Dharmaraja, J.; Shobana, S.; Arvindnarayan, S.; Francis, R.R.; Jeyakumar, R.B.; Saratale, R.G.; Ashokkumar, V.; Bhatia, S.K.; Kumar, V.; Kumar, G. Lignocellulosic biomass conversion via greener pretreatment methods towards biorefinery applications. Bioresour. Technol. 2023, 369, 128328. [Google Scholar] [CrossRef]
  33. Smyth, M.; García, A.; Rader, C.; Foster, E.J.; Bras, J. Extraction and process analysis of high aspect ratio cellulose nanocrystals from corn (Zea mays) agricultural residue. Ind. Crops Prod. 2017, 108, 257–266. [Google Scholar] [CrossRef]
  34. French, A.D. Idealized powder diffraction patterns for cellulose polymorphs. Cellulose 2014, 21, 885–896. [Google Scholar] [CrossRef]
  35. Peng, W.; Karimi Sadaghiani, O. A review on the applications of machine learning and deep learning in agriculture section for the production of crop biomass raw materials. Energy Sources Part A Recovery Util. Environ. Eff. 2023, 45, 9178–9201. [Google Scholar] [CrossRef]
  36. Ge, H.; Zheng, J.; Xu, H. Advances in machine learning for high value-added applications of lignocellulosic biomass. Bioresour. Technol. 2023, 369, 128481. [Google Scholar] [CrossRef] [PubMed]
Figure 1. The path from the plant to MCC and CNCs.
Agronomy 14 01255 g001
Figure 2. Plots in 3D of the principal component analysis scores and spatial distribution for 50 clones each of M. sinensis and M. floridulus: (a) principal component analysis distribution of M. sinensis; (b) principal component analysis distribution of M. floridulus; (c) spatial distribution of M. sinensis; (d) spatial distribution of M. floridulus.
Agronomy 14 01255 g002
Figure 3. Diversity of chemical components and physical features of 50 clones each of M. sinensis and M. floridulus: (a) chemical components; (b) physical features. * indicates significant differences within representative clones for each agronomic trait at the p < 0.05 level. *** indicates significant differences within representative clones for each agronomic trait at the p < 0.001 level.
Agronomy 14 01255 g003
Figure 4. Descriptive statistics of MCC and CNC yields for 50 clones each of M. sinensis and M. floridulus. (a) MCC and CNC yields; (b) particle size of CNCs. * indicates significant differences within representative clones for each agronomic trait at the p < 0.05 level. ** indicates significant differences within representative clones for each agronomic trait at the p < 0.01 level.
Agronomy 14 01255 g004
Figure 5. Correlations among biomass quality traits, yields of MCC and CNCs, and particle size of CNCs for 50 clones each of M. sinensis and M. floridulus. SC—soluble content, CC—cellulose content, HC—hemicellulose content, LC—lignin content, AC—ash content, CrI—crystalline index, DP—degree of polymerization, MCC—yield of microcrystalline cellulose, CNC—yield of cellulose nanocrystal, and PS—particle size. (a) M. sinensis; (b) M. floridulus. * indicates significant differences within representative clones for each agronomic trait at the p < 0.05 level. ** indicates significant differences within representative clones for each agronomic trait at the p < 0.01 level.
Agronomy 14 01255 g005
Figure 6. Comparative analysis of chemical components, physical features, and morphological observations in representative clones. (a) The values of chemical components and physical features. (b) Particle size distribution and zeta potential of CNCs. (c) XRD profiles of raw biomass, MCC, and CNCs in M. sinensis. (d) XRD profiles of raw biomass, MCC, and CNCs in M. floridulus. (e) The morphology of raw biomass of M. sinensis. (f) The morphology of raw biomass of M. floridulus. (g) The morphology of MCC of M. sinensis. (h) The morphology of MCC of M. floridulus. (i) SEM image of the CNCs in M. sinensis. (j) SEM image of the CNCs in M. floridulus.
Agronomy 14 01255 g006aAgronomy 14 01255 g006b
Figure 7. Scatter charts of train and test data of typical evaluation parameters based on Extra Trees models. (a) Microcrystalline cellulose. (b) Cellulose nanocrystals.
Agronomy 14 01255 g007
Table 1. Descriptive statistics on agronomic traits of M. sinensis and M. floridulus from 2020.
CH (m)MLL (cm)MLW (cm)SD (mm)BD (cm)TN (no.)BC (cm)MC (%)DBW (kg)L/S
Max1.7135.75.411.9186.4824.0437.257.818.64.3
Min0.541.50.92.632.047.085.09.00.10.8
M. sinensisAVG1.2 *86.5 *2.4 *6.4 *80.0 *230.7 *252.1 *41.24.4 *1.6
(n = 50)SD0.322.40.82.330.6171.883.113.04.00.6
CV27.125.934.935.538.374.533.031.591.339.3
Max2.5140.35.713.5292.3783.0849.762.729.78.3
Min0.985.50.95.942.323.0100.010.70.90.9
M. floridulusAVG1.7 *118.1 *3.3 *9.6 *164.1 *339.5 *439.2 *47.011.2 *1.9
(n = 50)SD0.412.30.81.660.0166.7168.38.97.11.11
CV21.610.424.116.336.649.138.318.963.158.3
Note: CH—canopy height, MLL—maximum leaf length, MLW—maximum leaf weight, SD—stem diameter, BD—base diameter, TN—tiller number, BC—base circumference, MC—moisture content, DBW—dry biomass weight, and L/S—leaf/stem ratio. Asterisks indicate significant differences within representative clones for each agronomic trait at the p < 0.01 level.
Table 2. Extra Trees model performance and hyper parameters.
Train MSETrain RMSETrain MAETrain MAPETrain R2Test MSETest RMSETest MAETest MAPETest R2Number of the EstimatorsMax Depth of Tree
CNC0.5370.7330.5670.0490.8951.0881.0430.9460.0900.70023060
MCC1.9071.3811.0590.0490.8774.4292.1041.7090.0720.67623050
Disclaimer/Publisher’s Note: The statements, opinions and data contained in all publications are solely those of the individual author(s) and contributor(s) and not of MDPI and/or the editor(s). MDPI and/or the editor(s) disclaim responsibility for any injury to people or property resulting from any ideas, methods, instructions or products referred to in the content.