Article

Comprehensive Evaluation of Apple Germplasm Genetic Diversity on the Basis of 26 Phenotypic Traits

1
Key Laboratory of Special Fruits and Vegetables Cultivation Physiology and Germplasm Resources Utilization, College of Agriculture, Shihezi University, Xinjiang Production and Construction Corps, Shihezi 832000, China
2
Key Laboratory of Horticultural Crops Germplasm Resources Utilization, Research Institute of Pomology, Chinese Academy of Agricultural Sciences, Ministry of Agriculture and Rural Affairs, Xingcheng 125100, China
*
Authors to whom correspondence should be addressed.
Agronomy 2024, 14(6), 1264; https://doi.org/10.3390/agronomy14061264
Submission received: 9 May 2024 / Revised: 6 June 2024 / Accepted: 7 June 2024 / Published: 12 June 2024
(This article belongs to the Collection Genetic Diversity Evaluation of the Fruit Trees)

Abstract

:
We used 256 apple germplasm resources for a thorough examination of the genetic diversity associated with 26 phenotypic traits (i.e., genetic diversity analysis, cluster analysis, correlation analysis, principal component analysis, and membership function). The average coefficient of variation for 12 morphological traits was 66.39% (21.10–201.5%). The coefficient of variation was highest and lowest for the fruit arris and the width of the eye basin, respectively. Additionally, the diversity index ranged from 0.54 to 1.33. Moreover, the coefficient of variation for 14 numerical traits varied from 5.37% to 50%. The titratable acid content had the highest coefficient of variation, with a diversity index ranging from 2.01 to 2.08 (average of 2.045). A cluster analysis categorized 256 germplasms into four groups, among which Group I included germplasms with large fruits and the best comprehensive performance. Of the top 10 principal components revealed by the principal component analysis, principal component 1 was mainly related to fruit size and flavor. The top 10 germplasms were selected on the basis of comprehensive scores using the membership function method. Furthermore, a stepwise regression analysis identified 15 key traits for identifying apple germplasms, including the vegetative growth day, fruit weight, and the firmness of the fruit without skin. These results can serve as the foundation for future analyses of the phenotypic diversity of apple germplasms, while also providing a theoretical basis for screening, characterizing, and further improving excellent apple germplasms.

1. Introduction

The apple tree (Malus × domestica Borkh.), which is the largest deciduous fruit tree species in China, produces fruits that are rich in sugar, vitamin C, polyphenols, and other elements and nutrients, with a delicate, fragrant, crisp, and sweet taste that is popular among consumers [1,2]. Apple fruit cultivation is a key industry in rural China, where the apple cultivation area and fruit yield account for half of the global totals; the main apple-producing regions include Liaoning, Shandong, and Shanxi [3]. Germplasm resources form the basis of scientific research and agricultural production. An analysis of germplasm genetic diversity can reveal underlying mechanisms and genetic structures [4,5].
The genetic diversity of apple germplasm resources is currently primarily being investigated using DNA molecular markers based on Southern blot detection, polymerase chain reaction amplification technology, and high-throughput sequencing technology [6]. Molecular marker technology can reveal the genetic diversity of species relatively accurately, but it is ultimately necessary to combine it with phenotypic analyses of germplasm resources. Phenotypic traits are influenced by both genetic factors and environmental conditions during long-term natural selection. They can provide a simpler and more comprehensive and intuitive display of the basic characteristics of germplasm resources [7]. Zhang et al. [8] used 160 Xinjiang wild apple germplasm resources from the Tianshan area of Ili (China) to evaluate 14 phenotypic traits. They revealed a rich genetic diversity that was associated with the differences in most traits. Moreover, they divided the examined germplasm materials into six groups according to phenotypic traits. Ganopoulos et al. [9] used 19 apple varieties from Greece to investigate 47 phenotypic traits on the basis of principal component analysis (PCA) and cluster analysis, which divided the cultivars into four main groups. Their results showed that apple groups with the same characteristics may be useful for achieving specific breeding goals. Tang et al. [10] examined 12 fruit quality indices in 11 apple varieties introduced from the Ili River Valley by calculating the coefficient of variation (CV) and conducting correlation, cluster, and factor analyses. On the basis of their factor analysis, they extracted the first five main factors according to phenotypic traits, while their cluster analysis divided 11 apple varieties into four groups. Combined with the above results, the 12 fruit quality indices were simplified to the fruit weight (FW), soluble solids content (SSC), calcium content, fruit firmness, and total acid content. Although previous studies have been conducted on the genetic diversity of apple phenotypic traits, few studies have systematically analyzed the genetic diversity associated with phenotypic traits and comprehensively evaluated the apple germplasm to identify excellent apple germplasm resources.
Over time, as people’s living standards have continued to improve, our requirements for apple varieties have become increasingly high, prompting evolution in the industry, with a transition from being yield-orientated to quality-orientated. However, the production of single cultivars and varieties of poor fruit quality have become constraints on the industry’s bottleneck problem. Modern cultivated apple varieties are mainly concentrated in eight backbone parents, with a narrow genetic base [11,12,13,14]. Therefore, a core set derived from the evaluation of a large number of germplasm resources could not only accelerate genetic diversity for crop improvement, but also be of important significance in efficient breeding programs.
In this study, 256 apple germplasm resources collected and preserved in the National Germplasm Repository of Apple and Pear Resources (Xingcheng, Liaoning, China) were used to analyze genetic diversity related to 26 phenotypic traits and to screen for excellent germplasm resources via a thorough evaluation of phenotypic traits (i.e., cluster analysis, correlation analysis, PCA, and membership function). The results of this study provide the theoretical basis for future exploration and innovation in excellent apple germplasm resources.

2. Materials and Methods

2.1. Plant Materials

The 256 apple germplasms used in this study, which were preserved in the National Germplasm Repository of Apple and Pear (Xingcheng), are cultivars, of which 203 were introduced to China from overseas and 53 were selected cultivars originating in China (Table S1). This study was conducted from 2022 to 2023.

2.2. Data Collection

Samples were collected during the fruit-ripening period. More specifically, 20 fruits free from pests, diseases, and mechanical damage were randomly selected at the periphery of the tree canopy (and picked from different directions) [15]. For each apple germplasm, fruits were collected at physiological maturity, when seeds had turned completely black [16]. A survey was conducted to examine the following 12 morphological traits: wax, fruit powder (FP), fruit core (FC), fruit over color (FOC), fruit ground color (FGC), flesh texture (FT), fruit arris (FA), the depth of the stalk cavity (DSC), the width of the stalk cavity (WSC), the russet amount in the stalk cavity (RASC), the depth of the eye basin (DEB), and the width of the eye basin (WEB). Following the method of Kumar et al. [17], the sensory evaluation of all these traits was conducted by trained assessors with the ability to accurately identify the sensory attributes of the fruit. The morphological trait classification standards are listed in Table 1.
The following 14 numerical traits were also analyzed: FW, fruit firmness without skin (FFWS), fruit shape index (FSI), SSC, titratable acid content (TAC), number of days of fruit growth (NDFG), vegetative growth day (VGD), sprouting ratio (SR), one-year-old shoot length (OYOSL), one-year-old internode length (OYOIL), one-year-old shoot thickness (OYOST), leaf length (LL), leaf width (LW), and petiole length (PL). The FW was measured using an EL3002 electronic balance. The FFWS was determined using a GY-4 durometer (Shanghai Shandu Co., Shanghai, China), and the results were expressed as kg/cm2. The SSC was measured from a flesh sample with an ATAGO digital refractometer (Guangzhou ATAGO Scientific Instrument Co., Ltd, Guangzhou, China). Following the method of Goeltz et al. [18], the TAC was determined using acid–base titration neutralization with a 905 Titrando automatic potentiometric titrator. The FSI, OYOSL, OYOIL, OYOST, LL, LW, and PL were measured and calculated using a steel tape and a vernier caliper. The analysis of each trait (except for NDFG and VGD) was repeated 10 times, after which the data were averaged. The survey standards for the above-mentioned 26 traits were determined in accordance with the requirements of the Apple Germplasm Resource Description Specification and Data Standard [19].

2.3. Data Analysis

2.3.1. Phenotypic Trait Diversity Analysis

Phenotypic trait data were sorted and analyzed using Microsoft Excel 2021 software (version number: 16.0.15128.20240) to calculate the distribution percentage, mean value (X), maximum value, minimum value, standard deviation (σ), CV, and genetic diversity index, as well as to plot histograms of frequency distributions. The following formula was used to determine the degree of dispersion of the phenotypic trait data: CV (%) = (σ/X) × 100.
The genetic diversity of apple germplasm resources was expressed as the Shannon–Wiener genetic diversity index (H′), which was calculated using the following formula, as described by Niu et al. [20]: H′ = −ΣPi × InPi. For morphological traits, Pi represented the frequency of the occurrence of the i-th trait type materials. The numerical traits were divided into 10 levels according to the X and σ of each phenotypic trait, from level 1 [Xi < (X − 2σ)] to level 10 [Xi ≥ (X + 2σ)], with every 0.5σ considered as a level. Pi represented the frequency of the distribution of the material within the i-th level of the traits, whereas In was the natural logarithm. Pearson correlation analysis of apple germplasm phenotypic traits was conducted using Origin Pro 2021. Systematic cluster analysis of apple germplasm phenotypic traits was conducted using ggtree in R 4.3.2. Euclidean distances were calculated by the hclust function in the ggtree package, and unweighted pair-groupmethod with arithmetic means (UPGMA) was chosen for clustering [21]. The final results of the systematic clustering analysis were visualized and presented through the ggplot package.

2.3.2. Comprehensive Evaluation of Phenotypic Traits

PCA and stepwise regression analyses were performed using IBM SPSS Statistics 26.0 [22]. As described by Xu et al. [23], the original phenotypic data were standardized and the phenotypic trait function values were defined in the interval [0, 1] according to a fuzzy membership function method. The following equation was used:
Uij = (Xij − Xjmin)/(Xjmax − Xjmin)
where Uij is the membership function value, Xij is the j-th index measurement value of the i-th variety, and Xjmin and Xjmax represent the minimum and maximum values of material j, respectively [5].
According to the method of Rao et al. [24], the standardized traits were analyzed via PCA, and the F value function expression was constructed using the eigenvector and eigenvalue of PCA. The standardized phenotypic data were multiplied by the corresponding principal component factor score coefficient. Additionally, the principal component F value (Fn) of each germplasm resource was calculated. Next, the contribution rate of principal component factors was used as weight (Vn) to obtain the comprehensive F total value,
Ftotal = V1F1 + V2F2 +…+ VnFn
which was followed by comprehensive evaluation and the identification of excellent germplasms. Finally, key evaluation indices were screened using a stepwise regression equation [25].

3. Results

3.1. Diversity Analysis of Morphological Traits in Apple Germplasm Resources

Analysis of the diversity in 12 morphological traits among 256 apple germplasm resources (Table 2) revealed differences in the frequencies of phenotypic traits, reflecting different degrees of diversity. According to the trait distribution percentage, the common traits among the germplasm resources were as follows: no wax, no FP, medium FC, strong red FOC, yellow–green FGC, crisp FT, no FA, deep DSC, medium WSC, little RASC, shallow DEB, and deep WEB. In addition, the morphological trait CVs ranged from 21.10% to 201.5%, with a mean of 66.39%. Of the analyzed traits, FA and WEB had the highest and lowest CVs, respectively. The genetic diversity associated with phenotypic traits was evaluated according to the diversity index, which ranged from 0.54 (FP) to 1.33 (FOC) among the 256 apple germplasm resources. The diversity index was greater than 1 for the FOC, DSC, WSC, and RASC, indicative of high genetic diversity.

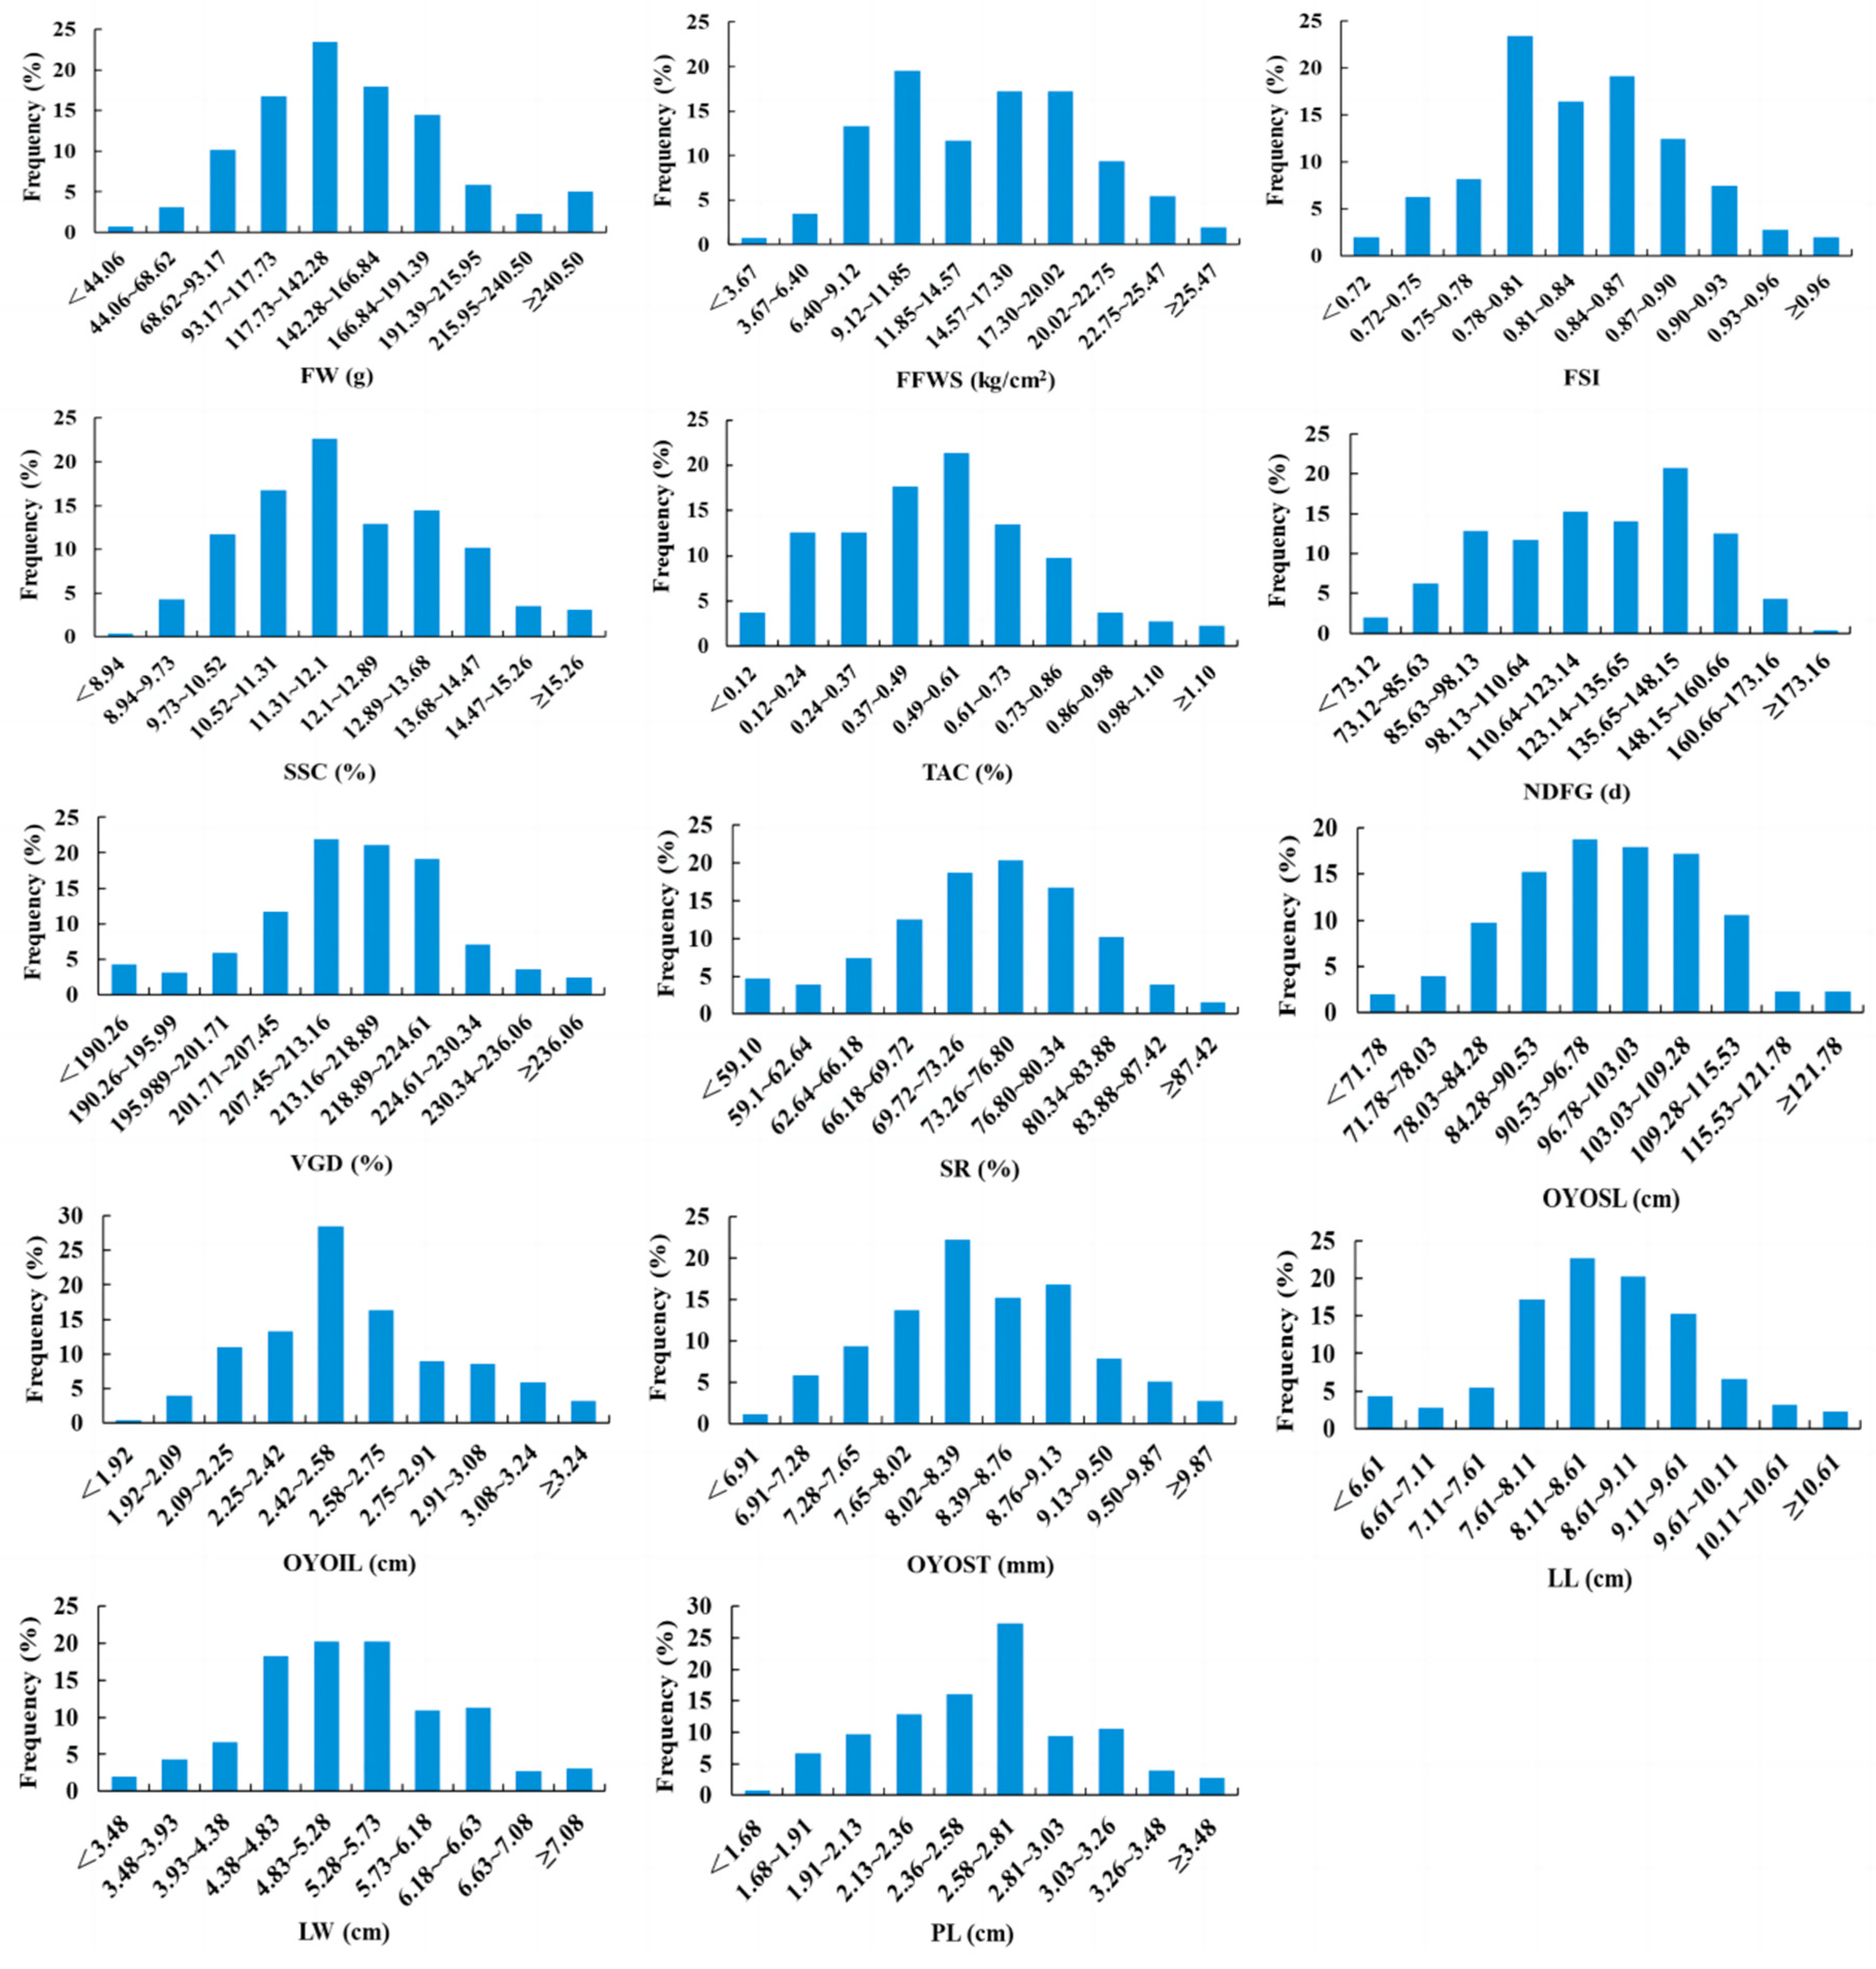
3.2. Diversity Analysis of Numerical Traits in Apple Germplasm Resources

Figure 1 presents the frequency distribution of numerical traits. Notably, the numerical traits of 14 apple germplasm resources basically showed a normal distribution. Specifically, the OYOIL ranged from 2.42 to 2.58 cm, and the maximum number of copies was 73, with a frequency distribution of 28.52%. The PL ranged from 2.58 to 2.81 cm, and the maximum number of copies was 70, with a frequency distribution of 27.34%. The FW and FSI ranged from 117.73 to 142.28 g and from 0.78 to 0.81, respectively, and the maximum number of copies was 60, with a frequency distribution of 23.44%.
The results of the diversity analysis of the numerical traits of apple germplasm resources are presented in Table 3. There were considerable differences in the degree of dispersion of the phenotypic trait data, with CVs ranging from 5.37% to 50%. The phenotypic trait with the highest CV was the TAC, and the phenotype with the lowest CV was the VGD. In addition, the diversity index of the numerical traits ranged from 2.01 to 2.08, with a mean of 2.045. The traits with the highest diversity index were the NDFG, SR, and OYOST, whereas the traits with the lowest diversity index were the FW and OYOIL, but the diversity index exceeded 2 for all traits.

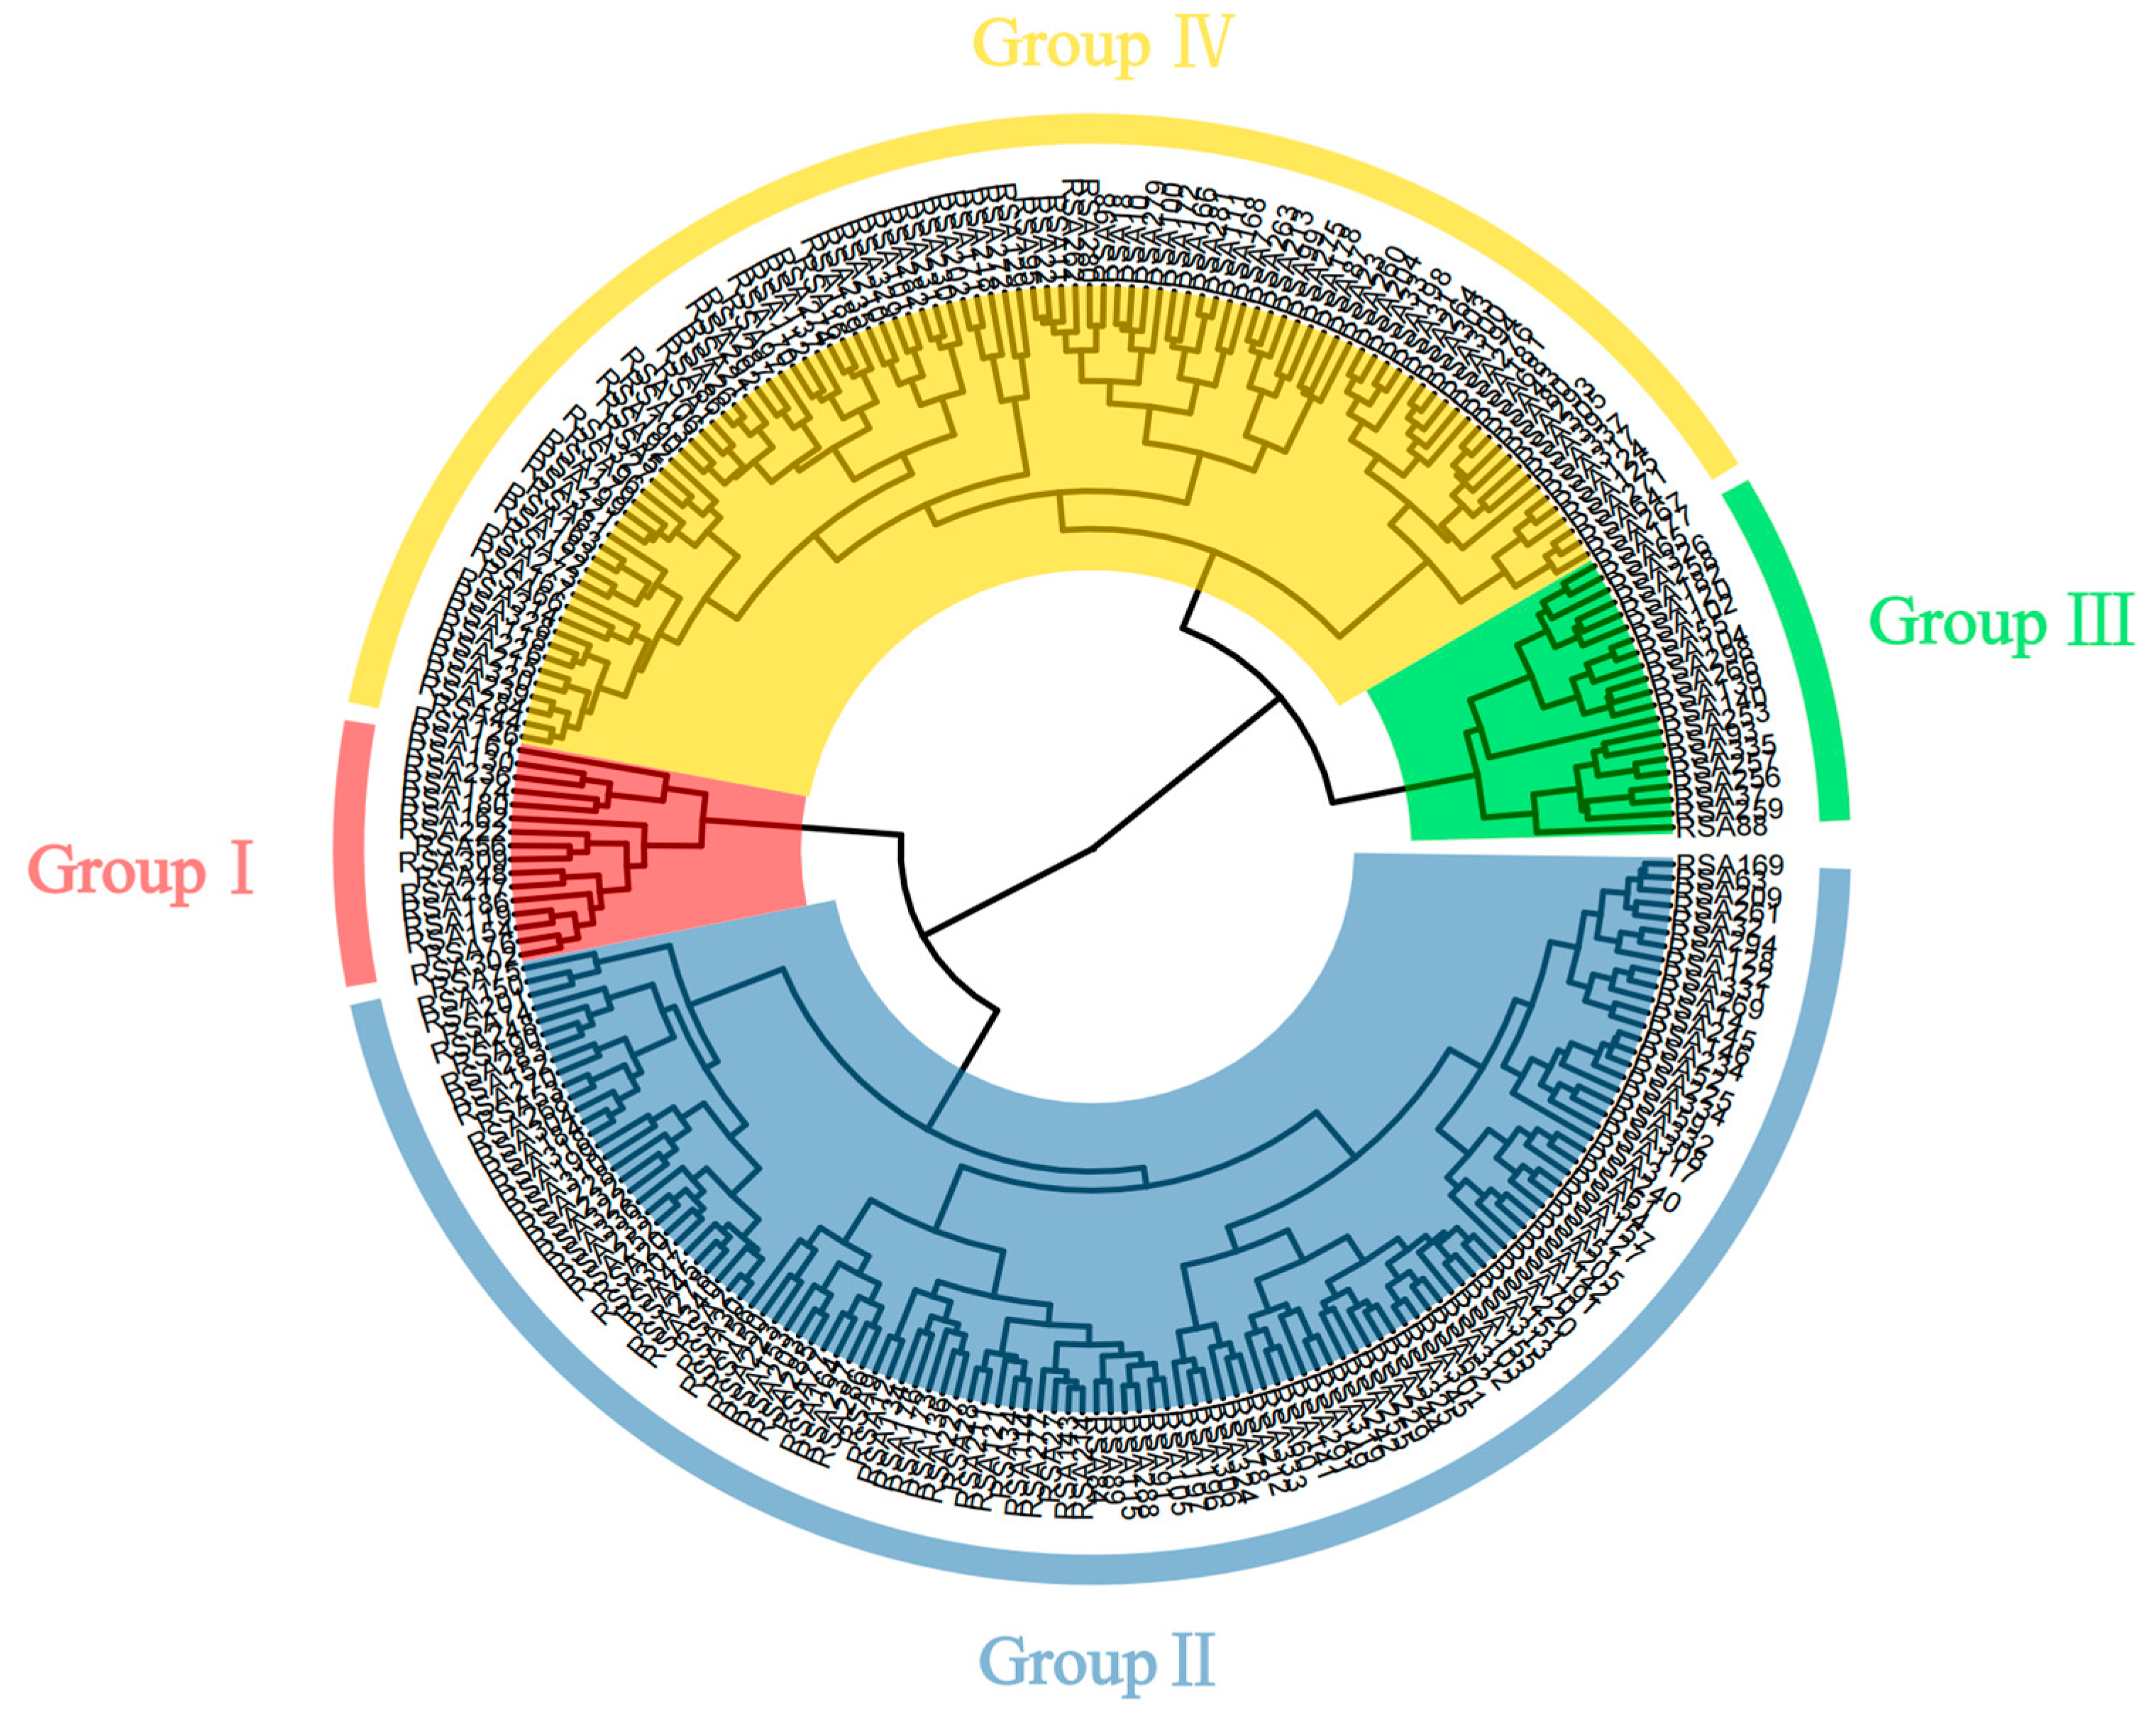
3.3. Cluster Analysis of Phenotypic Traits in Apple Germplasm Resources

The apple germplasm resources were clustered on the basis of 26 phenotypic traits. As presented in Figure 2, 256 germplasm resources were divided into four groups, and the mean value of each group was statistically analyzed (Table 4). Group I contained 16 apple accessions, accounting for 6.25% of the germplasm resources. The primary features of this group included high FW and SSC values, which were significantly higher than the corresponding values in Groups II, III, and IV. Additional common characteristics in Group I were as follows: a low TAC, high SR, long OYOSL, long PL, and pronounced FA. Group II contained 120 apple accessions, accounting for 46.88% of the germplasm resources. The primary characteristics of this group included a low TAC (average of 0.45%).
Furthermore, the mean NDFG and VGD values were 130.43 and 216.38, respectively, which were higher than the corresponding values in Groups I, III, and IV. In addition, the fruits produced by the accessions in this group were characterized by an intense red FOC, deep DSC, medium DEB, and medium WEB. Group III comprised 21 apple germplasms, accounting for 8.20% of the germplasm resources. The main characteristics of this group were a low FW, short OYOSL, long OYOIL, shallow DEB, and deep WEB. Group IV contained 99 apple germplasms, accounting for 38.67% of the germplasm resources. This group was characterized by a medium FW, high FFWS, low SSC, high TAC, thick OYOST, and deep DSC, and wax on the fruit surface.

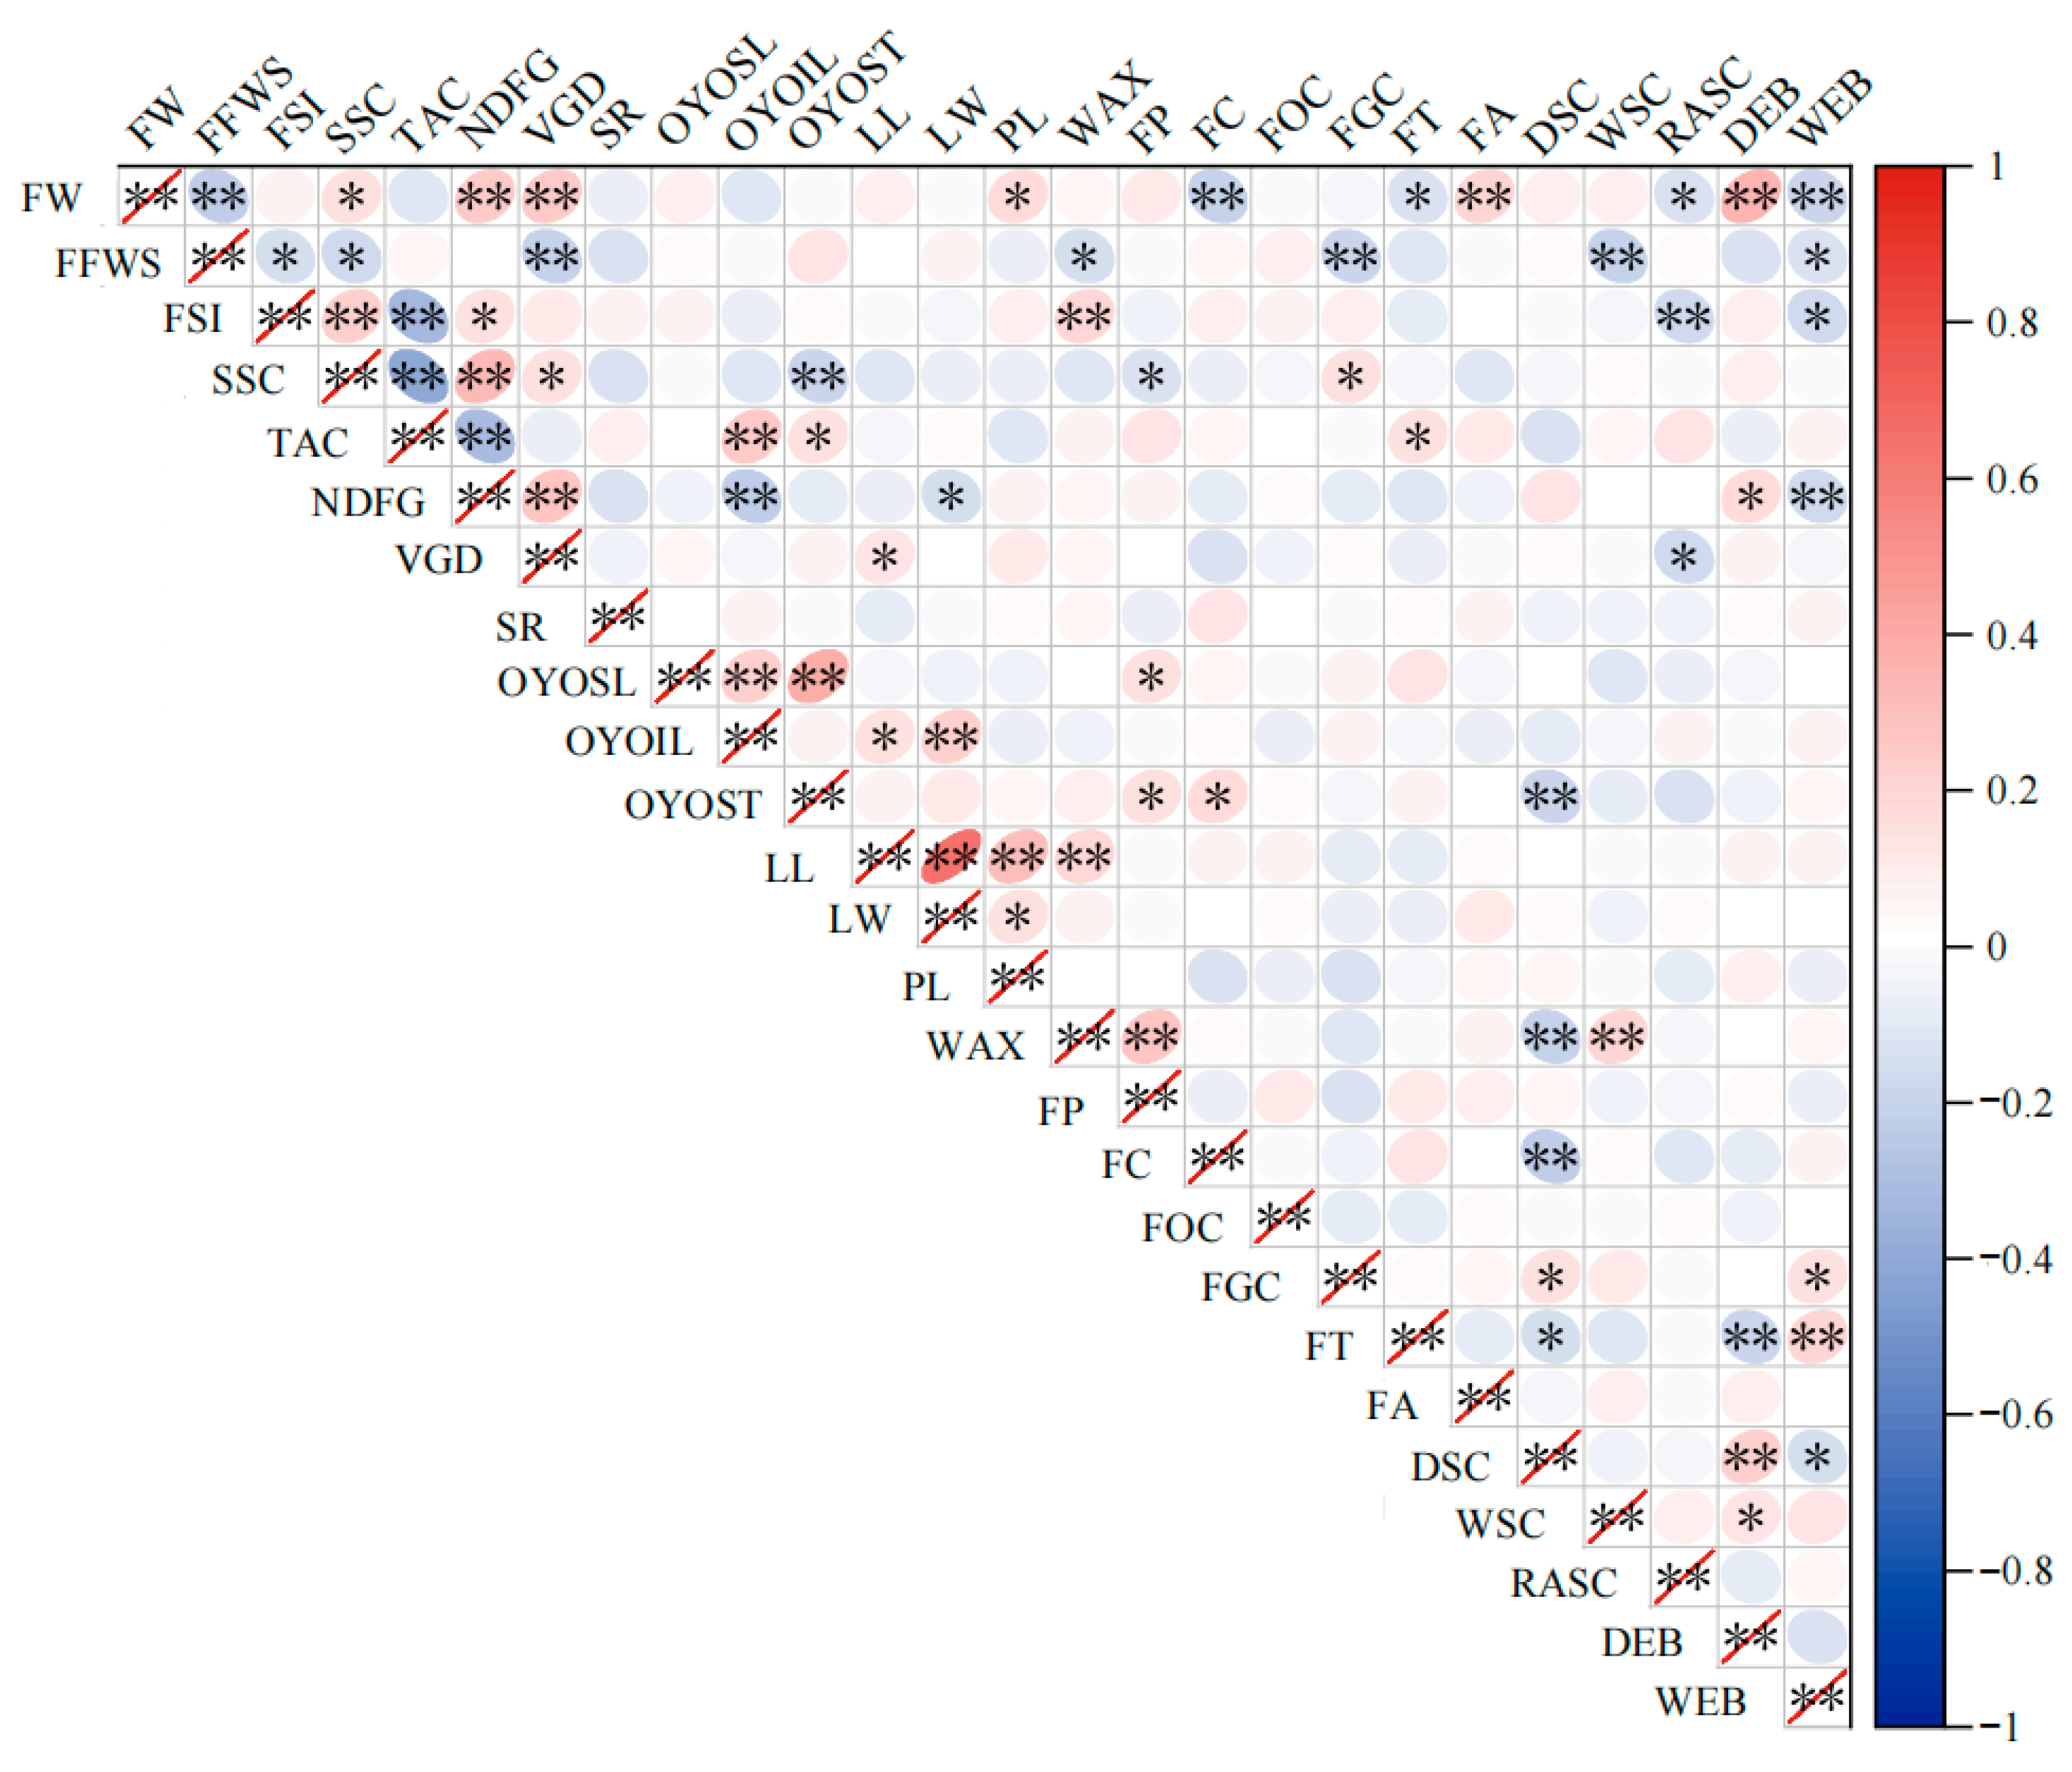
3.4. Correlation Analysis of Phenotypic Traits in Apple Germplasm Resources

The results of the correlation analysis of the phenotypic traits of 256 apple germplasm resources are provided in Figure 3. There were varying correlations among the 26 phenotypic traits. For example, the FW was significantly positively correlated with the SSC and PL, highly significantly positively correlated with the NDFG, VGD, FA, and DEB, and highly significantly negatively correlated with the FFWS, FC, and WEB, which were highly correlated. Moreover, the FFWS was significantly negatively correlated with the FSI, SSC, WAX, and WEB, but highly significantly negatively correlated with the VGD, FGC, and WSC. Furthermore, the FSI was highly significantly positively correlated with the SSC and WAX, but highly significantly negatively correlated with the TAC and RASC.
In addition, the SSC was highly significantly negatively correlated with the TAC (a correlation coefficient of −0.42), highly significantly positively correlated with the NDFG (a correlation coefficient of 0.33), and significantly positively correlated with the VGD and FGC (a correlation coefficient of 0.16 and 0.14, respectively). The TAC was significantly positively correlated with the OYOIL, OYOST, and FT, whereas the OYOSL was highly significantly positively correlated with the OYOIL and OYOST (a correlation coefficient of 0.23 and 0.38, respectively). Significant correlations were also detected among the LL, LW, and PL, with the LL highly significantly positively correlated with the LW and PL (a correlation coefficient of 0.65 and 0.32, respectively).

3.5. Principal Component Analysis of Phenotypic Traits in Apple Germplasm Resources

The above-mentioned 26 phenotypic traits were included in the PCA of apple germplasm resources (Table 5). The results showed that the cumulative variance contribution rate of the top 10 principal components was 61.168%. The eigenvalue of principal component 1 was 2.719, with a contribution rate of 10.456%, and the main traits in the corresponding eigenvectors were the FW, FSI, SSC, NDFG, VGD, and DEB. Additionally, the TAC had a high negative load, indicating that the principal component was mainly related to fruit quality traits. The eigenvalue of principal component 2 was 2.126, with a contribution rate of 8.175%; the LL, LW, and PL were the main traits, suggesting that principal component 2 was related to leaf traits. The eigenvalue of principal component 3 was 1.758, with a contribution rate of 6.761%; the FFWS and FT (high load) were the main traits of principal component 3. The eigenvalue of principal component 4 was 1.682, with a contribution rate of 6.468%; the main traits of principal component 4 were the WSC and WEB. In contrast, the traits associated with principal components 5 and 6 were the FP, OYOSL, OYOIL, FGC, and DSC, whereas the main traits associated with principal components 7, 8, 9, and 10 were the RASC, FA, and SR.

3.6. Comprehensive Evaluation of the Phenotypic Traits of Apple Germplasm Resources and Identification of Excellent Germplasms

Comprehensive Evaluation of the Phenotypic Traits of Apple Germplasm Resources

According to the eigenvalues and the load matrix of 10 principal components, eigenvectors were calculated and used as the weight coefficients of each trait index in each principal component. The phenotypic traits of apple germplasm resources were standardized according to a membership function method. On the basis of the weight coefficient of each trait in each principal component and the standardized phenotypic data, the functional expression of each principal component score was obtained. Using the first principal component as an example, the linear equation of the principal component was as follows:
F1 = 0.34U1 − 0.16U2 + 0.24U3 + 0.33U4 − 0.36U5 + 0.38U6 + 0.24U7 − 0.10U8 − 0.08U9 − 0.23U10 − 0.18U11 − 0.02U12
0.10U13 + 0.13U14 + 0U15 − 0.02U16 − 0.19U17 − 0.01U18 + 0.04U19 − 0.19U20 + 0.01U21 + 0.19U22 + 0.06U23 − 0.11U24 +
0.27U25 − 0.19U26
The ratio of the variance contribution rate of each principal component to the cumulative variance contribution rate of the extracted principal components was selected as the weight coefficient. For principal components 1 to 10 (F1–F10), the weight coefficients were 0.1709, 0.1336, 0.1105, 0.1057, 0.0999, 0.0922, 0.0814, 0.0755, 0.0656, and 0.0646, respectively. Using a mathematical model, the following comprehensive score equation was obtained:
Ftotal = 0.1709F1 + 0.1336F2 + 0.1105F3 + 0.1057F4 + 0.0999F5 + 0.0922F6 + 0.0814F7 + 0.0755F8 + 0.0656F9 + 0.0646F10.
The Ftotal value of each material was calculated and used to comprehensively evaluate the phenotypic traits of 256 apple germplasm resources to preliminarily screen for the germplasm resources with the best comprehensive performance. The Ftotal value varied from 1.30 to −1.50, and the mean value was slightly greater than 0.
Table 6 lists the top 10 Ftotal values for the phenotypic traits of 256 apple germplasm resources. These 10 germplasm resources had the composite phenotypic traits with the best performance. Hence, they could be used as candidate resources for the selection of excellent varieties.

3.7. Regression Model Establishment and Identification of Key Indices

Analysis of the correlation between the comprehensive F value and 26 phenotypic traits (Table 7) showed that 17 phenotypic traits (the FW, WAX, FP, FSI, SSC, FOC, FGC, NDFG, VGD, FA, DSC, OYOSL, WSC, DEB, LL, LW, and PL) had significant or extremely significant positive correlations with the comprehensive F value. Five phenotypic traits (the FFWS, FC, TAC, FT, and SR) were significantly or extremely significantly negatively correlated with the comprehensive F value. In contrast, the OYOIL, RASC, OYOST, and WEB were not significantly correlated with the comprehensive F value.
A stepwise regression equation was established using the comprehensive F value as the dependent variable (Y) and 26 phenotypic traits as the independent variable (X) to screen for the key evaluation indices of apple phenotypic traits. The optimal stepwise regression equation was as follows:
Y = −6.526 + 0.018X7 + 0.002X1 − 0.024X2 + 0.052X25 + 0.214X16 − 0.076X17 + 0.061X23 + 0.090X12 + 0.105X19 +
0.006X9 + 0.002X6 + 0.156X21 + 0.041X4 + 0.128X15 + 0.030X22
In the equation, X7, X1, X2, X25, X16, X17, X23, X12, X19, X9, X6, X21, X4, X15, and X22 represent the VGD, FW, FFWS, DEB, FP, FC, WSC, LL, FGC, OYOSL, NDFG, FA, SSC, WAX, and DSC, respectively. The correlation coefficient (R = 0.989) and coefficient of determination (R2 = 0.978) of the equation indicated that these 15 phenotypic traits may account for 97.8% of the total variance in the F value of the comprehensive score. In addition, the F value was 584.592 (p < 0.01). Because the regression equation was highly significant, these 15 phenotypic traits could be used as the key evaluation indices of the phenotypic traits of apple germplasm resources.

4. Discussion

4.1. Genetic Diversity Associated with the Phenotypic Traits of Apple Germplasm Resources

The genetic diversity of germplasm resources is critical in breeding. By analyzing the genetic diversity related to the phenotypic traits of germplasm resources, the richness of germplasm diversity can be determined intuitively and the extent of genetic variation can be revealed relatively quickly [26,27]. In this study, we analyzed genetic diversity related to 12 morphological traits and 14 numerical traits of 256 apple germplasm resources. There were 36 variant types of morphological traits, with CVs ranging from 21.10% to 201.5%. The CVs, which can reflect the variation range of phenotypic traits [28,29], showed that the dispersion degree was highest for the FA among the examined morphological traits of apple germplasm resources. The Shannon–Wiener genetic diversity index can also reflect phenotypic trait diversity [30]. The mean genetic diversity index of the analyzed morphological traits was 0.87, ranging from 0.54 (the FP) to 1.33 (the FOC). There was no obvious correlation between the CV and the diversity index, which is consistent with the findings of an earlier study [31].
The numerical traits of apple germplasm resources showed an essentially normal distribution, with a relatively broad distribution range, suggestive of extensive genetic diversity. The CV was highest for the TAC (50%), followed by the FFWS (37.41%) and the FW (34.52%). These results were in accordance with the findings of a study by Zhang et al. [8]. Analysis of the diversity of 14 phenotypic traits of 160 wild apple germplasm resources showed that the CVs for the fruit firmness and the FW were large, at 38.44% and 38.28%, respectively. Zhang et al. [5] investigated the diversity of 11 numerical traits of 570 pear germplasm resources, and the results also showed that the CV for the TAC was the highest. These results were related to the obvious genetic differences among the TAC, FW, and FFWS. In addition, the diversity index was greater than 2 for all numerical traits in 256 apple germplasm resources, indicative of extensive genetic variation. Therefore, excellent germplasm resources could be screened using a statistical evaluation method.
Earlier research showed that a cluster analysis, which involved a multivariate statistical method, could classify similarly characterized germplasms on the basis of phenotypic traits [32]. In the current study, 256 apple germplasm resources were categorized into four distinct groups following a cluster analysis. Group I stood out for its large FW and high SSC, showcasing superior traits compared to Groups II, III, and IV. This group exhibited an optimal performance and a high utilization value. In addition, Groups III and IV were characterized by a small FW, short OYOIL, high TAC, and thick OYOST, respectively, making them valuable as characteristic germplasms. The phenotypic traits of germplasm resources in each group were unique and had the potential to fulfill specific breeding objectives. The classification results can provide valuable insights and serve as a reference and selection basis for various breeding objectives.
Correlation analyses can reveal the degree of correlation between traits [33]. In this study, correlation analysis of the phenotypic traits of apple germplasm resources detected significant correlations between several traits. Interestingly, the FW was positively correlated with the NDFG, VGD, FA, and DEB, but negatively correlated with the FFWS, FC, and WEB. Sun et al. [34] analyzed the correlations among the fruit quality traits of 23 apple germplasm resources and found that the FW was negatively correlated with the TAC and the fruit firmness, similar to the results of the current study. However, although we detected a negative correlation between the FW and TAC, it was not significant, which reflects the variability and complexity among different germplasms. Moreover, the SSC was negatively correlated with the TAC, in accordance with the findings of Watts et al. [35].

4.2. Comprehensive Evaluation of Phenotypic Traits and Screening for Key Traits in Apple Germplasm Resources

Principal component analyses transform phenotypic traits into a small number of principal components via dimensionality reduction, thereby clarifying the role of each phenotypic trait in diversity studies [36,37]. The PCA of apple germplasm resources conducted in this study involved 26 phenotypic traits. Using Kaiser’s criterion (eigenvalue > 1) as the standard [38], the first 10 principal components were extracted to represent most of the information. The cumulative variance contribution rate (61.168%) suggested that the variation in each phenotypic trait was complex, with a relatively weak linear relationship. Our PCA revealed that the main contributing traits in the eigenvector corresponding to principal component 1 were the FW, FSI, SSC, NDFG, VGD, and DEB. This indicates that the first principal component was associated with the fruit size, flavor, and growth period. Mir et al. [39] studied genetic variability related to phenotypic traits in 120 apple cultivars; in their PCA, PC1 was represented mainly by the FW and fruit firmness. Furthermore, the PCA condensed the information from the original 26 phenotypic traits into a smaller set of comprehensive traits. In this study, high eigenvector factors, such as the FW, FSI, SSC, NDFG, VGD, DEB, LL, LW, PL, FFWS, FT, WSC, WEB, FP, OYOSL, FGC, OYOIL, DSC, and FA, could be used as the main candidates for apple trait indicators in innovative breeding.
A single indicator and evaluation method can only reflect the performance of a certain trait and cannot effectively reflect the comprehensive performance of horticultural crops under natural conditions. Therefore, it is more reliable to use multiple indicators and methods for the comprehensive evaluation of germplasm resources [40]. In this study, we thoroughly evaluated the phenotypic traits of apple germplasm resources using PCA combined with a membership function method. The 10 best germplasm resources, which were determined according to the comprehensive score F value, included ‘Fuhong’, ‘Red Delicious’, and ‘Huamei’, which should be considered as candidate resources for breeding optimal varieties. Notably, ‘Fuhong’, ‘Weixi’, and ‘Aixian’ were classified into Group I according to the cluster analysis. In addition, stepwise regression equations were established on the basis of standardized phenotypic data and composite F values, to simplify the screening criteria for the phenotypic traits of germplasm resources. The 15 crucial traits were identified from the initial 26 phenotypic traits. These key traits can be used as indices for screening apple germplasm resources. Moreover, most of the main traits in each group identified during the cluster analysis were included among the 15 key traits, highlighting their potential utility in characterizing and selecting apple germplasm resources. To date, scholars within China and internationally have conducted comprehensive evaluations of germplasm resources using the weighted membership function method based on principal component analysis and weight analysis, but most of them have focused on crops [20,23,41]. This approach also has been partially reported in pears [5], wild C. oleifera [40], and Xanthoceras sorbifolium [42].
Phenotypic traits represent the foundation of biological research. However, the results of phenotypic trait analysis can be influenced by subjective factors (human judgment and subjective assessment) and environmental conditions (e.g., the soil quality, temperature, or light) [43]. In addition, phenotypic traits cover only observable characteristics, and some important traits (e.g., tolerance to specific pathogens or nutrient use efficiency) are not directly visible. More importantly, the genetic mechanisms of important traits in apples are complex and regulated by multiple genes, exhibiting an interaction between the genotype and the environment [17]. Relying solely on phenotypic trait analysis does not allow for highly accurate classification and in-depth study. Although there are some disadvantages to the evaluation of phenotypic traits in the germplasm, the phenotype is still an external manifestation of the genotype diversity and represents the most traditional and direct method for identifying germplasm resource diversity. Genomic approaches can analyze the specificity of crops at the DNA level without being affected by the environment, enabling stable inheritance in offspring and allowing direct selection at the molecular level [44,45]. Therefore, genomic methods can be used to supplement the results for phenotypic traits. In this study, we systematically analyzed the genetic diversity related to phenotypic traits and identified excellent apple germplasm resources, effectively revealing the rich diversity and genetic variation in apple germplasm resources. At the same time, the substantial phenotypic data provided herein could be useful in mapping the genes underlying important apple traits, while also serving as an important reference for subsequent molecular-marker-assisted selection in breeding and gene mining.

5. Conclusions

We thoroughly analyzed the genetic diversity associated with 26 phenotypic traits in 256 apple germplasm resources and established a comprehensive evaluation method. The results indicate that the genetic variation in phenotypic traits in apple germplasm resources is rich. On the basis of our cluster analysis, 256 germplasms were divided into four groups, with Group I representing a large-fruited type, exhibiting an optimal performance and a high utilization value. Using a membership function method, the 10 best germplasms were selected according to comprehensive scores and 15 key traits were selected from 26 phenotypic traits through stepwise regression analysis. These key traits can be used as indices for screening apple germplasm resources. In addition, to consider the year effect, the obtained results must be repeated in at least two more years to evaluate the stability of the traits. In conclusion, the comprehensive evaluation of genetic diversity of apple germplasm phenotypic traits has implications regarding the generation of improved varieties, as well as the identification of apple germplasm resources.

Supplementary Materials

The following supporting information can be downloaded at: https://www.mdpi.com/article/10.3390/agronomy14061264/s1, Table S1: Numbering and origin of 256 apple germplasm resources.

Author Contributions

Conceptualization, W.T. and J.F.; methodology, Y.G. and D.W.; software, W.T.; validation, L.W., D.W. and X.L.; formal analysis, G.W. and S.S.; investigation, Z.L. (Zichen Li), L.W., S.S., G.W. and Z.L. (Zhao Liu); resources, K.W.; data curation, S.S., K.W., Z.L. (Zhao Liu) and X.L.; writing—original draft preparation, W.T., Z.L. (Zichen Li), L.W., S.S., G.W. and Z.L. (Zhao Liu); writing—review and editing, D.W., K.W., X.L., J.F. and Y.G.; visualization, W.T. and Z.L. (Zichen Li); supervision, J.F. and Y.G. All authors have read and agreed to the published version of the manuscript.

Funding

This research was funded by the National Key R&D Program of China (No. 2023YFD1200100), the Agricultural Science and Technology Innovation Program (CAAS-ASTIP-2022-RIP-02), and the “Xingliao Talent Program” Project of Liaoning Province (XLYC2203177).

Data Availability Statement

Data are contained within the article.

Conflicts of Interest

The authors declare no conflicts of interest.

References

  1. Song, J.; Amyotte, B.; Yu, C.H.; Campbell-Palmer, L.; Vinqvist-Tymchuk, M.; Rupasingh, H.P. Untargeted metabolomics analysis reveals the biochemical variations of polyphenols in a diverse apple population. Fruit Res. 2023, 3, 29. [Google Scholar] [CrossRef]
  2. Yuan, J.; Wang, Z.; Wang, X.; Zhang, C.; Ma, F.; Li, M. Research advances in genetic quality of sugar content in apples. Fruit Res. 2023, 3, 13. [Google Scholar] [CrossRef]
  3. Chen, X.; Wang, N.; Peng, F.; Mao, Z.; Yin, C.; Jiang, Y.; Ge, S.; Hu, D.; Li, Y.; Du, Y.; et al. Advances in quality and maturity breeding of important deciduous fruit trees in China. Acta Hortic. Sin. 2024, 51, 8–26. [Google Scholar]
  4. Mirheidari, F.; Khadivi, A.; Moradi, Y.; Paryan, S. Phenotypic characterization of Prunus haussknechtii Bornm., P. elaeagnifolia Spach, and P. orientalis Mill. Sci. Hortic. 2020, 265, 109273. [Google Scholar] [CrossRef]
  5. Zhang, Y.; Cao, Y.F.; Huo, H.L.; Xu, J.Y.; Tian, L.M.; Dong, X.G.; Qi, D.; Liu, C. An assessment of the genetic diversity of pear (Pyrus L.) germplasm resources based on the fruit phenotypic traits. J. Integr. Agric. 2022, 21, 2275–2290. [Google Scholar] [CrossRef]
  6. Sun, X.; Jiao, C.; Schwaninger, H.; Chao, C.T.; Ma, Y.; Duan, N.; Khan, A.; Ban, S.; Xu, K.; Cheng, L. Phased diploid genome assemblies and pan-genomes provide insights into the genetic history of apple domestication. Nat. Genet. 2020, 52, 1423–1432. [Google Scholar] [CrossRef] [PubMed]
  7. Boquete, M.T.; Muyle, A.; Alonso, C. Plant epigenetics: Phenotypic and functional diversity beyond the DNA sequence. Am. J. Bot. 2021, 108, 553–558. [Google Scholar] [CrossRef] [PubMed]
  8. Zhang, X.C.; Ren, H.L.; Tang, S.M.; Zhu, L.; Zhang, S.J.; Ren, B. Genetic diversity analysis of phentypic traits in 160 germplasm resources of Malus sieversii (Ledeb.) M.Roem. from Tianshan in Ili. J. Plant Genet. Resour. 2021, 22, 1521–1530. [Google Scholar]
  9. Ganopoulos, I.; Tourvas, N.; Xanthopoulou, A.; Aravanopoulos, F.A.; Avramidou, E.; Zambounis, A.; Tsaftaris, A.; Madesis, P.; Sotiropoulos, T.; Koutinas, N. Phenotypic and molecular characterization of apple (Malus × domestica Borkh) genetic resources in Greece. Sci. Agric. 2018, 75, 509–518. [Google Scholar] [CrossRef]
  10. Tang, J.; Lu, L.; Ma, Y.F.; Tao, J.; Shi, Y. Factor analysis and evaluation index selection of fruit quality of apple varieties. China Fruits 2024, 01, 24–29. [Google Scholar]
  11. Noiton, D.A.; Alspach, P.A. Founding clones, inbreeding, coancestry, and status number of modern apple cultivars. J. Am. Soc. Hortic. Sci. 1996, 5, 773–782. [Google Scholar] [CrossRef]
  12. Ordidge, M.; Kirdwichai, P.; Baksh, M.F.; Venison, E.P.; Gibbings, J.G.; Dunwell, J.M. Genetic analysis of a major international collection of cultivated apple varieties reveals previously unknown historic heteroploid and inbred relationships. PLoS ONE 2018, 13, e020245. [Google Scholar] [CrossRef] [PubMed]
  13. Migicovsky, Z.; Gardner, K.M.; Richards, C.; Chao, C.T.; Schwaninger, H.R.; Fazio, G.; Zhong, G.Y.; Myles, S. Genomic consequences of apple improvement. Hortic. Res. 2021, 8, 9–22. [Google Scholar] [CrossRef] [PubMed]
  14. Minamikawa, M.F.; Kunihisa, M.; Noshita, K.; Moriya, S.; Abe, K.; Hayashi, T.; Katayose, Y.; Matsumoto, T.; Nishitani, C.; Terakami, S.; et al. Tracing founder haplotypes of Japanese apple varieties: Application in genomic prediction and genome-wide association study. Hortic. Res. 2021, 8, 49–63. [Google Scholar] [CrossRef] [PubMed]
  15. Verda, A.; Miguez, J.M.; Gallardo, M. Melatonin stimulates postharvest ripening of apples by up-regulating gene expression of ethylene synthesis enzymes. Postharvest Biol. Technol. 2023, 195, 112113. [Google Scholar] [CrossRef]
  16. Farneti, B.; Di Guardo, M.; Khomenko, I.; Cappellin, L.; Biasioli, F.; Velasco, R.; Costa, F. Genome-wide association study unravels the genetic control of the apple volatilome and its interplay with fruit texture. J. Exp. Bot. 2017, 7, 1467–1478. [Google Scholar] [CrossRef] [PubMed]
  17. Kumar, S.; Molloy, C.; Hunt, M.; Deng, C.H.; Wiedow, C.; Andre, C.; Dare, A.; McGhie, T. GWAS provides new insights into the genetic mechanisms of phytochemicals production and red skin colour in apple. Hortic. Res. 2022, 9, uhac218. [Google Scholar] [CrossRef]
  18. Goeltz, J.C.; Cuevas, L.A. Guided inquiry activity for teaching titration through total titratable Acidity in a general chemistry laboratory course. J. Chem. Educ. 2021, 98, 882–887. [Google Scholar] [CrossRef]
  19. Wang, K.; Liu, F.Z.; Cao, Y.F. Descriptors and Date Standard for Apple (Malus spp. Mill.); China Agriculture Press: Beijing, China, 2005; pp. 13–56. [Google Scholar]
  20. Niu, X.J.; Wang, X.D.; Wang, J.P.; Sun, J.; Qie, Y.M.; Wang, L.N.; Geng, L.G. Genetic diversity and comprehensive evaluation of Sorhum germplasm based on phenotypic traits. J. Plant Genet. Resour. 2024, 1, 1–17. [Google Scholar]
  21. Yu, G.; Smith, D.K.; Zhu, H.; Guan, Y.; Lam, T.T.Y. ggtree: An R package for visualization and annotation of phylogenetic trees with their covariates and other associated data. Methods Ecol. Evol. 2017, 8, 28–36. [Google Scholar] [CrossRef]
  22. Moradi, Y.; Khadivi, A.; Mirheidari, F. Multivariate analysis of oriental apple (Malus orientalis Uglitzk.) based on phenotypic and pomological characterizations. Food Sci. Nutr. 2022, 10, 2532–2541. [Google Scholar] [CrossRef] [PubMed]
  23. Xu, Z.J.; Qi, Y.J.; Xing, X.H.; Tong, F.; Wang, X. Analysis and Evaluation of agronomic and quality traits in Soybean germplasms from Huang-Huai-Hai region. J. Plant Genet. Resour. 2022, 23, 468–480. [Google Scholar]
  24. Rao, Q.L.; Jiang, M.; Liu, X.Y.; Lu, J.W.; Hu, T.H.; Cheng, L.Q.; Wang, J.H.; Wang, J. Genetic diversity and comprehensive evaluation of 296 Peanuts germplasm resources in Guizhou. J. Plant Genet. Resour. 2024, 25, 1–18. [Google Scholar]
  25. Luo, P.S.; Huang, L.J.; Lu, M.Y.; Li, W.Y.; Jiang, J.J.; Wei, Y.; Yan, Z.L.; Zhao, J.; Zhou, J. Fruit traits diversity analysis and comprehensive evaluation of Sterculia monosperma Vent. germplasms. J. Plant Genet. Resour. 2024, 1, 1–12. [Google Scholar]
  26. Liu, D.; Wang, X.; Li, W.; Li, J.; Tan, W.; Xing, W. Genetic Diversity Analysis of the Phenotypic Traits of 215 Sugar Beet Germplasm Resources. Sugar Tech 2022, 24, 1790–1800. [Google Scholar] [CrossRef]
  27. Wang, Y.; Li, Y. Genetic diversity analysis of phenotypic traits among 37 Xanthoceras sorbifolium elite germplasms. J. For. Res. 2022, 27, 140–147. [Google Scholar] [CrossRef]
  28. Alizadeh, K.; Fatholahi, S.; Teixeira Da Silva, J.A. Variation in the fruit characteristics of local pear (Pyrus spp.) in the Northwest of Iran. Genet. Resour. Crop Evol. 2015, 62, 635–641. [Google Scholar] [CrossRef]
  29. Shuaib, M.; Bahadur, S.; Hussain, F. Enumeration of genetic diversity of wild rice through phenotypic trait analysis. Gene Rep. 2020, 21, 100797. [Google Scholar] [CrossRef]
  30. Zargar, S.A.; Wani, A.A.; Saggoo, M. Analysis of phenotypic diversity of apricot (Prunus armeniaca L.) accessions from Jammu and Kashmir, India. Plant Genet. Resour. 2021, 19, 203–215. [Google Scholar] [CrossRef]
  31. Li, Y.; Liu, H.C.; Shi, X.X.; Shi, L.; Han, X.; Liu, J.; Wei, Y.F. Phenotypic diversity analysis of 398 Naked Barley germplasm resources. J. Plant Genet. Resour. 2023, 24, 1311–1320. [Google Scholar]
  32. Mbovora, S.M.; Musvosvi, C.; Gasura, E. Morphological diversity among accessions of apple tree (Malus × Domestica Borkh). Adv. Agric. 2021, 2021, 705856. [Google Scholar] [CrossRef]
  33. Zhou, T.; Ning, K.; Zhang, W.; Chen, H.; Lu, X.; Zhang, D.; El-Kassaby, Y.A.; Bian, J. Phenotypic variation of floral organs in flowering crabapples and its taxonomic significance. BMC Plant Biol. 2021, 21, 503. [Google Scholar]
  34. Sun, S.M.; Gao, Y.; Wang, K.; Wang, D.J.; Li, L.W. Fruit quality analysis of 23 apple germplasm resources. J. Agric. Big Data 2022, 4, 13–19. [Google Scholar]
  35. Watts, S.; Migicovsky, Z.; Mcclure, K.A.; Yu, C.H.; Amyotte, B.; Baker, T.; Bowlby, D.; Burgher-Maclellan, K.; Butler, L.; Donald, R.; et al. Quantifying apple diversity: A phenomic characterization of Canada’s Apple Biodiversity Collection. Plants People Planet 2021, 3, 747–760. [Google Scholar] [CrossRef]
  36. Reig, G.; Blanco, Á.; Castillo, A.M.; Gogorcena, Y.; Moreno, M.Á. Phenotypic diversity of Spanish apple (Malus × domestica Borkh) accessions grown at the vulnerable climatic conditions of the Ebro Valley, Spain. Sci. Hortic. 2015, 185, 200–210. [Google Scholar] [CrossRef]
  37. Debbarma, P.; Hazarika, T. Genetic diversity of Bael [Aegle marmelos (L.) Corr.] accessions from north-east India based on principal component and cluster analysis. Genet. Resour. Crop Evol. 2024, 71, 253–277. [Google Scholar] [CrossRef]
  38. Kaiser, H.F. The varimax criterion for analytic rotation in factor analysis. Psychometrika 1958, 23, 187–200. [Google Scholar] [CrossRef]
  39. Mir, J.; Jan, A.; Rashid, M.; Singh, D.; Raja, W.; Sharma, O.; Sharma, A.; Lal, S.; Kumawat, K.; Nabi, S.U. Genetic variability studies for various morphological and quality traits in apple. Indian J. Hortic. 2020, 77, 227–236. [Google Scholar] [CrossRef]
  40. Chen, T.; Liu, L.; Zhou, Y.; Zheng, Q.; Luo, S.; Xiang, T.; Zhou, L.; Feng, S.; Yang, H.; Ding, C. Characterization and comprehensive evaluation of phenotypic characters in wild Camellia oleifera germplasm for conservation and breeding. Front. Plant Sci. 2023, 14, 1052890. [Google Scholar] [CrossRef]
  41. Zhang, W.; Lu, T.; Zeng, Q.; Wang, Z.; Yang, R.; Zhao, F. Genetic diversity analysis and screening of excellent germplasm of upland cotton resources. J. Plant Genet. Resour. 2024, 1, 1–14. [Google Scholar]
  42. Zhou, C.; Wu, H.; Sheng, Q.; Cao, F.; Zhu, Z. Study on the phenotypic diversity of 33 Ornamental Xanthoceras sorbifolium Cultivars. Plants 2023, 12, 2448. [Google Scholar] [CrossRef] [PubMed]
  43. Luo, Z.; Yao, Z.; Yang, Y.; Wang, Z.; Zou, H.; Fang, B.; Huang, L. Genetic fingerprint construction and genetic diversity analysis of sweet potato (Ipomoea batatas) germplasm resources. BMC Plant Biol. 2023, 23, 355. [Google Scholar] [CrossRef] [PubMed]
  44. Hasan, N.; Choudhary, S.; Naaz, N.; Sharma, N.; Laskar, R.A. Recent advancements in molecular marker-assisted selection and applications in plant breeding programmes. J. Genet. Eng. Biotechnol. 2021, 19, 128. [Google Scholar] [CrossRef] [PubMed]
  45. De Mori, G.; Cipriani, G. Marker-assisted selection in breeding for fruit trait improvement: A review. Int. J. Mol. Sci. 2023, 24, 8984. [Google Scholar] [CrossRef]
Figure 1. Histograms of the frequency distribution of numerical traits.
Agronomy 14 01264 g001
Figure 2. Cluster analysis of 256 apple germplasm resources.
Agronomy 14 01264 g002
Figure 3. Correlation analysis of phenotypic traits in 256 apple germplasm resources. * and ** indicate significant correlations at the 0.05 and 0.01 levels, respectively.
Agronomy 14 01264 g003
Table 1. Morphological traits and classification standards of apple germplasm resources.
TraitsClassification Standard
WaxAbsent = 0; Present = 1
Fruit powderAbsent = 0; Present = 1
Fruit coreSmall = 3; Medium = 5; Large = 7
Fruit over colorRed = 1; Light red = 2; Strong red = 3; Absent = 4
Fruit ground colorGreen = 1; Yellow–green = 2; Yellow = 3; Orange–yellow = 4
Flesh textureCrisp = 1; Spongy = 2; Tough = 3
Fruit arrisAbsent = 0; Present = 1
Depth of stalk cavityShallow = 3; Medium = 5; Deep = 7
Width of stalk cavityNarrow = 3; Medium = 5; Broad = 7
Russet amount on stalk cavityAbsent = 1; Little = 3; Medium = 5; Much = 7
Depth of eye basinShallow = 3; Medium = 5; Deep = 7
Width of eye basinNarrow = 3; Medium = 5; Broad = 7
Table 2. Diversity analysis of morphological traits in apple germplasm resources.
TraitDistribution Percentage (%)CV/%H′
0123457
WAX46.4853.52-----92.590.69
FP77.3422.66-----182.170.54
FC---40.63-46.8812.530.340.98
FOC-17.9722.6640.2319.14--38.011.33
FGC-41.0250.008.200.78--38.700.96
FT-84.3810.165.47---43.470.53
FA79.6920.31-----201.50.51
DSC---23.44-27.3449.2229.491.04
WSC---19.92-53.5226.5626.511.01
RASC-40.23-45.31-13.281.1757.651.05
DEB---57.42-26.1716.4136.200.97
WEB---7.03-57.8135.1621.100.87
FP: fruit powder; FC: fruit core; FOC: fruit over color; FGC: fruit ground color; FT: flesh texture; FA: fruit arris; DSC: depth of the stalk cavity; WSC: width of the stalk cavity; RASC: russet amount on the stalk cavity; DEB: depth of the eye basin; WEB: width of the eye basin. The same applies to the tables below.
Table 3. Diversity analysis of numerical traits in apple germplasm resources.
TraitMeanMaximumMinimumSDCV/%H′
FW (g)142.28290.3028.3049.1134.522.01
FFWS (kg/cm2)14.5728.30.905.4537.412.06
FSI0.841.020.690.067.142.04
SSC (%)12.1016.808.401.5813.062.05
TAC (%)0.521.240.060.2650.002.03
NDFG (d)123.14174.0069.0025.0120.32.08
VGD (d)213.16245.00177.0011.455.372.03
SR (%)73.2690.5055.407.089.662.08
OYOSL (cm)96.78134.7058.9012.5012.922.06
OYOIL (cm)2.583.701.900.3312.792.01
OYOST (mm)8.3910.606.500.748.822.08
LL (cm)8.6111.505.401.0011.612.02
LW (cm)5.288.102.800.9017.052.05
PL (cm)2.583.921.500.4517.442.04
FW: fruit weight; FFWS: fruit firmness without skin; SSC: soluble solids content; TAC: titratable acidity content; NDFG: number of days of fruit growth; VGD: vegetative growth day; SR: sprouting ratio: OYOSL: one-year-old shoot length; OYOIL: one-year-old internode length; OYOST: one-year-old shoot thickness; LL: leaf length; LW: leaf width; PL: petiole length. The same applies to the tables below.
Table 4. Performance of numerical traits in four groups of apple germplasm resources.
GroupIIIIIIIV
FW (g)256.25 a166.3 b65.01 d110.95 c
FFWS (kg/cm2)11.13 c13.72 b14.58 b16.16 a
FSI0.82 a0.84 a0.82 a0.84 a
SSC (%)12.87 a12.31 ab12.31 ab11.66 c
TAC (%)0.50 b0.45 c0.53 ab0.58 a
NDFG (d)123.69 b130.43 a112.29 c116.06 c
VGD (d)213.25 ab216.38 a208.24 c210.28 bc
SR (%)71.03 a73.33 a71.60 a73.88 a
OYOSL (cm)98.83 a97.28 a91.04 b97.20 a
OYOIL (cm)2.59 a2.54 a2.63 a2.63 a
OYOST (mm)8.39 ab8.33 b8.35 ab8.47 a
LL (cm)8.39 a8.69 a8.73 a8.52 a
LW (cm)5.04 b5.24 ab5.51 a5.31 ab
PL (cm)2.54 ab2.65 a2.39 b2.55 ab
Data are presented as the mean, with different lowercase letters in the same row indicating significant differences (p ˂ 0.05). The same applies to the table below.
Table 5. Principal component analysis of the phenotypic traits of 256 apple germplasm resources.
TraitsPrincipal Components
12345678910
FW (g)0.5530.3330.121−0.0010.3380.1660.021−0.0190.045−0.191
FFWS (kg/cm2)−0.269−0.045−0.482−0.507−0.083−0.063−0.0970.1720.092−0.237
FSI0.3970.0560.359−0.103−0.339−0.133−0.3760.149−0.0150.277
SSC (%)0.542−0.2900.1470.098−0.3450.0110.2190.229−0.018−0.018
TAC (%)−0.5890.1270.0140.1040.4670.1180.010−0.045−0.133−0.083
NDFG (d)0.623−0.0520.010−0.2440.025−0.1690.2250.105−0.092−0.039
VGD (d)0.3960.2410.2500.003−0.0640.1510.298−0.119−0.065−0.103
SR (%)−0.1700.0100.2140.1400.003−0.004−0.522−0.305−0.2110.353
OYOSL (cm)−0.1310.1330.416−0.379−0.0300.4990.0610.258−0.0130.049
OYOIL (cm)−0.3760.2160.0040.169−0.1340.4440.0080.299−0.4270.102
OYOST (mm)−0.2950.3420.373−0.403−0.0580.1710.0190.1470.139−0.232
LL (cm)−0.0410.747−0.2180.189−0.365−0.0650.1580.0200.0810.045
LW (cm)−0.1580.658−0.3020.189−0.3540.0290.0600.1020.0680.073
PL (cm)0.2140.460−0.0990.017−0.124−0.0400.044−0.4840.0280.008
WAX−0.0020.3850.3800.0680.199−0.4760.0490.140−0.1840.187
FP−0.0350.2700.182−0.3450.499−0.0600.2300.0530.0520.315
FC−0.317−0.0130.303−0.085−0.320−0.245−0.3140.070−0.017−0.282
FOC−0.0230.071−0.106−0.2060.065−0.252−0.0880.3550.4010.416
FGC0.060−0.2310.2070.401−0.0890.455−0.0770.1850.3320.083
FT−0.310−0.1740.357−0.052−0.0300.0300.361−0.4030.1530.127
FA0.0140.2560.0350.1650.337−0.030−0.3390.0270.457−0.210
DSC0.320−0.027−0.399−0.0230.1520.434−0.116−0.0790.1610.273
WSC0.1060.0380.1600.5300.266−0.238−0.0130.300−0.025−0.263
RASC−0.189−0.160−0.3000.2380.174−0.1260.2820.318−0.1650.187
DEB0.4480.232−0.0370.1410.2460.215−0.2680.064−0.162−0.073
WEB−0.315−0.0730.2530.432−0.117−0.0250.27−0.0270.3520.052
Eigenvalue2.7192.1261.7581.6821.591.4671.2951.2011.0441.028
Contribution rate (%)10.4568.1756.7616.4686.1145.6444.984.6184.0163.953
Cumulative contribution rate (%)10.45618.63225.39331.86137.97543.61948.59953.21757.23361.186
Table 6. Comprehensive scores of the top 10 phenotypic traits in 256 apple germplasm resources.
Germplasm NumberPrincipal Component ScoreScoresRanking
PCA1PCA2PCA3PCA4PCA5PCA6PCA7PCA8PCA9PCA10
Fuhong3.710.253.101.890.830.71−1.14−0.340.840.041.301
Red Delicious1.372.723.74−1.461.901.23−1.191.351.37−0.371.232
Huamei0.821.183.132.291.261.06−0.59−0.110.96−0.211.103
Weixi3.10−0.854.87−0.63−1.891.881.660.791.28−1.791.034
Lvguang1.353.003.56−1.40−0.69−0.651.430.071.470.881.025
Beni Shogun3.04−0.482.600.42−0.981.550.830.360.120.480.976
Aixian0.902.840.73−0.293.42−0.30−0.690.170.550.030.897
Dailv0.633.941.501.91−0.95−1.000.61−0.130.71−0.480.878
Anweii Spurdei2.350.34−0.07−0.081.240.001.480.250.971.150.839
Qingxiang3.471.170.76−0.17−1.17−1.361.060.960.610.320.7910
Table 7. Correlations between the comprehensive F value and 26 phenotypic traits.
TraitCorrelation CoefficientTraitCorrelation Coefficient
FW0.71 **WAX0.36 **
FFWS−0.51 **FP0.27 **
FSI0.26 **FC−0.33 **
SSC0.38 **FOC0.132 *
TAC−0.25 **FGC0.28 **
NDFG0.41 **FT−0.14 *
VGD0.69 **FA0.21 **
SR−0.13 *DSC0.30 **
OYOSL0.27 **WSC0.25 **
OYOIL−0.036RASC−0.081
OYOST0.037DEB0.53 **
LL0.30 **WEB0.034
LW0.182 *
PL0.27 **
* and ** indicate significant correlations at the 0.05 and 0.01 levels, respectively.
Disclaimer/Publisher’s Note: The statements, opinions and data contained in all publications are solely those of the individual author(s) and contributor(s) and not of MDPI and/or the editor(s). MDPI and/or the editor(s) disclaim responsibility for any injury to people or property resulting from any ideas, methods, instructions or products referred to in the content.

