Article

Elemental Analysis of Five Medicinal Plants Species Growing in North Ossetia Using Neutron Activation Analysis

1
Department of Anatomy, Physiology and Botany, Faculty of Chemistry, Biology and Biotechnology, The North Ossetian State University of K.L. Khetagurov, 44-46 Vatutina Str., 362025 Vladikavkaz, Russia
2
Joint Institute for Nuclear Research, Joliot-Curie 6, 141980 Dubna, Russia
3
Faculty of Informatics and Control Systems, Georgian Technical University, 77 Merab Kostava Street, 0171 Tbilisi, Georgia
4
Komarov Botanical Institute of RAS (BIN), 2 Professor Popov Str., 197376 Saint Petersburg, Russia
5
Horia Hulubei National Institute for R&D in Physics and Nuclear Engineering, 30 Reactorului Str., 077125 Bucharest, Romania
*
Author to whom correspondence should be addressed.
Agronomy 2024, 14(6), 1269; https://doi.org/10.3390/agronomy14061269
Submission received: 8 May 2024 / Revised: 2 June 2024 / Accepted: 10 June 2024 / Published: 12 June 2024
(This article belongs to the Section Horticultural and Floricultural Crops)

Abstract

:
One important category of traditional remedies is medicinal plants, which are widely consumed by the population and often subjected to contamination. For the first time, the elemental composition of five wild medicinal plants traditionally consumed in the Republic North Ossetia—brook-mint (Mentha longifolia), oregano (Origanum vulgare), St. John’s wort (Hypеricum perforаtum), thyme (Thymus daghestanicus), and fireweed (Chamaenerion angustifolium)—and corresponding soil samples was determined. This investigation aimed to assess the degree of toxic element accumulation in plants and the possible toxic effect of the analyzed plants on human health. The analysis encompassed the quantification of 36 major and minor elements in soil samples, alongside the detection of 23 elements in plant samples using instrumental neutron activation analysis. According to contamination and enrichment factors, which were calculated in order to assess the level of soil pollution, elements such as As, Sb, Zn, and U in soil may originate from both geogenic and anthropogenic sources. In all plant samples, the most abundant major elements were K and Ca and their content ranged from 9870 to 49,500 mg·kg−1 and 5400 to 20,000 mg·kg−1, respectively, while among the microelements, Fe (54–2080 mg·kg−1) and Mn (27.8–190 mg·kg−1) can be highlighted as the most abundant. The transfer factor was calculated to estimate metal uptake from soil in plants. The highest values of the transfer factor were obtained for Mo, K, Ca, and Zn. The daily intake of metals and the health risk index were calculated to assess the safety of the collected plants. The health risk index was below the threshold for all plants suggesting a probable non-carcinogenic effect. Principal component analysis and linear discriminant analysis were used as classification techniques. The principal component analysis allowed us to define the main groups of elements and associate them with their sources of origin, while discriminant analysis enabled us to discriminate plant samples by species.

1. Introduction

After thousands of years of use as traditional folk remedies, medicinal plants have become more and more significant in the food and cosmetic industries, the production of essential oils and pharmaceuticals, and environmental remediation [1,2,3,4]. According to the World Health Organization (WHO), 80% of the population of low- and middle-income countries relies on traditional medicines, mostly plant drugs, for their primary healthcare needs [5]. Compared to synthetic drug medicine, traditional medicine is more widely accepted by the communities it serves, more reasonably priced, and more easily accessible [6]. In recent years, the use of medicinal plants has acquired a renewed interest in developed countries, mainly due to changes in lifestyle, which enhances the concept of real and natural products and the availability of a large number of studies on herbal medicines [7].
In spite of the widespread increase in pressure on the environment and pollution of environmental compartments with xenobiotics, the primary source of plants frequently used in natural medicine continues to be the collection of plant material from natural habitats [8]. Since some of the elements in medicinal plants are closely related to the essential set of elements in living organisms, plants can be considered an important source of their accumulation in the human body. It is also important to mention that trace elements are essential for higher plants, and in humans, only trace amounts are acceptable [1]; in recent years, the number of studies performed in different countries has increased, in which it was shown that some plants contain high levels of potentially toxic elements [4,5,9,10,11,12,13]. For these reasons, it is important to control the level of potentially toxic elements in medicinal plants in order to assess their safety [14,15].
The process of accumulation of chemicals in plants is influenced by many factors, including soil physico-chemical properties, climatic conditions, agricultural practice, the proximity of mining and industrial areas, and the chemical composition of water and soil [1,12,14]. Since the main parts of medicinal plants are vascular, the uptake of elements from soil can be considered one of the main ways of accumulation [1]. Therefore, determining the composition of soil and assessing its contamination are critically important for understanding the effect of pollutants on plants.
The aim of this study was to investigate the elemental composition of five medicinal plant species collected from the territory of the Republic of North Ossetia, which has a high concentration of mining and metallurgical industry objects, and corresponding soil samples using instrumental neutron activation analysis. The hypotheses being tested are (1) whether plants collected from sites with high levels of potentially toxic elements in soils are contaminated with elevated concentrations of selected trace elements, causing a risk for their use for medicinal purposes and (2) whether statistical techniques allow us to discriminate plants by species based on their elemental composition.
This study is a continuation of research in the field of studying the accumulation of elements by medicinal and essential oil plants [2,15,16,17,18].

2. Materials and Methods
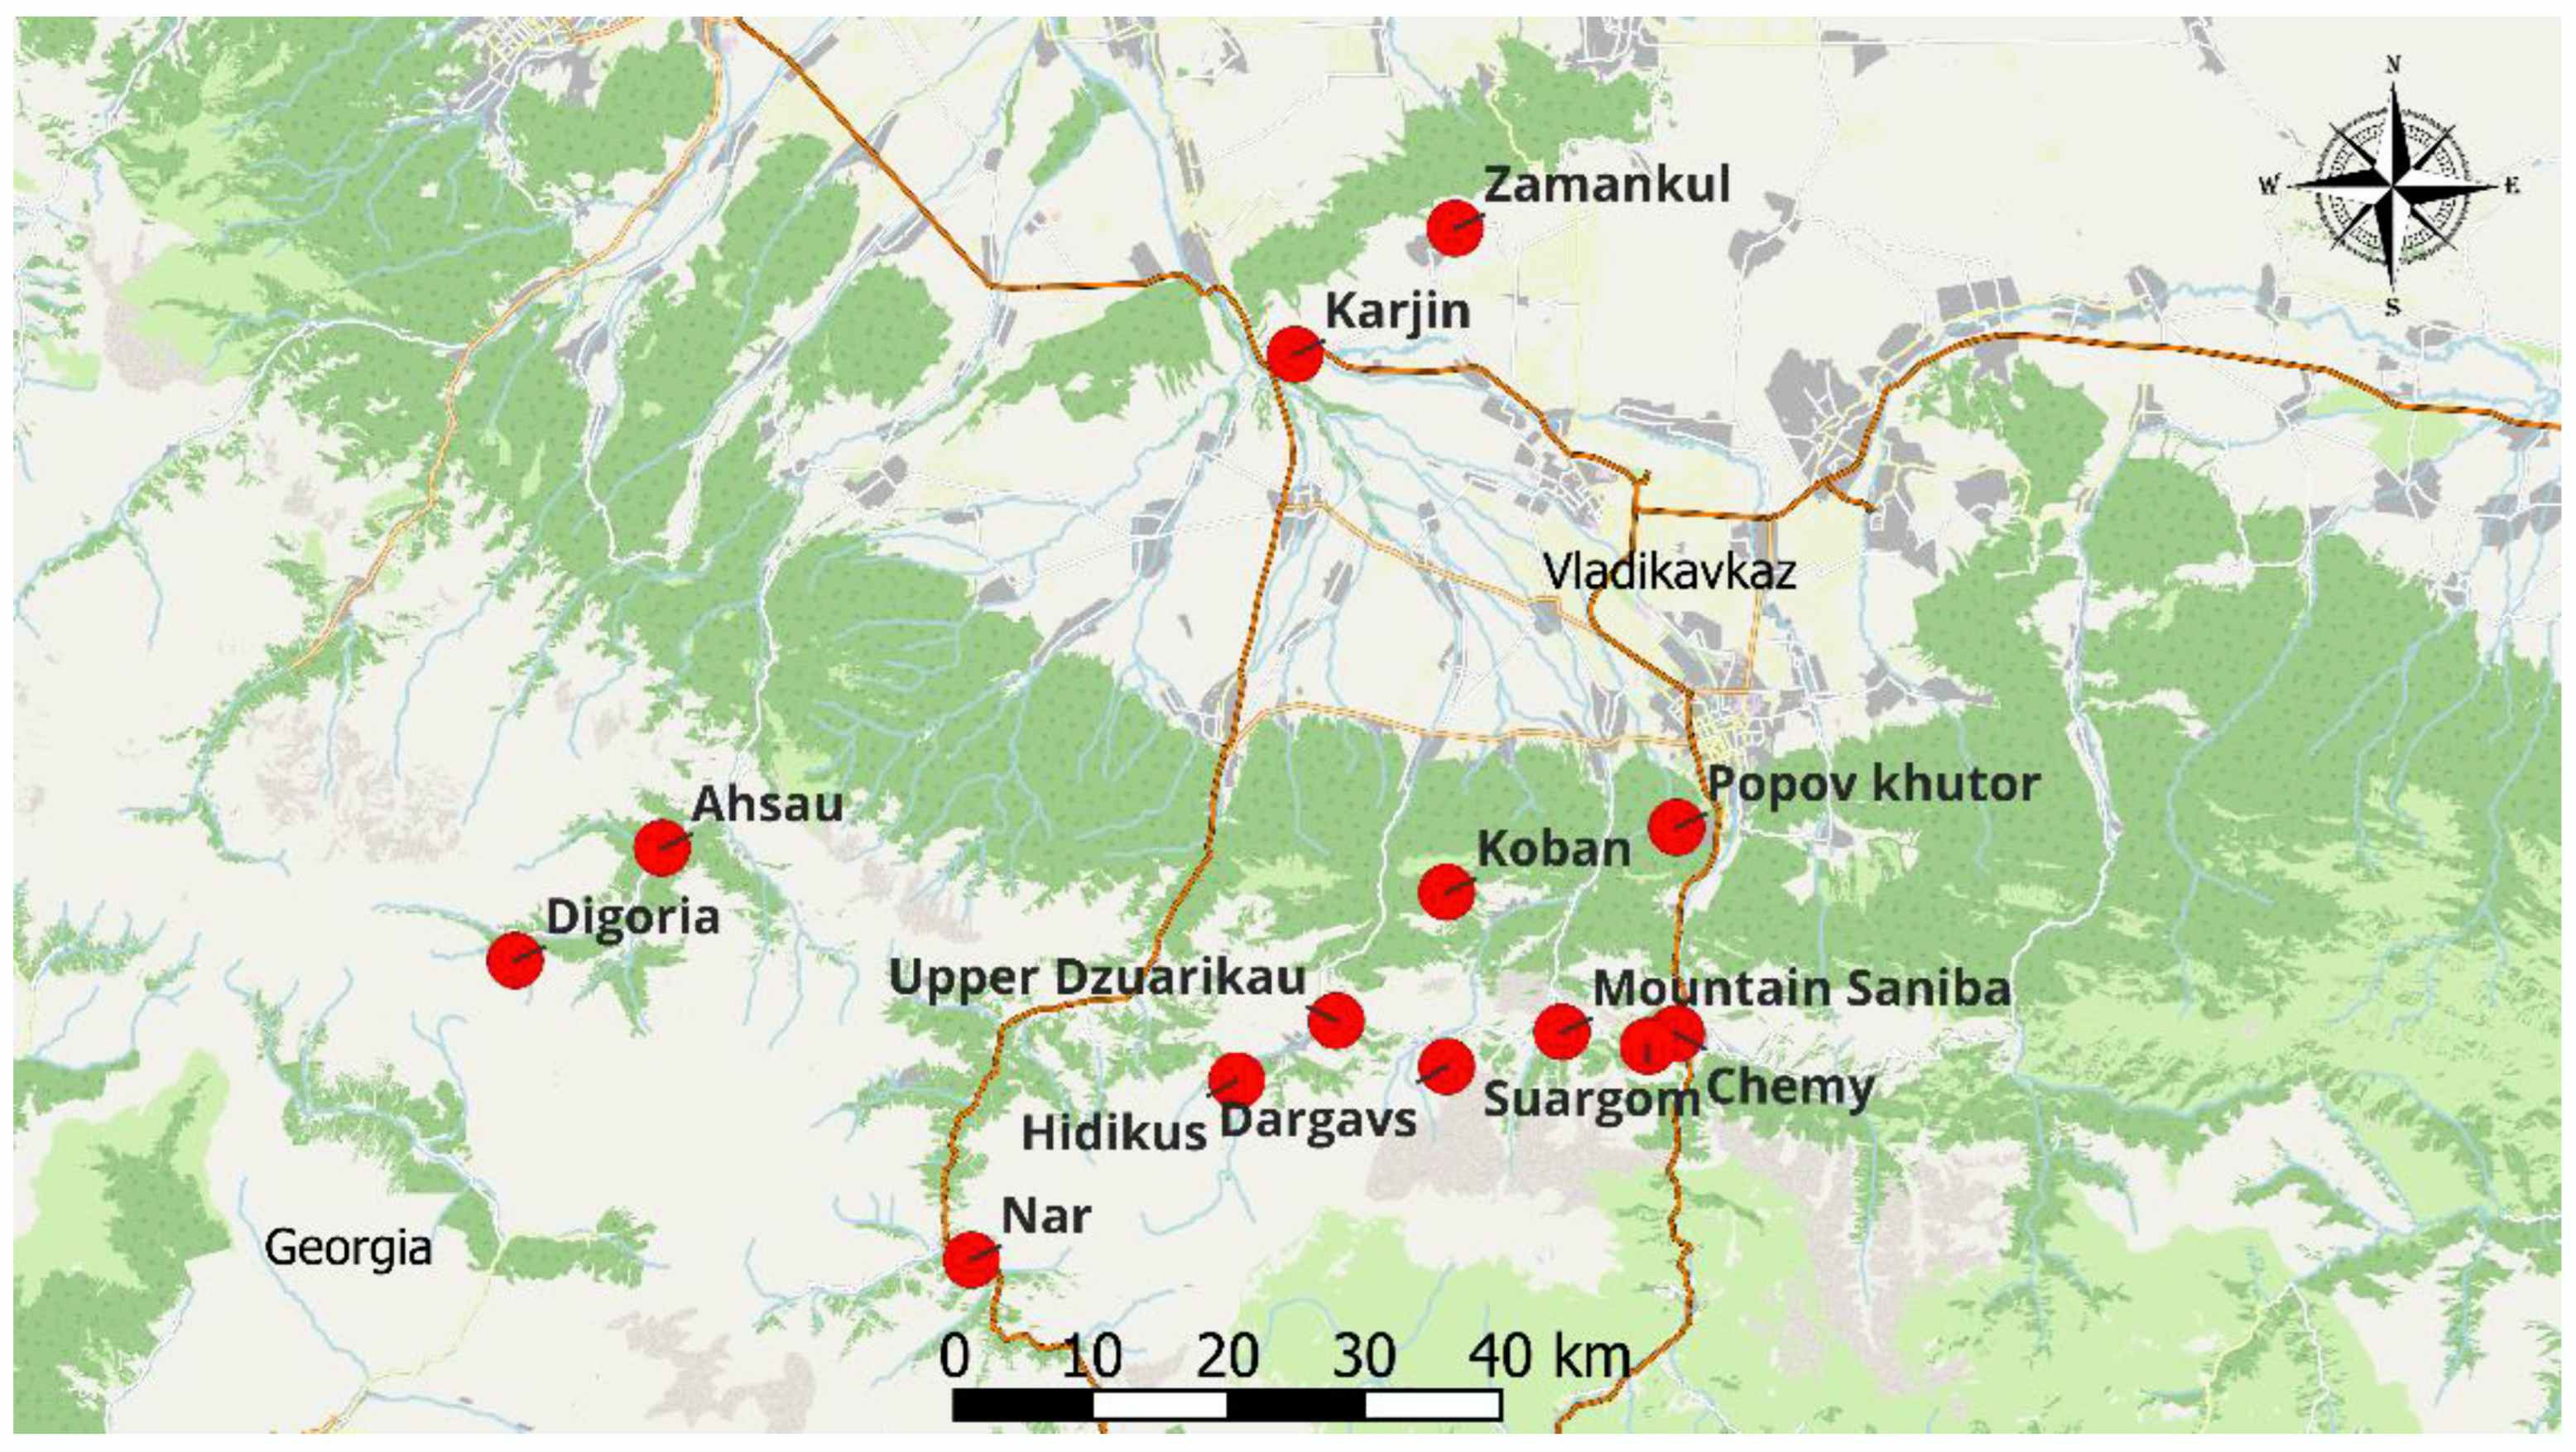
2.1. Sampling

For the experiment, wild medicinal plants of the following species were collected at different sites in the Republic of North Ossetia (Figure 1): the Lamiaceae (Labiatae) family—Mentha longifolia (L.) Huds., Origanum vulgare L. and Thymus daghestanicus Klokov & Des.-Shost., the Hypericaceae family—Hypеricum perforаtum, and Chamaenerion angustifolium (L.) Scop. from the Onagraceae family. The plant species chosen for the study are medicinal plants that are widely used in scientific and folk medicine. Polar plants are used by the population as aromatic additives to dishes and tea drinks. Fireweed is used as a food plant, and in spring, young shoots are used in salads; in summer, during the flowering period, leaves and flowers are collected to prepare a tea surrogate. More information about sampling sites is presented in Table 1.
Sampling sites were located in non-urbanized areas at a distance of at least 300 m from highways, villages, and enterprises, at least 100 m from country roads and individual buildings, and at least 200 m from villages. For research, the aerial parts of plants (lat. Herba) were collected at the stage of mass flowering. Plants were harvested in dry weather between 10 a.m. and 5 p.m. Raw materials were only collected from healthy, well-developed plants not damaged by insects or microorganisms. Associated soil samples were collected in close proximity to the plants, at a depth of 10 to 20 cm to avoid environmental contamination of the topsoil.
The soil samples were first dried at room temperature and then sifted through a 2 mm sieve. The roots were separated from the plant, the plants were washed under running water and again with distilled water, and then they were dried and stored in plastic bags.
For neutron activation analysis, all samples were dried at 40 °C to a constant weight, and subsamples of approximately 0.3 g for vegetation and 0.1 g for soil were packed in polyethylene foil bags for short-term irradiation and in aluminum cups for long-term irradiation.

2.2. Neutron Activation Analysis

The elemental composition of plants and soils was determined using neutron activation analysis at the IBR-2 reactor (Dubna, Russia). More details about sample irradiation and analysis can be found in [1,15,18,19].
The concentrations of elements based on short-lived radionuclides—Al, Mg, Cl, Ca, Ti, V, and Mn—were determined by the irradiation of plant material for 3 min and soils for 1 min at a thermal neutron flux of 1.1 × 10¹² n cm−2 s−1 and immediate measurement after irradiation for 15 min. To determine the content of elements with long-lived isotopes—Na, K, Sc, Cr, Fe, Co, Ni, Zn, As, Br, Rb, Sr, Mo, Sb, Se, Cs, Ba, La, Ce, Sm, Eu, Hf, Nd, Ta, Tb, W, Yb, Zr, Th, and U—the cadmium-screened Channel 1 was used. Samples were irradiated for 4 days at a neutron flux of 1.8 × 10¹¹ n cm−2 s−1. Gamma spectra of induced activity were obtained after 4 and 20 days using three Canberra HPGe detectors with an efficiency of 40–55% and resolution of 1.8–2.0 keV at a 1332 keV 60Co total absorption peak. The analysis of the spectra was performed using the Genie2000 software (version 4.0) by Canberra, with peak-fitting verification in interactive mode. Calculation of the concentration was carried out using the software “Concentration” (version 13.0) developed in FLNP.
More information about sample irradiation and quality control can be found in our previously performed studies [19].

2.3. Data Evaluation

2.3.1. Contamination and Enrichment Factors

Since the presence of some toxic elements in soil in high concentrations could be related to anthropogenic activity, the Contamination factor (CF) and Enrichment factor (EF) were calculated according to Equations (1) and (2):
C F = C M C B
where CM is the measured content of the metal at any given site and Cb is the background level for that metal [20].
The contamination factor is categorized as follows: CF < 1 no contamination; 1–2 suspected; 2–3.5 slight; 3.5–8 moderate; 8–27 severe; and >27 extreme [21].
E F = M x S c b M b S c x
where Mx and Scx are the soil sample concentrations of the metal and Sc, while Mb and Scb are their background concentrations. Upper continental concentrations were used as reference values [22].
The EF for each trace metal could be categorized into five levels of pollution. EF < 2 represents zero or minimal enrichment, suggestive of zero or minimal pollution; 2 ≤ EF < 5 indicates moderate pollution; 5 ≤ EF < 20 indicates significant pollution; 20  ≤ EF < 40 indicates strong pollution; and EF ≥ 40 indicates extreme pollution [23].

2.3.2. Transfer Factor

The soil–plant transfer factor is defined as the ratio between the element concentration in the plant and its concentration in the soil (Equation (3)):
T F = C p l a n t C s o i l
where Cplant is the concentration of an element in the plant material (dry weight basis) and Csoil is the total concentration of the same element in the soil (dry weight basis) where the plant was grown. Higher TF values (≥1) indicate a higher absorption of metal from the soil by the plant, while TF values < 1 indicate the poor response of plants towards metal absorption [24].

2.3.3. Daily Intake of Metal

The daily intake of metal (DIM) was evaluated using Equation (4):
D I M = C S I R E F E D e B W A T 1000
where Cb is the element concentration, mg kg−1; IR is the ingestion rate, 100 mg/day; EF is the exposure frequency, 350 days/year; ED is the exposure duration over years, 30 years; BW is the body weight of the exposed individual, 70 kg; and AT is the time period over which the dose is averaged in days, 350 × 70 [25].

2.3.4. Health Risk Index (HRI)

HRI, defined as the ratio between exposure and the reference oral dose (RfD), was calculated for Zn, Ni, As, and Sb according to Formula (5).
H R I = D I M R f D
where DIM is the daily intake of plants, kg/day; RfD denotes the oral reference dose for the element (mg kg−1 of body weight/day). The RfD values for Zn, Ni, As, and Sb were 0.3, 0.02, 0.0003, and 0.003 mg/kg/day, respectively [26].

2.4. Statistical Analysis

Origin software, developed by OriginLab (Origin Systems, Inc., Austin, TX, USA), has been utilized to maintain descriptive statistics and generate visualizations because of its capability to handle complex datasets and its user-friendly interface that facilitates the creation of high-quality graphs and charts necessary for interpreting data. In the field of multivariate data analysis, the R programming language stands out as a robust tool, featuring numerous packages that streamline the processes of discriminant analysis and principal component analysis. Specifically, the MASS, factoextra (version 1.0.7), and FactoMineR (version 2.10) packages have been employed.
The MASS package (version 7.3-60), part of R’s base distribution, offers a comprehensive set of statistical tools, including discriminant analysis. FactoMineR, specialized for multivariate exploratory data analysis, is particularly favored for its ease of use and comprehensive documentation, facilitating PCA and other analyses. Factoextra simplifies the extraction and visualization of multivariate data analysis outputs, including PCA, making it easier to interpret the results.
This LDA (Linear Discriminant Analysis) provides a solid foundation for understanding the relationship between various chemical elements, their association with different species, and the ability to visualize the classification boundaries. It is a crucial step in the analysis of complex datasets where the goal is to distinguish between groups based on measurable characteristics. By applying LDA, patterns and relationships can be revealed that might otherwise remain hidden, leading to more informed decisions and hypotheses about the underlying phenomena.
Principal Component Analysis (PCA), on the other hand, is a widely recognized technique for reducing the dimensionality of large datasets, while retaining the essential structure of the data. Its primary advantage lies in its ability to transform a large set of variables into a smaller one that still contains most of the information present in the high-dimensional space. This transformation makes PCA an excellent tool for visualizing high-dimensional data in lower dimensions, thereby simplifying the interpretation of complex datasets.

3. Results and Discussion

3.1. Elements Content in Medicinal Plants

The multi-elemental capability of NAA was employed for the determination of 23 elements in plant material, and the level of other elements was below the NAA detection limit. The basic statistics for analyzed plants are presented in Table 2 and Table 3. The obtained results were also compared with values introduced by Markert et al. [27] for the Reference Plant (RP).
In brook-mint, the mean content of elements changed in the following order: K > Ca > Mg > Al > Fe > Na > Sr > Mn > Zn > Ba > Rb > Ni > Mo > V > La > Co > As > Sc > Th > Cs > Sm > Sb > U (Table 2). The most abundant elements were K and Ca and their content ranged from 19,400 to 49,500 mg kg−1 and 13,700 to 20,000 mg kg−1, respectively. The highest content of K was determined in brook-mint from Mountain Saniba, while that of Ca was observed in brook-mint from Zamankul. The content of Na varied from 134 mg kg−1 (Darvags) to 545 mg kg−1 (Ahsau), while that of Mg varied from 2967 mg kg−1 (Darvags) to 4529 mg kg−1 (Popov khutor). The mean content of all major elements in brook-mint was higher compared to values reported for the RP.
Micronutrients such as Fe, Mn, Zn, Co, and Mo are constitutive elements with specific functions in plant metabolism [19]. The presence of these elements makes the analyzed plants important candidates for organism supplementation with essential microelements after preparing infusions. Among the microelements, Fe was the most abundant (Table 3), followed by Mn, Zn, Mo, and Co. The highest content of Fe was determined in brook-mint collected in Popov khutor, while the highest was found in the plants collected in Ahsau. Manganese (Mn) and Zn levels were lowest in plants collected in Darvags, while the highest values of both elements, as well as Mo, were detected in plants collected in Popov khutor (Table 2). Cobalt content in plants ranged from 0.18 mg kg−1 (Zamankul) to 0.78 mg kg−1 (Ahsau). Except for Mn, the content of other microelements was higher than in RP. Iron plays a significant role in various physiological and biochemical pathways in plants as it is involved in the synthesis of chlorophyll and is essential for the maintenance of chloroplast structure and function [28]. In plants, Mn is one of the 17 essential elements for growth and reproduction. It is a critically important element for photosynthetic activity [29]. Zinc is a crucial micronutrient for plants involved in the biochemistry and metabolism of plants and promotes plant growth, development, and yield [30]. Cobalt as a component of cobalamin is required by several plant enzymes involved in N2 fixation [31], while Mo is used by enzymes to carry out redox reactions [32].
Other determined elements, which include Al, Sc, V, Ni, Rb, As, Sr, Sb, Cs, Ba, La, Sm, Th, and U have no biological functions and may originate from the soil (Al, Sc, V, Rb, Sr, Cs, La, Sm, Th, and U) or industrial activity (As and Sb). The content of the mentioned elements, except Rb, Cs, and Ba, surpassed RP values in brook-mint. The content of As ranged from 0.1 to 0.69 mg kg−1 and did not exceed the limit of 1 mg kg−1 recommended for medicinal plants by the World Health Organization [33]; however, in brook-mint from Ahsau and oregano from Upper Dzuarikau, it was higher than the value established by the State Pharmacopoeia of the Russian Federation [34].
Due to its high sensitivity and physical characteristics, NAA occupies an unbeatable position in the determination of rare earth elements. This technique was previously used to determine the level of rare earth elements collected in Poland [8] and Moldova [19]. The content of the rare earth elements Sc, La, and Sm determined in the present study was higher than RP values, and their maximum values were detected in brook-mint collected in Ahsau. In small amounts, rare earth elements can have a positive effect on plant growth and facilitate the intake of several nutrients, while their high concentrations have a negative effect on plants [35,36].
In oregano, the mean content of elements followed the order of K > Ca > Mg > Al > Fe > Na > Zn > Sr > Mn > Ba > Rb > Ni > Mo > V > La > As > Co > Sc > Th > Cs > Sm > Sb > U (Table 2). The lowest content of Na and Ca was determined in plants collected in Darvags, of Mg in plants collected in Koban, and of K in plants collected in Zamankul. The highest levels of K and Na were determined in plants collected in Upper Dzuarikau, of Mg in Popov Khutor, and of Ca in Digoria. The content of microelements (Mn, Co, and Mo) was the highest in oregano plants collected in Zamankul, of Zn in plants collected in Koban, and of Fe in plants from Upper Dzuarikau. The content of As (0.08–0.92 mg kg−1) was below the WHO limit. The maximum values of all elements except Mn and Cs were higher than RP.
In St. John’s wort, the elements changed as follows: K > Ca > Mg > Al > Fe > Mn > Na > Zn > Sr > Ba > Rb > Ni > Mo > V > Co > La > As > Cs > Sc > Th > Sm > Sb > U (Table 2). Plants collected in Chemy were characterized by the highest content of Na, K, Mg, Ca, and Fe, and in Dargavs, by Mn, Co, and Zn. It should be noted that the contents of elements that have no biological function were also the highest in plants collected in Chemy. Manganese (Mn) was the only element whose maximum content in St. John’s wort was lower than RP.
In thyme, as in other plants, K and Ca were the most abundant major elements and Fe was the most abundant minor element (Table 3). The highest content of Na, Al, Ca, Fe, Co, As, Sb, Cs, Sm, Th, and U was determined in plants collected in Hidikus, of Mg, Mn, and Mo in plants from Karjin, of Sc and V in plants from Nar, of Rb, Ba, and La in plants collected in Digoria, and of K, Ni, and Sr in plants collected in Darvags. According to the mean contents, elements can be arranged in the following sequence: K > Ca > Mg > Al > Fe > Na > Mn > Sr > Zn > Ba > Rb > Ni > Mo > V > La > Co > As > Sc > Th > Cs > Sm > U > Sb. The content of elements in thyme was higher than in RP, except Mn, Rb, and Cs.
In fireweed, the content of Na, Mn, Co, Zn, Rb, Sb, Cs, and Ba was below RP values. The mean content of elements in plants changed in the order of K > Ca > Mg > Al > Fe > Na > Mn > Sr > Zn > Ba > Rb > Ni > Mo > V > La > As > Co > Sc > Cs > Th > Sm > Sb. The highest content of the main part of the elements, except Ni (Darvags), Zn, Mo, Rb, Ba, and Sm (Hidikus), was determined in plant samples collected in Suagom. The level of As in both thyme (0.07–0.59 mg kg−1) and fireweed (0.05–0.2 mg kg−1) was below the WHO limit.
It was possible to collect from two to five plant species at several sampling sites. The comparison of the content of elements in brook-mint and oregano collected in Zamankul did not reveal significant differences in the accumulation of Na, Mg, and Zn. The content of K, Ca, Mn, Sr, and Mo was higher in brook-mint, while the level of other elements was higher in oregano. According to the ANOVA statistical analysis, in Koban, the content of Na, Mg, Al, Ca, Sc, V, Mn, Fe, Ni, Sr, Ba, La, Sm, Th, and U in the analyzed plant species changed in the following order: brook-mint > oregano > fireweed. Meanwhile, that of K, Co, Zn, As, Rb, Sb, and Cs followed the order of oregano > mint > fireweed. In the case of brook-mint and oregano, the differences in the element content between species were not statistically significant, while for fireweed, they were statistically significant with respect to both oregano and brook-mint (p < 0.05). In Dargavs, again the content of the main part of the determined elements was higher in brook-mint (Na, K, Al, Ca, Sc, V, As, Rb, Mo, Sb, Cs, Sm, Th, and U) followed by oregano (Co, Ni, Zn, and Ba), thyme (Mg, Sr, and La), St. John’s wort (Mn), and fireweed. There was no statistically significant difference between the content of elements in St. John’s wort, fireweed, and thyme, while it was statistically lower compared to brook-mint and oregano (p < 0.05). In Hidikus, the content of all elements in thyme was statistically higher than in fireweed (p < 0.05), and in Nar, the same pattern was observed except for Mn, Co, and Zn. In Dargavs, the content of all elements in fireweed was statistically lower than in oregano and thyme. Thus, regardless of the collection site, the content of elements in brook-mint and oregano was higher compared to other plant species. The differences in element content between the species under investigation may indicate differences in the physiological function of the plant [12]. Some medicinal plants have the ability to accumulate higher amounts of metals selectively from the soil than other species [37].

3.2. Elemental Content of Soils

The multi-elemental capability of NAA was employed for the determination of 36 major and minor elements in soil samples. Basic statistics for analyzed samples are presented in Table 4. For comparison, the table also includes the maximum admissible concentration (MAC) established in Russia [13] and Upper Continental Crust (UCC) values reported by [22].
The mean content of major elements such as Na, Al, Si, K, and Ca in the analyzed soils was lower than UCC values, while those of Mg, Mn, Fe, and Ti exceeded UCC values. At the same time, it should be noted that the maximum values for all elements were higher than UCC. In the case of minor elements, the content of Cr, Co, Ni, and Sr was lower compared to UCC, while the level of other elements was considerably higher. Strontium was the only element in which the maximum value was lower than UCC.
The comparison of the mean values of V, Cr, and Sb with the MAC (Table 3) did not reveal an exceedance of the MACs, except for V and Sb in soils from Nar and Cr in soils from Dargavs. The content of Co and Ni in analyzed soils did not exceed MAC, while the content of As, Zn, and Mo was higher than the MAC.
In order to examine the level of soil pollution and identify the origin of pollutants, CF and EF are presented in Figure 2. The CFs below the threshold for Na, Al, Si, K, Ca, Cr, Co, Ni, Sr, and Ba indicate no soil contamination by the mentioned elements. The values for Mg, Sc, Ti, V, Mn, Fe, Zn, Rb, Zr, Mo, Cs, Ba La, Ce, Nd, Sm, Eu, Tb, Yb, Lu, Hf, Ta, W, Th, and U lie in the range of 1.0 and 2.0, which indicates slight soil contamination, while moderate pollution was characterized for As and Sb. The highest CF for As of 18.3 was obtained for soil samples collected at Upper Dzuarikau (oregano), followed by Koban (Brook-mint) and Digoria (fireweed and thyme), with all values being higher than 10. For Sb, the highest CF value of 9.65 was obtained from the soil in Nar (Brook-mint).
To identify the origin of elements, EF was used. According to Zhang et al. [38], EF values between 0.05 and 1.5 indicate that the element’s enrichment is due to natural processes, while EF values higher than 1.5 suggest that the contamination is associated with anthropogenic sources. Besides As, Sb, Zn, and U, the determined elements can be considered to be of geogenic origin. The Republic of North Ossetia, Alania is the home to several large zinc deposits—Dzhimidonsky, Kadat-Khampaldonsky, and Kakadur-Kanikomovsky [39]. There are important sources of ores of non-ferrous, noble, and rare metals, including zinc, copper, cobalt, molybdenum, and other elements. Previous studies have shown that zinc levels in up to 80% of the soil samples collected in Vladikavkaz exceed the MPC [40]. The same pattern was observed for soils collected at other places in the Republic [41]. Thus, mining and vehicles can be considered the main sources of the high Zn content in soils. Soil contamination by As and Sb is possibly due to intensive mining and refining activities [42]. The industry of the Republic of North Ossetia is represented by mining metallurgy and metalworking, which can contribute to pollutant emissions [40]. The largest enterprise in the Republic is OJSC “Electrozinc”, which has been actively polluting the environment throughout the years of its existence [43]. The company carried out complex processing of zinc and lead raw materials, which contain antimonates and arsenates [44].

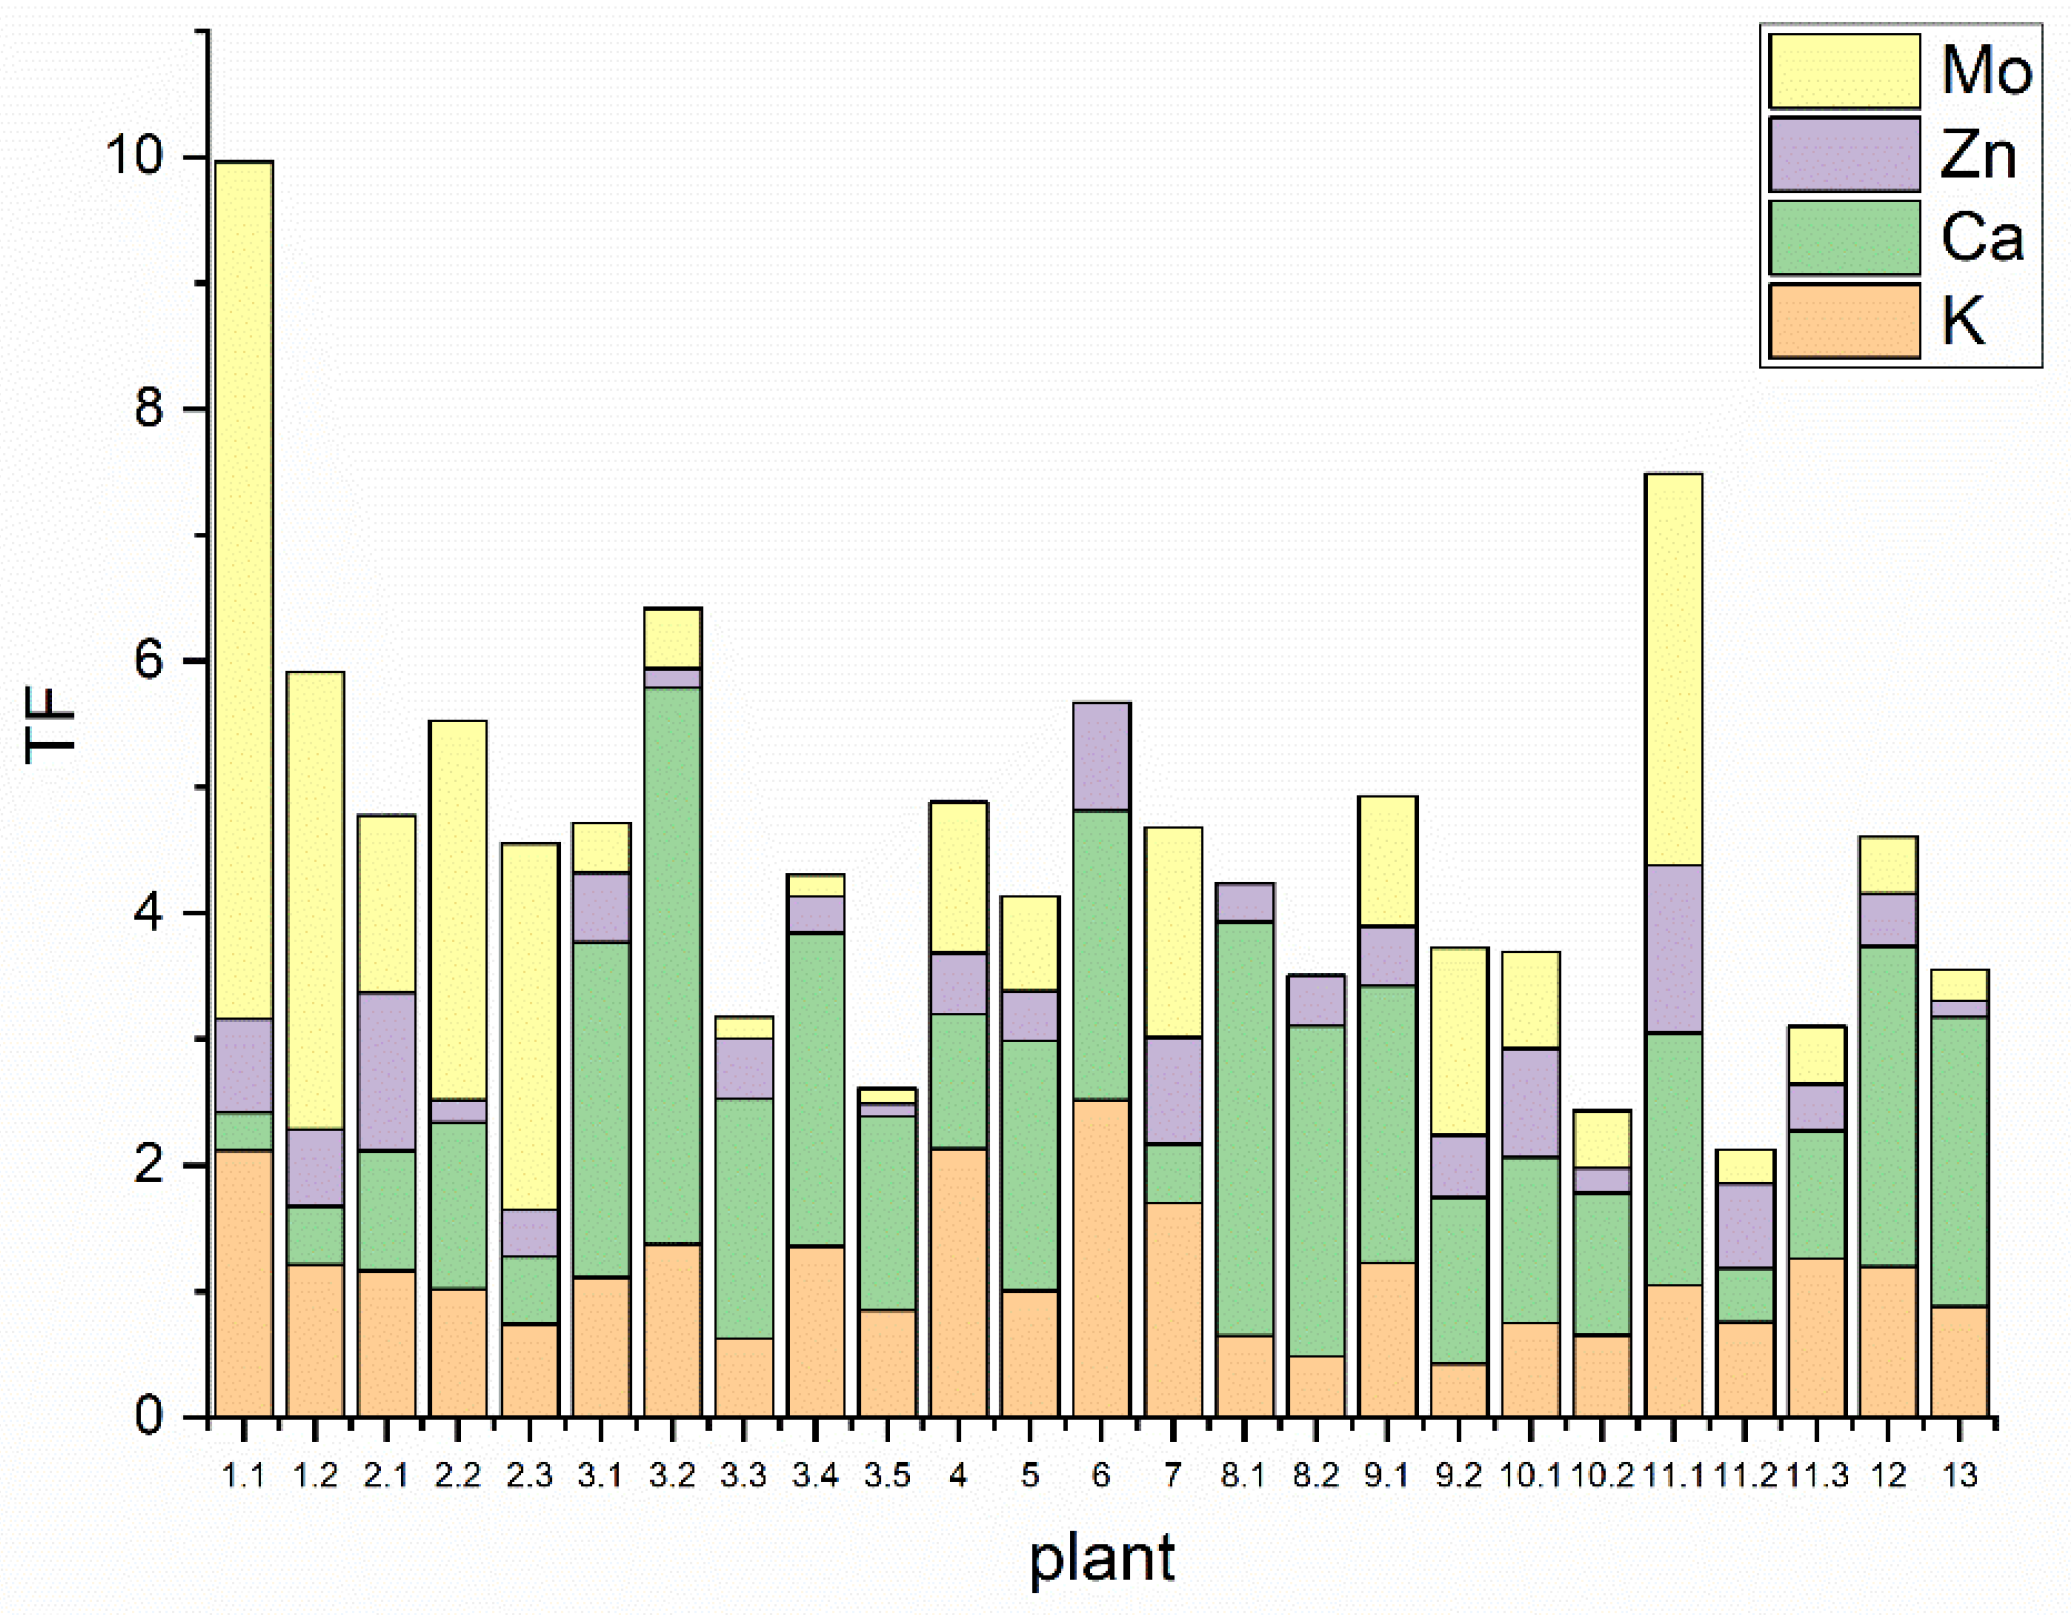
3.3. Metal Transfer from Soil in Plants

In order to assess the role of the soil in the element uptake by plants, TFs were calculated. The accumulation of elements in plants depends on the soil composition, pH, redox potential, temperature and humidity [45], exchange capacity, and organic matter content [4]. Only four elements’ TFs, namely K, Ca, Zn, and Mo, were higher than the threshold (Figure 3).
Thus, TFs for K varied from 0.4 in thyme from Chermy to 2.5 in mint from Popov Khutor, while for Ca, values varied from 0.3 in brook-mint from Zamankul to 4.4 in brook-mint from Dargavs. Potassium and Ca are the two most abundant elements in plant water cellular media, with both being involved in more plant functions and indispensable in plant nutrition [46]. The uptake of K by plants occurs due to its active absorption. Several families of membrane protein transporters are involved in element uptake, allocation, and homeostasis [46,47]. Calcium uptake in plants is possible through Ca2+-specific ion channels and the process is influenced by metabolism and temperature [48]. Plants assimilate Zn as the divalent cations, which are taken up by various transporter proteins [30]. In oregano samples collected in Koban and Digoria, TFs for Zn were higher than 1.0. The TFs for Mo changed from 0.1 to 6.8. Molybdenum uptake by plants is higher in alkaline soils, where it forms anionic complexes with various ions including Na, K, Ca, and Mg, as well as humic and fulvic acids [32]. Even the analyzed soils were characterized by a high content of As, Sb, Zn, and Mo in plants were accumulated Zn and Mo, while for As and Sb TFs were below the threshold.
The TFs for the majority of the elements (Table S1) were below the threshold, indicating their low accumulation from the soil. Usually, sources of these elements for plants can be vehicles, bulk atmospheric deposition, and rainfall [14]. In North Ossetia, which has a high concentration of mining and metallurgical industry facilities, the deposition of chemical elements on plants can be caused by dusty manmade deposits—the dumping of products from imperfect technology used for the processing of non-ferrous metal ores and rock dumps [43].

3.4. Principal Component and Discriminant Analyses

A principal component analysis (PCA) was applied to reduce the number of determined elements to a smaller set of independent variables and identify the sources of the elements (Figure 4).
Principal component 1 (PC1) and principal component 2 (PC2) account for 48% and 15.8% of total variance, respectively, with some obvious element groupings. The variables projected close to the origin are considered to be of little importance. The short distances between the variables indicate a strong correlation. Thus, a strong correlation was obtained for Al, V, Sm, Sc, Fe, Th, Na, and As. This group of elements can be mainly related to mint samples. The main sources of the mentioned elements can be considered dust of geological and anthropogenic origin. Elements with high correlations in the second PC (Ca, K, Mg, and Sr) positioned in the upper-right quadrant are physiologically important elements for plants, while Rb, Cs, and Co, which can accumulate in plants via the same pathway due to their similarities with K and Ca, are positioned below. The sign of the values in PC2 indicates the direction of the relationship between the original variables and the second principal component. A negative value indicates that as the original variable increases, the value of PC2 decreases, showing a negative correlation.
Clear separation could also be seen for mint and fireweed plants. Mint plants are positioned in the top of the upper-right quadrant, while fireweed is positioned in the lower-left quadrant. There might be differences in the concentrations of Ca, K, Mg, and Sr between fireweed and other plant species, including mint plants, based on their positions in the PCA space. The rest of the medicinal herbs investigated appeared to be dispersed in the component space.
To obtain more information concerning the similarities and dissimilarities between the investigated plants, a discriminate analysis (DA), as one of the most appropriate statistical methods of analysis, was used. Following this method, it was possible to discriminate between plant species (Figure 5).
Given the small number of samples, the main contribution to DA was restrained to 12 elements (Na, Mg, K, Ca, Mn, Co, Zn, As, Rb, Sr, Sb, and Cs), which showed the greatest variability, which allowed us to ensure the maximum discernibility between cases. As can be seen, DA allowed a better discrimination of all types of plants according to their species. Analysis of the structure of LD1 and LD2 showed that in the case of LD1, a significant contribution is made in decreasing order by Ca, Co, Sb, Mn, Rb, Zn, and K, while in the case of LD2, the contribution comes from Zn, Cs, Rb, and Sb. The higher the absolute value of a discriminant coefficient, the more significant the corresponding input variable is in distinguishing between different classes.

3.5. Health Risk Assessment

To assess the possible toxic effect of analyzed plants on human health, the daily intake of metal and the health risk index were calculated for Ni, Zn, As, and Sb (elements for which RfD values are available). The estimated daily intake and health risk index for all analyzed plants are presented in Table 5. The DIM values ranged from 5 × 10⁻⁴ to 3 × 10⁻³ kg/day for Ni, from 1 × 10⁻² to 8 × 10⁻² kg/day for Zn, from 3 × 10⁻⁵ to 5 × 10⁻⁴ kg/day for As, and from 8 × 10⁻⁶ to 2 × 10⁻⁴ kg/day for Sb. The DIM values are all below the RfD values, indicating that consumption of the studied plants likely does not appear to pose a health risk. As shown in Table 4, the HRI values for the selected elements were below the threshold, indicating that there is no significant carcinogenic health risk for drinkers of infusions prepared from the analyzed plants. Similar results were obtained for medicinal plants cultivated in Peru [49] and Nigeria [50].

4. Conclusions

Instrumental neutron activation analysis was applied to determine the content of 36 major and trace elements in soils and 23 elements in plants collected in the Republic of North Ossetia. An increase in the elements’ contents compared to UCC and MAC was observed. The contamination factor point was moderate soil pollution with As and Sb, and according to EFs, As, Sb, Zn, and U in soil may originate from anthropogenic sources. In the case of plants, the most abundant major elements were K and Ca, and among microelements, the most abundant were Fe and Mn. The content of elements in mint and marjoram was significantly higher compared to other species collected at the same site. The content of As was below the WHO limits. Among elements with high content in soil, only the values of Zn and Mo TFs were higher than the threshold, indicating that soil is the main source of their accumulation in plants. Discriminant analysis classified the plants into five different categories based on species. Principal component analysis revealed the impact of geogenic and anthropogenic activities on the elemental content of plants. The HRI values for Ni, As, Zn, and Sb were less than 1, suggesting that there is no significant carcinogenic health risk for consumers of infusions prepared from the analyzed plants.
Since the Republic of North Ossetia has well-developed mining and metallurgy industries, in future research, it is also necessary to determine the level of toxic elements (Cd, Cu, Pb, and Hg). It is also necessary to increase the investigated area, involving more plants consumed by the population.

Supplementary Materials

The following supporting information can be downloaded at: https://www.mdpi.com/article/10.3390/agronomy14061269/s1, Table S1: TFs for elements determined in analyzed five plant species.

Author Contributions

Conceptualization, Y.L., M.F., K.T. and I.Z.; sample collection, Y.L. and A.P.; sample irradiation and data processing, D.G. and I.Z.; statistical analysis, O.C.; resources, I.Z.; data; writing—original draft preparation, I.Z.; writing—review and editing, all authors. All authors have read and agreed to the published version of the manuscript.

Funding

This research received no external funding.

Data Availability Statement

Data are contained within the article.

Acknowledgments

The authors would like to thank Nikita Yushin for preparing the map of sampling sites.

Conflicts of Interest

The authors declare no conflicts of interest.

References

  1. Ciocarlan, A.; Hristozova, G.; Aricu, A.; Dragalin, I.; Zinicovscaia, I.; Yushin, N.; Grozdov, D.; Popescu, V. Determination of the Elemental Composition of Aromatic Plants Cultivated Industrially in the Republic of Moldova Using Neutron Activation Analysis. Agronomy 2021, 11, 1011. [Google Scholar] [CrossRef]
  2. Tkachenko, K.G. Quality Control of Fruit and Seeds of Medicinal Plants. Maced. Pharm. Bull. 2022, 66, 39–40. [Google Scholar] [CrossRef]
  3. Hlihor, R.M.; Roșca, M.; Hagiu-Zaleschi, L.; Simion, I.M.; Daraban, G.M.; Stoleru, V. Medicinal Plant Growth in Heavy Metals Contaminated Soils: Responses to Metal Stress and Induced Risks to Human Health. Toxics 2022, 10, 499. [Google Scholar] [CrossRef]
  4. Luo, L.; Wang, B.; Jiang, J.; Fitzgerald, M.; Huang, Q.; Yu, Z.; Li, H.; Zhang, J.; Wei, J.; Yang, C.; et al. Heavy Metal Contaminations in Herbal Medicines: Determination, Comprehensive Risk Assessments, and Solutions. Front. Pharmacol. 2021, 11, 595335. [Google Scholar] [CrossRef] [PubMed]
  5. Kulhari, A.; Sheorayan, A.; Bajar, S.; Sarkar, S.; Chaudhury, A.; Kalia, R.K. Investigation of Heavy Metals in Frequently Utilized Medicinal Plants Collected from Environmentally Diverse Locations of North Western India. Springerplus 2013, 2, 676. [Google Scholar] [CrossRef] [PubMed]
  6. Oyebode, O.; Kandala, N.B.; Chilton, P.J.; Lilford, R.J. Use of Traditional Medicine in Middle-Income Countries: A WHO-SAGE Study. Health Policy Plan. 2016, 31, 984–991. [Google Scholar] [CrossRef]
  7. Sánchez, M.; González-Burgos, E.; Iglesias, I.; Lozano, R.; Gómez-Serranillos, M.P. Current Uses and Knowledge of Medicinal Plants in the Autonomous Community of Madrid (Spain): A Descriptive Cross-Sectional Study. BMC Complement. Med. Ther. 2020, 20, 306. [Google Scholar] [CrossRef]
  8. Brudzińska-Kosior, A.; Kosior, G.; Sporek, M.; Ziembik, Z.; Zinicovscaia, I.; Frontasyeva, M.; Dołhańczuk-Śródka, A. Nuclear Analytical Techniques Used to Study the Trace Element Content of Centaurium Erythraea Rafn, a Medicinal Plant Species from Sites with Different Pollution Loads in Lower Silesia (SW Poland). PLoS ONE 2023, 18, e0285306. [Google Scholar] [CrossRef]
  9. Abou-Arab, A.A.K.; Abou Donia, M.A. Heavy Metals in Egyptian Spices and Medicinal Plants and the Effect of Processing on Their Levels. J. Agric. Food Chem. 2000, 48, 2300–2304. [Google Scholar] [CrossRef]
  10. Dogheim, S.M.; Ashraf, E.M.M.; Alla, S.A.G.; Khorshid, M.A.; Fahmy, S.M. Pesticides and Heavy Metals Levels in Egyptian Leafy Vegetables and Some Aromatic Medicinal Plants. Food Addit. Contam. 2004, 21, 323–330. [Google Scholar] [CrossRef]
  11. Barthwal, J.; Nair, S.; Kakkar, P. Heavy Metal Accumulation in Medicinal Plants Collected from Environmentally Different Sites. Biomed. Environ. Sci. 2008, 21, 319–324. [Google Scholar] [CrossRef] [PubMed]
  12. Melkaoui, C.; Cheriti, A.; Bouchekara, M. Assessment of Heavy Metals and Macromineral in Frequently Used Medicinal Plants from Algerian Sahara Traditional Ethnopharmacopeia. Ann. Pharm. Fr. 2023, 81, 616–626. [Google Scholar] [CrossRef] [PubMed]
  13. Glavač, N.K.; Djogo, S.; Ražić, S.; Kreft, S.; Veber, M. Accumulation of Heavy Metals from Soil in Medicinal Plants. Arh. Hig. Rada Toksikol. 2017, 68, 236–244. [Google Scholar] [CrossRef] [PubMed]
  14. Georgieva, S.K.; Georgieva, A.; Peteva, Z.; Dimova, D. Trace Elements in Commonly Used Medicinal Plants from Varna Region, Bulgaria. Environ. Sci. Pollut. Res. 2021, 28, 59277–59283. [Google Scholar] [CrossRef] [PubMed]
  15. Lavrinenko, Y.; Plieva, A.; Zinicovscaia, I.; Hristozova, G.; Frontasyeva, M.; Tkachenko, K.; Dogadkin, D.; Gromyak, I.; Kolotov, V. Elemental Composition of Infusions of Herbs (Tisanes) of North Ossetia (the Caucasus). Agriculture 2021, 11, 841. [Google Scholar] [CrossRef]
  16. Tkachenko, K.; Frontasyeva, M.; Vasilev, A.; Avramov, L.; Shi, L. Major and Trace Element Content of Tribulus Terrestris l. Wildlife Plants. Plants 2020, 9, 764. [Google Scholar] [CrossRef] [PubMed]
  17. Tkachenko, K.; Kosareva, I.; Frontasyeva, M. The Influence of Manganese on Growth Processes of Hordeum l. (Poaceae) Seedlings. Plants 2021, 10, 1009. [Google Scholar] [CrossRef] [PubMed]
  18. Alla Kapelian, K.T.; Varfolomeeva, E. Search for Toxic Trace Elements in Rosa Rugosa Thunb. By Instrumental Neutron Activation Analysis: Accumulation and Responses to Exposure. J. Agric. Crop. 2023, 9, 503–513. [Google Scholar] [CrossRef]
  19. Zinicovscaia, I.; Gundorina, S.; Vergel, K.; Grozdov, D.; Ciocarlan, A.; Aricu, A.; Dragalin, I.; Ciocarlan, N. Elemental Analysis of Lamiaceae Medicinal and Aromatic Plants Growing in the Republic of Moldova Using Neutron Activation Analysis. Phytochem. Lett. 2020, 35, 119–127. [Google Scholar] [CrossRef]
  20. Gonçalves, E.P.R.; Soares, H.M.V.M.; Boaventura, R.A.R.; Machado, A.A.S.C.; Esteves da Silva, J.C.G. Seasonal Variations of Heavy Metals in Sediments and Aquatic Mosses from the Cávado River Basin (Portugal). Sci. Total Environ. 1994, 142, 143–156. [Google Scholar] [CrossRef]
  21. Fernández, J.A.; Carballeira, A. Evaluation of Contamination, by Different Elements, in Terrestrial Mosses. Arch. Environ. Contam. Toxicol. 2001, 40, 461–468. [Google Scholar] [CrossRef] [PubMed]
  22. Rudnick, R.L.; Gao, S. Composition of the Continental Crust; Elsevier Ltd.: Amsterdam, The Netherlands, 2003; Volume 3, ISBN 0-08-044338-9. [Google Scholar]
  23. Sałata, A.; Dąbek, L. Methods of Assessment of Stormwater Sediments Quality. In Proceedings of the E3S Web of Conferences, EDP Sciences, Boguszów-Gorce, Poland, 24 May 2017; Volume 17. [Google Scholar]
  24. Zinicovscaia, I.; Sturza, R.; Duliu, O.; Grozdov, D.; Gundorina, S.; Ghendov-Mosanu, A.; Duca, G. Major and Trace Elements in Moldavian Orchard Soil and Fruits: Assessment of Anthropogenic Contamination. Int. J. Environ. Res. Public Health 2020, 17, 7112. [Google Scholar] [CrossRef] [PubMed]
  25. Oladeji, O.M.; Kopaopa, B.G.; Mugivhisa, L.L.; Olowoyo, J.O. Investigation of Heavy Metal Analysis on Medicinal Plants Used for the Treatment of Skin Cancer by Traditional Practitioners in Pretoria. Biol. Trace Elem. Res. 2024, 202, 778–786. [Google Scholar] [CrossRef] [PubMed]
  26. U.S. Environmental Protection Agency | US EPA. Available online: https://www.epa.gov/ (accessed on 17 April 2024).
  27. Markert, B.; Fränzle, S.; Wünschmann, S. Chemical Evolution: The Biological System of the Elements; Springer: Cham, Switzerland, 2015; pp. 1–282. [Google Scholar] [CrossRef]
  28. Rout, G.R.; Sahoo, S. Role of iron in plant growth and metabolism. Rev. Agric. Sci. 2015, 3, 1–24. [Google Scholar] [CrossRef]
  29. Alejandro, S.; Höller, S.; Meier, B.; Peiter, E. Manganese in Plants: From Acquisition to Subcellular Allocation. Front. Plant Sci. 2020, 11, 517877. [Google Scholar] [CrossRef] [PubMed]
  30. Hamzah Saleem, M.; Usman, K.; Rizwan, M.; Al Jabri, H.; Alsafran, M. Functions and Strategies for Enhancing Zinc Availability in Plants for Sustainable Agriculture. Front. Plant Sci. 2022, 13, 1033092. [Google Scholar] [CrossRef] [PubMed]
  31. Hu, X.; Wei, X.; Ling, J.; Chen, J. Cobalt: An Essential Micronutrient for Plant Growth? Front. Plant Sci. 2021, 12, 768523. [Google Scholar] [CrossRef] [PubMed]
  32. Kaiser, B.N.; Gridley, K.L.; Brady, J.N.; Phillips, T.; Tyerman, S.D. The Role of Molybdenum in Agricultural Plant Production. Ann. Bot. 2005, 96, 745. [Google Scholar] [CrossRef] [PubMed]
  33. WHO. WHO Guidelines for Assessing Quality of Herbal Medicines with Reference to Contaminants and Residues; WHO: Geneva, Switzerland, 2007. [Google Scholar]
  34. Vinogradova, N.; Glukhov, A.; Chaplygin, V.; Kumar, P.; Mandzhieva, S.; Minkina, T.; Rajput, V.D. The Content of Heavy Metals in Medicinal Plants in Various Environmental Conditions: A Review. Horticulturae 2023, 9, 239. [Google Scholar] [CrossRef]
  35. Grosjean, N.; Purwadi, I.; Sirguey, C.; Chalot, M.; Le Jean, M.; van der Ent, A.; Blaudez, D. Rare Earth Elements in Plants: Transfer, Transport, Accumulation, Impacts and Perspectives. In Advances in Botanical Research; Academic Press: Cambridge, MA, USA, 2024; Volume 109, pp. 19–61. [Google Scholar]
  36. Ozturk, M.; Metin, M.; Altay, V.; Prasad, M.N.V.; Gul, A.; Bhat, R.A.; Darvash, M.A.; Hasanuzzaman, M.; Nahar, K.; Unal, D.; et al. Role of Rare Earth Elements in Plants. Plant Mol. Biol. Rep. 2023, 41, 345–368. [Google Scholar] [CrossRef]
  37. Sarma, H.; Deka, S.; Deka, H.; Saikia, R.R. Accumulation of Heavy Metals in Selected Medicinal Plants. Rev. Environ. Contam. Toxicol. 2011, 214, 63–86. [Google Scholar] [PubMed]
  38. Zhang, J.; Liu, C.L. Riverine Composition and Estuarine Geochemistry of Particulate Metals in China—Weathering Features, Anthropogenic Impact and Chemical Fluxes. Estuar. Coast. Shelf Sci. 2002, 54, 1051–1070. [Google Scholar] [CrossRef]
  39. Russia’s Federal Constituent Entities|Federation Council of the Federal Assembly of the Russian Federation. Available online: http://council.gov.ru/en/structure/regions/SE/ (accessed on 17 April 2024).
  40. Kabaloeva, D.V.; Tsirikhova, A.S.; Kisieva, M.T. Environmentally-related diseases and their prevention in the republic of north ossetia—Alania. Medical Pharm. J. Pulse 2020, 22, 60–64. [Google Scholar] [CrossRef]
  41. Arutyunyanz, A.A.; Salamova, N.A.; Simeonidi, D.D. Characterization of Condition of the Sewage Water and the Level of the Soil Pollution by Polygons of Waste Matter of Republic of North Ossetia—Alania. In Proceedings of the IOP Conference Series: Earth and Environmental Science; IOP Publishing: Bristol, UK, 2019; Volume 272, p. 032053. [Google Scholar]
  42. Zhong, G.; Wan, F.; Wu, S.; Jiang, X.; Tang, Z.; Zhang, X.; Huang, R.; Hu, L. Arsenic or/and Antimony Induced Mitophagy and Apoptosis Associated with Metabolic Abnormalities and Oxidative Stress in the Liver of Mice. Sci. Total Environ. 2021, 777, 146082. [Google Scholar] [CrossRef] [PubMed]
  43. Zaalishvili, V.; Burdzieva, O.; Kanukov, A.; Zaks, T. Eco-Geophysical and Geoecological Factors in Assessing the State of the Geological Environment Based on the Analysis of Spatial Databases of the Territory of the Republic of North Ossetia–Alania. Appl. Sci. 2022, 12, 2644. [Google Scholar] [CrossRef]
  44. Magometov, A.A.; Makoev, K.K.; Kebalova, L.A.; Toporkova, T.N. Problems of creation of a sanitary protection zone in the area of JSC "Electrozink"and OJSC “Pobedit”. Vladikavkaz 2020, 99. [Google Scholar]
  45. Mirecki, N.; Agič, R.; Šunić, L.; Milenković, L.; Ilić, Z.S. Transfer Factor as Indicator of Heavy Metals Content in Plants. Fresenius Environ. Bull. 2015, 24, 4212–4219. [Google Scholar]
  46. Sardans, J.; Peñuelas, J. Potassium Control of Plant Functions: Ecological and Agricultural Implications. Plants 2021, 10, 419. [Google Scholar] [CrossRef]
  47. Barber, S.A. Mechanism of Potassium Absorption by Plants. Role Potassium Agric. 2015, 14, 293–310. [Google Scholar] [CrossRef]
  48. Pathak, R.K.; Singh, D.B.; Sharma, H.; Pandey, D.; Dwivedi, S. Calcium Uptake and Translocation in Plants. Calcium Transp. Elem. Plants 2021, 21, 373–386. [Google Scholar] [CrossRef]
  49. Zárate-Quiñones, R.H.; Custodio, M.; Orellana-Mendoza, E.; Cuadrado-Campó, W.J.; Grijalva-Aroni, P.L.; Peñaloza, R. Determination of Toxic Metals in Commonly Consumed Medicinal Plants Largely Used in Peru by ICP-MS and Their Impact on Human Health. Chem. Data Collect. 2021, 33, 100711. [Google Scholar] [CrossRef]
  50. Izah, S.C.; Aigberua, A.O.; Richard, G. Concentration, Source, and Health Risk of Trace Metals in Some Liquid Herbal Medicine Sold in Nigeria. Biol. Trace Elem. Res. 2022, 200, 3009–3022. [Google Scholar] [CrossRef] [PubMed]
Figure 1. Sampling map of medicinal plants in the Republic of North Ossetia.
Agronomy 14 01269 g001
Figure 2. Mean values of the CF and EF for soil samples collected in different zones of North Ossetia.
Agronomy 14 01269 g002
Figure 3. TFs for K, Ca, Zn, and Mo in medicinal plants collected in different zones of North Ossetia.
Agronomy 14 01269 g003
Figure 4. PCA scores plot for medicinal plants collected in different zones of North Ossetia.
Agronomy 14 01269 g004
Figure 5. The result of Discriminant Analysis for medicinal plants collected in different zones of North Ossetia.
Agronomy 14 01269 g005
Table 1. The description of the medicinal plant collection sites in the Republic of North Ossetia.
Site Site Name LatitudeLongitudeSpeciesShorthandShort NameSoil Type
1Zamankul43.35976944.432536Mentha longifolia1.1Brook-mintordinary chernozems
Origanum vulgare1.2oreganoordinary chernozems
2Koban42.927844.42503Mentha longifolia2.1Brook-mintbrown mountain-wood
Hypеricum perforаtum2.2St. John’s wortalpine-meadow
Oríganum vulgare2.3oreganobrown mountain-wood
3Dargavs42.8139344.42507Mentha longifolia3.1Brook-mintalpine-meadow
Thymus daghestanicus3.2thymealpine-meadow
Hypеricum perforаtum3.3St. John’s wortbrown mountain-wood
Oríganum vulgare3.4oreganoalpine-meadow
Chamaenerion angustifolium3.5fireweedalpine-meadow
4Mountain Saniba42.83647744.527862Mentha longifolia4Brook-mintalluvial
5Ahsau42.9567243.72495Mentha longifolia5Brook-mintmountain-wood
6Popov khutor42.97017544.630214Mentha longifolia6Brook-mintbrown mountain-wood
7Karjin43.27796344.289759Thymus daghestanicus7thymeordinary chernozems
8Nar42.68725844.001003Thymus daghestanicus8.1thymealpine-meadow
Hypеricum perforаtum8.2St. John’s wortalpine-meadow
9Chemy42.83554944.629982Thymus daghestanicus9.1thymealpine-meadow
Hypеricum perforаtum9.2St. John’s wortalpine-meadow
10Hidikus42.8047844.2377Thymus daghestanicus10.1thymealpine-meadow
Chamaenerion angustifolium10.2fireweedalpine-meadow
11Digoria42.8832743.59385Thymus daghestanicus11thymebrown forest
12Upper Dzuarikau42.84385444.326609Hypеricum perforаtum12.1St. John’s wortalpine-meadow
Oríganum vulgare12.2oreganoalpine-meadow
Thymus daghestanicus12.3thymealpine-meadow
13Suargom42.8271744.60466Chamaenerion angustifolium13fireweedhumus-carbonate
Table 2. The basic statistics for brook-mint (Mentha longifolia), oregano (Origanum vulgare), and St. John’s wort (Hypеricum perforаtum) collected in different zones in North Ossetia (in mg kg−1).
Brook-MintOreganoSt. John’s Wort
ElementRangeMean ± SDRangeMean ± SDRangeMean ± SD
Na134.0–545.0285 ± 19882–179134.8 ± 34.541–22989.7 ± 78.5
Mg2967–45293520 ± 5431990–32772734 ± 5001229–29662196 ± 680
Al470–30401185 ± 989276–939614 ± 23578–1070375 ± 395
K19,400–49,50033,750 ± 10,48721,700–30,90026,580 ± 388712,800–27,30016,220 ± 6210
Ca13,700–20,00016,550 ± 255010,100–17,0001352 ± 28,2305400–13,6008076 ± 3347
Sc0.11–0.770.29 ± 0.250.08–0.210.15 ± 0.050.02–0.300.10 ± 0.12
V0.71–3.801.63 ± 1.210.45–1.260.91 ± 0.320.34–1.700.74 ± 0.65
Mn36.6–117.060.8 ± 2833.4–49.042.6 ± 6.227.8–190100.4 ± 65
Fe339–2080829 ± 680269–591.444.6 ± 12154.0–798269.8 ± 300
Co0.18–0.780.39 ± 0.30.19–0.280.25 ± 0.030.17–1.730.59 ± 0.64
Ni2.3–4.13.17 ± 0.91.44–4.72.56 ± 1.880.82–4.72.98 ± 1.66
Zn26.1–14255.3 ± 4446–10178.9 ± 2248.0–8764.8 ± 17
As0.1–0.690.34 ± 0.210.08–0.920.30 ± 0.350.05–0.360.13 ± 0.13
Rb2.3–3712.9 ± 12.55.0–19.010.1 ± 5.92.5–87.022.2 ± 36
Sr26.3–11665.7 ± 3119.2–8053.9 ± 268.4–79.039.2 ± 26
Mo0.45–4.92.49 ± 1.780.29–2.91.58 ± 1.10.16–3.401.30 ± 1.5
Sb0.02–0.260.08 ± 0.090.02–0.060.04 ± 0.020.02–0.080.03 ± 0.03
Cs0.05–0.320.14 ± 0.110.04–0.120.08 ± 0.030.03–0.380.13 ± 0.15
Ba23.2–7839.5 ± 19.719.2–5930.9 ± 165.4–79.029.9 ± 22
La0.40–1.460.87 ± 0.540.19–0.450.33 ± 0.10.08–0.630.24 ± 0.26
Sm0.05–0.280.11 ± 0.090.03–0.090.06 ± 0.020.01–0.130.04 ± 0.05
Th0.08–0.610.22 ± 0.20.05–0.140.11 ± 0.040.03–0.210.08 ± 0.09
U0.02–0.150.07 ± 0.050.01–0.030.02 ± 0.010.01–0.040.02 ± 0.02
Table 3. The basic statistics for thyme (Thymus daghestanicus) and fireweed (Chamaenerion angustifolium) soil samples collected in different zones in North Ossetia (in mg kg−1).
ThymeFireweed
Range Mean ± SDRangeMean ± SDRP
Na73–219139.5 ± 5642.9–10264 ± 25150
Mg2422–39863067 ± 700702–36162221 ± 11922000
Al192–1270612 ± 400150–396260 ± 12680
K9870–34,5002187 ± 93409438–19,40015,084 ± 505019,000
Ca7300–14,90011,566 ± 26712671–12,2008167 ± 405010,000
Sc0.06–0.30.15 ± 0.090.03–0.080.06 ± 0.030.02
V0.39–1.850.97 ± 0.520.18–0.550.35 ± 0.20.5
Mn42–14883 ± 3939.2–9664.2 ± 24200
Fe233–890449 ± 260153–278215 ± 63150
Co0.16–0.420.27 ± 0.10.10–0.140.11 ± 0.010.2
Ni1.76–3.82.83 ± 0.890.89–2.051.6 ± 0.51.5
Zn40–7456 ± 1312.8–31.421.3 ± 7.850
As0.07–0.590.23 ± 0.20.05–0.20.13 ± 0.080.1
Rb4.1–3211.8 ± 10.34.6–10.37.8 ± 2.450
Sr47–8967.3 ± 1414.0–5940 ± 1850
Mo0.15–2.51.1 ± 0.90.1–0.80.4137350.5
Sb0.03–0.060.04 ± 0.010.01–0.020.01 ± 0.0030.1
Cs0.05–0.130.08 ± 0.030.03–0.090.05 ± 0.030.2
Ba8.5–10453.8 ± 356.7–3515.6 ± 1340
La0.15–0.740.38 ± 0.240.09–0.240.17 ± 0.070.2
Sm0.03–0.130.070 ± 0.030.02–0.040.03 ± 0.010.04
Th0.05–0.270.12 ± 0.080.02–0.80.04 ± 0.030.005
U0.01–0.070.05 ± 0.03 0.01
Table 4. Basic statistics for soil samples collected in different zones in North Ossetia (in mg kg−1).
ElementMinMaxMeanMedSDMACUCC
Na720028,00011,18691905005.7 24,259
Mg10,685.3230,40020,42721,4006044.9 14,957
Al62,00095,00079,17682,00011,424.2 81,505
Si156,000350,000242,000231,00051,085.7 313,315
K13,30028,70021,90422,1004447.0 23,244
Ca310066,10011,657760013,108.9 25,568
Sc6.7220.21415.33.5 14
Ti2070590045324600940.9 383
V2816611312030.715097
Cr28.3107818922.610092
Mn1683030972831594.81500774
Fe16,30053,00040,89241,0009286.0 39,176
Co4.72815155.35017
Ni8.4804343.916.48047
Zn6422413112545.52367
As6.3883023.918.824.8
Rb6516211812023.2 84
Sr722431229845.1 320
Zr14927320420425.5 193
Mo0.723.4410.970.50.071.1
Sb0.51621.511.14.50.4
Cs3.5411.787.92.5 4.9
Ba30468044642787.1 628
La20.143.73435.66.6 31
Ce4088697213.5 63
Nd16.63931326.8 27
Sm3.27.866.551.2 4.7
Eu0.711.7711.340.3 1
Tb0.4271.110.850.2 0.7
Yb1.244.132.920.7 2
Lu0.180.700.440.1 0.31
Hf3.227.155.40.8 5.3
Ta0.551.3310.960.2 0.9
W0.885.722.20.9 1.9
Th6.416.61212.72.7 10.5
U1.86352.912.0 2.7
Table 5. The daily intake (µg/day) and health risk index of As, Ni, Sb, and Zn in medicinal plants collected in different zones of North Ossetia.
DIMHRI
Location NiZnAsSbNiZnAsSb
1Zamankul1.1 2.82 × 10−25.81 × 10−51.25 × 10⁻⁵ 9.4 × 10−21.9 × 10−14.2 × 10⁻³
1.2 2.70 × 10−28.51 × 10−52.41 × 10⁻⁵ 9.0 × 10−22.8 × 10−18.0 × 10⁻³
2Koban2.18.45 × 10−45.93 × 10−21.34 × 10−43.29 × 10−54.2 × 10−22.0 × 10−14.5 × 10−11.1 × 10⁻³
2.21.35 × 10−31.76 × 10−21.24 × 10−42.11 × 10−56.8 × 10−25.9 × 10−24.1 × 10−17.0 × 10⁻³
2.34.81 × 10−33.16 × 10−24.76 × 10−51.16 × 10−52.4 × 10−21.1 × 10−11.6 × 10−13.9 × 10⁻³
3Dargavs3.12.76 × 10−34.08 × 10−24.93 × 10−51.46 × 10−51.4 × 10−11.4 × 10−11.6 × 10−14.9 × 10⁻³
3.21.82 × 10−31.53 × 10−21.29 × 10−42.35 × 10−59.1 × 10−25.1 × 10−24.3 × 10−17.8 × 10⁻³
3.32.76 × 10−35.11 × 10−24.93 × 10−51.06 × 10−51.4 × 10−11.7 × 10−11.6 × 10−13.5 × 10⁻³
3.42.23 × 10−32.74 × 10−26.16 × 10−51.76 × 10−51.1 × 10−19.1 × 10−22.1 × 10−15.9 × 10⁻³
3.51.20 × 10−31.10 × 10−22.82 × 10−58.22 × 10−66.0 × 10−23.7 × 10−29.4 × 10−22.7 × 10⁻³
4Mountain Saniba4 2.99 × 10−22.76 × 10−44.23 × 10⁻⁵ 1.0 × 10−19.2 × 10−11.4 × 10⁻³
5Ahsau52.41 × 10−32.05 × 10−24.05 × 10−44.17 × 10−51.2 × 10−16.8 × 10−21.41.4 × 10−2
6Popov khutor6 8.34 × 10−22.00 × 10−41.53 × 10⁻⁴ 2.8 × 10−16.7 × 10−15.1 × 10⁻²
7Karjin7 4.34 × 10−24.34 × 10−51.91 × 10⁻⁵ 1.4 × 10−11.4 × 10−16.4 × 10⁻³
8Nar8.11.91 × 10−32.35 × 10−29.28 × 10−53.35 × 10−59.6 × 10−27.8 × 10−23.1 × 10−11.1 × 10⁻²
8.21.57 × 10−32.82 × 10−25.17 × 10−52.15 × 10−57.9 × 10−29.4 × 10−21.7 × 10−17.2 × 10⁻³
9Chemy9.1 3.29 × 10−22.11 × 10−44.70 × 10⁻⁵ 1.1 × 10−17.0 × 10−11.6 × 10⁻²
9.2 3.17 × 10−26.16 × 10−52.05 × 10⁻⁵ 1.1 × 10−12.1 × 10−16.8 × 10⁻³
10Hidikus10.11.03 × 10−33.42 × 10−23.46 × 10−53.58 × 10−55.2 × 10−21.1 × 10−11.21.2 × 10−2
10.21.16 × 10−31.84 × 10⁻² 8.57 × 10−55.8 × 10−26.1 × 10⁻² 2.9 × 10⁻³
11Digoria118.98 × 10−44.99 × 10−26.40 × 10−51.24 × 10−54.5 × 10−21.7 × 10−12.1 × 10−14.1 × 10⁻³
12.12.17 × 10−34.64 × 10−22.76 × 10−58.98 × 10−51.1 × 10−11.5 × 10−19.2 × 10−23.0 × 10⁻³
12.21.47 × 10−34.02 × 10−22.26 × 10−43.17 × 10−57.3 × 10−21.3 × 10−17.5 × 10−11.1 × 10⁻²
12Upper Dzuarikau12.3 5.46 × 10−25.40 × 10−43.52 × 10⁻⁵ 1.8 × 10−11.81.2 × 10−2
13Suargom138.63 × 10−41.31 × 10−28.10 × 10−51.26 × 10−54.3 × 10−24.4 × 10−22.7 × 10−14.2 × 10⁻³
Disclaimer/Publisher’s Note: The statements, opinions and data contained in all publications are solely those of the individual author(s) and contributor(s) and not of MDPI and/or the editor(s). MDPI and/or the editor(s) disclaim responsibility for any injury to people or property resulting from any ideas, methods, instructions or products referred to in the content.

