Article

Interannual Evolution Characteristics of the Carbon and Nitrogen Footprints of Maize Production in Inner Mongolia

1
College of Agronomy, Inner Mongolia Agricultural University, Hohhot 010019, China
2
Inner Mongolia Academy of Agricultural and Animal Husbandry Sciences, Hohhot 010031, China
3
College of Public Administration, Inner Mongolia University, Hohhot 010021, China
*
Author to whom correspondence should be addressed.
Agronomy 2024, 14(6), 1273; https://doi.org/10.3390/agronomy14061273
Submission received: 29 April 2024 / Revised: 10 June 2024 / Accepted: 11 June 2024 / Published: 12 June 2024
(This article belongs to the Section Soil and Plant Nutrition)

Abstract

:
As the third-largest maize-producing province in China and a typical arid and semi-arid region, quantitatively evaluating the carbon and nitrogen footprints of maize production and their dominant factors is of great significance in guiding the high-yield, low-carbon, and sustainable development of maize production in the Inner Mongolia Autonomous Region. This study quantitatively evaluated the interannual evolution characteristics of the carbon and nitrogen footprints in maize production and their dominant factors in Inner Mongolia from 2003 to 2022 based on statistical yearbook data and emission parameter models. The results showed that from 2003 to 2022, the maize planting area, yield, and total yield in Inner Mongolia all increased, with an average annual increase of 97 kg ha−1 in yield and 1.23 × 10⁶ Mg in total yield. The carbon and nitrogen footprints of Inner Mongolia maize production over the past 20 years had overall decreasing trends, while the nitrogen fertilizer bias productivity, net ecosystem carbon balance, and sustainability index had increasing trends. Carbon footprint reduced by an average of 5.2 kg CO2 eq Mg−1 per year, and nitrogen footprint reduced by an average of 0.21 g N eq kg−1 per year. Currently, the transportation and production of fertilizer and field application of N fertilizer are the main controlling factors of GHG emissions from maize production. NO3-N, NH4+-N leaching, and NH3 volatilization from field application of N fertilizer are the main sources of reactive N losses. The application of simplified processes, such as phased regulation of nitrogen and controlled-release fertilizers, as well as conservation tillage, have broad prospects for emission reduction in maize production in Inner Mongolia.

1. Introduction

Agricultural production is an important source of carbon and nitrogen emissions [1]. How to effectively reduce carbon and nitrogen emissions from farmland ecosystems and lower the environmental costs of agricultural production have become the focus of attention for governments and scientists. Maize is one of the primary food crops and the mainstay of food security in China [2,3]. The Inner Mongolia Autonomous Region is the third-largest maize-producing province in China, with its maize sown area accounting for about 9.7% of the national maize sown area in 2022, and total production accounting for about 11.2% of the national total [4,5]. As a typical cold and arid region, Inner Mongolia has long relied on large amounts of water and fertilizer inputs for maize production. The greenhouse effect and the eutrophication of water bodies are made worse by excessive nitrogen fertilizer input, which also results in large greenhouse gas emissions and a loss of active nitrogen. Consequently, studying the nitrogen and carbon footprints of maize production has significant ramifications for Inner Mongolia’s agricultural development.
Studies have shown that agricultural sources account for about 14% of total anthropogenic greenhouse gas emissions [6]. In China, agriculture greenhouse gas emissions made up 17% of the total national greenhouse gas emissions [7]. The life cycle assessment method focuses on tracking and quantifying the environmental effects of a crop throughout its life cycle, from processing and transportation of agricultural inputs to field production and post-harvest [8,9]. In recent years, with the proposal of “carbon peak”, “carbon neutral”, and other related strategies, the assessment of carbon and nitrogen footprints by the LCA method has been widely used in the evaluation of agricultural environmental effects. GHG emissions from agricultural inputs include direct and indirect emissions. Direct emissions refer to the total emission of N2O resulting from the application of nitrogen fertilizer in the field, while indirect emissions are the total greenhouse gas emissions released during the farming process such as plowing, planting, management, and harvesting, as well as agricultural capital inputs. The carbon footprint is the ratio of the GHG emissions per unit area to the unit yield and is often expressed in terms of the carbon dioxide equivalent per ton of kernels of maize [10,11]. Based on the life cycle assessment method, the annual carbon footprint of maize production in China from 2004 to 2013 was 400 kg CO2 eq Mg−1, and the overall trend for greenhouse gas emissions was rising. Among them, the southern provinces have greater carbon footprints in grain crops than the northern provinces. The carbon footprint per unit area and greenhouse gas emissions of maize production in China showed a significant increase from 2005 to 2015 [12]. Simulation analysis confirmed that reducing the planting area and optimizing fertilizer and pesticide inputs can effectively reduce the carbon footprint of maize production [13]. The carbon footprint per unit area of maize production in the Shanxi province, China, showed an increasing trend from 2004 to 2013, with fertilization, soil N2O emissions, and irrigation accounting for over 85% of the total greenhouse gas emissions. Reducing the carbon footprint of maize cultivation in the Shanxi province could be accomplished in part by enhancing organic carbon sequestration and applying reasonable fertilizer [14]. Ramaa et al. found that 77% of the total agricultural greenhouse gas emissions came from carbon emissions generated during fertilizer production and transportation when analyzing the carbon emission structure of tropical crop production, causing great pollution to the atmospheric environment [7]. Fertilizers account for 90% of the total carbon input in the carbon footprint composition of maize production in Northeast China, according to an analysis of the production of the carbon footprint of major grain crops in the Heilongjiang, Jilin, and Liaoning provinces of China between 2004 and 2013 [15].
The loss of active nitrogen resulting from agricultural input is known as indirect active nitrogen loss, while the loss of active nitrogen resulting from fertilization that causes N2O emissions, NH3 volatilization, NO3-N, and NH4+-N loss is known as direct active nitrogen loss; these losses combined make up the cumulative active nitrogen loss in agricultural processes. The term “nitrogen footprint” refers to the amount of active nitrogen lost during agricultural yield production [16]. The nitrogen footprint of rice, according to the life cycle assessment method, varies depending on whether it is early, late, or double-cropped [17]. The nitrogen footprint of the rice and wheat production system in the middle reaches of the Yangtze River is 7.57 kg N eq ha−1 per unit area [18], while the nitrogen footprint of grain production in Mexico is relatively low [19]. With varying nitrogen application rates, summer maize production has a very variable nitrogen footprint. The nitrogen application rate of 100–330 kg ha−1 corresponds to a nitrogen footprint range of 5.4–17.6 g N eq kg−1. It is evident that the primary source of nitrogen footprint in maize production is the leaching of nitrate nitrogen [20]. The nitrogen footprint of maize production can be influenced by different fertilization depths, and deep fertilization within a specific range lowers both the nitrogen footprint and cumulative active nitrogen loss [16].
Agricultural soil carbon content depends on the input and output of soil organic matter and is an important indicator of soil fertility. The input of soil organic matter mainly includes crop roots, crop residues, and organic fertilizers [21]; the output is mainly through the decomposition and transformation of soil organic matter [22]. Studies have shown that among the agricultural production inputs, fertilizers have both positive and negative effects on the increase in carbon content in agro-ecosystems. An integrative analysis carried out by Ni et al. [23] showed that nitrogen fertilizer inputs increased the aboveground biomass of the plant and enhanced root secretions, thereby increasing the belowground carbon inputs. It has also been found that the application of chemical fertilizers enhanced soil respiration and related enzyme activities, increasing the emission of CO2 and greenhouse gases from farmland, which in turn led to a decrease in soil organic carbon stocks and an increase in soil carbon export [24]. Yang et al. [25] used the net ecosystem carbon balance and sustainability index to quantitatively analyze the changes in the carbon content of maize production systems in the Huanghuaihai region and the sustainable outlook.
To summarize, previous research on carbon and nitrogen footprints at the national and regional levels has clarified the characteristics and key factors influencing agricultural production carbon and nitrogen footprint variations in corresponding regions; however, there is a dearth of quantitative studies on the interannual evolution of the carbon and nitrogen footprints in maize production in Inner Mongolia, and the key determinants are still unknown. Thus, this study is based on statistical yearbook data, using the life cycle assessment method, the nitrogen loss empirical model, and the carbon balance method, combined with regional characteristics, to analyze the changes in carbon, nitrogen footprint, and the net ecosystem carbon balance of maize production in the Inner Mongolia Autonomous Region from a temporal perspective, providing a theoretical basis for supporting high-yield, low-carbon, and green sustainable development of Inner Mongolia’s maize production.

2. Materials and Methods

2.1. Area, Crops, and Data Sources

The Inner Mongolia Autonomous Region is located in the mid-latitude interior, stretching diagonally from northeast to southwest in a narrow and elongated shape, with a temperate continental monsoon climate for most of the region. There is sufficient sunshine, a large variation in temperature between day and night, a high degree of precipitation fluctuation, and a short frost-free period. This study used spring maize, one of the main crops in Inner Mongolia.
Based on the China Rural Statistical Yearbook, the National Compendium of Cost and Benefit Information on Agricultural Products, and the Inner Mongolia Statistical Yearbook, data related to maize production in Inner Mongolia from 2003 to 2022 were collected and compiled on production, planted area, fertilizer usage, pesticides, diesel fuel, mulch film, seeds, and labor.

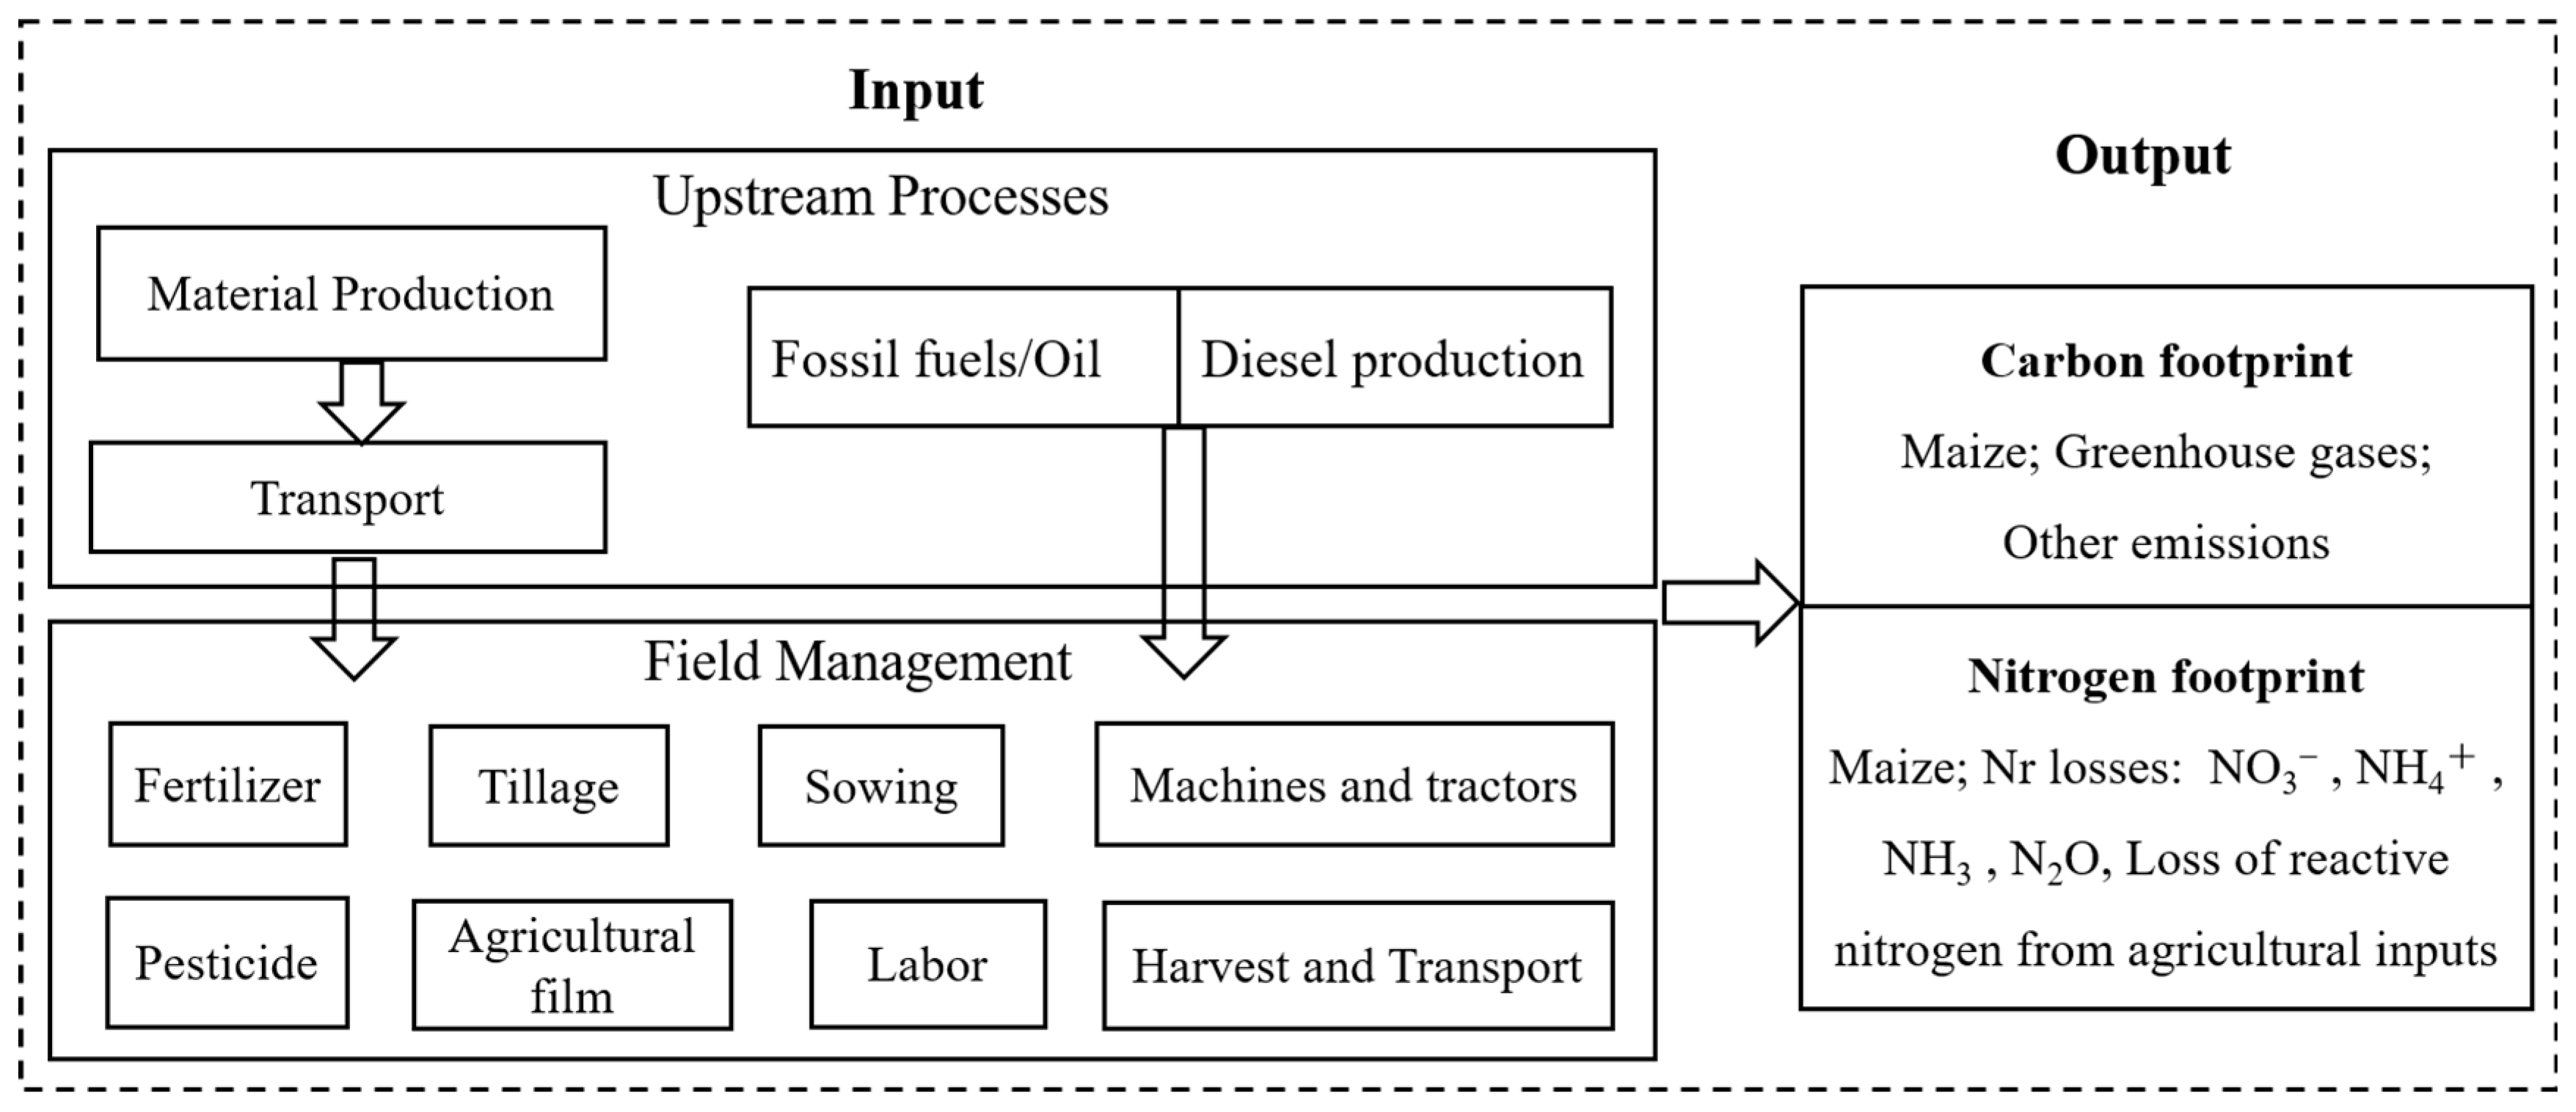
2.2. System Boundaries and Emission Factors

Using the LCA approach, this pilot study looked at the production and transportation of agricultural inputs including fertilizers and pesticides, irrigation management, as well as other field operations such as tillage and harvesting. The carbon footprint system boundaries of the experiment included the following: the input of the whole system mainly reflected in the production and transportation of fertilizers and pesticides, the use of electricity in irrigation, the field application of fertilizers, machinery fuel consumption, and other field management throughout the reproductive process, and the output mainly reflected in the seed yield per unit of area and the GHG emissions caused by the various production processes within the system boundary (Figure 1). The nitrogen footprint system boundaries were as follows: the input component was mainly the production and transportation of fertilizers and pesticides, the field application of fertilizers, machinery fuel consumption, and mulch and seeds, and the output was reflected in seed yield per unit area, reactive N losses including NO3-N, NH3, NH4+-N, and field N2O emissions from N fertilizer application (Figure 1). As agricultural machinery, pumps, and other related equipment were reusable, their production, delivery, and labor force were excluded from the system.
The functional units used in this study were unit area (per hectare) and unit yield (per ton) [26]. The key environmental impact indicators were GHG emissions and carbon footprint, reactive nitrogen loss and nitrogen footprint, net ecosystem carbon balance, and the sustainability index caused by various inputs and management measures during maize production.
The China Core Life Cycle Database (CLCD), IPCC Guideline No. 1, National Development and Reform Commission (NDRC), Ecoinvent database, and the related classic literature were consulted to obtain emission factors such as agricultural inputs (Table 1). The LCA method was used to calculate GHG emissions and reactive nitrogen losses from maize production.

2.3. Indicator Accounting and Methods

2.3.1. Carbon Footprint

This study calculated the GHG emissions and carbon footprint of the whole life cycle of maize production using the LCA method. The GHG emissions of the whole life cycle consisted of two parts: (1) CO2 emissions from all material inputs in the production and transportation stages, calculated by emission factors multiplying inputs; (2) total N2O emissions from field application of nitrogen fertilizer. The relevant calculation formulas are as follows [25,29,30,31]:
CF = GHG/Y
GHG = GHGinput + TotalN2O × 44/28 × 298
GHG input = i = 1 n m i β i
TotalN2O = N2Oemission + 1% × NH3 volatilization + 2.5% × NO3leaching
N2Oemission = 0.68 × e(0.0035 × Nrate)
NO3leaching = 2.38 × e(0.0041 × Nrate)
NH3 volatilization = 2.53 + 0.058 × Nrate
Nsurplus = N − Nuptake
Nuptake = Y × 0.86/0.845 × seed nitrogen uptake
where CF denotes the carbon footprint per unit mass of maize produced (kg CO2 eq kg−1); Y denotes the yield per unit area produced (kg ha−1); GHG denotes the GHG emissions over the whole life cycle (CO2 eq ha−1); GHG input denotes the GHG emissions (kg CO2 eq ha−1) caused by the production of various agricultural materials (fertilizers, pesticides, diesel fuel, and mulch film); mi denotes the amount of a certain agricultural input (kg ha−1); βi denotes the GHG emission coefficients; total N2O denotes the reactive nitrogen emissions caused by the application of fertilizers into the farmland, in which N2O emission, NO3leaching, and NH3 volatilization are the N2O emission, nitrate nitrogen leaching and ammonia volatilization caused by fertilizer application to the environment, respectively (kg N ha−1); N is the pure nitrogen content of fertilizers applied at the stage of crop cultivation, respectively (kg ha−1); Nsurplus is nitrogen surplus (kg N ha−1); 0.86/0.845 is the yield conversion value; and seed nitrogen uptake is 0.198 kg N kg−1 [24].

2.3.2. Nitrogen Footprint

Based on the LCA methodology, the nitrogen footprint is converted from different forms of reactive nitrogen to eutrophication potential for summation [17,32,33,34]:
NF = (NFtotal/Y)/1000
NFtotal = NFinputs + NFN2O + NFNH3 + NFNH4+ + NFNO3
N F i n p u t s = i = 1 n m i α i
NFN2O = TotalN2O × 44/28 × 0.476
NFNH3 = NH3 volatilization × 17/14 × 0.833
NFNH4+ = N × γ × 18/14 × 0.786
NFNO3 = N × σ × 62/14 × 0.238
PFPN = Y/N
where NF denotes the nitrogen footprint of producing a unit mass of maize (g N-eq kg−1); Y denotes the yield per unit area (kg ha−1); NFtotal denotes the reactive nitrogen loss considered during the whole life cycle (kg N-eq ha−1); 1000 is the unit conversion coefficient; NFinputs is the indirect reactive N loss caused by agricultural inputs lost during production, transportation, etc.; NFN2O, NFNH3, NFNH4+, and NFNO3 are reactive N lost by the crop over the whole life cycle (kg N eq ha−1); N denotes the amount of nitrogen applied (kg); σ denotes the NO3 leaching coefficient of maize during reproduction, which is 0.226 [35]; 62/14 and 18/14 are the ratios of molecular weights of NO3-N and NH4+-N; and 0.476, 0.833, 0.786, and 0.238 are the eutrophication potential coefficients of N2O, NH3, NH4+ and NO3, respectively [36].

2.3.3. Net Ecosystem Carbon Budget

The Net Ecosystem Carbon Budget was used to represent the change in soil organic carbon content. The formula is as follows [37]:
NECB = Cinput − Coutput
Cinput = CFRW + CNPP
Coutput = CHR + CGHG= CHR + GHG × 12/44
where Cinput is the carbon input, including external input and crop sequestration input. In this study, the external input was only considered as the carbon input of straw returned to the field [38]. CFRW (residues of straw in the field) is the carbon content of the residues of straw in the field after harvest (kg C ha−1), which was calculated as the carbon content of the crop multiplied by the amount of straw returned to the field. The amount of straw returned to the field was estimated by the harvest index (HI) and the stover return rate for maize production in Inner Mongolia was estimated. The harvest index, HI, is the ratio of dry matter production of kernels to total aboveground dry matter production; HI for maize production in Inner Mongolia was 0.443 [8]. The stover return rate was 24.57% [39]. The biomass carbon content coefficient was taken as 0.45 [40]. NPP (kg ha−1) is net primary productivity. CNPP is net primary productivity carbon sequestration (kg C ha−1), which was calculated by the following equation.
CNPP = CG + CS + CR + CER + CL
CG = YP × 0.45
CS = YP × (1 − HI)/HI × 0.45
CR = YP/(S/R × HI) × 0.45
CEER = CR × YER
where CG, CS, CR, and CER are the crop grain, stover, root, and inter-root carbon contents (kg C ha−1), respectively, which are the biomass of the plant grain, stover, roots, and inter-roots multiplied by the carbon concentration; YP is the aboveground dry matter yield of maize; YS is the amount of maize stover in kg ha−1; S/R is the crown/root ratio, and YER is the extra root carbon relative to the recoverable root factor (the inter-root deposition carbon)—the S/R and YER conversion factors for maize were 5.60 and 0.65, respectively [41,42]; and CL is the carbon content of maize residues during the reproductive period (kg C ha−1), and we assumed that the residue biomass accounted for 5% of the aboveground biomass.
Coutput is the carbon output, where CHR is harvested grain carbon and stover carbon (kg C ha−1). CGHG is the total field GHG carbon emissions, including indirect carbon emissions from various agricultural inputs (mulch, fertilizer, machinery, etc.) and total field N2O emissions, i.e., GHG carbon emissions from maize production over its entire lifecycle. The value 12/44 refers to the conversion between the CO2 and C coefficient.

2.3.4. Sustainability Index

The productivity and carbon allocation of the maize production system are quantified by the carbon-based sustainability index (SI), which is the ratio of the difference between carbon inputs and outputs to total carbon inputs. SI is used to assess the sustainability of the maize production system and calculated using the following formula [25,43]:
SI = (Cp − CE)/CE
CP = CG + CS + CR + CER
where CP refers to the total amount of carbon produced by maize, including carbon contents of maize kernels (CG), stover (CS), roots (CR), and inter-roots (CEER); CE is the GHG emissions calculated using the LCA method. Both CP and CE were measured in kg C ha−1.

2.4. Statistical Analysis

An analysis of variance (ANOVA) was performed using SPSS 22 (IBM, Inc., Armonk, NY, USA). The differences among means of the experimental treatments were separated using the least significant difference (LSD) test at a 0.05 probability level. Origin 2019 (Origin Lab, Northampton, MA, USA) software was used to plot graphs. Microsoft Excel 2019 (Redmond, WA, USA) was used to organize the data and generate tables.

3. Results

3.1. Interannual Variation in Maize Sowing Area and Yield in Inner Mongolia

From 2003 to 2022, the maize planting area, yield, and total production in the Inner Mongolia Autonomous Region all increased. Yield and total production showed a linear growth trend with the advancement of the year, which conformed to the linear relationship y = 1.23x − 2456.89 and y = 0.097x − 188.54, respectively (Figure 2). During the 20-year period, the planting area expanded by 163.67%, the average yield increased by 32.25%, and total yield increased by 248.64%. The average annual yield increase was 97 kg ha−1 and the average annual total yield increase was 1.23 million tons (Table S1).

3.2. Characteristics of Interannual Variation in Maize Production Inputs in Inner Mongolia

With the advancements in dense planting and high-yield, single-grain precision sowing, water and fertilizer integration, and complete mechanization technologies, inputs such as farm materials and costs in the maize production chain are constantly changing, pushing the maize yield to increase continuously. From 2003 to 2022, nitrogen fertilizer inputs in maize production in Inner Mongolia showed a trend of first increasing and then decreasing, while phosphorus fertilizers and potash fertilizers inputs showed a trend of increasing. The average inputs of nitrogen, phosphate, and potash fertilizers were 211.1 kg ha−1, 107.8 kg ha−1, and 26.4 kg ha−1, respectively (Table 2). Pesticide, mulch, and diesel inputs all showed an increasing trend, while seed use and labor showed decreasing trends. There were large interannual variations in the various production inputs, with the average inputs of pesticide, mulch, diesel, seed, and labor being 4.1 kg ha−1, 12.2 kg ha−1, 76.0 L ha−1, 37.1 kg ha−1, and 71.2 day ha−1, respectively.
A principal component analysis was conducted to analyze the indicators of maize production and related cost inputs in Inner Mongolia for 20 years (Figure 3a). The results showed that the inputs of phosphate fertilizer, potash fertilizer, agricultural film, pesticide, and mechanical diesel were significantly positively correlated with seed yield. Phosphate and potash fertilizer showed a stronger correlation with yield in the direction of PC1. This is because in recent years, with the promotion of soil testing and formula fertilization, the nutrient distribution ratio in maize production became more reasonable, the application of phosphorus and potassium fertilizer received more attention, and inputs continue to increase. At the same time, the application of new planting patterns and higher degrees of mechanization resulted in gradual increases in the amount of mechanical fuel, agricultural film, and pesticides. The correlation between the amount of nitrogen fertilizer and yield is not significant, mainly due to the nitrogen fertilizer’s trend of first increase then decrease, and the small overall changes in input. The contribution of nitrogen fertilizer to yield is mainly reflected in the optimization of application. Seed and labor inputs were significantly negatively correlated with yield. This was mainly due to the single-grain precision sowing technology and increased mechanization level of maize, which greatly reduced seed dosage and labor inputs.

3.3. Temporal Changes in Carbon Emissions and Carbon Footprint of Maize Production

As the year went by, the overall carbon footprint of maize production in Inner Mongolia showed a decreasing trend, which was consistent with the linear relationship y = −5.23x + 1054.33. The maximum carbon footprint was in 2007 at 606.4 kg CO2 eq Mg−1, while the minimum was in 2021 at 445.2 kg CO2 eq Mg−1. The average carbon footprint reduction was 5.2 kg CO2 eq Mg−1 per year. GHG emissions showed a wave-like trend, with two obvious peaks during the 20-year period, corresponding to 2007 and 2016. The highest emission in 2016 was 3733.9 kg CO2 eq ha−1. The two troughs corresponded to 2013 and 2021, with emissions of 31,170.0 kg CO2 eq ha−1 in 2021. Maize production average GHG emissions from 2003 to 2022 were 3342.3 kg CO2 eq ha−1. The average amount of GHG emissions from each step in the maize production chain is in the order of the following: fertilizer production and transportation > nitrogen fertilizer field application > diesel consumption of agricultural machinery > pesticide production and transportation > seed > labor > mulch. GHG emissions from fertilizer production and transportation and field application of nitrogen fertilizer were the two major sources of total GHG emissions, accounting for 84.7% of the total GHG emissions. With 8.3% of the total, fuel consumption by agricultural machinery was the third-highest. Other processes accounted for 7.0% of the total GHG emissions (Figure 4).
Correlation analysis showed that carbon footprint was significantly positively correlated with the production, transportation, and field application of N fertilizers, total greenhouse gas emissions, seed dosage, and labor. GHG emissions and total emissions caused by N fertilizers and field application showed stronger correlations with carbon footprint in the direction of PC2, and the correlation between seed dosage, labor, and, carbon footprint was stronger in the direction of PC1. The carbon footprint was significantly negatively correlated with yield, phosphorus and potassium fertilizer, pesticide, diesel fuel, and agricultural film usage, while GHG was significantly positively correlated with yield (Figure 3b). It can be seen that the input of agricultural materials such as nitrogen fertilizer directly affected greenhouse gas emissions, while the input of agricultural materials promoted yield improvement, which resulted in a reduction in carbon footprint when the rate of yield improvement outpaced the rate of carbon emission. Therefore, ongoing optimization of maize production management is necessary to achieve high yield and low emissions.

3.4. Characterization of Interannual Variation in Reactive Nitrogen Losses and Nitrogen Footprint of Maize Production

The total nitrogen footprint of maize production in Inner Mongolia decreased as the year went on, and followed the linear relationship between nitrogen footprint and year y = −0.21x + 440.71. The nitrogen footprint was highest in 2007 at 19.2 g N eq kg−1, and lowest in 2021 at 12.9 g N eq kg−1, with an average year reduction of 0.21 g N eq kg−1. During the 20-year period, reactive nitrogen loss had a wave-like changing pattern, with two distinct peaks corresponding to 2007 and 2016, a maximum of 113.9 kg N eq ha−1 in 2016 and a minimum of 94.7 kg N eq ha−1 in 2021, and an average reactive nitrogen loss of 101.5 kg N eq ha−1 from 2003 to 2022. For the composition of reactive N losses, at an average of 49.6%, NO3-N leaching was the main source of reactive N losses, followed by NH4+-N loss at 36.8%, and NH3 volatilization at 12.1%, while the total reactive nitrogen losses from agricultural inputs and nitrous oxide emissions in maize production was only 1.5%. The overall interannual change in N fertilizer bias productivity of maize production showed an increasing trend, consistent with the linear relationship y = 0.41x − 788.88. N fertilizer bias productivity had a minimum of 24.9 kg kg−1 in 2007 and a maximum of 37.6 kg kg−1 in 2021, with an average annual increase of 0.41 kg kg−1 (Figure 5).
The correlation analysis of the nitrogen footprint and its components revealed that the nitrogen footprint was significantly positively correlated with N surplus, NO3-N, NH4+-N leaching, NH3 volatilization, and N2O emission, and significantly negatively correlated with N fertilizer bias productivity, yield, and loss of reactive N due to agricultural inputs (Figure 6a). It is evident that the application of N fertilizer can be optimized to reduce ammonium N, nitrate N leaching, and ammonia volatilization through the measures of controlled-release fertilizer or fertilizer split follow-up application to reduce N surplus, improve N fertilizer bioproductivity, and ultimately achieve the reduction in nitrogen footprint.

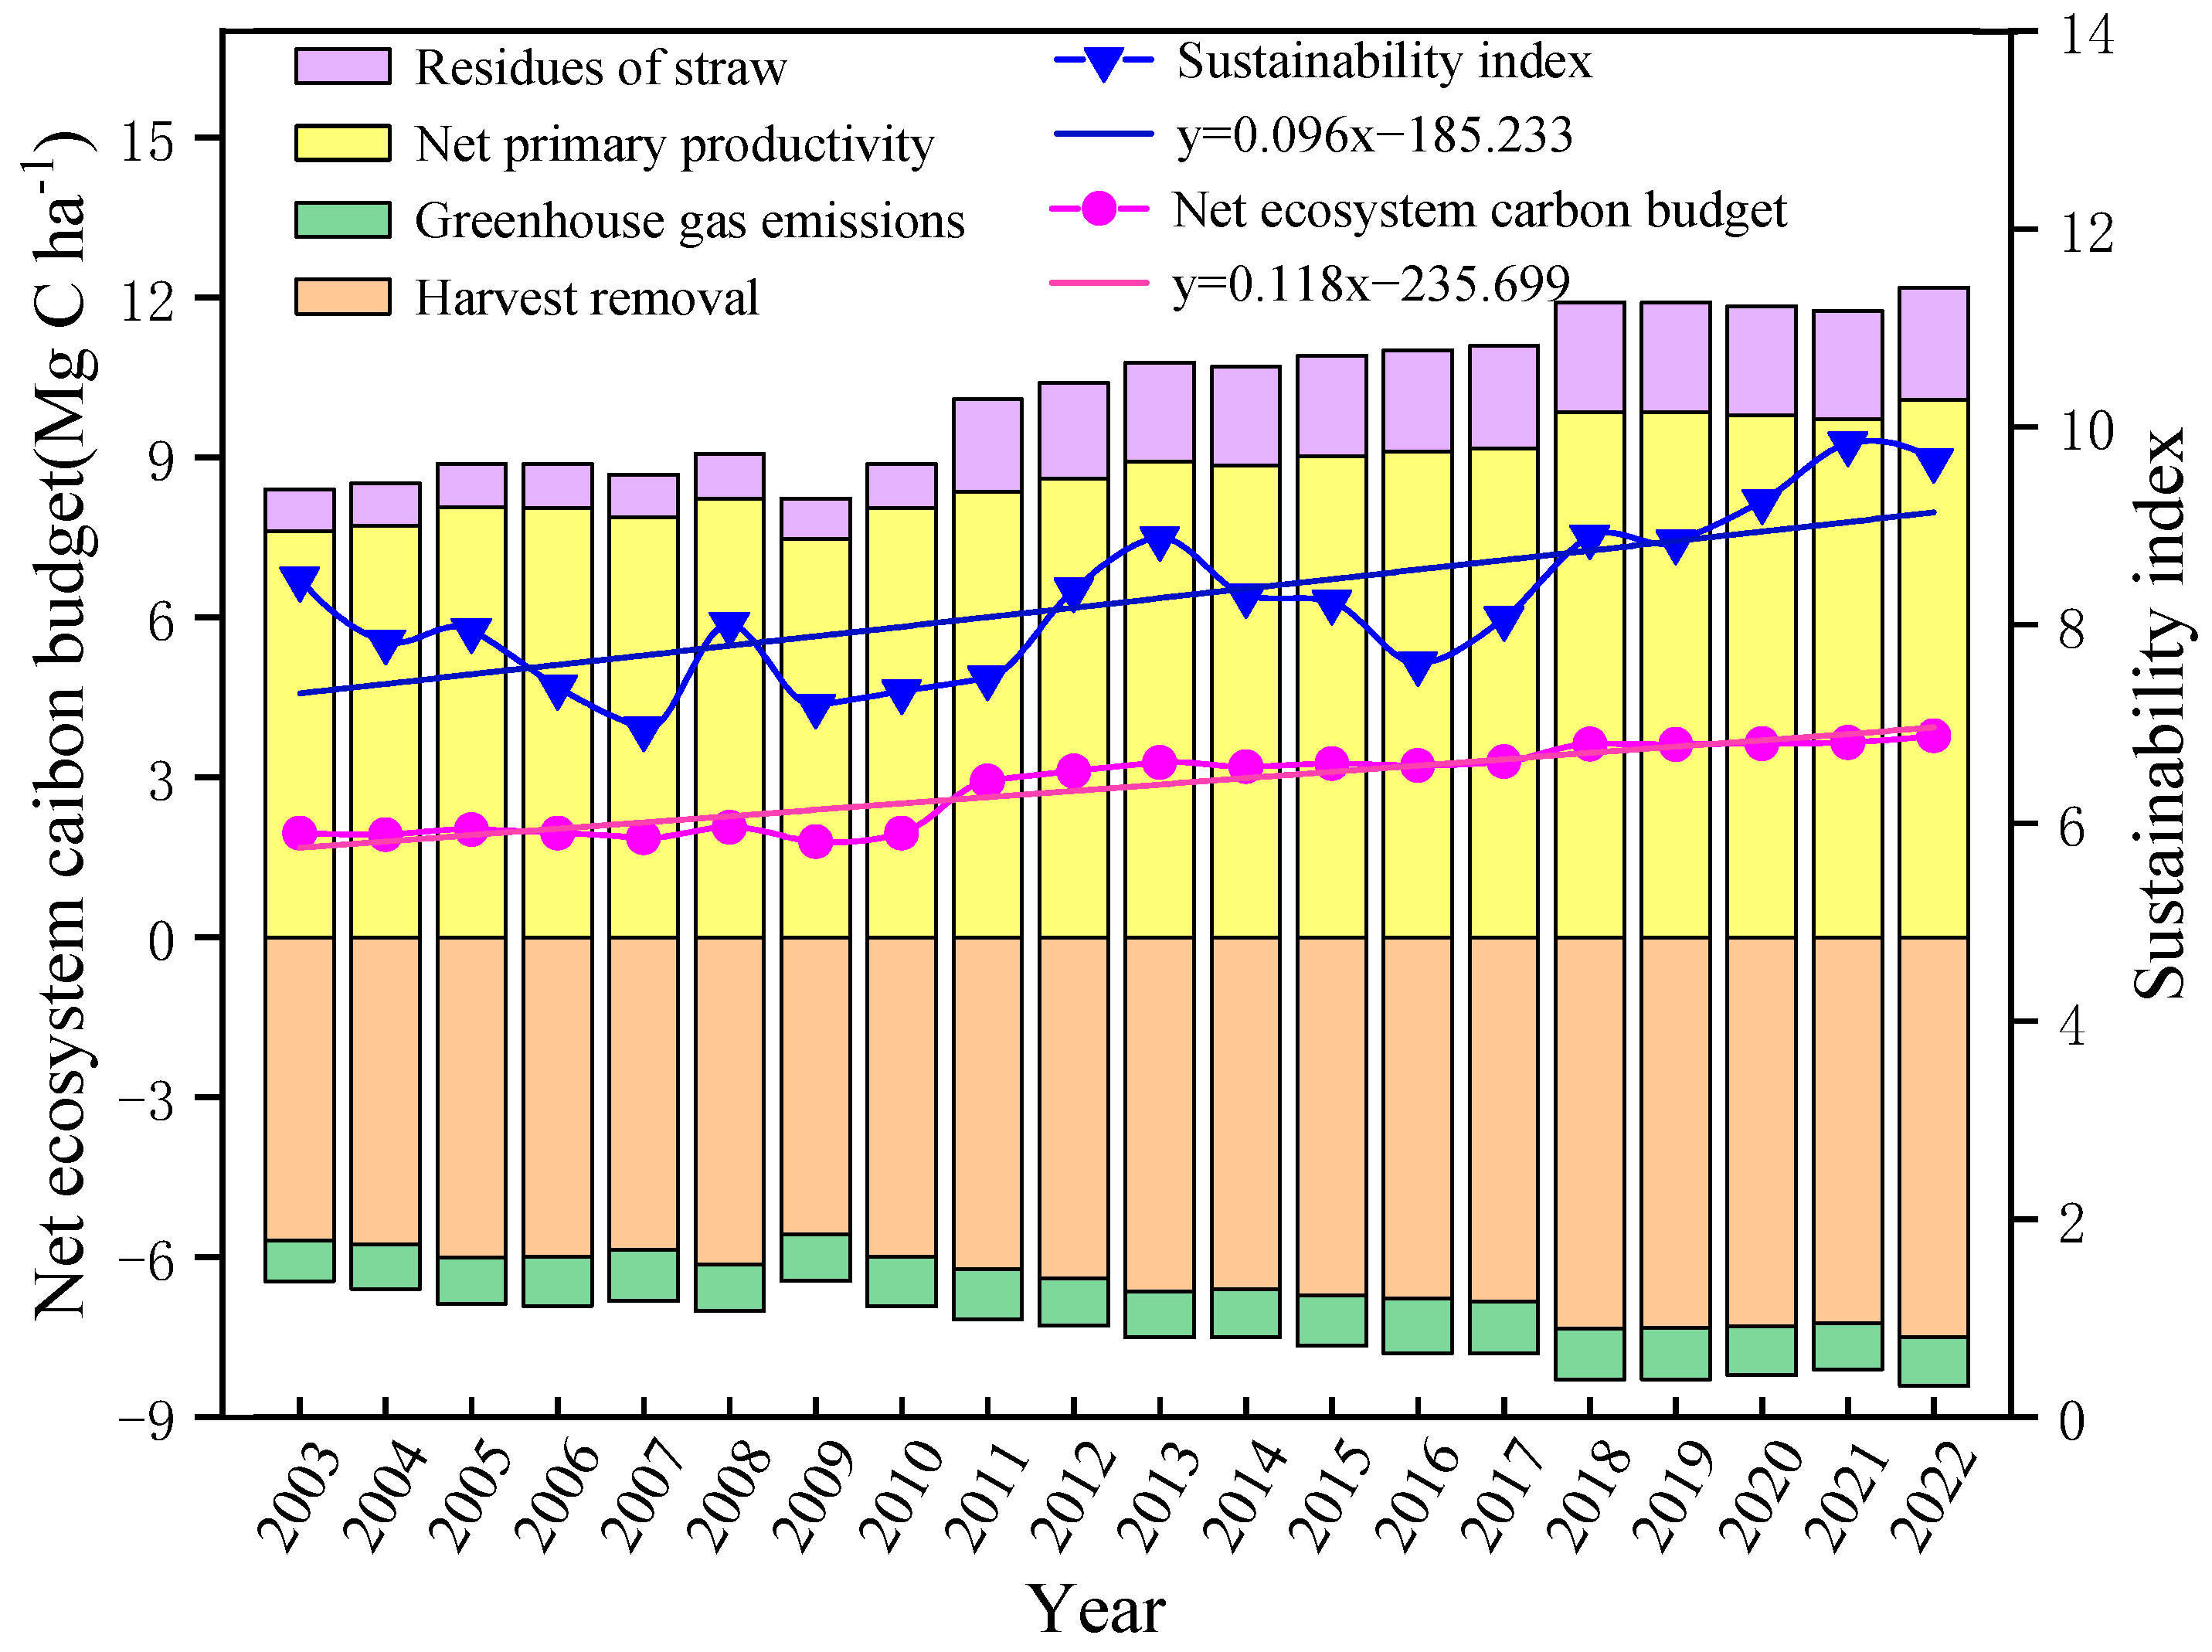
3.5. Characterizing Interannual Variability in the Net Ecosystem Carbon Balance and Sustainability Index of Maize Production

The carbon input to maize production in Inner Mongolia was the sum of the carbon input from straw return and net primary productivity sequestration, which accounted for 9.2% and 90.8%, respectively, from 2003 to 2022, while 87.7% and 12.3% of the carbon output came from harvested removed carbon and greenhouse gas emission carbon, respectively. Both the carbon input and carbon output reached the highest levels in 2022, at 11.1 Mg C ha−1 and 8.4 Mg C ha−1. As the year progressed, the net ecosystem carbon balance of maize production showed an overall upward trend, peaking at 2.7 Mg C ha−1 in 2022 and conforming to the linear relationship y = 0.043x − 85.29, with an average annual increase in carbon sequestration of 0.043 Mg C ha−1 (Figure 7).
The sustainability index showed an overall upward trend with interannual changes, conforming to the linear relationship y = 0.096x − 185.23. With an average annual increase of 0.096, the minimum of 7.0 was in 2007. In 2020 it was over 9.0, and reaching a maximum of 9.8 in 2021. This indicates that the production capacity of the maize production system of Inner Mongolia has been increasing with interannual changes. The correlation analysis of the net ecosystem carbon balance and its components showed that the net ecosystem carbon balance was significantly and positively correlated with the carbon content of phosphorus and potassium fertilizers, pesticides, mulch, and fuels, net primary productivity, and the sustainability index, and significantly and negatively correlated with carbon and nitrogen footprints and artificial seed carbon. The carbon and nitrogen footprints were significantly and negatively correlated with the sustainability index (Figure 6b).

4. Discussion

From 2003 to 2022, Inner Mongolia’s maize planting area, yields, and total yields all increased. Nitrogen fertilizer and pesticide inputs followed a pattern of first increasing and then decreasing, whereas phosphorus fertilizer, potash fertilizer, mulch film, and diesel fuel inputs climbed year after year, while labor and seeds inputs declined. The ongoing improvement of mechanization levels, as well as small farmers’ transition from manual to mechanical harvesting, were responsible for the increase in production fuel inputs and the obvious reduction in labor inputs. At the same time, the promotion of single-grain precision sowing technology reduced both the quantity and cost of seed sowing. In addition, the popularization and application of innovative technologies such as conservation tillage mode, shallow drip irrigation, and water–fertilizer integration, as well as the development of new types of fertilizers and the application optimization reduced nitrogen fertilizer dosage, increased phosphorus and potassium fertilizer, improved fertilizer utilization rate, contributing to the continued breakthrough and improvement of yield levels.
Inner Mongolia’s maize production area is located in the transition zone of Daxinganling to the northeast plains, has relatively thin soil, and is typically cold and dry. Maize production has traditionally relied heavily on water and fertilizer inputs, particularly nitrogen fertilizer inputs. Excessive nitrogen fertilizer inputs not only fail to increase yield but also result in nitrogen surpluses, which aggravate the environmental costs. Between 2003 and 2022, the greenhouse gas emissions from maize production in Inner Mongolia showed a wave-like trend, with an average greenhouse gas emissions of 3381.9 kg CO2 eq ha−1, 3.8% lower than the national average [29]. Two significant peaks appeared in 2007 and 2016, followed by a clear decline, mainly due to the implementation of “formula fertilization by soil testing” and “high-yield creation activities” in 2006, and the “zero growth in fertilizer and pesticide use by 2020” target proposed by the Ministry of Agriculture and Rural Affairs in 2015. The implementation of these policies, optimized nitrogen, phosphorus, and potassium fertilizer application ratios, together with better seed varieties and better planting techniques increased maize yields in the province. The greenhouse gas emissions and reactive nitrogen loss exhibited a year-on-year decline in the positive trend after peaking. With an average carbon footprint of 526.6 kg CO2 eq Mg−1, the overall carbon footprint of maize production in Inner Mongolia showed a decreasing trend, which was higher than that of developed countries like Germany (420 kg CO2 eq Mg−1) and the United States (231 kg CO2 eq Mg−1) but lower than China’s average level of 621 kg CO2 eq Mg−1 [26,44]. This study found a significant positive correlation between greenhouse gas emissions and nitrogen fertilizer production, transportation, and field application of nitrogen fertilizer. Fertilizer production and transportation and field application of nitrogen fertilizer accounted for 84.7% of the total GHG emissions, followed by machinery fuel consumption accounting for 8.3%. These are the primary sources of carbon footprint and greenhouse gas emissions; these findings are in line with the results of previous studies [45,46]. Therefore, the key to lowering carbon emissions in maize production is to optimize fertilizer application and use less mechanical fuel. Fertilizer input can be decreased and yield can be increased by using new controlled-release fertilizers and phase regulation of conventional fertilizers to meet the nutrient requirements of maize growth. This will lower the carbon emissions per unit yield of farmland while also increasing yield [47,48]. Furthermore, it is crucial to increase the promotion of conservation agriculture practices given the estimated 8 million hectares of conservation agriculture in China and the 1 million hectares of conservation farming in Inner Mongolia. Conservation tillage techniques not only increase soil fertility but also lower carbon emissions from mechanical fuel use by using less or no tillage [49,50].
As the year progressed, the nitrogen fertilizer bias productivity of maize production in Inner Mongolia increased, with an average annual increase of 0.41 kg kg−1. The overall nitrogen footprint decreased, with an average nitrogen footprint of 10.6 g N eq kg−1. In 2022, the nitrogen footprint was lowest at 8.55 g N eq kg−1, which was close to the nitrogen footprint of dry-crop maize recorded by WuPeng et al. at 8.24 g N eq kg−1 [16]. The high nitrogen footprint prior to 2016 was mainly caused by high reactive N losses as a result of significant water and fertilizer inputs in the irrigation-dominated region of Inner Mongolia. Lian Bingrui et al. [51] found that ammonia volatilization and nitrate–nitrogen–ammonium nitrogen leaching from the field application of nitrogen fertilizers were the main emission sources of reactive nitrogen loss, which was consistent with the results of this study. The percentages of nitrate–nitrogen, ammonium–nitrogen leaching, and ammonia volatilization due to fertilizer application in maize production in total reactive nitrogen loss were 49.6%, 36.8%, and 12.1%, respectively. All three directly affected the reactive N loss and indirectly affected the nitrogen footprint. Overall, the carbon and nitrogen footprints of maize production in Inner Mongolia showed decreasing trends. Maize yields increased by 32.3% and carbon and nitrogen footprints decreased by 11.2% and 13.7% over the past 20 years. This means that for every 1 kg of maize kernels produced, the amounts of carbon emissions and reactive nitrogen loss are gradually declining, and the overall environmental costs are gradually decreasing. In order to meet the “double carbon” target as soon as possible, further optimization of fertilizer application, implementation of precision fertilization, adoption of conservation tillage, and large-scale planting management are effective ways to achieve high-yield, low-carbon, and green development.
The net ecosystem carbon balance is an important indicator for measuring the dynamic balance of carbon input and carbon output in agricultural ecosystems. It is usually in a good dynamic balance state without external interference [52] and is the result of the joint action of adding new carbon sources to the soil, decomposing and assimilating the system’s carbon input with the original carbon pool [53]. Therefore, it is important to increase farmland carbon input and decrease farmland carbon output through organic fertilization and straw return techniques to improve the net ecosystem carbon balance. The net ecosystem carbon balance of maize production in Inner Mongolia showed a linear increasing trend during the period of 2003–2022, with an interannual average value of 2.2 Mg C ha−1. The largest share of carbon sequestered in net primary productivity of maize production was 90.8%, and the share of carbon input from stover returned to the field was 9.2%. In carbon output, harvested removal made up 87.7%, and greenhouse gas emissions from farmland made up 12.3%. It can be seen that straw return to the field is an effective carbon sequestration pathway [54,55]. The process raises the net ecosystem carbon balance by enhancing the carbon input while lowering the amount of straw carbon removed during harvesting. The sustainability index showed an increasing trend in fluctuation with interannual changes, especially in the five years following 2015, when peaked at 9.8 in 2021. This is mainly because, in 2015, the Ministry of Agriculture and Rural Affairs proposed the “zero growth in fertilizer and pesticide use by 2020” goal. Inner Mongolia has since realized fertilizer reduction and efficiency improvement, pesticide reduction, and pest control while achieving steady reductions in the environmental cost of maize production, gradually improving the production capacity of the maize production system.

5. Conclusions

From 2003 to 2022, the maize planting area, yields, and total yields in Inner Mongolia all increased with an average annual increase of 97 kg ha−1 in yields and an average annual increase of 1.23 × 10⁶ Mg in total yields. Over the past 20 years, the carbon and nitrogen footprints of maize production in Inner Mongolia generally showed downward trends, while the nitrogen fertilizer bias productivity, net ecosystem carbon balance, and sustainability index exhibited upward trends. The average annual reduction in carbon footprint was 5.2 kg CO2 eq Mg−1, whereas the average annual reduction in nitrogen footprint was 0.21 g N eq kg−1. There was an average annual increase of 0.41 kg kg−1 in nitrogen fertilizer bias productivity, 43 kg C ha−1 in the net ecosystem carbon balance, and 0.096 in the sustainability index. Fertilizer production, transportation, and N fertilizer field application are the main controlling factors of GHG emissions in maize production. NO3-N, NH4+-N leaching, and NH3 volatilization from N fertilizer field application are the main sources of reactive N losses. Based on the regional climate characteristics of Inner Mongolia, we will focus on analyzing the correlation between the carbon and nitrogen footprint of maize production in various ecological types and weather in the future. At the same time, it is necessary to strengthen the research and application of simplified operations such as the phased regulation of new controlled-release fertilizers and nitrogen fertilizers, as well as protective tillage, and continuously promote the green and sustainable development of Inner Mongolia’s maize production system.

Supplementary Materials

The following supporting information can be downloaded at: https://www.mdpi.com/article/10.3390/agronomy14061273/s1, Table S1: Changes of maize yield per unit area, sown area and total yield in Inner Mongolia from 2003 to 2022.

Author Contributions

Formal analysis, Writing—original draft preparation, H.L.; Methodology, Z.C., R.Z. and Y.W.; Conceptualization, F.W. and L.B.; Software, Z.C. and Z.W. (Zhen Wang); Investigation, H.L., H.S., Y.L. and J.Z.; Data curation, H.L.; Writing-review and editing, Z.W. (Zhigang Wang) and X.J.; Funding acquisition, Z.W. (Zhigang Wang). All authors have read and agreed to the published version of the manuscript.

Funding

This study was supported by the following funding sources: National Natural Science Foundation of China (32160507); Inner Mongolia Natural Science Foundation (No. 2023QN03040); National Key Research and Development Program projects (2022YFD1500902-4); Inner Mongolia Autonomous Region Agriculture and Animal Husbandry Youth Innovation Fund Project (2023QNJJN06).

Data Availability Statement

The data reported in this study are contained within the article.

Conflicts of Interest

The authors declare that they have no conflict of interest.

Abbreviations

LCA, life cycle assessment; GHG, greenhouse gas; CF, carbon footprint; NF, nitrogen footprint; NECB, Net Ecosystem Carbon Budget; SI, sustainability index; PFPN, partial factor productivity of nitrogen fertilizer.

References

  1. Litskas, V.D.; Platis, D.P.; Anagnostopoulos, C.D.; Tsaboula, A.C.; Menexes, G.C.; Kalburtji, K.L.; Stavrinides, M.C.; Mamolos, A.P. Climate change and agriculture: Carbon footprint estimation for agricultural products and labeling for emissions mitigation. In Sustainability of the Food System; Academic Press: Cambridge, MA, USA, 2020; pp. 33–49. [Google Scholar]
  2. Zhao, J.R.; Wang, R.H. Factors Promoting the Steady Increase of American Maize Production and Their Enlightenments for China. J. Maize Sci. 2009, 17, 156–159, 163. (In Chinese) [Google Scholar]
  3. Canton, H. Food and agriculture organization of the United Nations—FAO. In The Europa Directory of International Organizations 2021; Routledge: London, UK, 2021; pp. 297–305. [Google Scholar]
  4. Fu, L.H.; Ye, L.Q. The Editorial Board and Editorial Staff of China Statistical Yearbook 2023 Ed; China Statistical Publishing House: Beijing, China, 2023; pp. 4–5. Available online: https://www.zgtjnj.org/navibooklist-n3023102708-1.html (accessed on 27 April 2024). (In Chinese)
  5. Cao, S.Y. Editorial Committee of Inner Mongolia Statistical Yearbook, Editorial Committee of Inner Mongolia Statistical Yearbook, Editor in Chief, Inner Mongolia Statistical Yearbook; China Statistical Publishing House: Beijing, China, 2023; p. 4. Available online: https://tj.nmg.gov.cn/files_pub/content/PAGEPACK/363c5d1932c74caabc7b1d3af06c0cd1/zk/indexch.htm (accessed on 25 April 2024). (In Chinese)
  6. Dong, H.M.; Li, Y.E.; Tao, X.P.; Peng, X.P.; Li, N.; Zhu, Z.P. China greenhouse gas emissions from agricultural activities and its mitigation strategy. Trans. CSAE 2008, 24, 269–273. (In Chinese) [Google Scholar]
  7. Zorogastúa, P.; Feliciano, D.; Felipe de Mendiburu, D. Combining reference trials, farm surveys and mathematical models to assess carbon footprint and mitigation measures in tropical agriculture. Ann. Agric. Sci. 2019, 64, 188–195. [Google Scholar]
  8. Hellweg, S.; Mila, I. Emerging approaches, challenges and opportunities in life cycle assessment. Science 2014, 344, 1109. [Google Scholar] [CrossRef] [PubMed]
  9. Cowell, S.J.; Clift, R. Impact assessment for LCAs involving agricultural production. Int. J. Life Cycle Assess. 1997, 2, 99–103. [Google Scholar] [CrossRef]
  10. Chen, X.; Cui, Z.; Fan, M.; Vitousek, P.; Zhao, M.; Ma, W.; Wang, Z.; Zhang, W.; Yan, X.; Yang, J.; et al. Producing more grain with lower environmental costs. Nature 2014, 514, 486–489. [Google Scholar] [CrossRef]
  11. Zhang, W.S.; He, X.M.; Zhang, Z.D.; Gong, S.; Zhang, Q.; Zhang, W.; Liu, D.Y.; Zou, C.Q.; Chen, X.P. Carbon footprint assessment for irrigated and rainfed maize (Zea mays L.) production on the Loess Plateau of China. Biosyst. Eng. 2018, 167, 75–86. [Google Scholar] [CrossRef]
  12. Xu, X.M.; Lan, Y. Spatial and temporal patterns of carbon footprints of grain crops in China. J. Clean. Prod. 2017, 146, 218–227. [Google Scholar] [CrossRef]
  13. Wang, Y.Q.; Pu, C.; Zhao, X.; Wang, X.; Liu, S.L.; Zhang, H.L. Historical dynamics and future trends of carbon footprint of wheat and maize in China. Resour. Sci. 2018, 40, 1800–1811. (In Chinese) [Google Scholar]
  14. Xue, J.F.; Qi, J.Y.; Gao, Z.Q.; Ren, A.X.; Wang, Z.B.; Du, T.Q. Dynamics of carbon footprint of maize production with different functional units in Shanxi Province, China. Pak. J. Agric. Sci. 2018, 55, 489–496. [Google Scholar]
  15. Huang, X.M.; Chen, C.Q.; Chen, M.Z.; Song, Z.W.; Deng, A.X.; Zhang, J.; Zhang, C.Y.; Zhang, W.J. Carbon footprints of major staple grain crops production in three provinces of Northeast China during 2004–2013. Chin. J. Appl. Ecol. 2016, 27, 3307–3315. (In Chinese) [Google Scholar] [CrossRef]
  16. Wu, P. Effects of Fertilization Depth on Water and Fertilizer Utilization and Nitrogen Balance in Upland Maize Field. Ph.D. Thesis, Northwest A&F University, Xianyang, China, 2022. (In Chinese). [Google Scholar]
  17. Xue, J.F.; Pu, C.; Liu, S.L.; Zhao, X.; Zhang, R.; Chen, F.; Xiao, X.P.; Zhang, H.L. Carbon and nitrogen footprint of double rice production in Southern China. Ecol. Indic. 2016, 64, 249–257. [Google Scholar] [CrossRef]
  18. Chen, Z.D.; Xu, C.C.; Ji, L.; Fang, F.P. Comprehensive evaluation for carbon and nitrogen footprints of rice–wheat rotation system in Middle Yangtze River Basin. J. Plant Nutr. Fertil. 2019, 25, 1125–1133. (In Chinese) [Google Scholar]
  19. Xue, X.B.; Landis, A.E. Eutrophication Potential of Food Consumption Patterns. Environ. Sci. Technol. 2010, 44, 6450–6456. [Google Scholar] [CrossRef]
  20. Wen, L.Y. Effects of Nitrogen Application Rates and Cultivation on Carbon and Nitrogen Footprint of Winter Wheat-Summermaize System. Master’s Thesis, Hebei Agricultural University, Baoding, China, 2019. (In Chinese). [Google Scholar]
  21. Gao, X.W. Greenhouse Gases Emission from Soil and Carbon-Nitrogen Budget in the Northern China Plain with High Productivity. Master’s Thesis, China Agricultural University, Beijing, China, 2003. (In Chinese). [Google Scholar]
  22. Ma, Y.F. Simulation of Soil Carbon Cycle in Agro-Ecosystem in the Different Tillage Systems by DNDC Model. Master’s Thesis, Gansu Agricultural University, Lanzhou, China, 2011. (In Chinese). [Google Scholar]
  23. Ni, X.Y.; Yang, W.Q.; Qi, Z.M.; Liao, S.; Xu, Z.F.; Tan, B.; Wang, B.; Wu, Q.G.; Fu, C.K.; You, C.M. Simple additive simulation overestimates real influence: Altered nitrogen and rainfall modulate the effect of warming on soil carbon fluxes. Glob. Change Biol. 2017, 23, 3371–3381. [Google Scholar] [CrossRef]
  24. Chen, Z.M.; Xu, Y.H.; Fan, J.L.; Yu, H.Y.; Ding, W.X. Soil autotrophic and heterotrophic respiration in response to different N fertilization and environmental conditions from a cropland in Northeast China. Soil Biol. Biochem. 2017, 110, 103–115. [Google Scholar] [CrossRef]
  25. Yang, H.; Qiao, Y.; Wang, X.B.; Chen, X.P.; Zhang, W.S. Spatio-temporal characteristics of energy use efficiency and net ecosystem carbon budget of maize production in Huang-Huai-Hai region. Acta Ecol. Sin. 2022, 42, 6184–6195. (In Chinese) [Google Scholar]
  26. Zhang, W.S.; Qian, C.R.; Carlson, K.M.; Ge, X.B.; Wang, X.B.; Chen, X.P. Increasing farm size to improve energy use efficiency and sustainability in maize production. Food Energy Secur. 2021, 10, 1–12. [Google Scholar] [CrossRef]
  27. Chen, X.H.; Ma, C.C.; Zhou, H.M.; Liu, Y.; Huang, X.M.; Wang, M.K.; Cai, Y.Y.; Su, D.; Muneer, M.A.; Guo, M.C.; et al. Identifying the main crops and key factors determining the carbon footprint of crop production in China, 2001–2018. Resour. Conserv. Recycl. 2021, 172, 1055661. [Google Scholar] [CrossRef]
  28. He, L.Y.; Zhang, A.F.; Wang, X.D.; Li, J.; Hussain, Q. Effects of different tillage practices on the carbon footprint of wheat and maize production in the Loess Plateau of China. J. Clean. Prod. 2019, 234, 297–305. [Google Scholar] [CrossRef]
  29. Cui, Z.L.; Zhang, H.Y.; Chen, X.P.; Zhang, C.C.; Huang, C.D.; Zhang, W.F.; Mi, G.H.; Miao, Y.X.; Li, X.L.; Yin, H.; et al. Pursuing sustainable productivity with millions of smallholder farmers. Nature 2018, 555, 363–366. [Google Scholar] [CrossRef] [PubMed]
  30. Zhang, W.F.; Dou, Z.X.; He PJu, X.T.; Powlson, D.; Chadwick, D.; Nores, D.; Lu, Y.L.; Zhang, Y.; Wu, L. New technologies reduce greenhouse gas emissions from nitrogenous fertilizer in China. Proc. Natl. Acad. Sci. USA 2013, 110, 8375–8380. [Google Scholar] [CrossRef] [PubMed]
  31. Cui, Z.L.; Yue, S.C.; Wang, G.L.; Zhang, F.S.; Chen, X.P. In-Season Root-Zone N Management for Mitigating Greenhouse Gas Emission and Reactive N Losses in Intensive Wheat Production. Environ. Sci. Technol. 2013, 47, 6015–6022. [Google Scholar] [CrossRef] [PubMed]
  32. Liu, T.Q.; Li, S.H.; Guo, L.G.; Cao, C.G.; Li, C.F.; Zhai, Z.B.; Zhou, J.Y.; Mei, Y.M.; Ke, H.J. Advantages of nitrogen fertilizer deep placement in greenhouse gas emissions and net ecosystem economic benefits from no-tillage paddy fields. J. Clean. Prod. 2020, 263, 121322. [Google Scholar] [CrossRef]
  33. Qin, S.P.; Hu, C.S.; Zhang, Y.M.; Wang, Y.Y.; Dong, W.X.; Li, X.X. Advances in nitrogen footprint research. Chin. J. Eco-Agric. 2011, 19, 462–467. (In Chinese) [Google Scholar] [CrossRef]
  34. Hao, X.Y. Spatiotemporal variation of carbon source/sink in agricultural ecosystem based on carbon footprint in Heilongjiang land reclamation areas. Chin. J. Agric. Resour. Reg. Plan. 2022, 43, 64–73. (In Chinese) [Google Scholar]
  35. Lin, Z.C.; Dai, Q.G.; Ye, S.C.; Wu, F.G.; Jia, Y.S.; Chen, J.D.; Xu, L.S.; Zhang, H.C.; Huo, Z.Y.; Xu, K.; et al. Effects of nitrogen application levels on ammonia volatilization and nitrogen utilization during rice growing season. Rice Sci. 2012, 19, 125–134. [Google Scholar] [CrossRef]
  36. Guinée, J.B. Handbook on Life Cycle Assessment: Operational Guide to the ISO Standards; Springer Science & Business Media: Berlin/Heidelberg, Germany, 2002; p. 692. ISBN 1-4020-0228-9. [Google Scholar]
  37. Xia, L.L.; Lam, S.K.; Wang, S.W.; Zhou, W.; Chen, D.L.; Yan, X.Y. Optimizing nitrogen fertilization rate to enhance soil carbon storage and decrease nitrogen pollution in paddy ecosystems with simultaneous straw incorporation. Agric. Ecosyst. Environ. 2020, 298, 106968. [Google Scholar] [CrossRef]
  38. Bao, S.D. Soil Agrochemical Analysis; China Agricultural Publishing House: Beijing, China, 2000; Available online: https://max.book118.com/html/2022/0304/6035102104004121.shtm (accessed on 16 April 2024). (In Chinese)
  39. Liu, X.Y. Study on Nutrients Balance and Requirement in Agricultural Production in China. Ph.D. Thesis, Chinese Academy of Agricultural Sciences, Beijing, China, 2018. (In Chinese). [Google Scholar]
  40. Kuzyakov, Y. Separating microbial respiration of exudates from root respiration in non-sterile soils: A comparison of four methods. Soil Biol. Biochem. 2002, 34, 1621–1631. [Google Scholar] [CrossRef]
  41. Bolinder, M.A.; Janzen, H.H.; Gregorich, E.G.; Angers, D.A. An approach for estimating net primary productivity and annual carbon inputs to soil for common agricultural crops in Canada. Agric. Ecosyst. Environ. 2007, 118, 29–42. [Google Scholar] [CrossRef]
  42. Zhao, Y.C.; Wang, M.Y.; Hu, S.J.; Zhang, X.D.; Ouyang, Z.; Zhang, G.L.; Huang, B.A.; Zhao, S.W.; Wu, J.S.; Xie, D.T. Economics- and policy-driven organic carbon input enhancement dominates soil organic carbon accumulation in Chinese croplands. Proc. Natl. Acad. Sci. USA 2018, 115, 4045–4050. [Google Scholar] [CrossRef] [PubMed]
  43. Lal, R. Carbon emission from farm operations. Environ. Int. 2004, 3030, 981–990. [Google Scholar] [CrossRef]
  44. Grassini, P.; Cassman, K.G. High-yield maize with large net energy yield and small global warming intensity. Proc. Natl. Acad. Sci. USA 2012, 109, 1074–1079. [Google Scholar] [CrossRef]
  45. Xia, L.L.; Ti, C.P.; Li, B.L.; Xia, Y.Q.; Yan, X.Y. Greenhouse gas emissions and reactive nitrogen releases during the life-cycles of staple food production in China and their mitigation potential. Sci. Total Environ. 2016, 556, 116–125. [Google Scholar] [CrossRef] [PubMed]
  46. Jia, L. Study on the Spatiotemporal of Carbon and Water Footprints of Maize Production and Its Influencing Factors in Jilin Province. Master’s Thesis, Northeast Normal University, Changchun, China, 2021. (In Chinese). [Google Scholar]
  47. Wang, B.; Li, Y.E.; Wan, Y.F.; Qin, X.B.; Gao, Q.Z. Effect and Assessment of Controlled Release Fertilizer and Additive Treatments on Greenhouse Gases Emission from a Double Rice Field. Sci. Agric. Sin. 2014, 47, 314–323. (In Chinese) [Google Scholar]
  48. Zhou, J.X.; Zhai, X.F.; Sun, H.R.; Tang, L.; Shen, Y.F. Effects of controlled-release urea on CO2 emission from dry farmland under different mulching patterns. J. Agro-Environ. Sci. 2019, 38, 2429–2438. (In Chinese) [Google Scholar]
  49. Li, P.; Hao, X.Y.; Zong, Y.Z.; Gu, R.S.; Jia, S.H.; Dong, Q.; Guo, L.P. Effect of tillage practice on carbon footprint of rainfed winter wheat. Chin. J. Eco-Agric. 2017, 25, 839–847. (In Chinese) [Google Scholar]
  50. Huang, Y.W.; Ren, W.; Wang, L.X.; Hui, D.F.; Grove, J.; Yang, X.J.; Tao, B.; Goff, B. Greenhouse gas emissions and crop yield in no-tillage systems: A meta-analysis. Agric. Ecosyst. Environ. 2018, 268, 144–153. [Google Scholar] [CrossRef]
  51. Lian, B.R.; Li, Y.H.; Wang, J.Q.; Yang, J.G.; Zou, G.Y. Effects of Chemical Fertilizer Input on Active Nitrogen Emission and Carbon Footprint of Maize System in Hebei Province. Shandong Agric. Sci. 2022, 54, 112–117. (In Chinese) [Google Scholar]
  52. Luyssaert, S.; Ciais, P.; Piao, S.L.; Schulze, E.D.; Jung, M.; Zaejle, S.; Schelhaas, M.J.; Reichstein, M.; Churkina, G.; Papale, D.; et al. The European carbon balance. Part 3: Forests. Glob. Change Biol. 2010, 16, 1429–1450. [Google Scholar] [CrossRef]
  53. Xia, L.L.; Yan, X.Y.; Cai, Z.C. Research progress and prospect of greenhouse gas mitigation and soil carbon sequestration in croplands of China. J. Agro-Environ. Sci. 2020, 39, 834–841. (In Chinese) [Google Scholar]
  54. Rezvani Moghaddam, P. Evaluation of carbon allocation coefficients and net primary production for major crops in Khorasan-e Razavi Province. J. Crop Prod. 2018, 11, 141–152. [Google Scholar]
  55. Zhang, J.L. Studies on Soil Respiration and Carbon Balance under Different Tillage and N-Fertilizer Practices in A Dryland Summer Maize Field. Ph.D. Thesis, Northwest A&F University, Xianyang, China, 2014. (In Chinese). [Google Scholar]
Figure 1. Carbon and Nitrogen footprint system boundary.
Agronomy 14 01273 g001
Figure 2. Changes in maize yield per unit area, sown area, and total yield in Inner Mongolia from 2003 to 2022.
Agronomy 14 01273 g002
Figure 3. Principal component analysis of yield and agricultural input (a) and carbon footprint and its component factors (b).
Agronomy 14 01273 g003
Figure 4. Greenhouse gas emissions and carbon footprint of maize production in Inner Mongolia from 2003 to 2022.
Agronomy 14 01273 g004
Figure 5. Cumulative reactive N losses, nitrogen partial productivity, and nitrogen footprint of maize production in Inner Mongolia from 2003 to 2022.
Agronomy 14 01273 g005
Figure 6. Principal component analysis of Nitrogen footprint and its component factors (a) and carbon balance and related factors (b).
Agronomy 14 01273 g006
Figure 7. Net ecosystem carbon balance and sustainability index of maize production in Inner Mongolia from 2003 to 2022.
Agronomy 14 01273 g007
Table 1. Carbon emission co-efficient and active nitrogen emission co-efficient of agricultural input data [18,20,27,28].
InputUnitGreenhouse Gas Emission Rate
(kg CO2 eq)
Cumulative Reactive N Losses
(kg N eq)
Nitrogen fertilizerkg N8.300.89 × 10−3
Phosphate fertilizerkg P2O52.330.54 × 10−3
Potash productionkg K2O0.660.03 × 10−3
Pesticidekg18.04.49 × 10−3
Agricultural filmkg2.512.03 × 10−3
DieselL3.74.58 × 10−3
Laborperson per day0.86
Seedkg1.930.14 × 10−3
Table 2. Maize production investment in Inner Mongolia Autonomous Region from 2003 to 2022.
YearN
(kg ha−1)
P2O5
(kg ha−1)
K2O
(kg ha−1)
Pesticide (kg ha−1)Agricultural Film
(kg ha−1)
Diesel
(L ha−1)
Seed
(kg ha−1)
Labor
(day ha−1)
2003177.548.99.02.37.570.455.5133.5
2004191.085.712.12.48.676.446.8131.7
2005206.075.116.62.38.765.544.4126.8
2006223.086.215.01.810.574.040.5101.7
2007231.697.312.42.28.967.142.3102.2
2008213.283.519.92.68.456.841.098.6
2009206.588.717.63.19.071.741.493.2
2010223.0105.916.85.810.553.638.377.9
2011223.0109.123.75.811.366.440.478.6
2012209.8106.621.05.410.549.638.373.7
2013203.4112.422.05.814.947.436.863.3
2014210.9118.028.34.613.776.534.558.5
2015207.6117.836.05.113.4109.031.255.5
2016237.5126.329.54.212.298.231.544.0
2017227.0123.632.84.911.186.831.736.9
2018222.3129.343.94.314.682.329.735.9
2019218.9131.640.24.415.994.831.231.4
2020196.5139.043.14.618.0114.428.729.3
2021189.6130.345.55.518.079.830.027.5
2022203.4139.942.65.618.579.328.224.9
Average value211.1107.826.44.112.276.037.171.2
Disclaimer/Publisher’s Note: The statements, opinions and data contained in all publications are solely those of the individual author(s) and contributor(s) and not of MDPI and/or the editor(s). MDPI and/or the editor(s) disclaim responsibility for any injury to people or property resulting from any ideas, methods, instructions or products referred to in the content.

