Article

Nighttime Warming Reduced Copper Concentration and Accumulation in Wheat Grown in Copper-Contaminated Soil by Affecting Physiological Traits

1
College of Agriculture, Henan University of Science and Technology, Luoyang 471023, China
2
Tobacco Development Center of County Government in Luoning, Luoyang 471700, China
*
Authors to whom correspondence should be addressed.
These authors contributed equally to this work.
Agronomy 2024, 14(6), 1302; https://doi.org/10.3390/agronomy14061302
Submission received: 16 May 2024 / Revised: 9 June 2024 / Accepted: 12 June 2024 / Published: 16 June 2024
(This article belongs to the Section Plant-Crop Biology and Biochemistry)

Abstract

:
The changes in biomass (including yield), copper (Cu) concentration, and the accumulation of wheat (Triticum aestivum. L) in response to soil Cu pollution under nighttime warming had still not been explored. Hence, this study was carried out, and these variations were analyzed from a physiological perspective. Pot trials were performed at two levels of ambient temperatures (no-warming (NT) and average nighttime warming of 0.28 °C (WT)) and two levels of soil Cu concentrations (control check without Cu application (CK) and 100 mg/kg Cu application (Cu)). Soil was collected from the carbonate cinnamon soil region of central China. The warming effects of the passive nighttime warming system were prominent, and the average increment was 0.28 °C. Antioxidant enzyme activities were promoted by warming (p < 0.05) and Cu. The highest yield was achieved in NT-Cu, mainly attributed to relatively strong root activity and photosynthesis caused by supplemental Cu, but the Cu concentration in its grains was close to the threshold (10 mg/kg) for Cu concentration in foodstuff and could present a potential food safety risk. Though nighttime warming did not increase the total biomass and yield of wheat, it decreased the Cu accumulation of wheat grown in Cu-contaminated soil, especially in grains. Moreover, WT-CK and WT-Cu increased the Cu concentration in the roots and glumes and reduced the Cu concentration in grains by 13.09% and 55.84%, respectively, probably because of a lower transpiration rate. Among them, the Cu concentration of grains in WT-Cu was the lowest and significantly lower than other applications. Our findings reveal that nighttime warming has the potential to reduce the Cu risk of grains in wheat grown in the Cu-contaminated carbonate cinnamon soil region of central China and could then provide a theoretical reference for risk assessment of food quality for wheat subjected to dual stress from nighttime warming and Cu pollution.

1. Introduction

Heavy metals are the most dangerous pollutants among all anthropogenic environmental pollutants due to their toxicity, low environmental mobility, and long-term persistence in the environment [1,2,3,4]. Furthermore, heavy metals in farmlands can enter the food chain via skin absorption, ingestion, and inhalation and then seriously threaten human and animal health [5]. In recent years, pollution from potentially toxic elements has increased with the rapid development of industries such as electroplating, chemical engineering, and mining, as well as the random use of pesticides, fungicides, and waste water irrigation. One such example is copper (Cu) tailings, a by-product of copper production that has been steadily accumulating in China, with an annual output now reaching a staggering 224 million tons and continuing to rise [6]. The Cu content in soil has exceeded the background value of the soil by several times or even dozens of times, and the point excess rate of Cu in China reached 2.1%. Therefore, Cu pollution involved in agricultural soil has become a key issue affecting sustainable agricultural food production [7]. In fact, Cu is a micro-nutrient required for plant growth. Moreover, it serves as an important cofactor for proteins such as cytochrome oxidase, polyphenol oxidase, ascorbate oxidase, polyamine oxidase, Cu/Zn-superoxide dismutase, etc., and then affects these life processes such as photosynthesis, protein metabolism, and carbohydrate distribution [1,8]. For example, foliar Cu application could improve tomato growth, yield, anti-oxidant, and plant defense enzymes [9]. However, excess amounts of Cu can lead to a large accumulation of Cu in crop tissues and interfere with the normal development of crops by negatively influencing their physiological processes via growth inhibition, oxidative damage, and antioxidant responses. For example, Cu can limit nutrient uptake, dry matter accumulation, and yield formation by affecting root activities and leaf photosynthesis parameters [9,10]. This is mostly due to the fact that root activity could reflect the actual uptake of nutrients by roots; transpiration rate and net photosynthetic rate mainly affected the upward uptake of nutrients and the accumulation of photosynthates. However, the degree of influence varies with different plants [11]. In addition, the loss in growth and yield in food crops caused by Cu may exceed the threats from all other food safety and security measures [7]. So, increasing the Cu concentration in farmlands has been a very serious concern to society because it affects food safety and human health [1,12].
Climate change is one of the main environmental issues around the world [13]. It is predicted that by 2050, the average temperature in China will increase by 1.2–2.0 °C [14]. Moreover, global warming shows obvious asymmetric characteristics [15]. The temperature increment at night is greater than that during the day, and the temperature increment in spring and winter is greater than that during summer and autumn [15,16]. This course of asymmetric warming basically overlaps with the growth process of wheat. Wheat, as the third major crop in the world, considerably contributes to the human diet, and the global demand for wheat continues to increase [17]. Moreover, temperature is a key factor in regulating and controlling farmland ecosystems. It controls the rates of chemical reactions in farmland ecosystems, regulates the movement of energy, water, and nutrients in the soil–plant system, and affects the production and distribution of carbohydrates [18,19]. Furthermore, wheat yield is sensitive to temperature change [20]. Numerous studies have reported that the growth, development, and yield of wheat were significantly affected by climate warming [16,21,22], through changing photosynthesis and nutrition movement between the soil–plant system, etc. [23].
Additionally, Cu pollution on farmlands has become a major issue for sustainable agricultural food production. However, there have been few research studies on the effect of nighttime warming on the changes in Cu accumulation and translocation of wheat grown in Cu-polluted soil. To the best of our knowledge, plants can produce excessive reactive oxygen species in response to stress [24,25,26]. To eliminate excess active oxygen, the protection system against oxidative stress is an important component that determines the survival of plants when they are under stress. Specifically, the activities of protective enzymes such as POD (Peroxidase), SOD (Superoxide dismutase), and CAT (Catalase) in plants will change accordingly [27]. So, the dual stress of warming and Cu pollution on Cu concentration in wheat might be explained by physiological aspects such as enzyme activity and physiological indicators. But so far, no relevant research has been reported. Therefore, it is necessary to explore the change in biomass, Cu accumulation, and translocation of wheat in response to Cu application under nighttime warming and analyze the causes of these changes from a physiological perspective (antioxidant enzyme activities of leaves, root activities, and leaf photosynthesis parameters). This will help comprehensively evaluate the response of wheat to dual stress from climate and soil pollution in central China. Additionally, the results could provide a theoretical reference for risk assessment of food quality and agricultural adaptation for wheat subjected to dual stress from nighttime warming and Cu pollution.

2. Materials and Methods

2.1. Trial Site, Plant Culture, and Experimental Design

The pot trial was performed on the farm on the Zhoushan campus (34°38′ N, 112°22′ E) of Henan University of Science and Technology from 2018 to 2019. The experimental area was dominated by rain-fed agriculture and belonged to a warm temperate semi-humid monsoon climate, with an average annual temperature of about 13.7 °C and an average annual rainfall of about 650.2 mm. The experimental soil was carbonate cinnamon soil, collected from the topsoil layer (0–20 cm) on the farm using a mini excavator (XG10D, Dingyuan County Jiaxin agricultural machinery Co., LTD, Chuzhou, China). The physical and chemical properties of soil are shown in Table S1. In the collected soil, the available Cu concentration was 0.97 mg/kg at the critical value of deficiency. Wheat ‘Zhongmai 175’ was chosen as the experimental material because it is widely grown in central China.
The pot experiment included two factors: ambient temperature and soil Cu concentration. The ambient temperature factor was set to two levels: no-warming (NT) and warming using a passive warming system (WT); the Cu concentration factor was set to two levels: control check without Cu (CK) and CuSO4·5H2O application (Aladdin Bio-Chem Technology Co., Ltd. Company, Shanghai, China) with 100 mg/kg pure Cu (Cu). The Cu application in the experimental soil referred to the soil environmental quality risk control standard for soil contamination in agricultural lands [28]. In the standard, the risk threshold value for soil Cu contamination is 100 mg/kg. The Cu application process was as follows: Cu and test soil were evenly mixed before filling the pots. For nighttime warming, a passive nighttime warming system was used [29], intercepting surface long-wave radiation at night to increase the temperature. The system mainly comprised a horizontal assembly frame with an adjustable lifting height, and retractable covering material on the assembly frame. The winter wheat was warmed at night (from 19:00 to 7:00 on the second day) during the entire growth period, except during snowfall and rainfall. The coverage height of the warming facility was 20 cm directly above the canopy, and there was no shelter around the wheat canopy.
Wheat was planted in PVC (Polyvinyl chloride) pots (height: 60 cm, diameter: 50 cm), and each pot was filled with 35 kg of dry soil. Based on the conventional fertilizer amount in the field, the fertilizers were added to each pot, including 2.1 g N (Urea 135 kg/hm2), 1.4 g P (P2O5 90 kg/hm2), and 1.4 g K (K2O 90 kg/hm2). Among them, 50% N, P, and K fertilizers were completely dissolved and poured into each pot before planting, and the remaining 50% N fertilizer was added to the soil after seed fixing during the jointing period. Three replicates were performed for each treatment, and each replicate had 12 pots. 35 plants were sown in each pot on 10 October 2018, and 25 plants in each pot were seed-fixed during the jointing period. Then they were harvested on 31 May 2019. These samples of whole plants were sampled in four key growth periods: seeding stage (29 December 2018; 51 growing days), jointing stage (16 March 2019; 158 growing days), booting stage (3 April 2019; 176 growing days), and maturation stage (31 May 2019; 234 growing days). Moreover, at each sampling point, all samples from three pots from each repetition of the four treatments were randomly collected for further analysis. The participants in the experiment were both students and teachers who possess professional operational skills. In the following measurement experiments, the same experimental step for these samples was operated by the same person to increase experimental accuracy. Each datum was the average of three measurements after filtering out outliers.

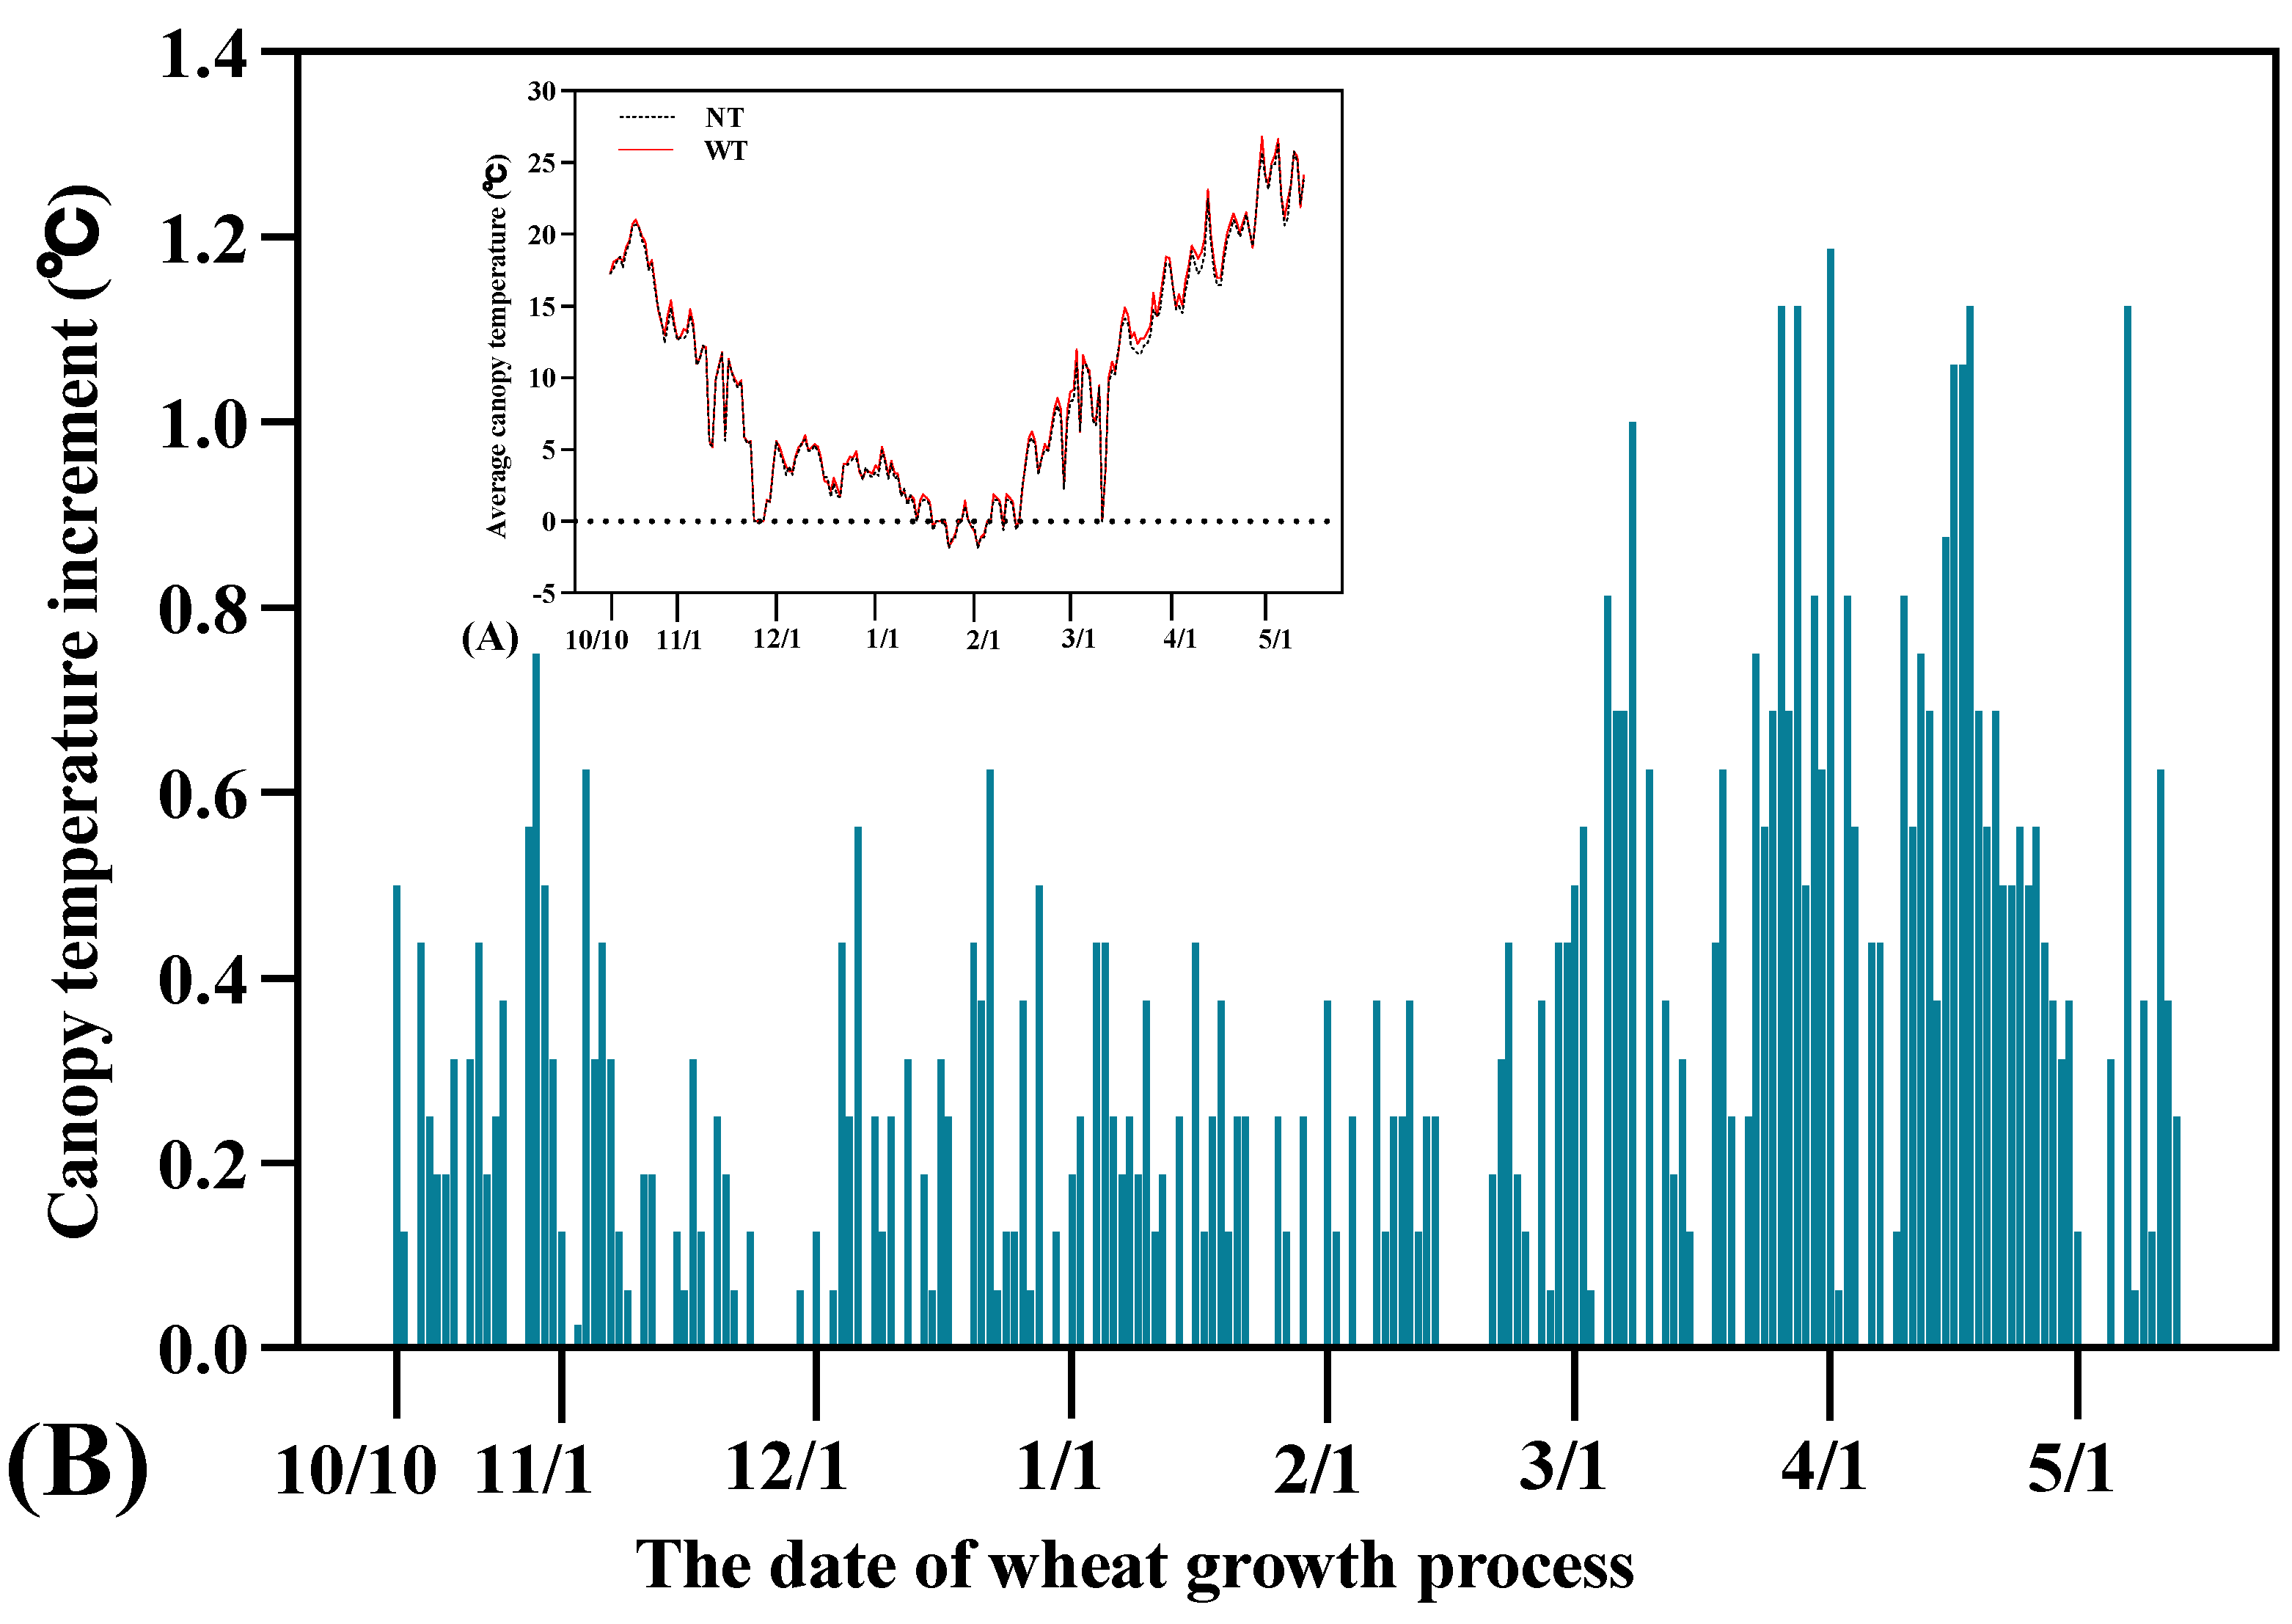
2.2. Determination of the Canopy Temperature and Its Increment

An automatic temperature recorder (ZDR-41, Hangzhou Zheda Electronic Instrument Co., Ltd., Hangzhou, China) was positioned in the center of each pot center and on the wheat canopy under the curtain, which was used to measure the temperature of the wheat canopy. It recorded the temperature once every 20 min during the entire growth period, and the temperature data were averaged to obtain the average canopy temperature during the night of each repetition. The canopy temperature increment was the difference between the canopy temperature under warming treatment and non-warming treatment.

2.3. Determination of Available Cu Concentration in Soil

During each sampling period, the fresh soil was collected from each treatment using a five-point sampling method and placed in a cool and ventilated place to naturally dry. Then, the available Cu in the soil was extracted with CaCl2 and determined via the atomic absorption spectrometry (AAS) method (AAS, TAS-990AFG, Persee General Instrument Co., Ltd., Beijing, China) used to extract [30,31].

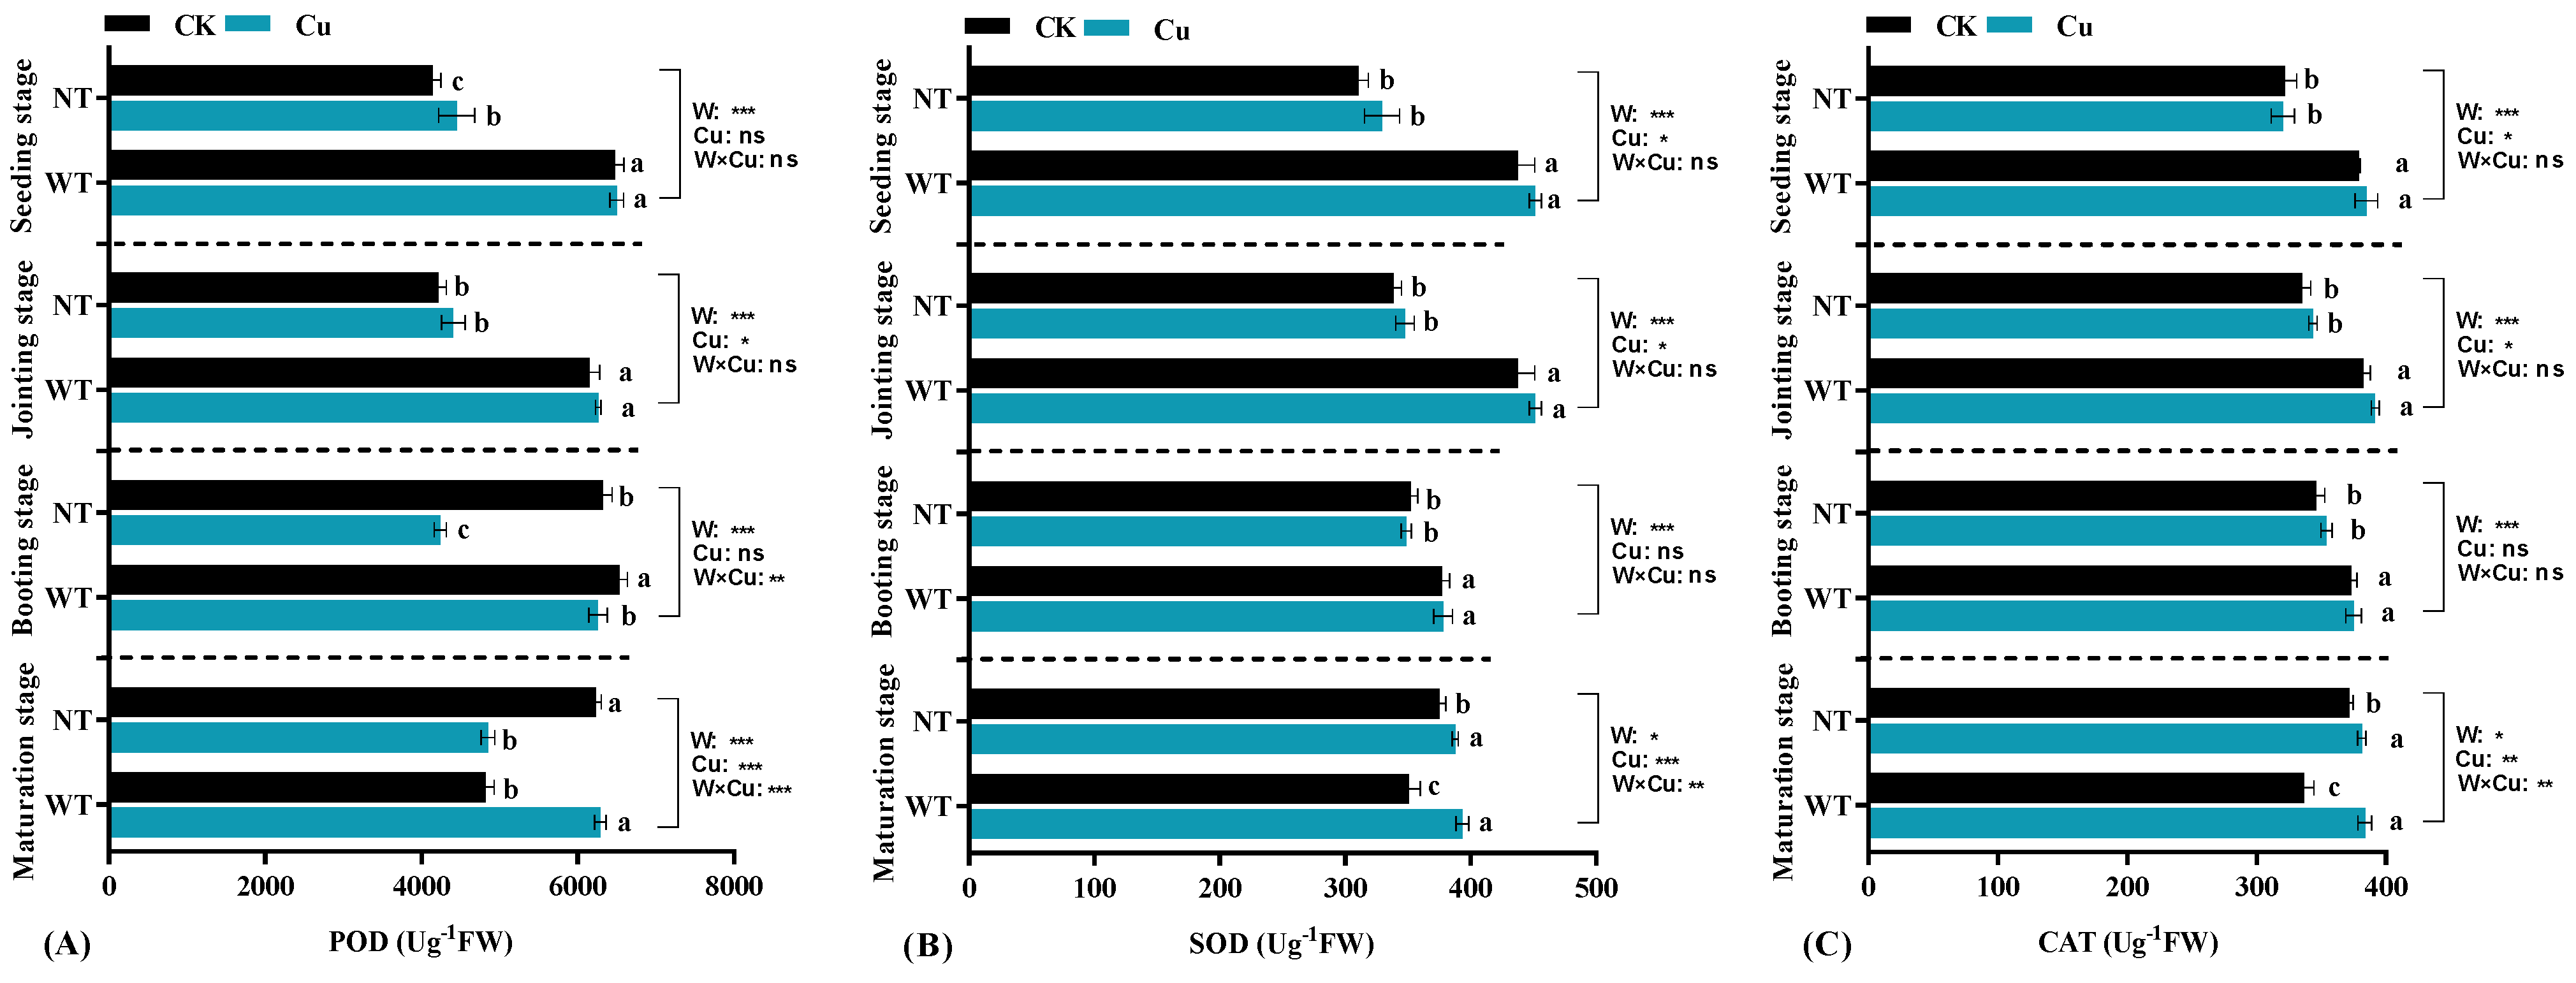
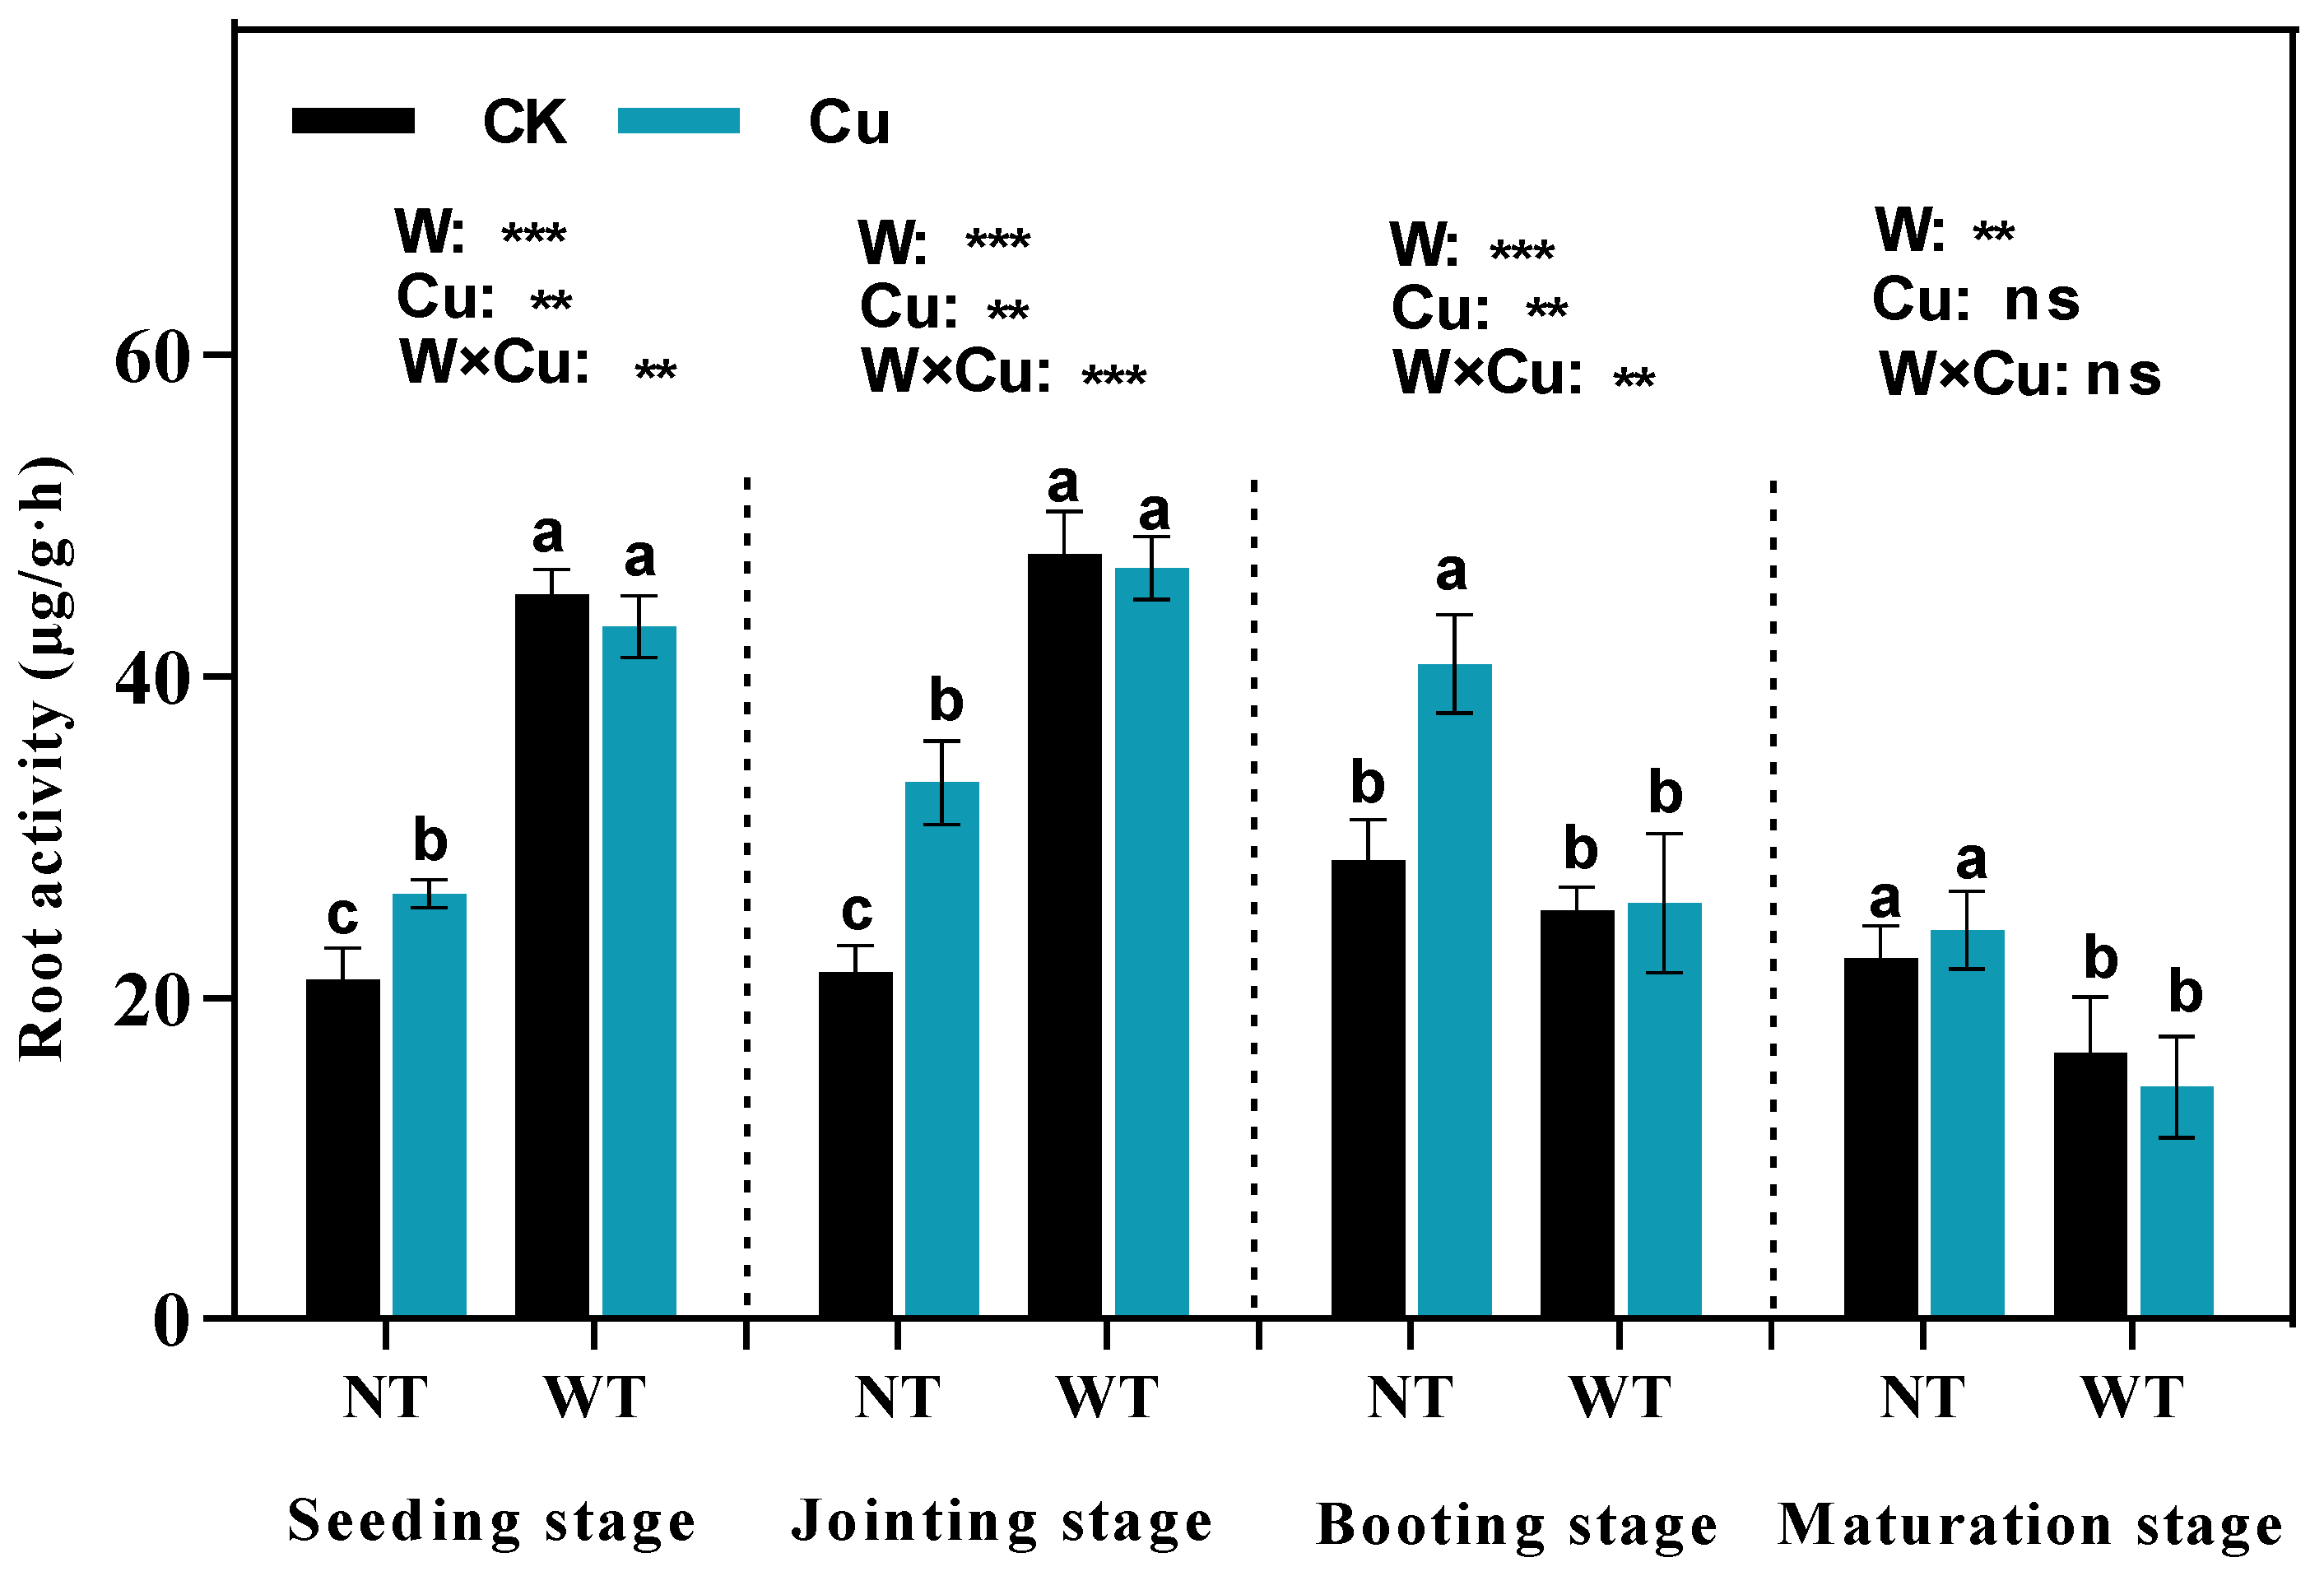
2.4. Determination of Antioxidant Enzyme Activities, Photosynthesis in Leaves, and Activities in Roots

The fourth wheat leaf from the top was collected. POD, SOD, and CAT activities were determined according to the method from Huang et al. [25]. POD activity was determined by measuring the oxidation of benzidine at 530 nm; one unit of SOD activity was defined as the amount of enzyme that causes 50% inhibition of the photochemical reduction of NBT; and CAT activity was analyzed by measuring the consumption of H2O2 at 240 nm. The results were expressed as Ug−1FW. Photosynthetic parameters, including net photosynthetic rate (Pn) and transpiration rate (Tr), were measured in the most expanded leaves (the inverted second leaf) by a portable photosynthesis system (LCi, ADC Bioscientific Co., London, UK). The 5 cm roots from the tips were used for analysis. Then, the root activity was determined by the triphenyl tetrazolium chloride (TTC) method [6]. Specifically, 0.5 g fresh root was incubated in a glass beaker with 10 mL of phosphate buffer that contains 0.4% TTC at 37 °C for 2 h. The reaction was terminated by adding 2 mL of H2SO4 (1 M). The reacted TTC on the root surface was extracted by ethyl acetate after it was gently dried with filter paper. The absorbance of the extractant at 485 nm was determined by a UV–vis spectrophotometer (T6-1650F, Persee General Instrument Co., Ltd., Beijing, China). The calculation formula for root activity: root activity = amount of TTC reduced (μg)/fresh root weight (g) × time (h).

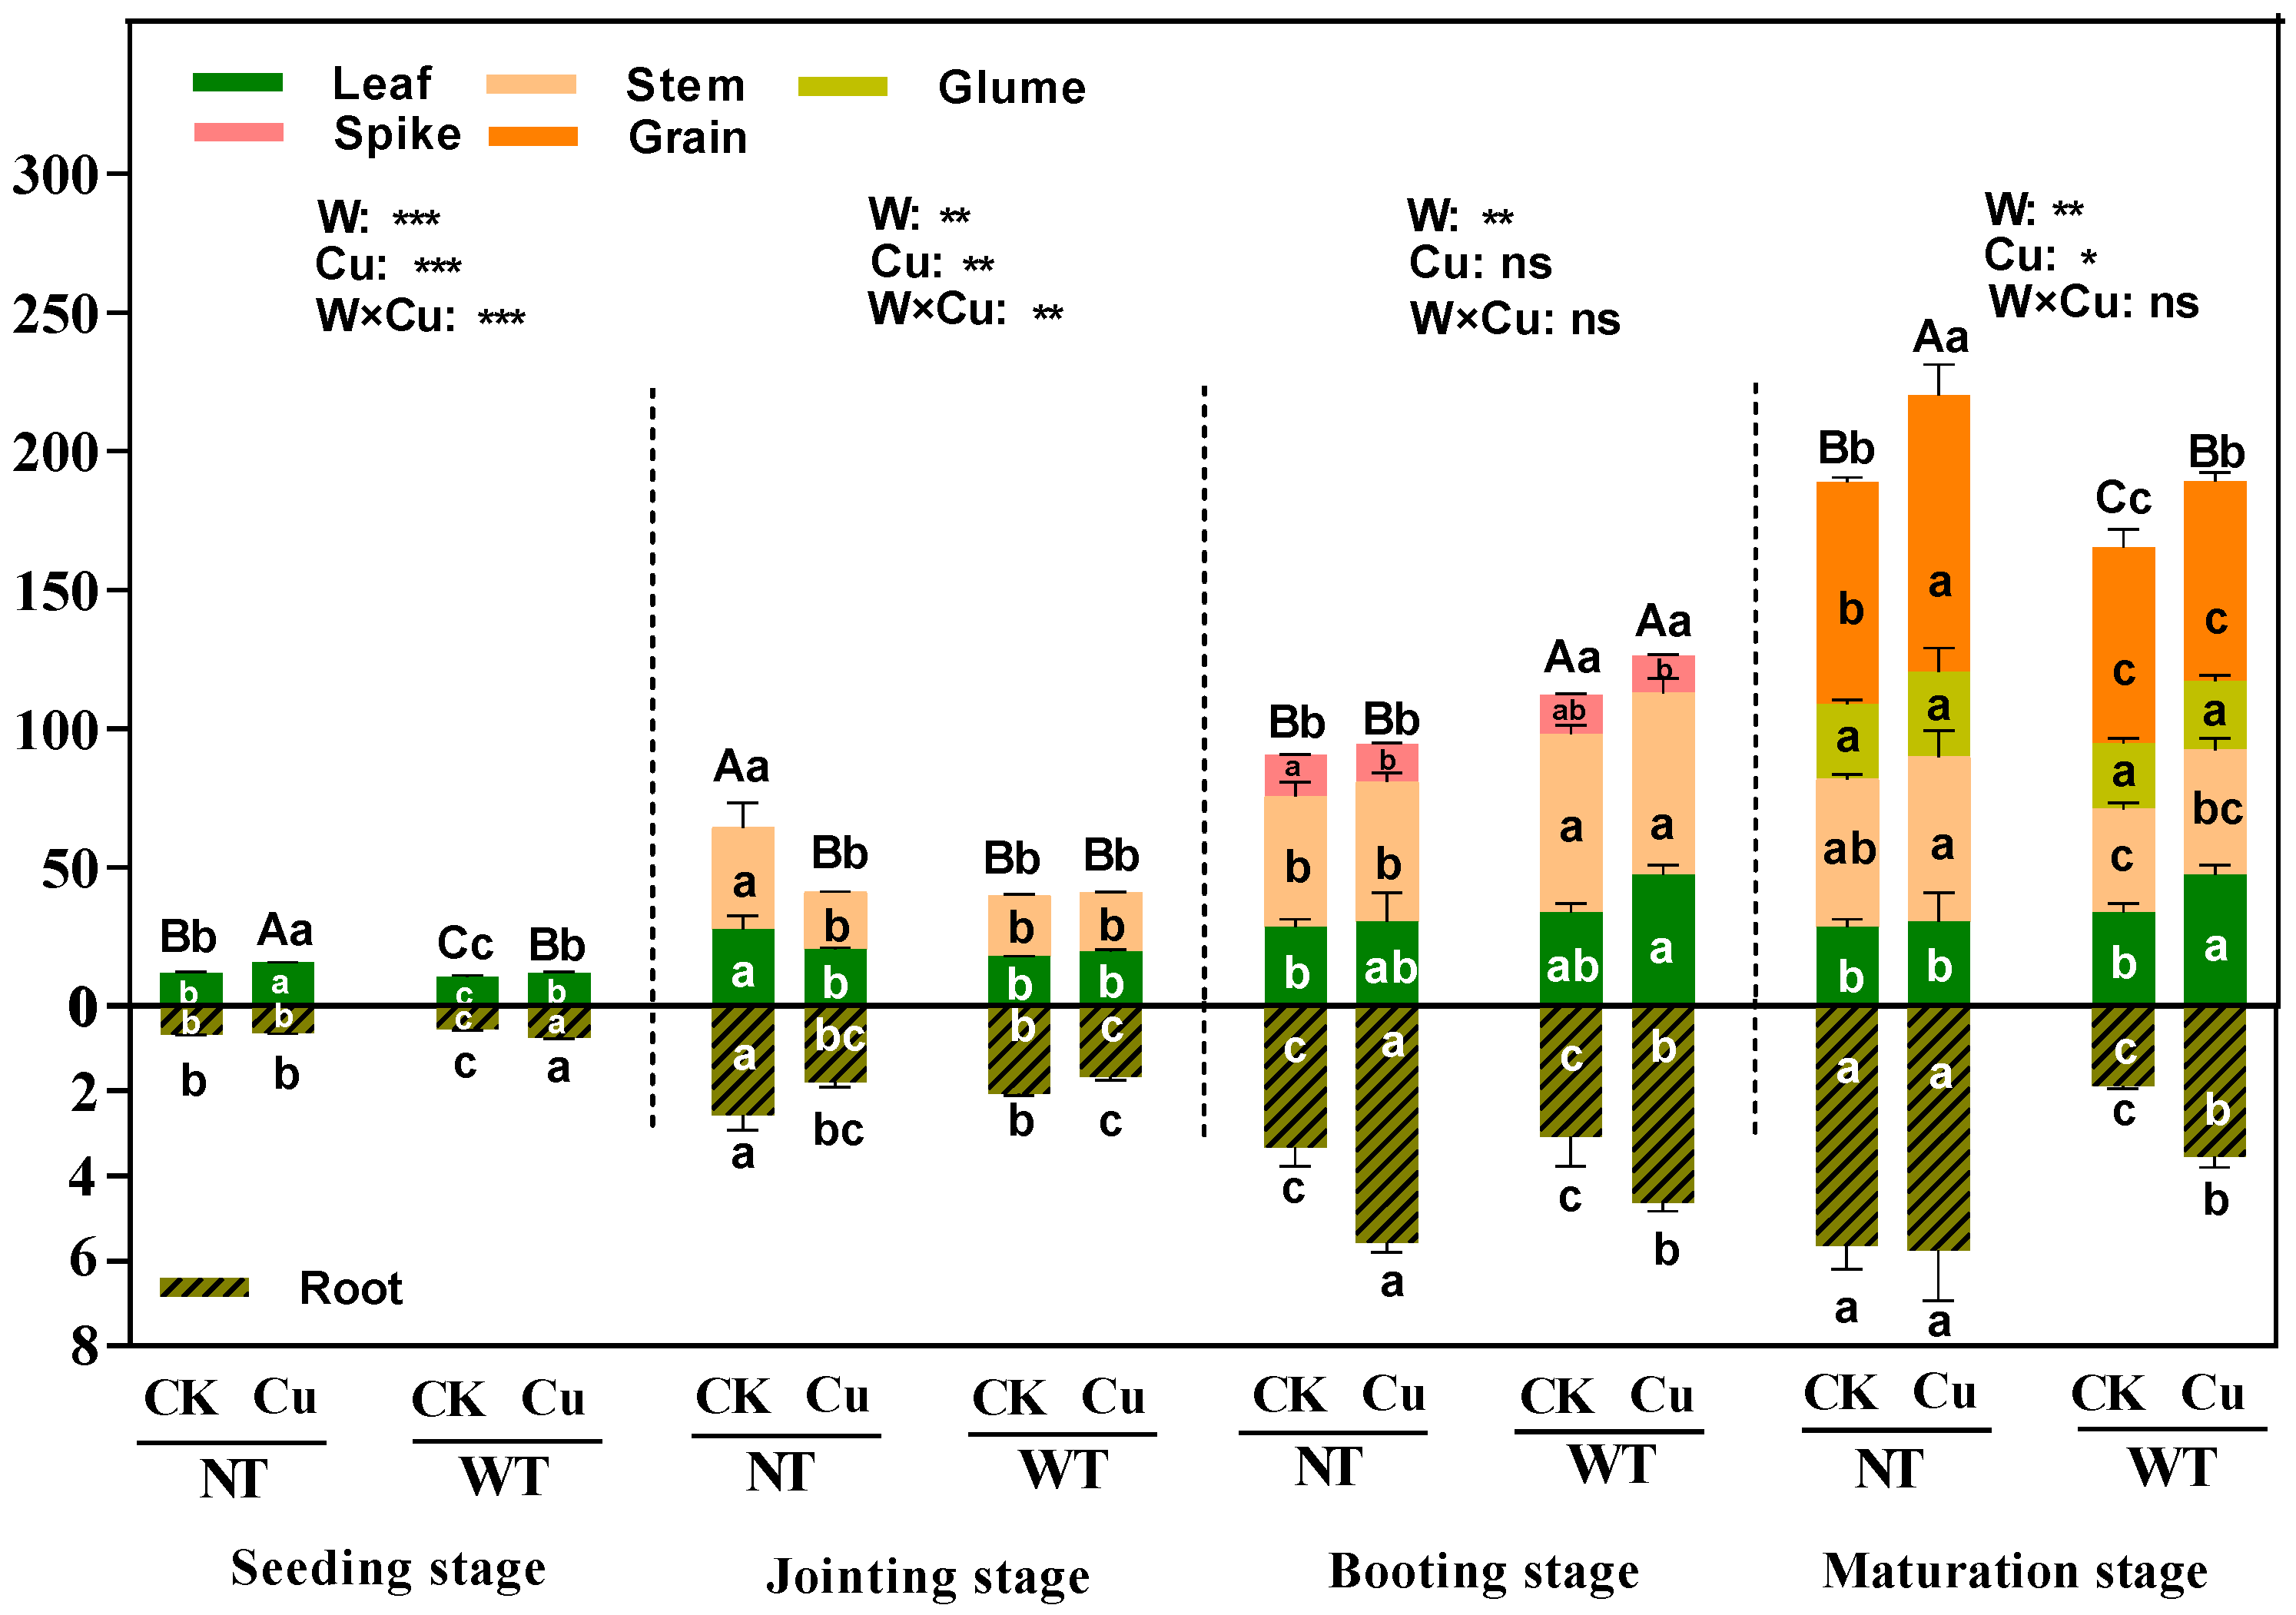
2.5. Determination of Biomass and Yield in Wheat

In each sampling period, the various tissues of wheat were separated and dried at 105 °C for 30 min, and 70 °C for 48 h, and then weighed to obtain biomass. The total biomass was the sum of the biomass of each part. The biomass of the grain was the wheat yield.

2.6. Determination of Cu Concentration and Accumulation in Wheat

The Cu concentration in wheat was measured by the AAS method (AAS, TAS-990AFG, Persee General Instrument Co., Ltd., Beijing, China) [32]. The Cu accumulation of each tissue in wheat was the product of the Cu concentration in each tissue and its biomass.

2.7. Calculation of Cu Translocation Factor in Wheat

The Cu translocation factor from roots to stems was calculated by the Cu concentration in stems/the Cu concentration in roots. The Cu translocation factor from stems to other aboveground tissues was obtained by the Cu concentration in leaves, ears, glumes, and grains/the Cu concentration in stems [33].

2.8. Statistical Analysis

SPSS 24.0 (IBM, Armonk, NY, USA) was used for data analysis. Two-way analysis of variance (ANOVA) and Duncan’s multiple range test were used to evaluate the significance of the differences among the treatments (*, p < 0.05; **, p < 0.01; ***, p < 0.001). GraphPad Prism 8.0 was used to draw pictures.

3. Results and Discussion

3.1. Warming Effect of the Night Warming System

The change in the canopy temperature at night during the growth period of wheat is shown in Figure 1A. The canopy temperature for normal and nighttime warming ranged from −1.88 °C to 26.25 °C and −1.75 °C to 26.62 °C, respectively, and their average temperature was 9.46 °C and 9.73 °C, respectively. Additionally, as the growth period progressed, the temperature continued to decrease, and the lowest canopy temperature was observed at the end of January and early February, followed by a gradual increase. The increment in the canopy temperature at night under nighttime warming is displayed in Figure 1B. Except for rainy and snowy days, the canopy temperature under WT was higher than that under NT, indicating that the passive warming device had a notable warming effect. The warming effect was similar to that reported in the study by Chen et al. [34], who observed a warming effect using a passive warming device. Throughout the growth period of wheat, the average temperature increment was 0.28 °C. The soil–plant system temperature increased under the passive nighttime warming system, mainly by intercepting long-wave radiation on the ground at night to achieve the purpose of warming [35]. From October to May of the following year, the average increment during warming was 0.28 °C, and the temperature increment in each month was 0.26, 0.12, 0.20, 0.18, 0.17, 0.46, 0.57, and 0.26 °C, respectively. Considering these results, the best warming effect was observed in the flowering and booting stages. Prior reports also found that the warming effect of a passive warming device was obvious from the booting stage [28,35,36], and a high night temperature during grain number determination might hinder grain filling [36], which may be the main reason for the decrease in wheat production under nighttime warming. Overall, the warming effect of the night warming system was prominent.

3.2. Available Cu Concentration in Soil

Soil-available Cu is the form of Cu that can be absorbed by plants, so this indicator has been used to evaluate the level of soil Cu availability [1,9]. According to the soil-available Cu abundance standard of farmlands in China (<0.5 mg/kg is lacking, 0.5–1.0 mg/kg is on the verge of deficiency, and >1.0 mg/kg is sufficient) [37], the soil-available Cu level in no-Cu applications (NT-CK and WT-CK) was in the range of 0.57–0.95 mg/kg (Figure S1), indicating that Cu was required in this soil. These lower concentrations of available Cu were probably due to soil type, organic matter, and pH [9,30]. Furthermore, the soil type was the primary reason behind the low concentration of available Cu in the soil, because carbonate cinnamon soil itself has a low Cu concentration according to its parent material. Additionally, a relatively higher pH in soil could also inhibit the solubility and effectiveness of Cu [38,39]. Soil pH greatly affects the solubility and mobility of metals, and metal ions are more easily dissolved and migrated in soil at low pH (<7.3) and absorbed by organisms [38,39].
According to a two-way ANOVA, the interaction between warming and Cu factors and the single factor of warming had not reached a significant level with the available Cu concentration in soil. However, the Cu factor had a very significant impact on the available Cu concentration in the soil throughout the wheat growth period. Moreover, it could also be concluded from Figure S1 that the available Cu concentration after Cu application was significantly higher (2858–6352%) than that without Cu application (CK), regardless of the warming or non-warming environment. For the treatments with the same amount of Cu application, no significant effect was observed throughout the wheat growth period, except that the available Cu concentration was significantly reduced by WT-Cu compared to NT-Cu at the booting stage. This significant difference might be mainly related to soil water concentration, and the reduction of soil water concentration limited the availability of Cu in soil under the warming treatment [40,41].
Overall, the test soil was Cu-deficient, Cu applications resulted in significantly higher available Cu concentrations in the soil and nighttime warming did not affect soil Cu concentrations throughout the wheat growth period.

3.3. Antioxidant Enzyme Activities of Leaves

The protection system against oxidative stress is considered an important component, that determines plant survival under stress. The protection system mainly includes POD, SOD, and CAT [27]. The changes in these enzymes have been widely used as indicators to evaluate the degree of stress-induced damage and adaptability of plants [25,26,42].
The changes in POD, SOD, and CAT are shown in Figure 2A, Figure 2B, and Figure 2C, respectively.
A two-way ANOVA showed that the activities of the three antioxidant enzymes were not significantly affected by two interactive factors at the vegetative growth stage (seeding and jointing stages), while they were observably influenced at the reproductive growth stage, such as POD at the booting and the maturation stages, SOD and CAT at maturation stage. Significant effects on three enzyme activities by the single factor of warming were found, while for the single factor of Cu, except for three enzyme activities at the booting stage and POD at the seeding stage, three enzyme activities were significantly affected throughout the growth period. These results indicated that antioxidant enzyme activities were involved in oxidative protection against oxidative stress from environmental stress, which is consistent with the stress responses of many plants [24,25,26,42].
For the treatments with the same amount of Cu application, the three enzyme activities were remarkably more influenced by warming treatments than by no-warming treatments from seeding to booting stages. However, at the maturation stage, the three enzyme activities were remarkably reduced by WT-CK compared to NT-CK. Previous research has found that, facing oxidative stress in plants from heat stress, variable responses in the form of an increase or reduction in the activities of antioxidant enzymes were found, but the results are usually incremental, which were consistent with our experimental results of enzyme activities from seeding to booting stages [27,43,44]. The different results were mainly related to the genotype, temperature, and duration [27,43,44]. According to the results of our test, the changes in antioxidant enzyme activities were primarily affected by the growth period. In the later growth period (maturation), the wheat might have finished growing due to the advanced phenological phase, or the wheat themselves might already have a higher temperature; further warming them might cause wilting and ultimately lead to weaker activities of the wheat themselves and lower antioxidant enzyme activities [16,28,45].
For the same temperature treatments, the three enzyme activities were increased by Cu treatments compared to CK treatments at the seeding and jointing stages, but only POD reached a significant level by NT-Cu compared to NT-CK at the seeding stage. Moreover, at the booting stage, no significant effect on SOD and CAT was observed between Cu and CK treatments, while POD was significantly lower in Cu treatments than CK treatments. At the maturation stage, the three enzyme activities were significantly reduced by Cu treatments than by CK treatments, except for NT-Cu, which positively reduced POD activity more than NT-CK. These results indicated that Cu applications had the potential to promote antioxidant enzyme activities, but they did not reach a significant level in each period. These results are similar to those reported in the literature, which report that excess metals might prompt an increase in antioxidant activities to counteract the harmful effects of excess Cu [24,25].
On the whole, Cu and warming could promote an increase in antioxidant enzyme activities, and the degree of activity change caused by warming applications was greater than that of Cu applications, but the specific difference depended on the growth period.

3.4. Root Activities, Leaf Transpiration Rate, and Net Photosynthetic Rate

Root activities, transpiration rate, and net photosynthetic were displayed in Figure 3, Figure 4A, and Figure 4B, respectively. Root activity could reflect the actual uptake of nutrients by roots [35]. Regardless of the two-way or one-way ANOVA, root activities were observably affected during the growth process, except that at maturity period, they were only significantly affected by warming. Compared with NT applications, WT applications led to significantly higher root activities at the vegetative stage (seeding and jointing stages), while they resulted in lower root activities at the reproductive stage (maturation (p < 0.05) and booting stages). These results indicated that root activities were highly sensitive to temperature. As the growth period progressed (or the ambient temperature increased), nighttime warming tended to weaken the root activities [46]. Also, we obtained the above similar results by summarizing a large number of data.
During the entire growth period, only in a normal temperature environment, Cu treatment observably increased root activities compared to CK treatment, except that no change was observed between the two treatments at maturation. These outcomes indicated that in Cu-deficient soil, Cu application benefits root formation, development, and function [7]. This may be because of the following two reasons: (1) The availability of Cu is high in acidic soil but very weak in soil with a pH > 7.3. Much of the soil in central China is alkaline. Therefore, even if the amount of Cu applied reaches the critical Cu pollution level, the Cu availability in the soil is weaker. So the amount of Cu that can be absorbed and used by plants is limited. (2) Much of the soil in central China is Cu-deficient, and Cu is a micronutrient required for plant growth; therefore, the application of Cu promotes the growth of wheat. However, in a higher-temperature environment or at maturity stage, no difference in root activity was observed between Cu treatments, possibly because the soil temperature was higher, which weakened the influence of Cu on the roots [27,44].
In short, the root activity was mainly affected by the warming environment, which was promoted in the vegetative stage and decreased in the reproductive stage with an increase in ambient temperature. In addition, nighttime warming could weaken the influence of Cu on the roots, and root activities were only sensitive to Cu at room temperature and were increased by Cu.
Figure 4A,B present the changes in transpiration rate and net photosynthetic rate in the growth period of wheat, respectively, which mainly affected the upward uptake of nutrients and the accumulation of photosynthates [35]. From the two-way and one-way ANOVA, (1) for the transpiration rate, a significant effect was found by warming throughout the growth stages, while only at the jointing stage did the Cu have a significant effect on it, and no positive influence was observed by the two interaction factors. (2) For the net photosynthetic rate, a remarkable effect was observed at the Cu factor throughout the growth stages and at the warming factor at the booting stage. Moreover, regardless of the transpiration rate or the net photosynthetic rate, they tended to increase first and then decrease as the reproductive period progressed. With regards to the transpiration rate, it was positively reduced by the warming treatments compared to the CK treatments, except at the maturation stage. This might be because of the high temperature of the environment and the almost-stopped development of wheat at the maturation stage; the transpiration rate was not affected much among treatments [16,28,45].
With regards to the net photosynthetic rate, Cu applications enhanced it more than CK applications throughout all of the sampling points. Among them, the effect reached a significant level at the booting stage; only NT-Cu positively increased it compared to the other treatments at the maturation stage, and no significant change was observed among the other treatments. The outcomes clarified that, in Cu-deficient soil, Cu application greatly improved photosynthesis because Cu served as an important cofactor for proteins such as cytochrome oxidase, polyphenol oxidase, polyamine oxidase, Cu/Zn-SOD, etc., which are essential for photosynthesis [1,8,9].
Overall, in Cu-deficient soil, Cu had the potential to increase the net photosynthesis rate, while the transpiration rate was significantly reduced by nighttime warming.

3.5. Biomass and Yield of Different Tissues in Wheat

The change in biomass of different tissues in wheat throughout the whole growth period is displayed in Figure 5. During this process, the single factor of warming, or Cu, had a significant impact on the total biomass of wheat, except for the Cu factor at the booting stage; a significant difference in the total biomass caused by the interaction effect of warming and Cu was also observed during the vegetative period.
Throughout the sampling points, the total biomass of wheat grown under warming treatments was significantly lower than that of wheat grown under no-warming treatments, except at the booting stage. Previous studies have also reported that winter wheat showed different acclimation capabilities to warming among the seasons [47]. At the vegetative growth stage, though nighttime warming increased root activity for nutrient uptake and plant growth (Figure 3), the main reason for this result was still not worth the fact that nighttime warming strengthened the respiration of wheat tissues at night, increased the consumption of photosynthetic products [28,47], and reduced the transpiration rate (Figure 4A). At the booting stage, the best warming effect was observed (Figure 1). Moreover, at this stage, warming treatments afforded a higher total biomass of wheat compared to no-warming treatments, which was probably because a higher temperature increment at the reproductive stage increased post-flowering photosynthesis by promoting the net photosynthesis rate (Figure 4B), which had a greater effect on wheat substance accumulation than metabolism and promoted wheat growth, especially grain filling [48,49]. And to some extent, the increase in carbohydrates was a response of plants to temperature stress [50]. At the maturation stage, except for the fact that wheat in WT-Cu exhibited higher leaf biomass and significant influence compared to other treatments, the biomass of almost every tissue was higher by no-warming applications than that by warming applications. The results could be explained by the fact that the warming treatment advanced the growth period of wheat [28,51]; therefore, at the normal maturity stage of wheat, the tissues of the wheat were gradually senescent and became dehydrated under the warming treatment, resulting in a lower biomass than that under CK [28,51].
For treatments with the same amount of Cu application, the difference in the biomass of roots and stems and yield (Figure 5) between warming and no-warming treatments was significant. Among them, the highest yield was achieved in NT-Cu, which showed a significant influence on the yield compared to the other applications, followed by NT-CK, which significantly increased the yield compared to the other applications. Moreover, no significant difference in yield was observed between the no-warming treatments. This outcome of a decrease in wheat production under warming treatments could be because of two reasons: (1) High temperatures, especially at the booting stages (Figure 1), which might not be helpful for grain filling [36,52] due to accelerating the growth of aboveground parts (Figure 5) or shortening the duration of the critical period of wheat grain formation [36]. (2) The average temperature during the winter wheat growth season at the test site was 9.52 °C and surpassed 8.6 °C [53]. During long-term research from 1980 to 2013 in the Huang-Huai-Hai plain in China, Chen et al. reported that an average temperature of 8.6 °C during the winter wheat growing period was the yield variation threshold and that nighttime warming would reduce the wheat yield above this threshold [53]. Moreover, Zhao et al. also conducted numerous warming experiments in China and revealed that in areas where the temperature was low during the wheat growing season and water supply was not restricted, the wheat yield would increase; in other cases, warming would decrease wheat production [54]. These results were also similar to those reported by García et al., who found that accelerated development under nighttime warming shortened the duration of the critical period of wheat grain formation and reduced solar radiation capture, with negative effects on biomass production, and, therefore, grain yield [36]. However, many studies have found that nighttime warming can increase the wheat yield in China, such as the studies of Chen et al., Zheng et al., and Zhou et al. [21,22,53]. Based on the results of these experiments, it can be concluded that the changes in wheat yield were mainly affected by changes in temperature, regions, and soil moisture. (3) A significant decrease in wheat yield was observed under warming applications compared with no-warming applications. These results may also be related to the lower Cu content in grains under warming conditions (Figure 6), because less Cu can affect enzyme synthesis, protein metabolism, and carbohydrate distribution, thereby affecting grain formation [1,8,9]. Additionally, the trial found that there was no significant difference in yield between WT-Cu and WT-CK, indicating that an increase in yield caused by Cu treatment was suppressed by the warming treatment in this trial.
In terms of the Cu factor, the total biomass of wheat was remarkably higher in Cu applications than non-Cu applications, whether it was aboveground or underground parts, except during the jointing stage. These results could be explained as follows: (1) Carbonate cinnamon soil with a low Cu concentration and a relatively higher pH than non-Cu application soil (Table S1) could affect the solubility and effectiveness of Cu [38,39]. Then, the wheat grown in this soil would be Cu-deficient. (2) Cu is a micro-nutrient affecting photosynthesis (Figure 4B) and the growth and metabolism processes of plants [1,9]. Therefore, Cu was urgently needed for wheat growth in this test. The growth and yield of wheat were relatively improved in Cu treatments compared to those in non-Cu treatments.
Briefly, nighttime warming decreased the total biomass and yield of wheat grown in Cu-contaminated soil. The highest yield was achieved in NT-Cu, followed by NT-CK. The lowest yield was observed in WT-Cu and WT-CK. Though the highest yield was achieved in NT-Cu, there was a risk of Cu contamination in the wheat.
Overall, nighttime warming decreased spikes per pot and grains per spike, while soil Cu pollution enhanced spikes per pot and grains per spike. The highest spikes and grains per spike might be explained by the high yield of NT-Cu. Meanwhile, the lowest spikes and grains per spike might be explained by the low yield of WT-CK.

3.6. Cu Concentration in Different Tissues in Wheat

Figure 6 and Table S2 show the heatmaps and accurate values of Cu concentration in different tissues of wheat, respectively. Among all of the tissues, the Cu concentration in the roots was the highest (30.85–176.66 mg/kg, Table S2), and it gradually decreased with the growth period, which may have transferred to the aboveground tissues. Moreover, the Cu concentration of roots was markedly higher in Cu applications than non-Cu applications. These outcomes could be explained as follows: (1) Excessive Cu led to damage to the selective permeation of Cu2+ in the root cell membrane, which increased the passive absorption of Cu [7]. (2) Wheat plants might have evolved different cellular mechanisms to deal with excess Cu. For example, in the root system, to reduce metal uptake, excess Cu could be chelated with phytochelators of metallothionein to fix them in the roots [1,7]. For treatments with the same levels of Cu application, the Cu concentration of roots was significantly higher in warming applications than non-warming applications, except at the seeding and booting stages.
For leaves, there was no significant difference among treatments at the jointing and booting stages. At other growth stages, NT-Cu, NT-CK had the highest and lowest Cu concentrations of leaves, respectively; WT-Cu led to lower Cu concentrations of leaves than NT-Cu, indicating that the temperature affected the Cu concentration of leaves [55]. In the warming environment, an increase and decrease in the Cu concentrations of leaves by WT-Cu were observed compared to those by WT-CK at the reproductive stages and vegetative stages, respectively. For the stem, there was no remarkable variation among treatments at the jointing stage. At the booting and maturation stages, NT-Cu showed the highest Cu concentration in stems and had a prominent effect on the Cu concentration compared to the other applications. No significant effect on the Cu concentration of stems was observed between WT-Cu and WT-CK, which might have been caused by the translocation of Cu to the reproductive tissues [9].
During the booting period, Cu applications could result in an enhancement in the Cu concentration of spikes compared to non-Cu applications. For treatments with the same levels of Cu application, the Cu concentration of spikes was significantly increased under warming treatments compared to that under non-warming treatments, and WT-Cu had the highest concentration. In terms of glumes and grains at the maturation stage, warming applications remarkably increased the Cu concentration of glumes compared to the non-warming applications, while warming applications significantly decreased the Cu concentration of grains compared to the non-warming applications. Among them, the Cu concentration in grains treated with NT-Cu was the highest (9.33 mg/kg). These results indicated that the transfer of Cu from the glumes to the grains was restricted in the warming environment [56]. However, it is worth noting that the Cu concentration in grains treated with NT-Cu was close to the threshold (10 mg/kg) for Cu concentration in foodstuff reported in the national standard [57], which presented a potential risk to food security. Meanwhile, by combining these results of root activities and leaf photosynthesis parameters (Figure 3 and Figure 4), it can be concluded that, even though 100 mg/kg Cu belongs to the critical value of Cu pollution in agricultural land in China, it is not always harmful to every tissue of plants. Its harm was reflected in the accumulation of Cu in grain, which increased a potential food safety risk. In addition, for crops grown in Cu-contaminated farmlands, this may be a very good signal to adapt to the warming environment.
Overall, warming treatments increased the Cu concentration in the roots and reduced the Cu concentration in the aboveground tissues. In a warming environment, the transfer of Cu from glumes to grains was limited under Cu application, and then the Cu concentration of grains in WT-Cu application was significantly lower than that in other applications.

3.7. Cu Accumulation in Different Tissues in Wheat

The change in Cu accumulation in different tissues of wheat during its growth period is displayed in Figure 7, which characterizes the transport and redistribution ability of Cu in tissues [9]. A two-way ANOVA revealed that Cu accumulation in the entire plant was significantly influenced by a two-factor interaction between Cu and warming and a single factor of Cu or warming, except for a single factor of Cu and two-factor interactions at the booting stage and two-factor interactions at the maturation stage. As the growth period progressed, Cu accumulation in the underground and aboveground tissues of wheat continuously increased. During the growth period, the Cu accumulation of aboveground tissues and entire wheat was significantly lower in warming treatments than non-warming treatments, except at the booting stage. This is primarily because the biomass and Cu concentrations under the warming treatments were higher than those under the non-warming treatments (Figure 5 and Figure 6 and Table S2). Cu applications led to a higher Cu accumulation of roots than non-Cu applications, and NT-Cu had the highest Cu accumulation. This is mainly due to the higher biomass and Cu concentrations under NT-Cu (Figure 5 and Figure 6 and Table S2). Throughout the growth period of wheat, the Cu accumulation of roots was remarkably lower in WT-Cu than that in NT-Cu, except at the booting stage. At the booting stage, the Cu accumulation of whole wheat was significantly higher in Cu applications than in non-Cu applications, which was probably because of the higher biomass and Cu in wheat, especially in its roots, stems, and leaves (Figure 5 and Figure 6 and Table S2).
In terms of nighttime warming, warming treatments increased Cu accumulation in the aboveground tissues compared to the non-warming treatments. This was mainly due to the fact that the higher temperature stimulated plant growth [9] and caused an increase in the biomass of leaves and stems (Figure 5). However, WT-Cu resulted in a significant decrease in the Cu accumulation of roots compared to NT-Cu, indicating that higher nighttime warming might promote Cu accumulation shifts to aboveground at the booting stage. At the maturation stage, the Cu accumulation of wholewheat was also significantly higher in Cu applications than non-Cu applications, while warming treatments led to a significant decrease in the Cu accumulation of underground and aboveground tissues of wheat. Under warming conditions, though WT-Cu significantly decreased the Cu accumulation of wholewheat compared to that in WT-CK, the Cu accumulation of grains was remarkably lower in WT-Cu than in WT-CK. These results are mainly due to the fact that Cu mainly accumulates in roots and leaves and transfers less to grains. For the two Cu applications, WT-Cu significantly decreased the Cu accumulation of wholewheat compared to NT-Cu; this is mainly because the Cu accumulation of grains and stems was significantly lower in WT-Cu than in NT-Cu. These outcomes reveal that nighttime warming could inhibit the Cu accumulation of wheat. The Cu accumulation of grains in wheat grown in Cu-contaminated soil was the lowest.

3.8. Cu Translocation Factors in Different Tissues in Wheat

The Cu translocation factors between adjacent tissues of wheat are shown in Table 1, characterizing the transfer and redistribution ability of Cu between wheat tissues [9]. During all of the sampling points, the Cu translocation factors from the roots to the aboveground parts were treated with non-warming treatments, and the warming treatments reached the highest value in the maturation stage and booting stage, respectively. These results also show that the demand for Cu by aboveground parts could be promoted in the reproductive stages [9]. The results of Cu accumulation also confirm this (Figure 7). The Cu translocation factors were significantly lower in Cu applications than in non-Cu applications because, in the root system, excess Cu is chelated with phytochelators of metallothionein and then fixed in the roots to reduce excess Cu uptake [1,7]. Moreover, WT-Cu did not lead to a significantly higher result in this index compared to NT-Cu. These results indicate that nighttime warming did not promote Cu transfer from the root to aboveground parts in Cu-contaminated soil. Lower Cu concentration and accumulation also confirm this, especially in grains (Figure 6 and Figure 7). In other words, nighttime warming treatment, to some extent, could somewhat reduce the risk of Cu pollution in the aboveground part of wheat grown in Cu-polluted soil.
For the translocation from stems to leaves, at the jointing sampling point, WT-Cu had the lowest Cu translocation factors from stems to leaves and showed remarkable influence compared to the other applications; no significant effect was observed among the other treatments. At the booting sampling point, NT-CK resulted in significantly higher Cu translocation factors from stems to leaves compared to the other applications; no noteworthy effect among the other treatments was found. NT-CK had the highest Cu translocation factors from stems to leaves during the jointing and booting stages. At the maturation sampling point, Cu applications led to significantly higher Cu translocation factors than non-Cu applications, and there was no significant level between NT-CK and WT-CK and NT-Cu and WT-Cu. These outcomes reveal that nighttime warming did not promote Cu translocation factors from stems to leaves in Cu-contaminated soil. There are two probable explanations for this, which are proposed as follows: (1) Under stress conditions, nighttime warming might promote the absorption of other nutrients by relatively strong root activities (Figure 3), and the antagonism between nutrients might not be conducive to the absorption and transport of Cu [7,9]. (2) The distribution characteristics of Cu in various organs of wheat might have been changed by the lower transpiration rate under warming treatment (Figure 4A).
At the booting sampling point, NT-CK led to significantly higher Cu translocation factors from stem to spike than the other applications; no noteworthy effect among the other treatments was found. At the maturation stage, NT-CK significantly reduced Cu translocation factors from stems to glumes compared to the other treatments; there was no noteworthy influence found among the other treatments. Warming treatments decreased Cu translocation factors from stems to grains compared to the non-warming treatments. Among them, the Cu translocation factor was significantly lower in WT-Cu than in NT-CK and NT-Cu. Previous studies have also shown that the Cu translocation between adjacent tissues was significantly affected by temperature [58], which might be due to the fact that the distribution characteristics of Cu in different parts of wheat are changed by transpiration under warming treatments (Figure 4A) [6,7].
Overall, Cu applications limited Cu translocation factors from the underground to aboveground tissues of wheat compared with non-Cu applications. Nighttime warming significantly decreased Cu translocation factors from the underground to aboveground tissues and from stems to grains in Cu-contaminated soil. That is, Cu pollution in soil, to some extent, relatively reduced the risk of Cu pollution in aboveground tissues in wheat under a nighttime warming environment.

4. Conclusions

Under nighttime warming and Cu application, the antioxidant enzyme activities of wheat were activated to cope with the stress, and the effect of warming was especially significant. Cu applications increased the total biomass and yield of wheat. Among them, NT-Cu had the highest yield due to its relatively strong root activity and photosynthesis, but the Cu concentration in the grains was close to the threshold and could present a potential food safety risk. Because of the attenuated root activity (in the reproductive stage) and transpiration rate, nighttime warming reduced the total biomass and yield and then limited the Cu accumulation of wheat, especially in grain. In Cu-contaminated soil, nighttime warming significantly decreased the Cu concentration in grains by decreasing the Cu translocation factors from underground to aboveground tissues and from stems to grains. This caused the Cu concentration in WT-Cu to be in a safe range. Further research is expected to explore the effects of extreme climate and heavy metal stress on crop growth and yield from the perspective of molecular breeding and hormone cascade regulation.

Supplementary Materials

The following supporting information can be downloaded at: https://www.mdpi.com/article/10.3390/agronomy14061302/s1, Figure S1. Soil available Cu concentration. Data were analyzed by two-way ANOVA (W/WT, warming treatment; NT, no-warming treatment; CK, no-Cu application; Cu, Cu application; ns, not significant; *, p < 0.05; **, p < 0.01; ***, p < 0.001). Different letters at the same growth stage represent a significant difference among treatments (p < 0.05). Table S1. Physical and chemical properties in soil. Table S2. Cu concentration in different tissues of wheat (mg/kg).

Author Contributions

Conceptualization, X.C. and P.S.; Methodology, X.C., F.L., P.S., X.L. and Q.L.; Software, X.C. and F.L.; Formal analysis, X.C.; Investigation, P.S. and X.L.; Resources, X.C. and Q.L.; Data curation, P.S.; Writing—original draft, X.C. and F.L.; Writing—review & editing, P.S. and T.K.; Supervision, Q.L.; Project administration, T.K.; Funding acquisition, X.C., P.S. and T.K. All authors have read and agreed to the published version of the manuscript.

Funding

This work was supported by the Henan Province Science and Technology Research and Development Plan Joint Fund (Grant No. 21011918), the Henan Province Science and Technology Research Program Project (Grant No. 242102110185), the PhD Startup Foundation of Henan University of Science and Technology (Grant No. 13480101), and the National Nature Science Foundation of China (No. 41003030).

Data Availability Statement

The data presented in this study are available on request from the corresponding author due to privacy.

Conflicts of Interest

The authors declare no conflicts of interest.

References

  1. Ghori, N.H.; Ghori, T.; Hayat, M.Q.; Imadi, S.R.; Gul, A.; Altay, V.; Ozturk, M. Heavy metal stress and responses in plants. J. Environ. Sci. 2019, 16, 1807–1828. [Google Scholar] [CrossRef]
  2. Guo, G.; Wu, F.; Xie, F.; Zhang, R. Spatial distribution and pollution assessment of heavy metals in urban soils from southwest China. J. Environ. Sci. 2012, 24, 410–418. [Google Scholar] [CrossRef] [PubMed]
  3. Koz, B.; Cevik, U.; Akbulut, S. Heavy metal analysis around Murgul (Artvin) copper mining area of Turkey using moss and soil. Ecol. Indic. 2012, 20, 17–23. [Google Scholar] [CrossRef]
  4. Obiora, S.C.; Chibuike, G.U. Heavy metal polluted soils: Effect on pants and boremediation methods. Appl. Environ. Soil Sci. 2014, 2014, 752708. [Google Scholar] [CrossRef]
  5. Li, J.; Xu, Y.; Wang, L.; Li, F. Heavy metal occurrence and risk assessment in dairy feeds and manures from the typical intensive dairy farms in China. Environ. Sci. Pollut. Res. 2019, 26, 6348–6358. [Google Scholar] [CrossRef] [PubMed]
  6. Chen, C.L.; Liu, H.; Zhang, Y.; Gu, G.H.; Hu, J.Y. Micro-assessment of heavy metal immobilization within alkali-activated copper tailings-slag geopolymer. Cem. Concr. Comp. 2024, 149, 105510. [Google Scholar] [CrossRef]
  7. Adrees, M.; Ali, S.; Rizwan, M.; Ibrahim, M.; Abbas, F.; Farid, M.; Zia-ur-Rehman, M.; Irshad, M.K.; Bharwana, S.A. The effect of excess copper on growth and physiology of important food crops: A review. Environ. Sci. Pollut. Res. 2015, 22, 8148–8162. [Google Scholar] [CrossRef]
  8. Marschner, H. Marschner’s Mineral Nutrition of Higher Plants, 3rd ed.; Academic Press: London, UK, 2012. [Google Scholar]
  9. Gemin, L.G.; Lara, G.B.D.; Mógor, A.F.; Mazaro, S.M.; Sant’Anna-Santos, B.F.; Mógor, G.; Amatussi, J.D.O.; Cordeiro, E.C.N.; Marques, H.M.C. Polysaccharides combined to copper and magnesium improve tomato growth, yield, anti-oxidant and plant defense enzymes. Sci. Hortic. 2023, 310, 111758. [Google Scholar] [CrossRef]
  10. Sağlam, A.; Yetişsin, F.; Demiralay, M.; Terzi, R. Copper stress and responses in plants. In Plant Metal Interaction; Elsevier: Amsterdam, The Netherlands, 2016; pp. 21–40. [Google Scholar]
  11. Lamb, D.T.; Naidu, R.; Ming, H.; Megharaj, M. Copper phytotoxicity in native and agronomical plant species. Ecotox. Environ. Saf. 2012, 85, 23–29. [Google Scholar] [CrossRef]
  12. Maas, S.; Scheifler, R.; Benslama, M.; Crini, N.; Lucot, E.; Brahmia, Z.; Benyacoub, S.; Giraudoux, P. Spatial distribution of heavy metal concentrations in urban, suburban and agricultural soils in a Mediterranean city of Algeria. Environ. Pollut. 2010, 158, 2294–2301. [Google Scholar] [CrossRef]
  13. IPCC. Climate Change 2021: The Physical Science Basis; IPCC: Geneva, Switzerland, 2021. [Google Scholar]
  14. Chavas, D.R.; Izaurralde, R.C.; Thomson, A.M.; Gao, X.J. Long-term climate change impacts on agricultural productivity in eastern China. Agric. For. Meteorol. 2009, 149, 1118–1128. [Google Scholar] [CrossRef]
  15. Davy, R.; Esau, I.; Chernokulsky, A.; Outten, S.; Zilitinkevich, S. Diurnal asymmetry to the observed global warming. J. Climatol. 2017, 37, 79–93. [Google Scholar] [CrossRef]
  16. Cai, C.; Yin, X.; He, S.; Jiang, W.; Si, C.; Struik, P.C.; Luo, W.H.; Li, G.; Xie, Y.T.; Xiong, Y.; et al. Responses of wheat and rice to factorial combinations of ambient and elevated CO2 and temperature in FACE experiments. Glob. Chang. Biol. 2015, 49, 7625–7638. [Google Scholar] [CrossRef] [PubMed]
  17. Shewry, P.R.; Hey, S.J. The contribution of wheat to human diet and health. Food Energy Secur. 2015, 4, 178–202. [Google Scholar] [CrossRef] [PubMed]
  18. Kevin, E.; Trenberth, A.D.; Gerard, V.D.S.; Philip, D.J.; Jonathan, B.; Keith, R.B.; Justin, S. Global warming and changes in drought. Nat. Clim. Chang. 2014, 4, 17–22. [Google Scholar] [CrossRef]
  19. Dorau, K.; Bamminger, C.; Koch, D.; Mansfeldt, T. Evidences of soil warming from long-term trends (1951-2018) in North Rhine-Westphalia, Germany. Clim. Chang. 2022, 170, 9. [Google Scholar] [CrossRef]
  20. Lobell, D.B.; Schlenker, W.; Costa-Roberts, J. Climate trends and global crop production since 1980. Science 2011, 333, 616–620. [Google Scholar] [CrossRef]
  21. Zheng, C.Y.; Deng, A.X.; Chen, C.Q. Nighttime warming increases winter-sown wheat yield across major Chinese cropping regions. Field Crop. Res. 2017, 214, 202–210. [Google Scholar] [CrossRef]
  22. Zhou, Y.J.; Xu, L.; Xu, Y.Z.; Xi, M.; Tu, D.B.; Chen, J.H.; Wu, W. A meta-analysis of the effects of global warming on rice and wheat yields in a rice–wheat rotation system. Food Energy Secur. 2021, 10, e316. [Google Scholar] [CrossRef]
  23. Wan, S.; Xia, J.; Liu, W.; Niu, S. Photosynthetic overcompensation under nocturnal warming enhances grassland carbon sequestration. Ecology 2009, 90, 2700–2710. [Google Scholar] [CrossRef]
  24. Bhaduri, A.M.; Fulekar, M.H. Antioxidant enzyme responses of plants to heavy metal stress. Rev. Environ. Sci. Biotechnol. 2012, 11, 55–69. [Google Scholar] [CrossRef]
  25. Huang, Y.; Jiao, Y.Y.; Nawaz, M.A.; Chen, C.; Liu, L.; Lu, Z.; Kong, Q.S.; Cheng, F.; Bie, Z.L. Improving magnesium uptake, photosynthesis and antioxidant enzyme activities of watermelon by grafting onto pumpkin rootstock under low magnesium. Plant Soil. 2016, 409, 229–246. [Google Scholar] [CrossRef] [PubMed]
  26. Yaghoubian, I.; Ghassemi, S.; Nazari, M.; Raey, Y.; Smith, D.L. Response of physiological traits, antioxidant enzyme and nutrient uptake of soybean to Azotobacter Chroococcum and zinc sulfate under salinity. S. Afr. J. Bot. 2021, 143, 42–51. [Google Scholar] [CrossRef]
  27. Fan, C.; Hou, M.; Si, P.; Sun, H.; Zhang, K.; Bai, Z.; Wang, G.; Li, C.; Liu, L.; Zhang, Y. Response of root and root hair phenotypes of cotton seedlings under high temperature revealed with RhizoPot. Front. Plant Sci. 2022, 13, 1007145. [Google Scholar] [CrossRef] [PubMed]
  28. GB 15618-2018; Soil Environmental Quality Risk Control Standard for Soil Contamination of Agricultural Land. Ministry of Ecology and Environment of People Republic of China: Beijing, China, 2018.
  29. Tian, Y.L.; Chen, J.; Chen, C.Q.; Deng, A.X.; Song, Z.W.; Zheng, C.Y.; Hoogmoed, W.; Zhang, W. Warming impacts on winter wheat phenophase and grain yield under field conditions in Yangtze Delta Plain, China. Field Crop. Res. 2012, 134, 193–199. [Google Scholar] [CrossRef]
  30. Liang, J.; Yang, Z.X.; Tang, L.; Zeng, G.M.; Yu, M.; Li, X.D.; Wu, H.P.; Qian, Y.Y.; Li, X.M.; Luo, Y. Changes in heavy metal mobility and availability from contaminated wetland soil remediated with combined biochar-compost. Chemosphere 2017, 181, 281–288. [Google Scholar] [CrossRef] [PubMed]
  31. Yin, D.; Wang, X.; Chen, C.; Peng, B.; Tan, C.; Li, H. Varying effect of biochar on Cd, Pb and As mobility in a multi-metal contaminated paddy soil. Chemosphere 2016, 152, 196–206. [Google Scholar] [CrossRef] [PubMed]
  32. Bao, S.D. Soil and Agricultural Chemistry Analysis; China Agriculture Press: Beijing, China, 2008. [Google Scholar]
  33. Rezvani, M.; Zaefarian, F. Bioaccumulation and translocation factors of cadmium and lead in Aeluropus littoralis. Aus. J. Agric. Eng. 2011, 2, 114–119. [Google Scholar]
  34. Chen, J.; Chen, C.; Tian, Y.L.; Zhang, X.; Dong, W.; Zhang, B.; Zhang, J.; Zheng, C.; Deng, A.; Song, Z. Differences in the impacts of nighttime warming on crop growth of rice-based cropping systems under field conditions. Eur. J. Agron. 2017, 82, 80–92. [Google Scholar] [CrossRef]
  35. Beier, C.; Emmett, B.; Gundersen, P.; Albert Tietema, A.; Peñuelas, J.; Estiarte, M.; Gordon, C.; Gorissen, A.; Llorens, L.; Roda, F.; et al. Novel approaches to study climate change effects on terrestrial ecosystems in the field: Drought and passive nighttime warming. Ecosystems 2004, 7, 583–597. [Google Scholar] [CrossRef]
  36. Bansal, D.; Tiwari, P.; Talukdar, G.; Rawat, G.S. Impacts of passive experimental warming on daytime and night-time respiration in a semi-natural grassland. Biogeosciences 2023. [Google Scholar] [CrossRef]
  37. Huang, Y.; Wang, L.; Wang, W.; Li, T.Q.; He, Z.L.; Yang, X. Current status of agricultural soil pollution by heavy metals in China: A meta-analysis. Sci. Total Environ. 2018, 651, 3034–3042. [Google Scholar] [CrossRef] [PubMed]
  38. Huang, B.; Li, Z.; Huang, J.; Guo, L.; Nie, X.; Wang, Y.; Zhang, Y.; Zeng, G.M. Adsorption characteristics of Cu and Zn onto various size fractions of aggregates from red paddy soil. J. Hazard. Mater. 2014, 264, 176–183. [Google Scholar] [CrossRef] [PubMed]
  39. Zhang, F.R. Soil Geography, 2nd ed.; China Agriculture Press: Beijing, China, 2016. [Google Scholar]
  40. Meite, F.; Alvarez-Zaldívar, P.; Crochet, A.; Wiegert, C.; Payraudeau, S.; Imfeld, G. Impact of rainfall patterns and frequency on the export of pesticides and heavy-metals from agricultural soils. Sci. Total Environ. 2018, 616–617, 500–509. [Google Scholar] [CrossRef] [PubMed]
  41. Zheng, S.; Zhang, M. Effect of moisture regime on the redistribution of heavy metals in paddy soil. J. Environ. Sci. 2011, 23, 434–443. [Google Scholar] [CrossRef] [PubMed]
  42. Lo’ay, A.A.; EL-Khateeb, A.Y. Antioxidant enzyme activities and exogenous ascorbic acid treatment of ‘Williams’ banana during long-term cold storage stress. Sci. Hortic. 2018, 234, 210–219. [Google Scholar] [CrossRef]
  43. Roach, T.; Neuner, G.; Kranner, I.; Buchner, O. Heat acclimation under drought stress induces antioxidant enzyme activity in the alpine plant primula minima. Antioxidants 2023, 12, 1093. [Google Scholar] [CrossRef]
  44. Huang, W.D.; He, Y.Z.; Wang, H.H.; Zhu, Y.Z. Leaf physiological responses of three psammophytes to combined effects of warming and precipitation reduction in Horqin Sandy Land, northeast China. Front. Plant Sci. 2022, 12, 785653. [Google Scholar] [CrossRef] [PubMed]
  45. Ji, S.N.; Classen, A.T.; Zhang, Z.H.; He, J.S. Asymmetric winter warming advanced plant phenology to a greater extent than symmetric warming in an alpine meadow. Funct. Ecol. 2017, 31, 2147–2156. [Google Scholar] [CrossRef]
  46. Huang, B.R.; Rachmilevitch, S.; Xu, J.C. Root carbon and protein metabolism associated with heat tolerance. J. Exp. Bot. 2012, 63, 3455–3465. [Google Scholar] [CrossRef]
  47. Zhou, H.R.; Xu, M.; Hou, R.X.; Zheng, Y.P.; Chi, Y.G.; Ouyang, Z. Thermal acclimation of photosynthesis to experimental warming is season dependent for winter wheat (Triticum aestivum L.). Environ. Exp. Bot. 2018, 150, 249–259. [Google Scholar] [CrossRef]
  48. Fan, Y.H.; Tian, M.Y.; Jing, Q.; Tian, Z.W.; Han, H.M.; Jiang, D.; Cao, W.X.; Dai, T.B. Winter night warming improves pre-anthesis crop growth and post-anthesis photosynthesis involved in grain yield of winter wheat (Triticum aestivum L.). Field Crop. Res. 2015, 178, 100–108. [Google Scholar] [CrossRef]
  49. Hatfield, J.L.; Prueger, J.H. Temperature extremes: Effect on plant growth and development. Weather Clim. Extrem. 2015, 10, 4–10. [Google Scholar] [CrossRef]
  50. Hu, W.; Gao, M.; Du, K.; Liu, Y.; Xu, B.J.; Wang, Y.J.; Zhou, Z.G.; Zhao, W.Q. Combined effect of elevated temperature and drought stress on carbohydrate metabolism of cotton (Gossypium hirsutum L.) subtending leaves. Physiol. Plant. 2023, 175, e13866. [Google Scholar] [CrossRef]
  51. Xiao, W.; Chen, X.; Jing, X.; Zhu, B. A meta-analysis of soil extracellular enzyme activities in response to global change. Soil Biol. Biochem. 2018, 123, 21–32. [Google Scholar] [CrossRef]
  52. Hu, Y.J.; Yin, J. Wheat Ecological Cultivation; Science Press: Beijing, China, 2014. [Google Scholar]
  53. Chen, J.; Tian, Y.L.; Zhang, X.; Zheng, C.Y.; Song, Z.W.; Deng, A.X.; Zhang, W.J. Nighttime warming will increase winter wheat yield through improving plant development and grain growth in north China. J. Plant Growth Regul. 2018, 33, 397–407. [Google Scholar] [CrossRef]
  54. Zhao, C.; Piao, S.; Huang, Y.; Wang, X.H.; Ciais, P.; Huang, M.T.; Zeng, Z.Z.; Peng, S.S. Field warming experiments shed light on the wheat yield response to temperature in China. Nat. Commun. 2016, 7, 13530. [Google Scholar] [CrossRef]
  55. Qi, L.; Li, C.; Lai, L.; Kou, T.; Deng, Y. Nighttime warming promotes copper translocation from root to shoot of wheat (Triticum aestivum L.) through enlarging root systems. Front. Environ. Sci. 2024, 12, 1284198. [Google Scholar] [CrossRef]
  56. Turner, D.W.; Lahav, E. Temperature influences nutrient absorption and uptake rates of bananas grown in controlled environments. Sci. Hortic. 1985, 26, 311–322. [Google Scholar] [CrossRef]
  57. GB 15199-94; Tolerance Limit of Copper in Foods. Ministry of Health of People Republic of China: Beijing, China, 1994.
  58. Pregitzer, K.S.; King, J.S.; Burton, A.J.; Brown, S.E. Responses of tree fine roots to temperature. New Phytol. 2010, 147, 105–115. [Google Scholar] [CrossRef]
Figure 1. Canopy temperature increment under nighttime warming (A) and average canopy temperature at night (B) (NT, no−warming treatment; WT, warming treatment).
Agronomy 14 01302 g001
Figure 2. Antioxidant enzyme activities of leaves, including POD (A), SOD (B), and CAT (C). Data were analyzed by two-way ANOVA (W/WT, warming treatment; NT, no-warming treatment; CK, no-Cu application; Cu, Cu application; ns, not significant; *, p < 0.05; **, p < 0.01; ***, p < 0.001). Different letters at the same growth stage represent a significant difference among treatments (p < 0.05). Abbreviation: POD, Peroxidase; SOD, Superoxide dismutase; CAT, Catalase.
Agronomy 14 01302 g002
Figure 3. Root activities. Data were analyzed by two-way ANOVA (W/WT, warming treatment; NT, no-warming treatment; CK, no-Cu application; Cu, Cu application; ns, not significant; **, p < 0.01; ***, p < 0.001). Different letters at the same growth stage represent a significant difference among treatments (p < 0.05).
Agronomy 14 01302 g003
Figure 4. Leaf transpiration rate (A) and net photosynthetic rate (B). Data were analyzed by two-way ANOVA (W/WT, warming treatment; NT, no−warming treatment; CK, no−Cu application; Cu, Cu application; ns, not significant; *, p < 0.05; **, p < 0.01; ***, p < 0.001). Different letters at the same growth stage represent a significant difference among treatments (p < 0.05).
Agronomy 14 01302 g004
Figure 5. Wheat yield and biomass. Data were analyzed by two-way ANOVA (W/WT, warming treatment; NT, no−warming treatment; CK, no−Cu application; Cu, Cu application; ns, not significant; *, p < 0.05; **, p < 0.01; ***, p < 0.001). Different letters in tissues at the same growth stage represent a significant difference in tissue biomass among treatments (p < 0.05). The lowercase (a, b, c) and uppercase (A, B, C) letters on the histogram above the abscissa axis represent the significant differences in aboveground and whole plant biomass, respectively (p < 0.05). The lowercase (a, b, c) letters under the bar graph below the abscissa axis represent significant differences in underground biomass (p < 0.05).
Agronomy 14 01302 g005
Figure 6. Heatmaps of Cu concentration in different tissues of wheat. Data were analyzed by a two-way ANOVA. Different letters in the same phenological stage (a, b, c) represent a p < 0.05 significant difference at the same sampling point. Blue and red indicate the smaller and larger Cu concentrations, respectively; the dark and light of colors indicate the degree of strength and weakness, respectively.
Agronomy 14 01302 g006
Figure 7. Cu accumulation in different tissues of wheat. Data were analyzed by two-way ANOVA (W/WT, warming treatment; NT, no-warming treatment; CK, no-Cu application; Cu, Cu application; ns, not significant; *, p < 0.05; **, p < 0.01; ***, p < 0.001). Different letters in tissues at the same growth stage represent a significant difference in Cu accumulation of the tissue among treatments (p < 0.05). The lowercase (a, b, c) and uppercase (A, B, C) letters on the histogram above the abscissa axis represent the significant differences in the Cu accumulation of the aboveground and whole plant, respectively (p < 0.05). The lowercase (a, b, c) letters under the bar graph below the abscissa axis represent significant differences in the Cu accumulation underground (p < 0.05).
Agronomy 14 01302 g007
Table 1. Cu translocation factors in different tissues of wheat.
Translocation Factor
Seeding StageJointing StageBooting StageMaturation Stage
Root to LeafRoot to StemStem to LeafRoot to StemStem to LeafStem to SpikeRoot to StemStem to LeafStem to GlumeStem to Grain
NTCK0.02 ± 0.00 c0.16 ± 0.04 a2.24 ± 0.14 a0.11 ± 0.03 b3.96 ± 1.02 a4.25 ± 1.19 a0.19 ± 0.03 a0.90 ± 0.10 b0.47 ± 0.13 b1.42 ± 0.26 a
Cu0.08 ± 0.01 b0.05 ± 0.01 c2.20 ± 0.17 a0.10 ± 0.01 b1.19 ± 0.18 b1.52 ± 0.32 b0.10 ± 0.02 b1.83 ± 0.38 a1.07 ± 0.10 a1.45 ± 0.15 a
WTCK0.11 ± 0.01 a0.11 ± 0.01 b2.00 ± 0.06 a0.17 ± 0.03 a2.37 ± 0.68 b1.66 ± 0.53 b0.12 ± 0.02 b0.73 ± 0.04 b1.57 ± 0.42 a1.27 ± 0.32 ab
Cu0.02 ± 0.01 c0.05 ± 0.00 c1.58 ± 0.32 b0.12 ± 0.01 b2.03 ± 0.29 b2.24 ± 0.51 b0.05 ± 0.01 c1.76 ± 0.41 a1.60 ± 0.37 a0.91 ± 0.12 b
Note: Different letters at the same growth stage represent a significant difference among treatments (p < 0.05).
Disclaimer/Publisher’s Note: The statements, opinions and data contained in all publications are solely those of the individual author(s) and contributor(s) and not of MDPI and/or the editor(s). MDPI and/or the editor(s) disclaim responsibility for any injury to people or property resulting from any ideas, methods, instructions or products referred to in the content.

