Article

Rapid Identification of Rhizobia Nodulating Soybean by a High-Resolution Melting Analysis

by
Karolina Jarzyniak
* and
Dorota Narożna
Department of Biochemistry and Biotechnology, Poznań University of Life Sciences, Dojazd 11, 60-632 Poznań, Poland
*
Author to whom correspondence should be addressed.
Agronomy 2024, 14(6), 1305; https://doi.org/10.3390/agronomy14061305
Submission received: 30 April 2024 / Revised: 13 June 2024 / Accepted: 14 June 2024 / Published: 17 June 2024

Abstract

:
Soybean [Glycine max (L.) Merr.] is one of the most important and oldest crops. Due to its ability to form symbiotic interactions with nitrogen-fixing bacteria, it is a valuable source of nitrogen for agriculture and proteins for humans and livestock. In Europe, for instance, in Poland, the soybean cultivation area is still not large but is gradually increasing due to climate change. The lack of indigenous soybean microsymbionts in Polish soils forces the application of commercial strains to establish effective symbioses. Fast and reliable identification methods are needed to study the persistence, competitiveness, and dispersal of bradyrhizobia introduced as inocula. Our study aimed to apply real-time PCR coupled with high-resolution melting curve (HRM) analysis to detect and differentiate bacterial strains occupying soybean nodules. HRM-PCR was performed on crude extracts from nodules using primers specific for recA, a highly conserved nonsymbiotic gene. By comparing them with the reference strains, we were able to identify and assign Bradyrhiobium strains that had been introduced into field locations in Poland. In conclusion, HRM analysis was proven to be a fast and accurate method for identifying soybean microsymbionts and might be successfully used for identifying other legume-nodulating bacteria.

1. Introduction

Soybean [Glycine max (L.) Merr.] is one of the most important legume crops cultivated worldwide [1]. Due to its high protein and oil content, it is a valuable food and fodder component for humans and livestock, respectively [2]. Its success is partly due to nitrogen-fixing symbiosis with soil bacteria called rhizobia. This beneficial association enables legumes to survive in low-nutrient soils. Moreover, it improves soil fertility and thus makes legumes a sustainable nitrogen source for agriculture [3].
Although there is a high demand for soybean protein in Europe, the cultivation area is still not large, especially in central and northern Europe. The main limiting factor is the high thermal demand of this legume, which is native to East Asia. However, according to climate change projections, the expansion of its cultivation area is expected [1,4]. Indeed, the latter is gradually increasing in Poland, from over 25,000 hectares in 2021 to approximately 48,000 ha in 2022 [5].
To increase soybean cultivation and yield potential across Central Europe, more attention should be focused on compatible soybean-nodulating bradyrhizobia (SNB) [1]. Soybean is generally nodulated by strains of Bradyrhizobium japonicum, B. diazoefficiens, and B. elkanii [6]. In Polish soils, for instance, the lack of indigenous soybean microsymbionts forces the application of commercial Bradyrhizobium strains, which may exhibit different symbiotic potentials reflected as N-fixation rate capabilities. Additionally, it has been shown that environmental conditions strongly influence the competitiveness of SNB strains [7]. Therefore, fast and reliable identification methods are needed to study the persistence, competitiveness, and dispersal of SNB introduced as inocula into areas previously free of indigenous soybean microsymbionts. To date, the most common strategies for recognising and distinguishing particular rhizobial strains include serological methods [7,8], DNA profiling (e.g., PCR-restriction fragment length polymorphisms of 16S rRNA) [7,9,10], and multilocus sequence analyses (MLSA) of different nonsymbiotic, housekeeping genes, such as recA, glnII, atpD, dnaK, and gyrB, as well as symbiotic genes, such as nod and nif, which are responsible for nodulation and nitrogen fixation, respectively [11,12,13,14,15]. The aforementioned methods vary in the level of bacterial discrimination [16]. Furthermore, many of these methods are time-consuming, cost-consuming, complex, and thus less suitable for high-throughput analyses. For the serological identification of bacteria, strain-specific antibodies are needed. On the other hand, the two latter molecular identification techniques rely on time-consuming post-PCR processing, separation of the samples on a gel or other matrix, or DNA sequencing [16,17]. These limitations can be overcome by adopting high-resolution melting analysis for the identification or delimitation of SNB species.
High-resolution melting analysis (HRM or HRMA) is a sensitive post-PCR method that enables rapid, simple, and high-throughput identification of sequence variation down to a single nucleotide polymorphism [17,18]. Target sequences are first amplified using quantitative PCR (qPCR) in the presence of fluorescent dye, intercalating double-stranded DNA (dsDNA). The use of third-generation binding dyes (e.g., EvaGreen and SYTO9) ensures complete dsDNA saturation without inhibiting PCR [18,19]. Immediately following qPCR, the amplicon is gradually denatured by increasing the temperature in the same real-time instrument [19]. As the temperature increases, the fluorescence emission values decrease since the denaturing amplicon releases the dye. Based on the changes in fluorescence resulting from temperature shifts, melting curves—raw, normalised, and difference—are plotted. The plot shape depends on the amplicon length, sequence, GC content, and complementarity of the DNA strands [20]. Therefore, the sequence variations in the amplicon can be visualised without the need for any other post-PCR processing. Moreover, HRM-PCR is a nondestructive method, and subsequent sample processing, such as DNA sequencing, can still be performed after analysis.
The use of HRM analysis has significantly expanded in recent years. It has been applied to study the diversity of microbial systems, mainly in clinical research and diagnostics as well as food science [21,22,23,24,25]. The published methods have focused on particular genera and/or classes of species, both beneficial and pathogenic, inhabiting clinical specimens [26,27] and food products [21,23,25].
In the present study, we attempted to develop an HRM-PCR assay to detect and differentiate bacterial strains occupying soybean nodules based on differences in the melt profile of the recA gene fragment.

2. Materials and Methods

2.1. Reference Strains and DNA Isolation

The Bradyrhizobium japonicum strains capable of interacting symbiotically with soybean USDA 123, USDA 442, B. diazoefficiens USDA 110 (formerly identified as B. japonicum [28]), and B. elkanii USDA 472 were used as references. Strains were obtained from Professor Michael Sadowsky, University of Minnesota, St. Paul, MN, USA. Total genomic DNA was isolated from single bacterial colonies using a GenElute bacterial genomic DNA kit (Sigma–Aldrich Corporation, St. Louis, MO, USA) following the manufacturer’s instructions. One nanogram of genomic DNA was used as a template for PCR.

2.2. Crude Extract Preparation from Soybean Nodules

Soybean plants [Glycine max (L.) Merr. cv. ERICA] were grown in soil from the Gorzyń field site, where strains USDA 110, USDA 123, USDA 442, and USDA 472 were introduced in 1994 [7] and 2016 (unpublished data). Before sowing, the soybean seeds were surface-sterilised.
The experiment was conducted in a greenhouse under a 16 h/8 h day/night cycle. The temperature ranged between 25–28 °C and 15–18 °C during the day and night, respectively. The average relative humidity was 50%. The plants were watered twice a week. No chemical fertilisers were applied. The plants were harvested after five weeks, and the root nodules were surface-sterilised with 95% ethanol for 5–10 s, followed by 3% sodium hypochlorite for 3 min, and then washed 5 times with sterile distilled water, as described by Somasegaran and Hoben [29].
For PCR amplification, crude extracts of crushed soybean nodules were stored in 70 µL of 50% glycerol at −80 °C. A 50 µL aliquot of PrepMan Ultra reagent (Applied Biosystems, Grand Island, NY, USA) was added to 20 µL of the crushed suspension. The resulting mixture was heated for 10 min at 99 °C and centrifuged for 5 min at 14,000 rpm. The supernatant was diluted 1:10 and used in a volume of 1 µL as a template to prevent inhibition of the PCR.

2.3. HRM-PCR Conditions

For HRM-PCR, a pair of primers targeting the recA gene was designed and synthesised by Merck KGaA (Darmstadt, Germany). For this purpose, sequences of the recA gene from the four reference strains were aligned in BioEdit ver. 7.2.5 software (Ibis Biosciences, Carlsbad, CA, USA) [30], and variable regions were selected. The forward recA_for (5′-ACGCGCTCGACCCGGTCTATG-3′) and reverse recA_rev (5′-CCGCGACCGAATCGACCACCA-3′) primers were fully complementary to all tested reference strains and flanked a 153 base pair (bp) amplicon. To estimate primer intermolecular self-complementarity and intramolecular hairpin loop formation, Oligo Calc, an online calculator, was used [31]. The GC contents of the amplicons were calculated using an online tool at https://www.novoprolabs.com/tools/gc-content (accessed on 11 April 2024).
PCR was performed in a final volume of 10 µL containing 5 µL of SsoFast™ EvaGreen® Supermix (Bio-Rad, Hercules, CA, USA), 0.25 µM of each primer, 1 µL of diluted crude extract, and/or 1 ng of DNA isolated from reference strains. The four reference strains were included as melting curve standards and positive controls.
PCR amplification was performed in 96-well plates (ref. #HSP9601) using a CFX Connect Real-Time instrument (Bio-Rad, Hercules, CA, USA) with initial denaturation at 98 °C for 3 min, followed by 35 cycles of denaturation at 98 °C for 10 s, annealing at 70 °C for 7 s, and elongation at 70 °C for 20 s. HRM analysis was performed with a premelting step at 70 °C for 5 s, followed by a temperature increase of 0.2 °C s−1 to 95 °C.
Data evaluation was carried out using Bio-Rad CFX Manager software version 1.6 and Bio-Rad Precision Melt Analysis software (PMAS) version 1.1 (Bio-Rad, Hercules, CA, USA). Default analysis settings were used. As a consequence, raw, normalised, and difference melting curve charts were generated, showing relative fluorescence units (RFUs) plotted against temperature for each sample. Difference melting curves were generated to visually accentuate the identification of clusters and show the difference in fluorescence between each sample and the fluorescence of a selected reference cluster, in this case, USDA 123. The sample distribution to a specific cluster was based on its similarity to the mean melt curve across each sample in the cluster. Clustering confidence values were assigned automatically by PMAS ver 1.1 software.
The primer efficiency for each bacterial strain was assessed using LinReg software ver. 2021.2 [32].

2.4. Verification of HRM Results

For HRM-PCR clustering verification, random amplicons from the crude extracts of the nodules were sequenced at the Molecular Biology Techniques Laboratory (Adam Mickiewicz University, Poznan, Poland). Each target fragment was sequenced from both directions with the same pair of primers, which were used for HRM-PCR. The sequencing data were analysed using BioEdit ver. 7.2.5 (Ibis Biosciences, Carlsbad, CA, USA).
The proper clustering of Bradyrhizobium strains occupying soybean nodules was additionally confirmed by PCR using the RP01 primer (5′-AATTTTCAAGCGTCGTGCCA-3′) as described by Richardson and collaborators [9]. PCR was carried out using a T100 Thermal Cycler (Bio-Rad, Hercules, CA, USA) and PCR Mix Plus (A&A Biotechnology, Gdańsk, Poland) under the following conditions: initial denaturation at 95 °C for 3 min; 30 cycles of 30 s at 95 °C, 30 s at 52 °C, and 1 min at 72 °C; and a final elongation step of 7 min at 72 °C. The PCR products were analysed on a 1.2% agarose gel and visualised by using the GelDoc Go System (Bio-Rad, Hercules, CA, USA).

2.5. Statistical Analysis

Statistical analyses were performed using GraphPad Prism software (ver. 8.0). The normality of the data was verified on residuals by the Shapiro–Wilk and Kolmogorov–Smirnov normality tests. A nonparametric test, namely, the Kruskal–Wallis test with Dunn’s multiple comparison post hoc test, was used.

3. Results

3.1. HRM-PCR Analysis of the Bradyrhizobium Reference Strains

To distinguish a broad range of Bradyrhizobium strains occupying soybean nodules, one pair of primers targeting recA, a highly conserved nonsymbiotic gene, was designed. To assess its suitability for HRM analysis, reference B. japonicum strains, namely, USDA 442, USDA 123, B. diazoefficiens USDA 110, and B. elkanii USDA 472, were used. The alignment results of the target region (153 bp) between the reference strains (Figure 1a) revealed sequence variations ranging from 2% to 6.5% (Figure 1b) and types of base mismatches (Figure 1c). There was no insertion or deletion between the sequences, but nucleotide transitions (C/T; G/A; G/T) and transversions (C/G) were observed. The GC content percentages of the amplicons were 65.4% for recA 110, 67.3% for recA 123, 66.7% for recA 442, and 69.3% for recA 472.
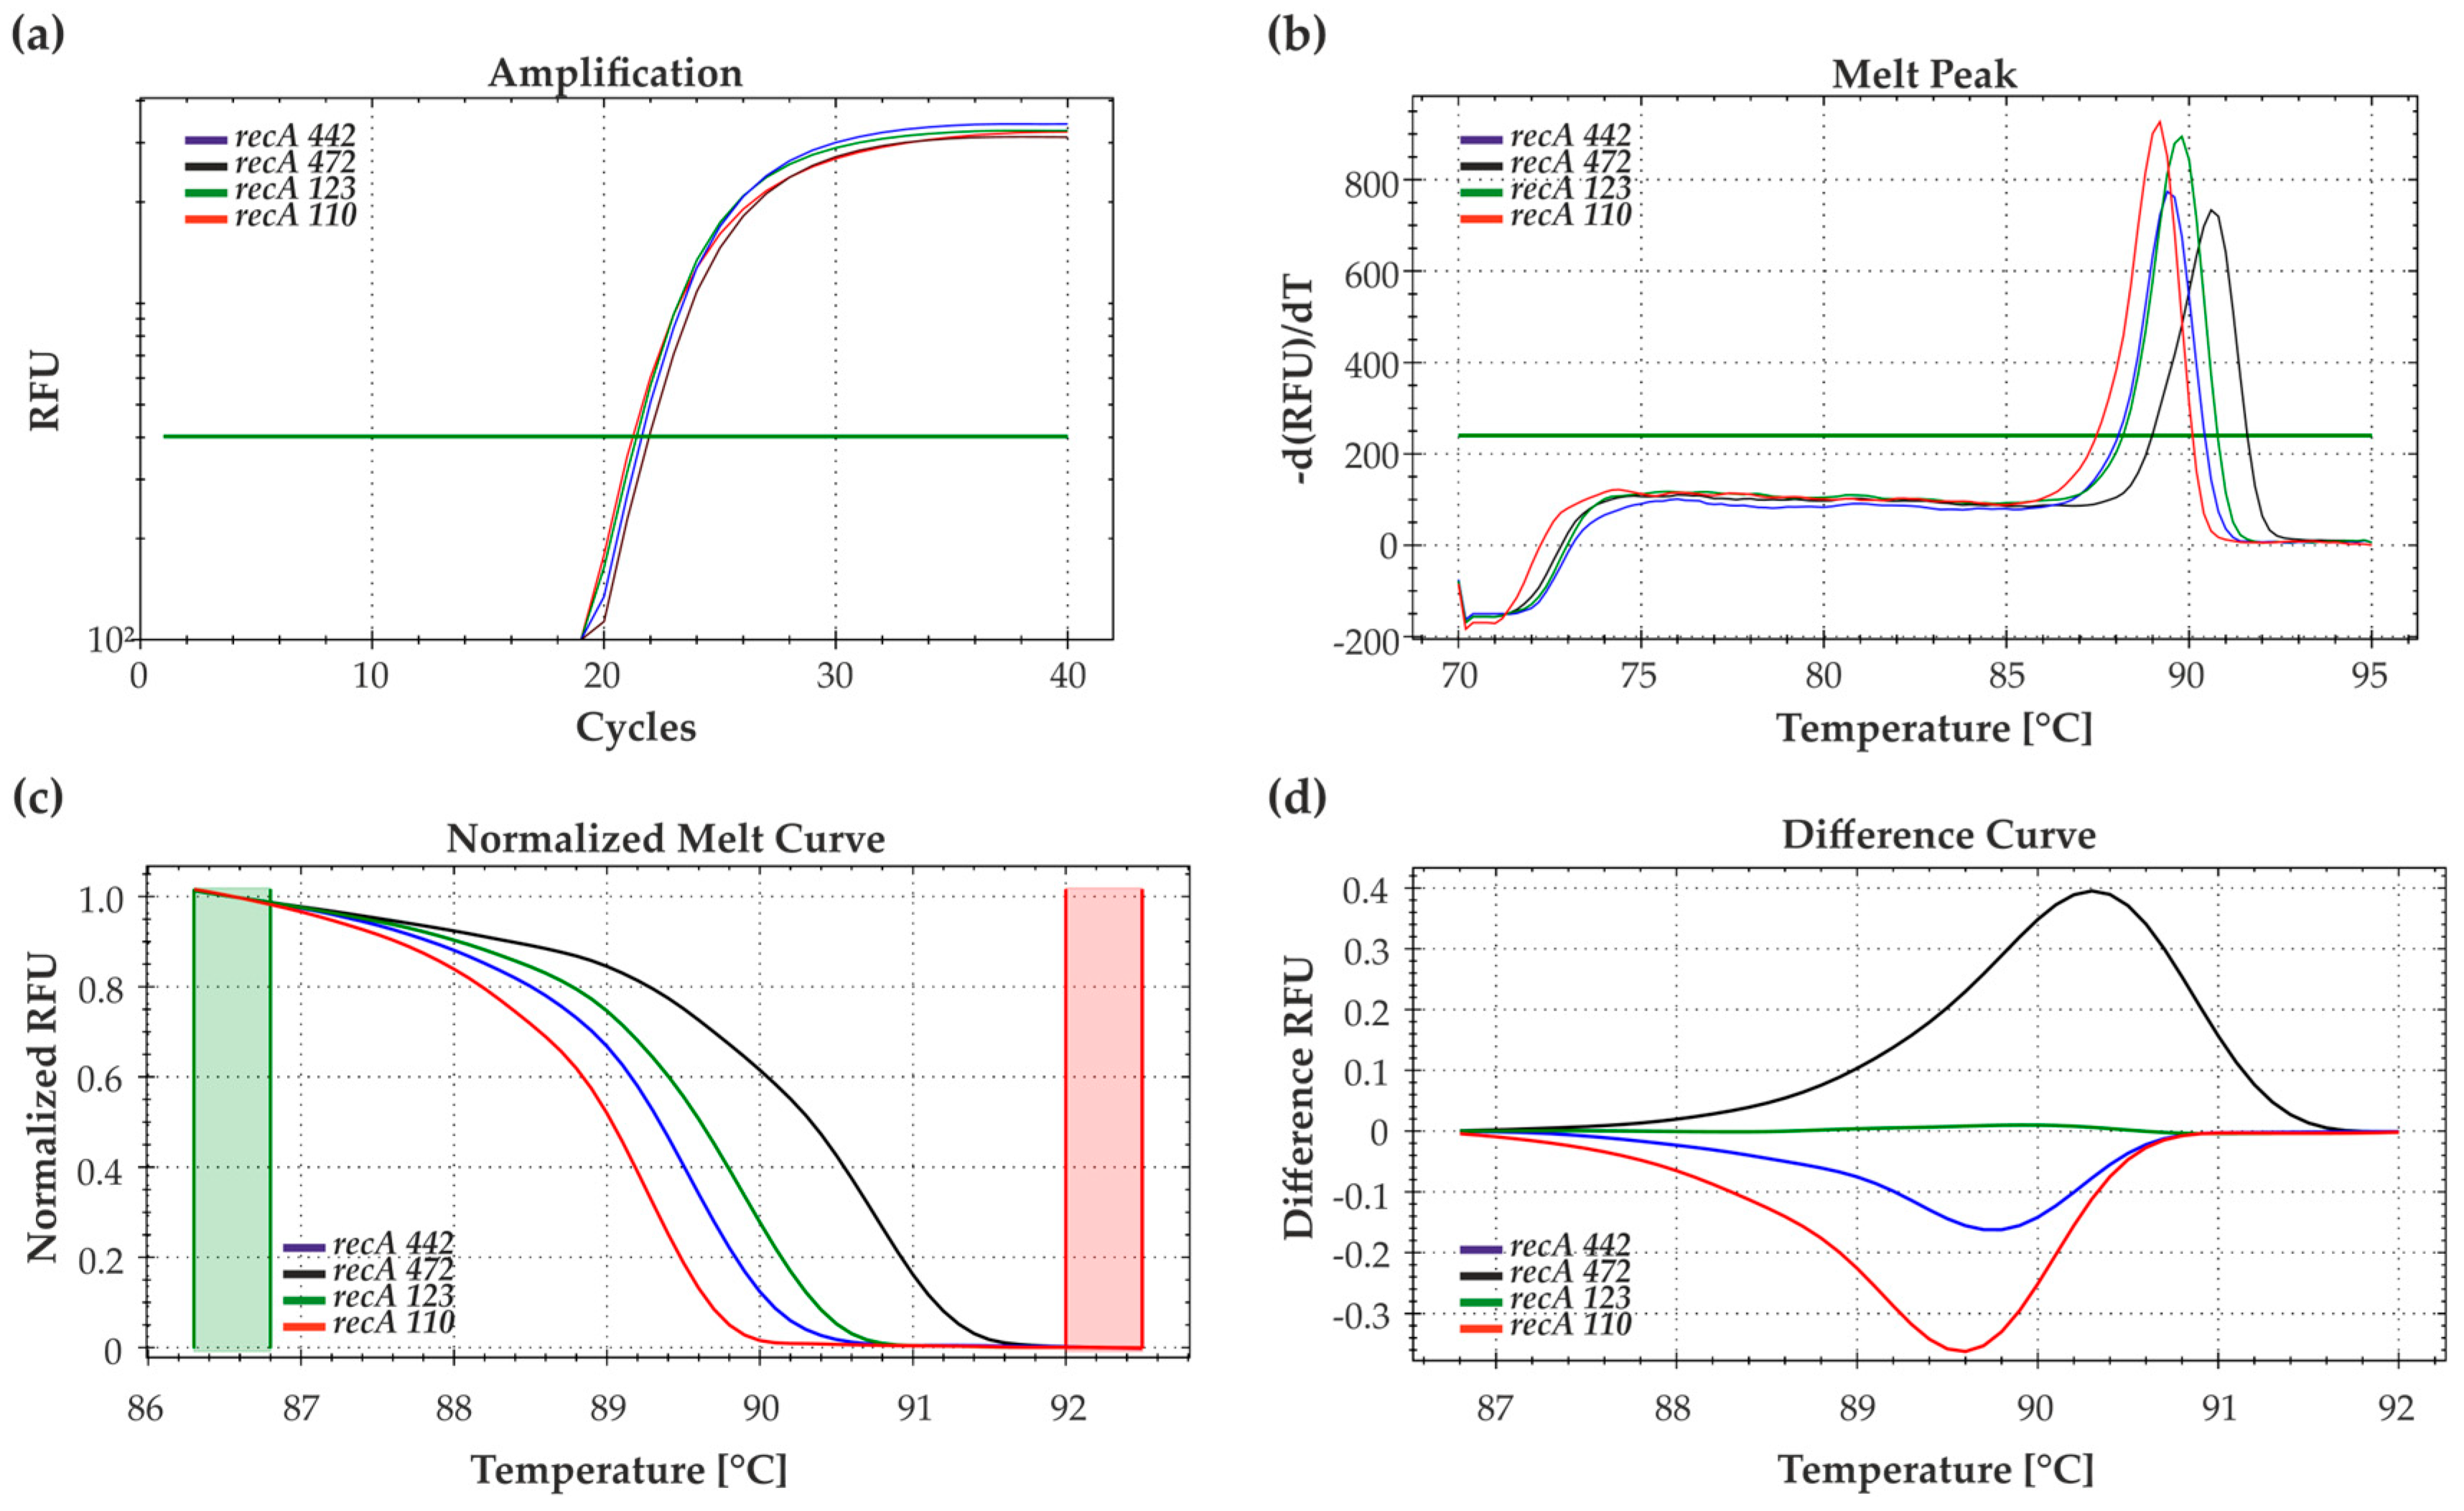
Genomic DNA isolated from each of the Bradyrhizobium reference strains was used as a template for EvaGreen dye-based amplification. All the amplicons obtained from the selected strains had a quantification threshold (Cq) of less than 30 cycles (Figure 2a), which is a prerequisite for reliable HRM results. Standard melt curve analysis (Figure 2b), followed by precision melt analysis (Figure 2c,d), yielded four different melting profiles. The results obtained were reproducible and allowed us to distinguish the reference Bradyrhizobium strains from each other.

3.2. Detection of Soybean-Nodulating Bacteria Using HRM-PCR

Six soil samples were taken randomly from the Gorzyń field site, where strains USDA 110, USDA 123, USDA 442, and USDA 472 were introduced in 1994 [7] and 2016 (unpublished data). The survival and symbiotic ability of the Bradyrhizobium USDA 110, USDA 123, and USDA 442 strains after introduction into field locations were proven earlier ([7], unpublished data). Root nodules were found on all the soybean plants grown under greenhouse conditions (Figure 3a,b). To prevent contamination with nonsymbiotic bacteria, the nodules were surface-sterilised after harvesting. To discriminate soybean-nodulating bacteria in a high-throughput manner, crude nodule extracts, instead of purified isolates, were used as templates for HRM-PCR. Crushed nodules stored in 50% glycerol (Figure 3c) served as an efficient DNA source due to the use of PrepMan™ Ultra Reagent (Applied Biosystems, Grand Island, NY, USA) and a simple boil, spin, and dilution protocol. The four reference strains were included as melting curve standards and positive controls.
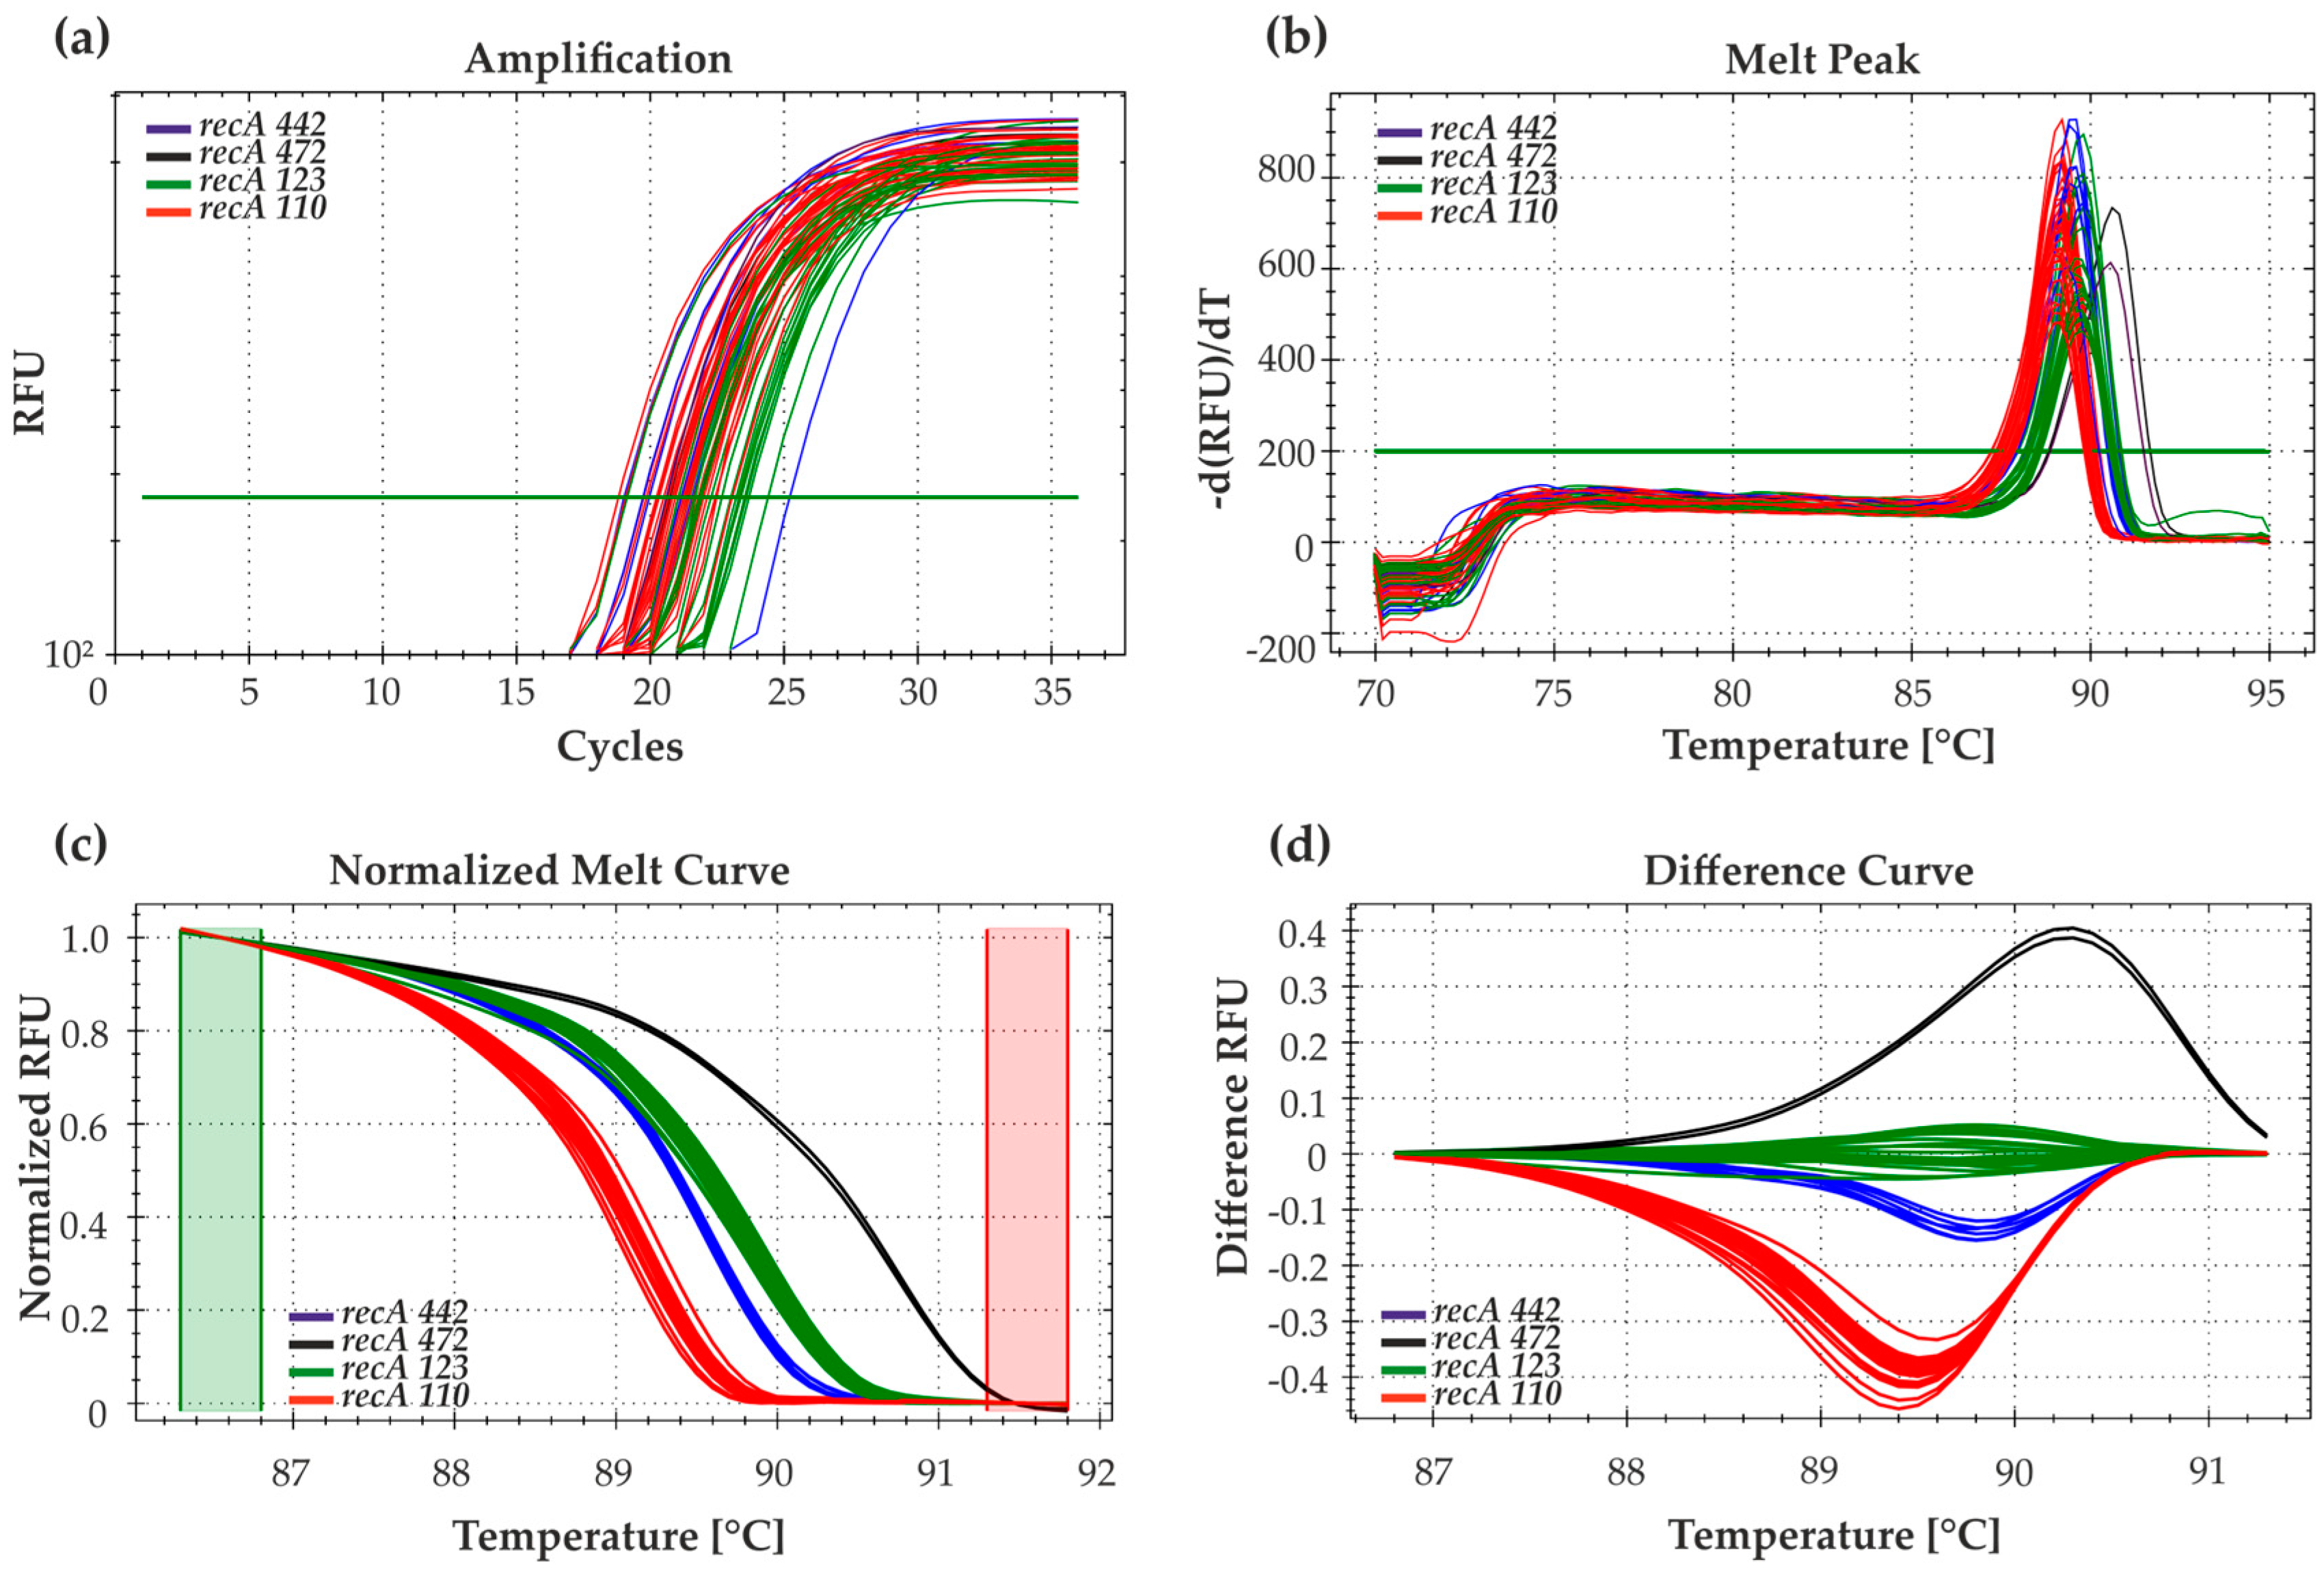
Sixty individual soybean root nodules analysed as crude extracts and positive controls exhibited a quantification threshold (Cq) of less than 25 cycles (Figure 4a). Furthermore, the efficiencies of the qPCRs calculated by LinRegPCR [32] were optimal and ranged between 2.0 for recA 442, 2.1 for recA 110 and recA 123, and 2.2 for recA 472. All tested samples and reference strains (positive controls) resulted in corresponding melting curves (Figure 4b–d). The obtained normalised and difference plots showed clear differences (Figure 4c,d).
Each bacterial strain was represented by one melting temperature peak, which ranged from 89 °C to 90.6 °C and reflected the GC content of the amplicons (Figure 5a). Precision melt analysis software (ver. 1.1) assigned nodule-occupying bacteria to three clusters (Figure 5b), namely, the recA 110-type (56% of nodules), the recA 123-type (36% of nodules), and the recA 442-type (8% of nodules), with a confidence level above 98% (Figure 5c). None of the nodule samples were assigned to the cluster recA 472-type (Figure 5b).

3.3. Verification of the HRM Results

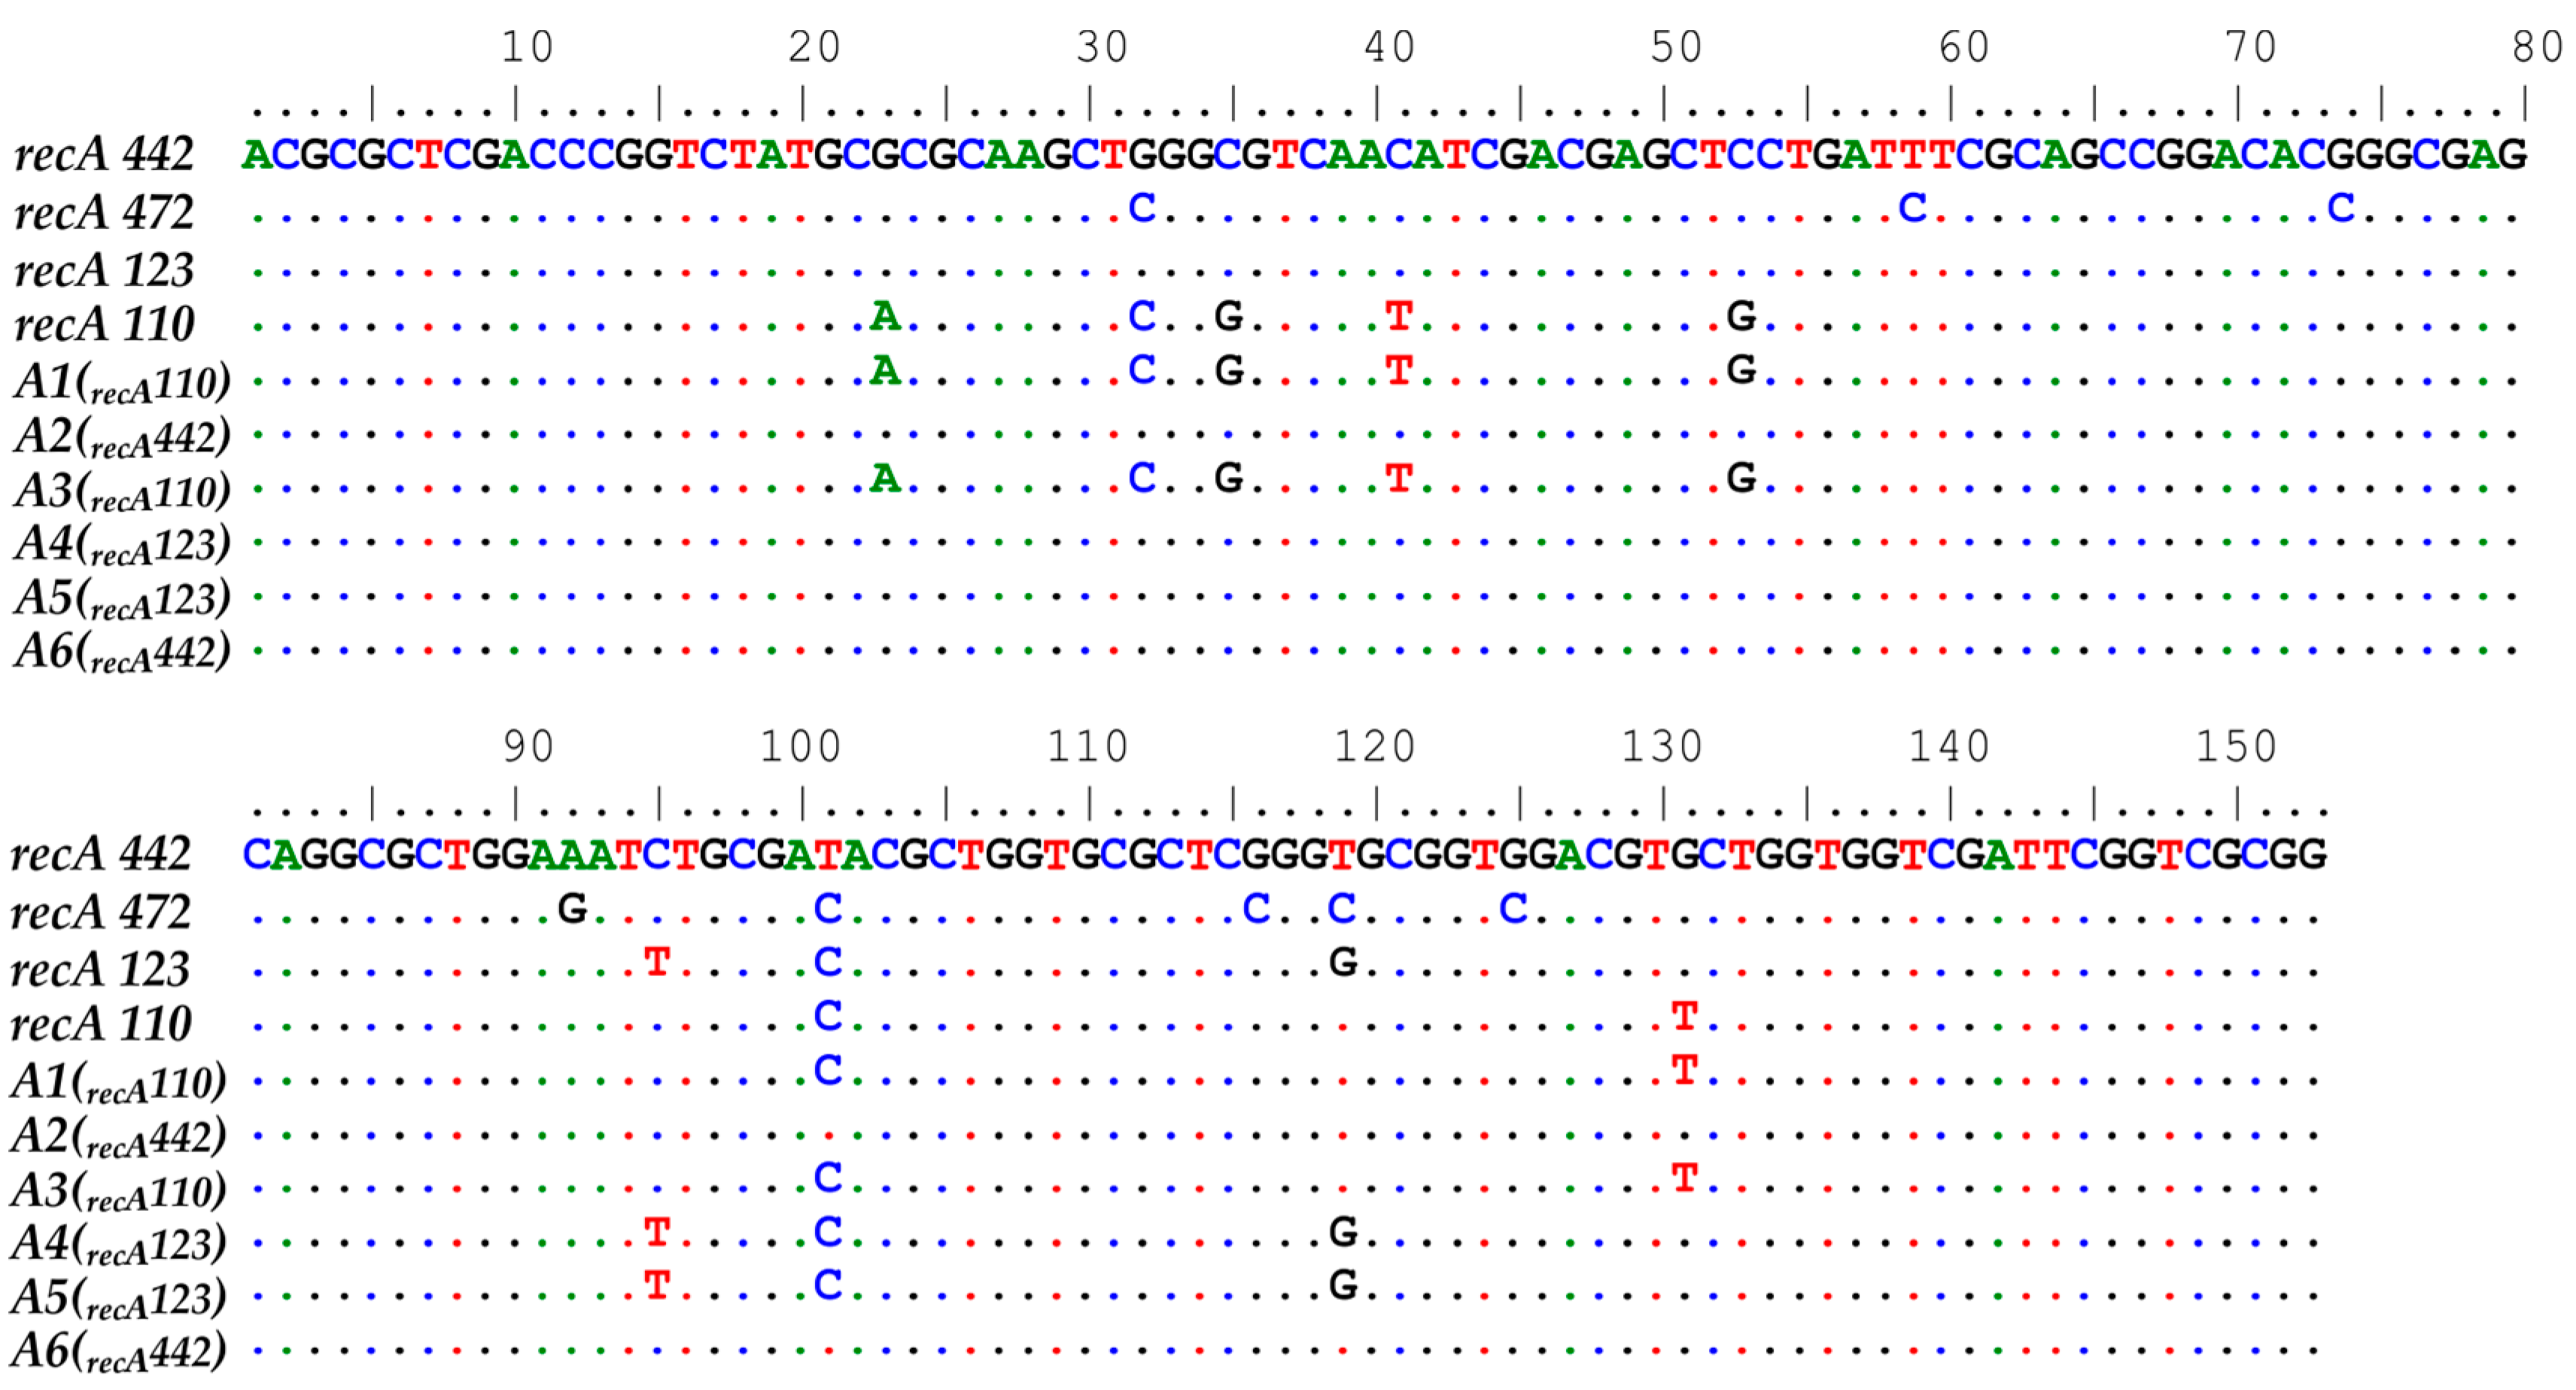
To verify the HRM-PCR results, random amplicons from the crude nodule extracts, assigned to the recA 110-, recA 123-, and recA 442- types, were sequenced from both directions with the same recA primer pair. Sequencing data analysis relying on amplicon and reference sequence alignment confirmed correct HRM-PCR clustering (Figure 6).
Additionally, a 20-base oligonucleotide primer corresponding to a conserved nif gene promoter region was used [9]. Previously, the nif-directed primer (RP01) was shown to be able to differentiate between USDA 110-type strains and USDA 123-type strains [7]. Here, the use of the RP01 primer on four reference strains resulted in the generation of unique DNA profiles (Figure 7, lines 1, 6, 11, and 17). The ability of HRM-PCR to distinguish between strains was further confirmed by comparing the RP01-PCR patterns of 4–5 random crude extracts assigned to the recA 110-, recA 123-, and recA 442-types with reference profiles (Figure 7).

4. Discussion

Soybean is one of the most economically important grain legumes and is produced mainly in the USA, Brazil, and Argentina [33]. In Europe, soybeans are relatively new crops that are grown largely in Ukraine, Russia, Italy, Serbia, France, and Romania [4]. In some areas of European soils, for instance, in Poland, native soybean-nodulating bradyrhizobia (SNB) do not occur. Therefore, seed inoculation is necessary to increase soybean yields [6]. Considering that the effectiveness of N-fixation relies on the selection of elite rhizobial strains, the availability of reliable SNB identification techniques is essential for evaluating the efficiency, survival, and competitiveness of field inoculants [12], especially since it has been shown that nonnative inoculant bradyrhizobia can persist in soils for more than 20 years [7], be naturalised, and thus be highly competitive with new inocula.
To our knowledge, this is the first report showing the utility of HRM-PCR for studying nodular occupancy in legumes. To date, this technique has been mainly applied to evaluate microbial diversity in clinical research, diagnostics, and food science [21,22,23,24,25,26,27]. By using HRM-PCR, researchers were able to detect bacterial meningitis [34], diagnose drug-resistant tuberculosis [26], identify lactic acid bacteria [23,25], and determine seafood quality [24].
To date, Bradyrhizobium strain identification has often been based on methods requiring purified bacterial isolates and multistep procedures, such as serological methods, DNA profiling (e.g., PCR-RFLP and RP01-profiling), and multilocus sequence analyses of different nonsymbiotic and symbiotic genes (MLSA) [7,8,11,35,36]. For the serological identification of bacteria, specific antibodies for each strain are needed. This approach is expensive, but most importantly, its discriminatory power is lower than that of molecular methods [16]. A comparison of the immunological and molecular techniques revealed that Bradyrhizobium strains belonging to the same serogroup might be genetically distinct [37]. The indistinguishability of different strains is related to the cross-reactivity of polyclonal antibodies [38]. On the other hand, molecular identification techniques require time- and/or cost-consuming post-PCR processing, which makes them less suitable for high-throughput analyses [16]. For instance, in the PCR-RFLP method, the PCR product of the selected gene fragment is digested with restriction endonucleases and separated on a gel, and the resulting restriction patterns are compared with the reference ones [39,40]. Similarly, DNA profiling by using target repetitive sequences (such as RP01, REP, ERIC, or BOX) or arbitrary primers relies on the separation of PCR samples on a gel or other matrix [9,38]. In MLSA, DNA sequencing of a large number of amplicons followed by phylogenetic analysis is needed, which is still quite expensive and time-consuming [28]. Recently, da Silva and collaborators evaluated nodular occupancy in common beans by using the qPCR method. To distinguish the two Rhizobium strains, several strain-specific primers have been designed and tested. As a consequence, target strains were detected with high specificity and sensitivity [41]. Despite the fact that the qPCR method eliminated the need for post-PCR processing, it should be noted that detection was limited to two target strains and required at least two PCRs for each sample analysed.
This study reports the development of a rapid and reproducible HRM-PCR assay to simultaneously distinguish several Bradyrhizobium strains directly from crude nodule extracts without tedious and multistep rhizobial isolate cultivation or DNA purification procedures. Since the HRM-PCR procedure relies on qPCR and subsequent examination of high-resolution melting curves, it can successfully replace other post-PCR and time-consuming methods, such as gel electrophoresis and sequencing, which are required during DNA profiling or MLSA analysis [42]. Melting is faster than gel preparation and electrophoresis. Moreover, data analysis is not biased; it is performed automatically and provides statistical metrics [19]. Considering that the accuracy and precision of the fluorescence and temperature measurements determine the quality of HRM-PCR analysis, a third-generation saturation dye called EvaGreen was used. Compared to the first-generation dyes (e.g., SYBR), EvaGreen provides more confident and reproducible results [43].
The quality and quantity of DNA from 10-times-diluted crude extracts proved to be sufficient for the qPCR and subsequent HRM assays (Figure 4a–d). Using the same dilutions of all crude extracts, without the need for DNA amount evaluation, significantly shortened the procedure. Although slight differences in the Cp values between the crude extracts were observed (Figure 4a), most likely due to the varying sizes of the crushed nodules, the dilution approach provided reliable assays. Indeed, the Cp values of all analysed samples were less than 25 cycles, and the amplification efficiency ranged between 100% and 110%, which is comparable to the results of other studies [41,44]. It has been shown that products amplifying late (>30 cycles) might produce variable HRM results, and a PCR efficiency below 95% reduces its sensitivity [45]. Nodule extracts have also been used as suitable templates for Rhizobium detection in clover [9] and common beans [41] and for detecting Bradyrhizobium in cowpeas [38]. Similar to our study, da Silva and collaborators diluted the nodule extracts prior to analysis. According to researchers, dilution reduces the concentrations of secondary compounds and cell debris, which might form bonds with Mg2+ and inhibit polymerase enzymes, thus reducing PCR efficiency [41].
To use HRM-PCR as a fast and high-throughput screening method, one pair of primers capable of distinguishing a broad range of bacteria should be used [46]. Additionally, the gene to which the selected primers will attach should be present consistently in the analysed bacterial group. Therefore, primer design should be focused on targeting highly conserved genes. Previous studies evaluating Bradyrhizobium diversity have relied on 16S rRNA or combined housekeeping and symbiotic gene MLSA analyses [11,36,47,48]. Although examination of 16S rRNA is one of the most common methods used in bacterial taxonomy, its use is limited within closely related species or strains of the same species due to its high sequence conservancy [49,50]. The symbiotic genes required for nodulation (e.g., nod) and nitrogen fixation (e.g., nif) are not uniformly distributed across the Bradyrhizobium phylogeny. For instance, B. jicamae isolates completely lack nif and nod genes, and a symbiotic lifestyle might not be dominant for this genus [50]. Hence, several housekeeping genes, such as atpD, glnII, and recA, have been proposed as more adequate tools for Bradyrhizobium identification [11,36,51]. In this study, the recA gene, which is involved in fundamental cell functions encoding the recombinase A protein, was selected [12]. The suitability of several other genes, including 16S rRNA, glnII, and atpD, as sources of amplicons for HRM analysis was also verified. However, they have proven to be less suitable. This finding is in agreement with results provided by Delamuta and coworkers, who evaluated the nucleotide identity of 16S rRNA, atpD, glnII, and recA within Bradyrhizobium diazoefficiens and between B. diazoefficiens and other Bradyrhizbium strains [28]. Indeed, species comparison revealed greater divergence in the recA gene [28], making it an attractive candidate for Bradyrhizobium differentiation.
Based on the sequence alignment of the recA gene from four different Bradyrhizobium strains, the variable region for amplification was selected (Figure 1a). The size of the latter was 153 bp since it has been shown that amplicons smaller than 200 bp have greater resolving power [52]. In fact, most HRM-PCR studies use amplicon lengths typically ranging from 144 to 272 bp [44,46,53]. However, Parlapani and colleagues successfully identified bacteria from farmed mussels using a 450 bp fragment [24]. Within the 153 bp targeted region, sequence variation ranged from 2% (3 mismatches) to 6.5% (8 mismatches) (Figure 1a,b). Strikingly, even 2% amplicon sequence variability was sufficient to unambiguously discriminate Bradyrhiobium strains by HRM-PCR (Figure 1b and Figure 2d). According to Tong and Giffard, base differences are easier to detect when they change the GC content percentage [52]. Notably, nucleotide transitions (C/T; G/A; and G/T), which caused the largest changes in GC content percentage and thus melt shifts, were predominant and accounted for 50% to 100% of the sequence changes (Figure 1c). The resulting GC content percentages of the amplicons ranged from 65.4% to 69.3% and correlated with their single melting temperature peaks (Figure 5a). The accuracy of HRM differentiation was confirmed by DNA sequencing (Figure 6) and DNA profiling based on the 20-nucleotide primer RP01 (Figure 7), which represents a reiterated Rhizobium nif promoter consensus element [9]. Despite the fact that the RP01 profiling method generated unique amplification profiles and thus was able to distinguish Bradyrhizobium strains, it was less suitable for high-throughput analyses. The latter method requires gel electrophoresis to unravel strain differences, and the obtained patterns are strongly dependent on PCR conditions [38]. The verification of HRM results through sequencing has been conducted in several other studies [23,24,53]. Additionally, alternative species-specific PCRs [25,34] or commercially available tests [44] have also been used to validate the method.
In the present study, crude extracts from sixty nodules were analysed by using HRM-PCR. Soybeans were grown on randomly selected soil samples from the Gorzyń field site, where reference strains, namely, USDA 110, USDA 123, USDA 442, and USDA 472, were introduced several years earlier [7]. It is worth emphasising that before introducing the mentioned BNS, the studied field sites contained no soybean-nodulating bacteria. Indeed, uninoculated soybeans do not form any nodules [54] (unpublished data). No additional strains were introduced there. Notably, the survival and symbiotic ability of the Bradyrhizobium USDA 110, USDA 123 [7], and USDA 442 strains (unpublished data) after introduction into field locations were verified. To correctly identify and assign the strains inhabiting the soybean nodules, the crude extracts were analysed simultaneously with the reference strains, which served as positive samples and melt curve standards. Landolt and coworkers used a similar approach. In a study conducted on clinical specimens, four reference strains were included in each run to simultaneously identify and differentiate the mycobacteria responsible for tuberculosis [44]. Here, all tested samples and positive controls resulted in corresponding melting curves (Figure 4b–d). Although the Tm values of the analysed amplicons were not significantly different, with the exception of the recA 110 type (Figure 5a), a clear visual assessment was possible on the basis of normalised and difference curve shapes (Figure 4c,d). More importantly, high-precision melting software automatically assigned the analysed crude extracts into three reference-type clusters (Figure 5b) with a confidence percentage above 98% (Figure 5c), which might be considered high. Interestingly, none of the nodule samples were assigned to the cluster recA 472 type (Figure 5b). This result is consistent with the previous observation that after introducing the USDA 472 strain into the Gorzyń field site, previously free of SNB, nodules did not form on soybean roots (unpublished data). However, further work on Gorzyń soil samples from different years is necessary to clarify which inoculum is better adapted to Polish soils and more competitive.
Similar to previous experiments [7,41], surface sterilisation of seeds and nodules with ethanol and hypochlorite was performed to prevent the introduction of symbiotic and nonsymbiotic bacteria into PCR templates, respectively. Despite the possibility of nonsymbiotic bacteria occurring in root nodules, as reported in some studies (e.g., Pseudomonas spp. and Erwinia spp.) [49], this is unlikely to be the case in this study. The selection of the nonsymbiotic recA gene for HRM-PCR analysis would allow for the detection of other bacteria inhabiting soybean nodules. The recA gene has been used as a molecular marker for the identification of different bacterial species, such as Erwinia [55], Agrobacterium [56], and Mycobacterium [57]. Importantly, except for four clusters corresponding to four introduced reference strains, no other clusters were identified (Figure 4c,d).
The main goal of the present study was to develop the HRM-PCR assay as a fast and high-throughput screening method for crude nodule extracts. Bacterial strain identification was made possible by comparing the samples with the reference strains. However, the procedure does not necessarily require prior knowledge of individual strains. The designed primer pair targeting the recA gene fragment might be used to distinguish Bradyrhizobium strains into clusters. Since HRM-PCR is a nondestructive method, it can serve as a presequencing screening method. Strain identification and variation might be further evaluated by sequencing.

5. Conclusions

This is the first report on the use of HRM-PCR for the rapid and cost-effective identification and differentiation of bacterial strains occupying soybean nodules. The described approach is an excellent alternative to other culture-dependent methods for identifying microsymbionts inhabiting root nodules. Compared to other high-throughput technologies, the HRM-PCR assay is fast, simple, and relatively inexpensive and allows for the accurate screening of large numbers of samples. Therefore, the use of this method of differentiating soybean microsymbionts may contribute not only to their rapid identification, especially in soils where new strains have been introduced in the form of inoculum, but also to tracking their survival and competitiveness in relation to the indigenous strains of Bradyrhizobium occurring in soil. Additionally, the presented methodology might be extended to other legume-nodulating bacteria.

Author Contributions

Conceptualisation, K.J. and D.N.; Data curation, K.J. and D.N.; Investigation, K.J. and D.N.; Methodology, K.J. and D.N.; Software, K.J. and D.N.; Visualisation, K.J. and D.N.; Writing—original draft, K.J.; Writing—review and editing, D.N. All authors have read and agreed to the published version of the manuscript.

Funding

This research received no external funding.

Data Availability Statement

The original contributions presented in the study are included in the article, further inquiries can be directed to the corresponding author.

Acknowledgments

We thank M. Sadowsky for providing the USDA 110, USDA 123, USDA 442, and USDA 472 strains and C. Mądrzak for critical comments. We thank J. Króliczak for her excellent technical assistance.

Conflicts of Interest

The authors declare no conflicts of interest.

References

  1. Nendel, C.; Reckling, M.; Debaeke, P.; Schulz, S.; Berg-Mohnicke, M.; Constantin, J.; Fronzek, S.; Hoffmann, M.; Jakšić, S.; Kersebaum, K.-C.; et al. Future Area Expansion Outweighs Increasing Drought Risk for Soybean in Europe. Glob. Chang. Biol. 2023, 29, 1340–1358. [Google Scholar] [CrossRef]
  2. Karges, K.; Bellingrath-Kimura, S.D.; Watson, C.A.; Stoddard, F.L.; Halwani, M.; Reckling, M. Agro-Economic Prospects for Expanding Soybean Production beyond Its Current Northerly Limit in Europe. Eur. J. Agron. 2022, 133, 126415. [Google Scholar] [CrossRef]
  3. Roy, S.; Liu, W.; Nandety, R.S.; Crook, A.; Mysore, K.S.; Pislariu, C.I.; Frugoli, J.; Dickstein, R.; Udvardi, M.K. Celebrating 20 Years of Genetic Discoveries in Legume Nodulation and Symbiotic Nitrogen Fixation. Plant Cell 2020, 32, 15–41. [Google Scholar] [CrossRef] [PubMed]
  4. Debaeke, P.; Forslund, A.; Guyomard, H.; Schmitt, B.; Tibi, A. Could Domestic Soybean Production Avoid Europe’s Protein Imports in 2050? OCL 2022, 29, 38. [Google Scholar] [CrossRef]
  5. Wójcik-Gront, E.; Gozdowski, D.; Derejko, A.; Pudełko, R. Analysis of the Impact of Environmental and Agronomic Variables on Agronomic Parameters in Soybean Cultivation Based on Long-Term Data. Plants 2022, 11, 2922. [Google Scholar] [CrossRef] [PubMed]
  6. Maluk, M.; Giles, M.; Wardell, G.E.; Akramin, A.T.; Ferrando-Molina, F.; Murdoch, A.; Barros, M.; Beukes, C.; Vasconçelos, M.; Harrison, E.; et al. Biological Nitrogen Fixation by Soybean (Glycine max [L.] Merr.), a Novel, High Protein Crop in Scotland, Requires Inoculation with Non-Native Bradyrhizobia. Front. Agron. 2023, 5, 1196873. [Google Scholar] [CrossRef]
  7. Narożna, D.; Pudełko, K.; Króliczak, J.; Golińska, B.; Sugawara, M.; Mądrzak, C.J.; Sadowsky, M.J. Survival and Competitiveness of Bradyrhizobium Japonicum Strains 20 Years after Introduction into Field Locations in Poland. Appl. Environ. Microbiol. 2015, 81, 5552–5559. [Google Scholar] [CrossRef]
  8. Sadowsky, M.J.; Tully, R.E.; Cregan, P.B.; Keyser, H.H. Genetic Diversity in Bradyrhizobium japonicum Serogroup 123 and Its Relation to Genotype-Specific Nodulation of Soybean. Appl. Environ. Microbiol. 1987, 53, 2624–2630. [Google Scholar] [CrossRef] [PubMed]
  9. Richardson, A.E.; Viccars, L.A.; Watson, J.M.; Gibson, A.H. Differentiation of Rhizobium Strains Using the Polymerase Chain Reaction with Random and Directed Primers. Soil Biol. Biochem. 1995, 27, 515–524. [Google Scholar] [CrossRef]
  10. Shiro, S.; Matsuura, S.; Saiki, R.; Sigua, G.C.; Yamamoto, A.; Umehara, Y.; Hayashi, M.; Saeki, Y. Genetic Diversity and Geographical Distribution of Indigenous Soybean-Nodulating Bradyrhizobia in the United States. Appl. Environ. Microbiol. 2013, 79, 3610–3618. [Google Scholar] [CrossRef]
  11. Banasiewicz, J.; Granada, C.E.; Lisboa, B.B.; Grzesiuk, M.; Matuśkiewicz, W.; Bałka, M.; Schlindwein, G.; Vargas, L.K.; Passaglia, L.M.P.; Stępkowski, T. Diversity and Phylogenetic Affinities of Bradyrhizobium Isolates from Pampa and Atlantic Forest Biomes. Syst. Appl. Microbiol. 2021, 44, 126203. [Google Scholar] [CrossRef] [PubMed]
  12. Ferraz Helene, L.C.; O’Hara, G.; Hungria, M. Characterization of Bradyrhizobium Strains Indigenous to Western Australia and South Africa Indicates Remarkable Genetic Diversity and Reveals Putative New Species. Syst. Appl. Microbiol. 2020, 43, 126053. [Google Scholar] [CrossRef]
  13. Azarias Guimarães, A.; Florentino, L.A.; Alves Almeida, K.; Lebbe, L.; Barroso Silva, K.; Willems, A.; de Souza Moreira, F.M. High Diversity of Bradyrhizobium Strains Isolated from Several Legume Species and Land Uses in Brazilian Tropical Ecosystems. Syst. Appl. Microbiol. 2015, 38, 433–441. [Google Scholar] [CrossRef] [PubMed]
  14. Degefu, T.; Wolde-meskel, E.; Rasche, F. Genetic Diversity and Symbiotic Effectiveness of Bradyrhizobium Strains Nodulating Selected Annual Grain Legumes Growing in Ethiopia. Int. J. Syst. Evol. Microbiol. 2018, 68, 449–460. [Google Scholar] [CrossRef] [PubMed]
  15. Ormeño-Orrillo, E.; Martínez-Romero, E. A Genomotaxonomy View of the Bradyrhizobium Genus. Front. Microbiol. 2019, 10, 1334. [Google Scholar] [CrossRef] [PubMed]
  16. Berrada, H.; Fikri-Benbrahim, K. Taxonomy of the Rhizobia: Current Perspectives. Microbiol. Res. J. Int. 2014, 4, 616–639. [Google Scholar] [CrossRef]
  17. Liew, M.; Pryor, R.; Palais, R.; Meadows, C.; Erali, M.; Lyon, E.; Wittwer, C. Genotyping of Single-Nucleotide Polymorphisms by High-Resolution Melting of Small Amplicons. Clin. Chem. 2004, 50, 1156–1164. [Google Scholar] [CrossRef] [PubMed]
  18. Tucker, E.J.; Huynh, B.L. Genotyping by High-Resolution Melting Analysis. In Crop Breeding: Methods and Protocols; Fleury, D., Whitford, R., Eds.; Springer: New York, NY, USA, 2014; pp. 59–66. ISBN 978-1-4939-0446-4. [Google Scholar]
  19. Wittwer, C.T.; Hemmert, A.C.; Kent, J.O.; Rejali, N.A. DNA Melting Analysis. Mol. Asp. Med. 2024, 97, 101268. [Google Scholar] [CrossRef]
  20. Simko, I. High-Resolution DNA Melting Analysis in Plant Research. Trends Plant Sci. 2016, 21, 528–537. [Google Scholar] [CrossRef] [PubMed]
  21. Porcellato, D.; Grønnevik, H.; Rudi, K.; Narvhus, J.; Skeie, S.B. Rapid Lactic Acid Bacteria Identification in Dairy Products by High-resolution Melt Analysis of DGGE Bands. Lett. Appl. Microbiol. 2012, 54, 344–351. [Google Scholar] [CrossRef]
  22. Martini, M.; Moruzzi, S.; Ermacora, P.; Loi, N.; Firrao, G. Quantitative Real-Time PCR and High-Resolution Melting (HRM) Analysis for Strain-Specific Monitoring of Fluorescent Pseudomonads Used as Biocontrol Agents against Soil-Borne Pathogens of Food Crops. Trends Food Sci. Technol. 2015, 46, 277–285. [Google Scholar] [CrossRef]
  23. Sakaridis, I.; Ganopoulos, I.; Soultos, N.; Madesis, P.; Tsaftaris, A.; Argiriou, A. Identification of Lactic Acid Bacteria Isolated from Poultry Carcasses by High-Resolution Melting (HRM) Analysis. Eur. Food Res. Technol. 2014, 238, 691–697. [Google Scholar] [CrossRef]
  24. Parlapani, F.F.; Syropoulou, F.; Tsiartsafis, A.; Ekonomou, S.; Madesis, P.; Exadactylos, A.; Boziaris, I.S. HRM Analysis as a Tool to Facilitate Identification of Bacteria from Mussels during Storage at 4 °C. Food Microbiol. 2020, 85, 103304. [Google Scholar] [CrossRef] [PubMed]
  25. Iacumin, L.; Ginaldi, F.; Manzano, M.; Anastasi, V.; Reale, A.; Zotta, T.; Rossi, F.; Coppola, R.; Comi, G. High Resolution Melting Analysis (HRM) as a New Tool for the Identification of Species Belonging to the Lactobacillus Casei Group and Comparison with Species-Specific PCRs and Multiplex PCR. Food Microbiol. 2015, 46, 357–367. [Google Scholar] [CrossRef] [PubMed]
  26. Keikha, M.; Karbalaei, M. High Resolution Melting Assay as a Reliable Method for Diagnosing Drug-Resistant TB Cases: A Systematic Review and Meta-Analysis. BMC Infect. Dis. 2021, 21, 989. [Google Scholar] [CrossRef] [PubMed]
  27. Gupta, R.K.; Anthwal, D.; Bhalla, M.; Tyagi, J.S.; Choudhary, S.; Haldar, S. Direct Detection of Fluoroquinolone Resistance in Sputum Samples from Tuberculosis Patients by High Resolution Melt Curve Analysis. Curr. Microbiol. 2023, 81, 27. [Google Scholar] [CrossRef]
  28. Delamuta, J.R.M.; Ribeiro, R.A.; Ormeño-Orrillo, E.; Melo, I.S.; Martínez-Romero, E.; Hungria, M. Polyphasic Evidence Supporting the Reclassification of Bradyrhizobium Japonicum Group Ia Strains as Bradyrhizobium Diazoefficiens sp. Nov. Int. J. Syst. Evol. Microbiol. 2013, 63, 3342–3351. [Google Scholar] [CrossRef]
  29. Somasegaran, P.; Hoben, H.J. Collecting Nodules and Isolating Rhizobia. In Handbook for Rhizobia: Methods in Legume-Rhizobium Technology; Somasegaran, P., Hoben, H.J., Eds.; Springer: New York, NY, USA, 1994; pp. 7–23. ISBN 978-1-4613-8375-8. [Google Scholar]
  30. Hall, T.; Biosciences, I.; Carlsbad, C. BioEdit: An Important Software for Molecular Biology. GERF Bull. Biosci. 2011, 2, 60–61. [Google Scholar]
  31. Kibbe, W.A. OligoCalc: An Online Oligonucleotide Properties Calculator. Nucleic Acids Res. 2007, 35, W43–W46. [Google Scholar] [CrossRef]
  32. Ramakers, C.; Ruijter, J.M.; Deprez, R.H.L.; Moorman, A.F.M. Assumption-Free Analysis of Quantitative Real-Time Polymerase Chain Reaction (PCR) Data. Neurosci. Lett. 2003, 339, 62–66. [Google Scholar] [CrossRef]
  33. Herridge, D.F.; Giller, K.E.; Jensen, E.S.; Peoples, M.B. Quantifying Country-to-Global Scale Nitrogen Fixation for Grain Legumes II. Coefficients, Templates and Estimates for Soybean, Groundnut and Pulses. Plant Soil 2022, 474, 1–15. [Google Scholar] [CrossRef]
  34. de Filippis, I.; de Azevedo, A.C.; Lima, I.d.O.; Ramos, N.F.L.; de Andrade, C.F.; de Almeida, A.E. Accurate, Fast and Cost-Effective Simultaneous Detection of Bacterial Meningitis by Qualitative PCR with High-Resolution Melting. BioTechniques 2023, 74, 101–106. [Google Scholar] [CrossRef] [PubMed]
  35. Stępkowski, T.; Żak, M.; Moulin, L.; Króliczak, J.; Golińska, B.; Narożna, D.; Safronova, V.I.; Mądrzak, C.J. Bradyrhizobium Canariense and Bradyrhizobium Japonicum Are the Two Dominant Rhizobium Species in Root Nodules of Lupin and Serradella Plants Growing in Europe. Syst. Appl. Microbiol. 2011, 34, 368–375. [Google Scholar] [CrossRef]
  36. Stępkowski, T.; Watkin, E.; McInnes, A.; Gurda, D.; Gracz, J.; Steenkamp, E.T. Distinct Bradyrhizbium Communities Nodulate Legumes Native to Temperate and Tropical Monsoon Australia. Mol. Phylogenet. Evol. 2012, 63, 265–277. [Google Scholar] [CrossRef]
  37. van Berkum, P.; Fuhrmann, J.J. Evolutionary Relationships among the Soybean Bradyrhizobia Reconstructed from 16S rRNA Gene and Internally Transcribed Spacer Region Sequence Divergence. Int. J. Syst. Evol. Microbiol. 2000, 50 Pt 6, 2165–2172. [Google Scholar] [CrossRef] [PubMed]
  38. Osei, O.; Simões Araújo, J.L.; Zilli, J.E.; Boddey, R.M.; Ahiabor, B.D.K.; Abaidoo, R.C.; Rouws, L.F.M. PCR Assay for Direct Specific Detection of Bradyrhizobium Elite Strain BR 3262 in Root Nodule Extracts of Soil-Grown Cowpea. Plant Soil 2017, 417, 535–548. [Google Scholar] [CrossRef]
  39. Sikora, S.; Redžepović, S. Genotypic Characterisation of Indigenous Soybean Rhizobia by PCR-RFLP of 16S rDNA, Rep-PCR and RAPD Analysis. Food Technol. Biotechnol. 2003, 41, 61–67. [Google Scholar]
  40. Germano, M.G.; Menna, P.; Mostasso, F.L.; Hungria, M. RFLP Analysis of the rRNA Operon of a Brazilian Collection of Bradyrhizobial Strains from 33 Legume Species. Int. J. Syst. Evol. Microbiol. 2006, 56, 217–229. [Google Scholar] [CrossRef]
  41. Da Silva, C.G.N.; Vidal, M.S.; Dourado, F.d.S.; Dias, E.S.; Howe, A.C.; Jesus, E.d.C. Specific Primers for the Rapid Detection and Quantitation of Rhizobium Elite Strains of Common Beans in the Plant and Environment. Appl. Soil Ecol. 2024, 193, 105156. [Google Scholar] [CrossRef]
  42. Vossen, R.H.A.M.; Aten, E.; Roos, A.; den Dunnen, J.T. High-Resolution Melting Analysis (HRMA)—More than Just Sequence Variant Screening. Hum. Mutat. 2009, 30, 860–866. [Google Scholar] [CrossRef]
  43. Gori, A.; Cerboneschi, M.; Tegli, S. High-Resolution Melting Analysis as a Powerful Tool to Discriminate and Genotype Pseudomonas Savastanoi Pathovars and Strains. PLoS ONE 2012, 7, e30199. [Google Scholar] [CrossRef]
  44. Landolt, P.; Stephan, R.; Scherrer, S. Development of a New High Resolution Melting (HRM) Assay for Identification and Differentiation of Mycobacterium Tuberculosis Complex Samples. Sci. Rep. 2019, 9, 1850. [Google Scholar] [CrossRef] [PubMed]
  45. Bustin, S.; Huggett, J. qPCR Primer Design Revisited. Biomol. Detect. Quantif. 2017, 14, 19–28. [Google Scholar] [CrossRef]
  46. Wong, Y.P.; Chua, K.H.; Thong, K.L. One-Step Species-Specific High Resolution Melting Analysis for Nosocomial Bacteria Detection. J. Microbiol. Methods 2014, 107, 133–137. [Google Scholar] [CrossRef]
  47. Yuan, K.; Reckling, M.; Ramirez, M.D.A.; Djedidi, S.; Fukuhara, I.; Ohyama, T.; Yokoyama, T.; Bellingrath-Kimura, S.D.; Halwani, M.; Egamberdieva, D.; et al. Characterization of Rhizobia for the Improvement of Soybean Cultivation at Cold Conditions in Central Europe. Microbes Environ. 2020, 35, ME19124. [Google Scholar] [CrossRef] [PubMed]
  48. Delamuta, J.R.M.; Ribeiro, R.A.; Menna, P.; Bangel, E.V.; Hungria, M. Multilocus Sequence Analysis (MLSA) of Bradyrhizobium Strains: Revealing High Diversity of Tropical Diazotrophic Symbiotic Bacteria. Braz. J. Microbiol. 2012, 43, 698–710. [Google Scholar] [CrossRef] [PubMed]
  49. Benjelloun, I.; Thami Alami, I.; Douira, A.; Udupa, S.M. Phenotypic and Genotypic Diversity Among Symbiotic and Non-Symbiotic Bacteria Present in Chickpea Nodules in Morocco. Front. Microbiol. 2019, 10, 1885. [Google Scholar] [CrossRef]
  50. Avontuur, J.R.; Palmer, M.; Beukes, C.W.; Chan, W.Y.; Coetzee, M.P.A.; Blom, J.; Stępkowski, T.; Kyrpides, N.C.; Woyke, T.; Shapiro, N.; et al. Genome-Informed Bradyrhizobium Taxonomy: Where to from Here? Syst. Appl. Microbiol. 2019, 42, 427–439. [Google Scholar] [CrossRef]
  51. Menna, P.; Barcellos, F.G.; Hungria, M. Phylogeny and Taxonomy of a Diverse Collection of Bradyrhizobium Strains Based on Multilocus Sequence Analysis of the 16S rRNA Gene, ITS Region and glnII, recA, atpD and dnaK Genes. Int. J. Syst. Evol. Microbiol. 2009, 59, 2934–2950. [Google Scholar] [CrossRef]
  52. Tong, S.Y.C.; Giffard, P.M. Microbiological Applications of High-Resolution Melting Analysis. J. Clin. Microbiol. 2012, 50, 3418–3421. [Google Scholar] [CrossRef]
  53. Borkowska, M.; Celińska, E. Multiple Region High Resolution Melting-Based Method for Accurate Differentiation of Food-Derived Yeasts at Species Level Resolution. Food Microbiol. 2023, 109, 104120. [Google Scholar] [CrossRef] [PubMed]
  54. Madrzak, C.J.; Golinska, B.; Kroliczak, J.; Pudelko, K.; Lazewska, D.; Lampka, B.; Sadowsky, M.J. Diversity among Field Populations of Bradyrhizobium Japonicum in Poland. Appl. Environ. Microbiol. 1995, 61, 1194. [Google Scholar] [CrossRef] [PubMed]
  55. Waleron, M.; Waleron, K.; Podhajska, A.J.; Łojkowska, E. Genotyping of Bacteria Belonging to the Former Erwinia Genus by PCR-RFLP Analysis of a recA Gene Fragment. Microbiology 2002, 148, 583–595. [Google Scholar] [CrossRef] [PubMed]
  56. Costechareyre, D.; Rhouma, A.; Lavire, C.; Portier, P.; Chapulliot, D.; Bertolla, F.; Boubaker, A.; Dessaux, Y.; Nesme, X. Rapid and Efficient Identification of Agrobacterium Species by recA Allele Analysis. Microb. Ecol. 2010, 60, 862–872. [Google Scholar] [CrossRef]
  57. Blackwood, K.S.; He, C.; Gunton, J.; Turenne, C.Y.; Wolfe, J.; Kabani, A.M. Evaluation of recA Sequences for Identification of Mycobacterium Species. J. Clin. Microbiol. 2000, 38, 2846–2852. [Google Scholar] [CrossRef]
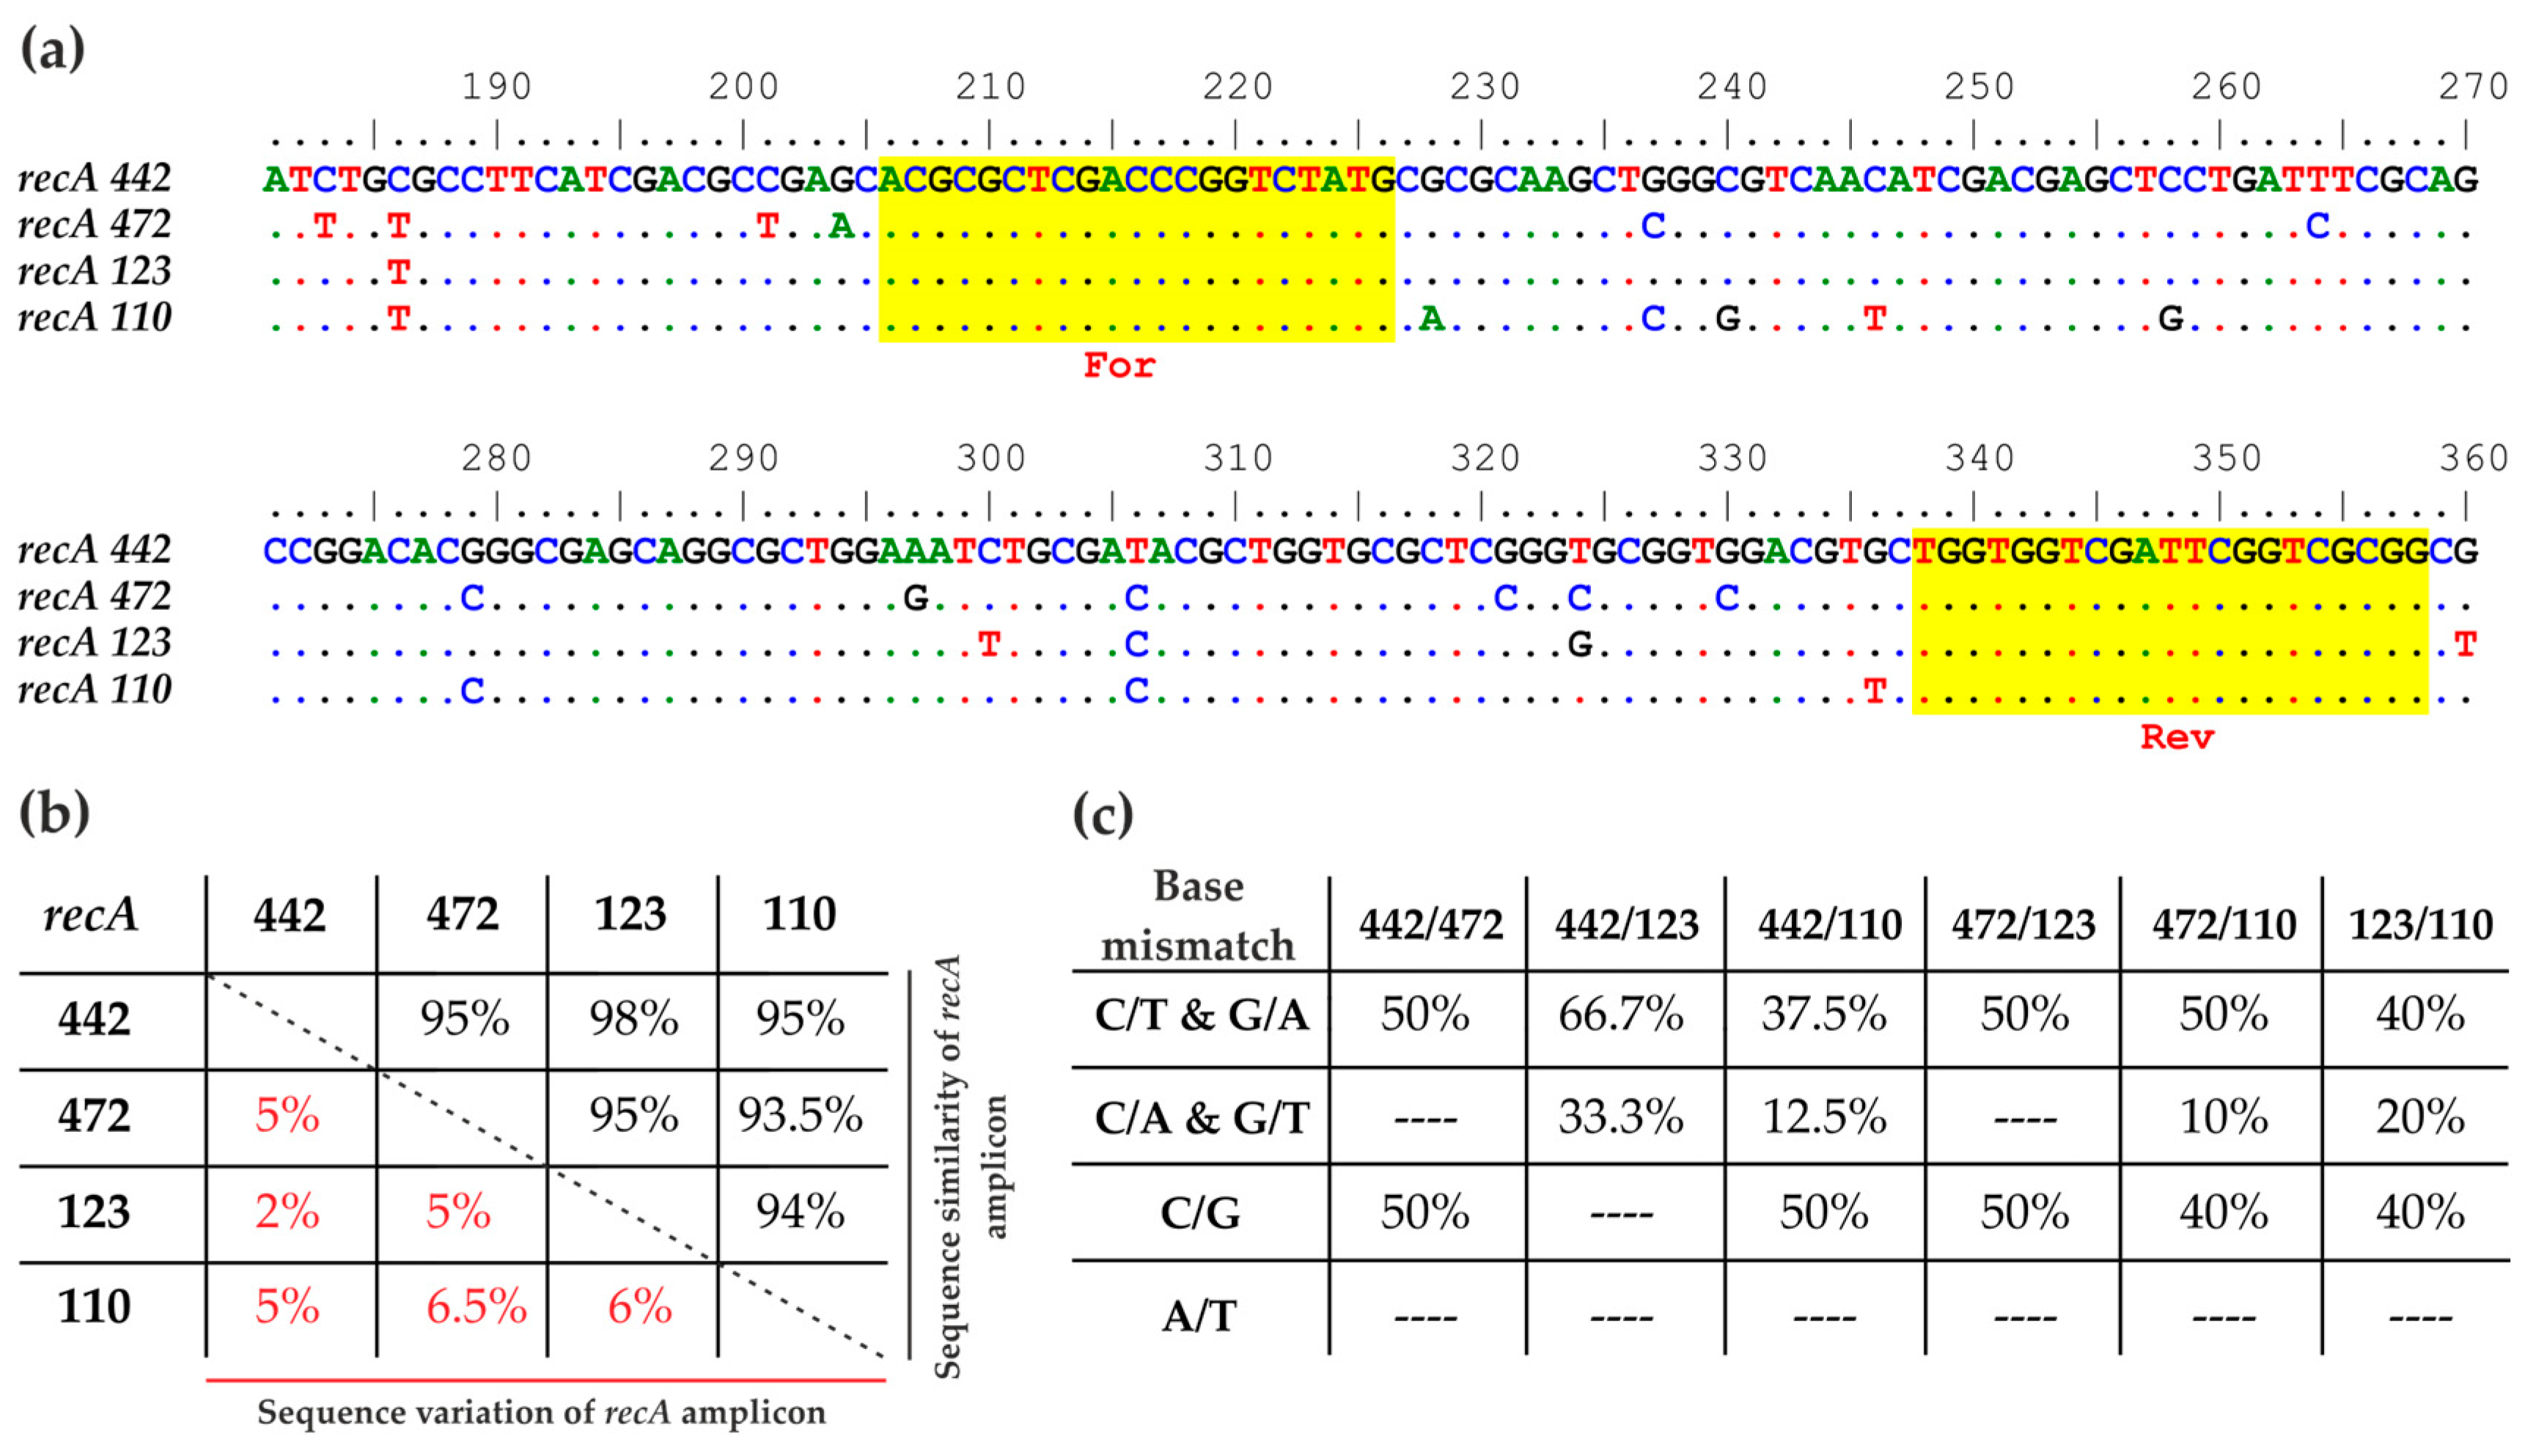
Figure 1. Sequence characteristics of the target, a 153 bp recA amplicon. (a) Sequence alignment of the amplicon within the recA gene of the Bradyrhizobium strains USDA 442, 472, 123, and 110. Primer regions are indicated in yellow. Nucleotide variation sites are shown in different colours, while identical nucleotides are shown as dots. (b) Sequence variation and similarity of the recA amplicon between reference strains. (c) Types of base mismatches between reference strains.
Agronomy 14 01305 g001
Figure 2. HRM-PCR analysis of the Bradyrhizobium reference strains. (a) Representative amplification curves of the recA gene fragment generated from genomic DNA isolated from reference Bradyrhizobium strains. The curve of USDA 442 is shown in blue, USDA 472 in black, USDA 123 in green, and USDA 110 in red; (b) melting peaks, (c) normalised melt curves, and (d) difference curves generated for the recA amplicons. RFUs—relative fluorescence units against temperature, −d(RFU)/dT—the negative rate of change in RFUs as the temperature changes.
Agronomy 14 01305 g002
Figure 3. Soybean. (a) Plants cultivated in greenhouse conditions; (b) soybean root nodules; (c) 96-well plate containing crushed soybean nodules in 50% glycerol. Scale bar, 1 cm.
Agronomy 14 01305 g003
Figure 4. Discrimination of Bradyrhizobium strains occupying soybean nodules. (a) Amplification curves of the recA gene fragment generated on nodule crude extracts. Curves assigned to the recA 442-type are shown in blue, recA 472-type in black, recA 123-type in green and recA 110-type in red; (b) melting peaks, (c) normalised melt curves, and (d) difference curves generated on recA amplicons. RFUs—relative fluorescence units against temperature, −d(RFU)/dT—the negative rate of change in RFUs as the temperature changes.
Agronomy 14 01305 g004
Figure 5. Discrimination of Bradyrhizobium strains occupying soybean nodules. (a) Comparison of melting points of recA amplicons. (b) Nodule occupancy of Bradyrhizobium strains. (c) Confidence percentage of assignment to Bradyrhizobium strain clusters. Different lowercase letters indicate significant differences among means according to the Kruskal–Wallis test and a post hoc Dunn’s multiple comparison test.
Agronomy 14 01305 g005
Figure 6. Sequence alignment of the amplicon within the recA gene of Bradyrhizobium strains USDA 442, 472, 123, and 110 and nodule crude extracts (A1–A6). Nucleotide variation sites are shown in different colours, while identical nucleotides are shown as dots. Strain classification resulting from HRM-PCR reaction is shown in brackets.
Agronomy 14 01305 g006
Figure 7. PCR profiling of the Bradyrhizobium strains using the primer RP01. The particular lanes of the gel contain the amplification products obtained with the use of genomic DNA from USDA 110 (line 1), USDA 123 (line 6), USDA 442 (line 11), and USDA 472 (line 17) reference strains and nodule crude extracts (lines 2–5; 7–10; 12–16). Lane M, molecular marker (Marker 2+ DNA ladder; A&A Biotechnology, Gdańsk, Poland).
Agronomy 14 01305 g007
Disclaimer/Publisher’s Note: The statements, opinions and data contained in all publications are solely those of the individual author(s) and contributor(s) and not of MDPI and/or the editor(s). MDPI and/or the editor(s) disclaim responsibility for any injury to people or property resulting from any ideas, methods, instructions or products referred to in the content.