Abstract
In this study, 300 quinoa accessions were systematically screened for adaptation to low-altitude areas using seventeen traits. The experiment was conducted in Taigu District, Jinzhong City, Shanxi Province, in 2021, at an altitude of 791 m. Out of the 300 genotypes, 107 were able to produce flowers and fruit, with yields ranging from 538 to 5132 kg ha−1 and with 1000-grain weights between 1.19 g and 2.37 g. These 107 quinoa genotypes were categorized into four groups based on grain yield: below 1500, 1500–2250, 2250–3000, and above 3000 kg ha−1. These groups consisted of 33, 33, 24, and 17 genotypes, respectively. This study found that the 1000-grain weight ranged from 1.19 g to 2.37 g, with an average of 1.72 g, 1.72 g, 1.83 g, and 1.92 g for the respective yield levels. Among the 107 genotypes, 25 had a 1000-grain weight exceeding 2 g, and 13 of these genotypes also had yields exceeding 2250 kg ha−1. The growth period of quinoa genotypes in the low-altitude area was approximately 138–142 days, with longer growth periods associated with higher yield levels. JQ-00084 is the only genotype with a yield > 3000 kg ha−1 and meets all the growth criteria, including a 1000-grain weight exceeding 2 g and a flowering-to-maturity period of over 80 days. Meanwhile, JQ-00315, JQ-00521, JQ-1029, and JQ-02405 fulfilled at least four criteria. These results highlight the importance of germplasm screening for low altitudes, and a large set of germplasms could be screened using the above criteria of phenology, growth, and yield traits.
1. Introduction
Quinoa (Chenopodium quinoa Willd.), a crop native to the Andean region of South America, has gained worldwide popularity as a nutritious staple for health-conscious consumers [1,2,3]. It is now grown in over 70 countries [4]. This increased demand has led to quinoa being cultivated in new regions that are not traditionally associated with its growth [5,6]. In recent years, the cultivation of quinoa has been increasing due to its well-known nutritional benefits [1] and its ability to thrive in challenging environmental conditions [7,8].
As global climate patterns change and agriculture evolves, it is becoming increasingly evident that we need to adapt quinoa cultivation to a wider range of agroecological zones [6]. One promising opportunity for expanding quinoa cultivation is in low-altitude areas that have not been extensively explored for quinoa production [9]. Low-altitude areas present unique challenges and opportunities that, if managed properly, could significantly enhance the availability and sustainability of quinoa [10]. However, the successful integration of quinoa into new geographical areas and cropping systems worldwide depends on addressing genotypic differences alongside its agronomic potential [11,12].
Different germplasm resources can show phenotypic variability depending on various factors which help adaptation to altering environment [13,14,15]. The patterns of genotypic adaptation are reflected in phenotypic variations [10]. These genetic variabilities could be exploited to select appropriate quinoa genotypes with the potential to adapt to low altitudes [9,10,11,16]. To fully realize this potential and address the specific challenges of quinoa cultivation at lower altitudes, it is crucial to conduct a comprehensive screening of the quinoa germplasm. Quinoa is renowned for its wide range of genetic diversity [17,18], offering the possibility of identifying and selecting quinoa varieties that can better survive at lower altitudes, resulting in higher yields [10,19]. By studying the genetic variations among different quinoa genotypes and their performance at lower altitudes, we can adapt quinoa cultivation to a broader range of environmental conditions, making it more accessible and economically viable.
Globally, farmers cultivate over 6000 quinoa varieties, which can be classified into five main ecotypes based on their adaptation to specific agroecological conditions in major production regions [20]. These categories include the inter-Andean valley, highlands, deserts, high-altitude areas, coastal areas, and the Yungas (an area with high moisture) [5,19,20]. Field trials conducted across diverse agro-ecological conditions in nine countries have revealed promising adaptability among quinoa genotypes, with specific landraces like Q18, Q12, Q21, and Q26 demonstrating varying stability and yield potential, making them valuable options for cultivation under different environmental conditions [5,20].
Fuentes and Bhargava [19] studied the key traits of 28 quinoa accessions collected from the Chilean Andes in a lowland desert environment. Significant variations were observed and some of the genotypes were categorized as high-yielding and others as having excellent forage potential. Similarly, Shah et al. [21] accessed the grain yield, forage yield, and nutritive values of 15 quinoa genotypes and found that the genotypes with higher numbers of branches and compact main inflorescence produced higher grain yields, while those with thicker stems, more branching and moderate plant heights are more inclined to produce higher biomass for fodder. Similarly, Coronado et al. [22] examined significant variations in the agro-morphological characteristics of 50 quinoa genotypes from Colombia. Qualitative and quantitative descriptors were used, and the results revealed greater variability in traits associated with yield. Principal component analysis showed that the plant height, length, diameter and panicle number contributed most to the variation.
Quinoa was introduced to China in the 1960s, with a limited distribution until 2008. The establishment of the Quinoa Committee of the Crop Science Society of China in 2015 facilitated collaboration among stakeholders. By 2018, quinoa cultivation had expanded to nearly 12,000 hectares in 24 provinces, supported by partnerships between enterprises and research institutes. Quinoa demonstrated adaptability in diverse ecological regions in China, ranging from 154 m below sea level in Turpan City, Xinjiang, to altitudes exceeding 5000 m in Shangri-la City, Yunnan. Key cultivation areas include Gansu, Inner Mongolia, Qinghai, Yunnan, Shanxi, Hebei, Jilin, and Tibet. The crop’s sowing and harvesting periods varied by region. The total cultivation area and production in 2018 were approximately 12,000 hectares and 20,000 tons, respectively. This expansion resulted in advancements in the variety registration and mechanized production in several provinces [23].
The ultimate crop yield is contingent upon the intricate interplay between the plant’s genotype and the prevailing environmental conditions [24]. This dynamic relationship between genes and the environment plays a pivotal role in determining the quantity and quality of the final harvest. Factors such as altitude [25,26,27], latitude [28], temperature, moisture, precipitation, soil type, and soil nutrients can significantly influence how a particular genotype performs in each location, leading to variations in yield outcomes [29,30]. Therefore, different genotypes perform differently under the same environmental conditions. Understanding and optimizing this genotype–environment interaction is essential for effective crop management and the development of resilient agricultural practices.
Certain crop varieties are better suited to low-altitude conditions by exhibiting specific phenotypic traits that ensure optimal yield [10,17,29]. These traits include high grain and biomass production, resistance to lodging, insensitivity to day length, minimal branching, prevention of perianth and fruit opening, a moderate plant growth cycle, synchronous maturation [21,22,31,32], and resistance to pests and diseases [33].
The mechanical strength of the stem is an important phenotypic trait, particularly in cereals and crops that are prone to lodging. This is an inherent property of plants but is also affected by cropping management and competition for light [34]. Stem hardness is a major influencing factor for lodging and stem architecture [35]. An enhanced accumulation of carbohydrates in the basal stem could result in an elevated resistance to bending in the stem [36]. Stem thickness serves as a biological marker for the green or dry biomass content. Compressive properties, encompassing strength, force, and stress, play a crucial role in determining energy requirements. Hence, the identification and cultivation of genotypes with an augmented stem strength, proven to be a valuable field parameter, are key [37].
Low-altitude varieties may exhibit specific phenological characteristics that align with the local growing conditions, optimizing yield potential [29,38]. The duration of the phenological stage from flowering to maturity is crucial for grain filling and yield determination. Low-altitude regions typically experience higher temperatures compared to higher altitudes. Elevated temperatures can hasten plant growth and development, leading to early flowering and impacting the duration of the reproductive stage [38,39]. This can either increase or decrease yield depending on the effect on the length of the reproductive stage [24]. The photoperiod sensitivity of quinoa genotypes plays a significant role in adapting to new altitudes [9]. A shortened growth period may result in reduced sugar and starch accumulation and lower biomass [29].
The genetic diversity inherent in quinoa germplasm offers numerous opportunities to identify and select genotypes that can thrive and produce robust yields in low-altitude environments. By understanding the genetic variations among quinoa genotypes and their performance at lower altitudes, we can customize the cultivation of this exceptional crop to suit a broader range of geographic and environmental conditions, enhancing its global adaptability and economic viability. In this study, we hypothesized that specific quinoa genotypes, due to genetic differences, possess phenotypic traits that enable them to adapt and produce efficient yields in low-altitude regions. The purpose of this research was to systematically screen and characterize 300 quinoa accessions for their phenotypic traits and yield performance in a low-altitude area, thereby identifying genotypes with superior adaptability and yield potential. This knowledge will guide future breeding programs and cultivation strategies aimed at optimizing quinoa production in diverse low-altitude environments.
2. Results
2.1. Grain Weight and Yield
The yield of 107 quinoa accessions was divided into four yield ranges, i.e., below 1500 kg ha−1 (GY1), 1500–2250 kg ha−1 (GY2), 2250–3000 kg ha−1 (GY3), and above 3000 kg ha−1 (GY4) (Table S1). The yield and 1000-grain weight of quinoa from different yield ranges were significantly different. The yield of 107 quinoa genotypes ranged from 537.95 to 5132.42 kg ha−1 (Figure 1a). The average yields were 1012.95, 1920.92, 2597.11 and 3752.83 kg ha−1, respectively, at these yield ranges and there were significant differences among all yield levels. Among all genotypes, JQ-02068 produced the highest yield of 5132 kg ha−1 (Figure 1b).
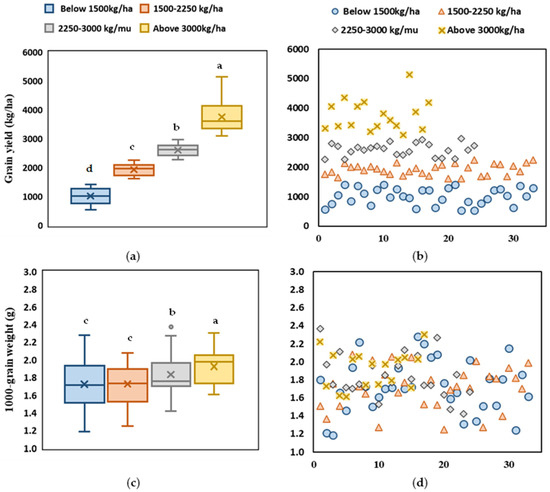
Figure 1.
The grain yield (a,b) and thousand-grain weight (c,d) for different quinoa accessions. Different letters indicate significant differences among mean values using the Tukey HSD test (p ≤ 0.05).
The 1000-grain weight ranged from 1.19 to 2.37 g and the average 1000-grain weight was 1.72g, 1.72 g, 1.83 g, and 1.93 g, respectively, under yield levels of GY1, GY2, GY3, and GY4, respectively (Figure 1c). From 107 genotypes, 25 quinoa genotypes had a 1000-grain weight of more than 2 g, and from these, 13 genotypes had a yield of over 2250 kg ha−1 (GY3 and GY4), including JQ-00136, JQ-00294, JQ-00769, JQ-01141, JQ-01394, JQ-00314, JQ-00084, JQ-00520, JQ-00521, JQ-01961, JQ-02068, JQ-02405, and CK1 (Figure 1d).
2.2. Growth Period and Accumulated Temperature Characteristics of Different Quinoa Accessions
2.2.1. Phenological Developmental Period for Different Quinoa Accessions
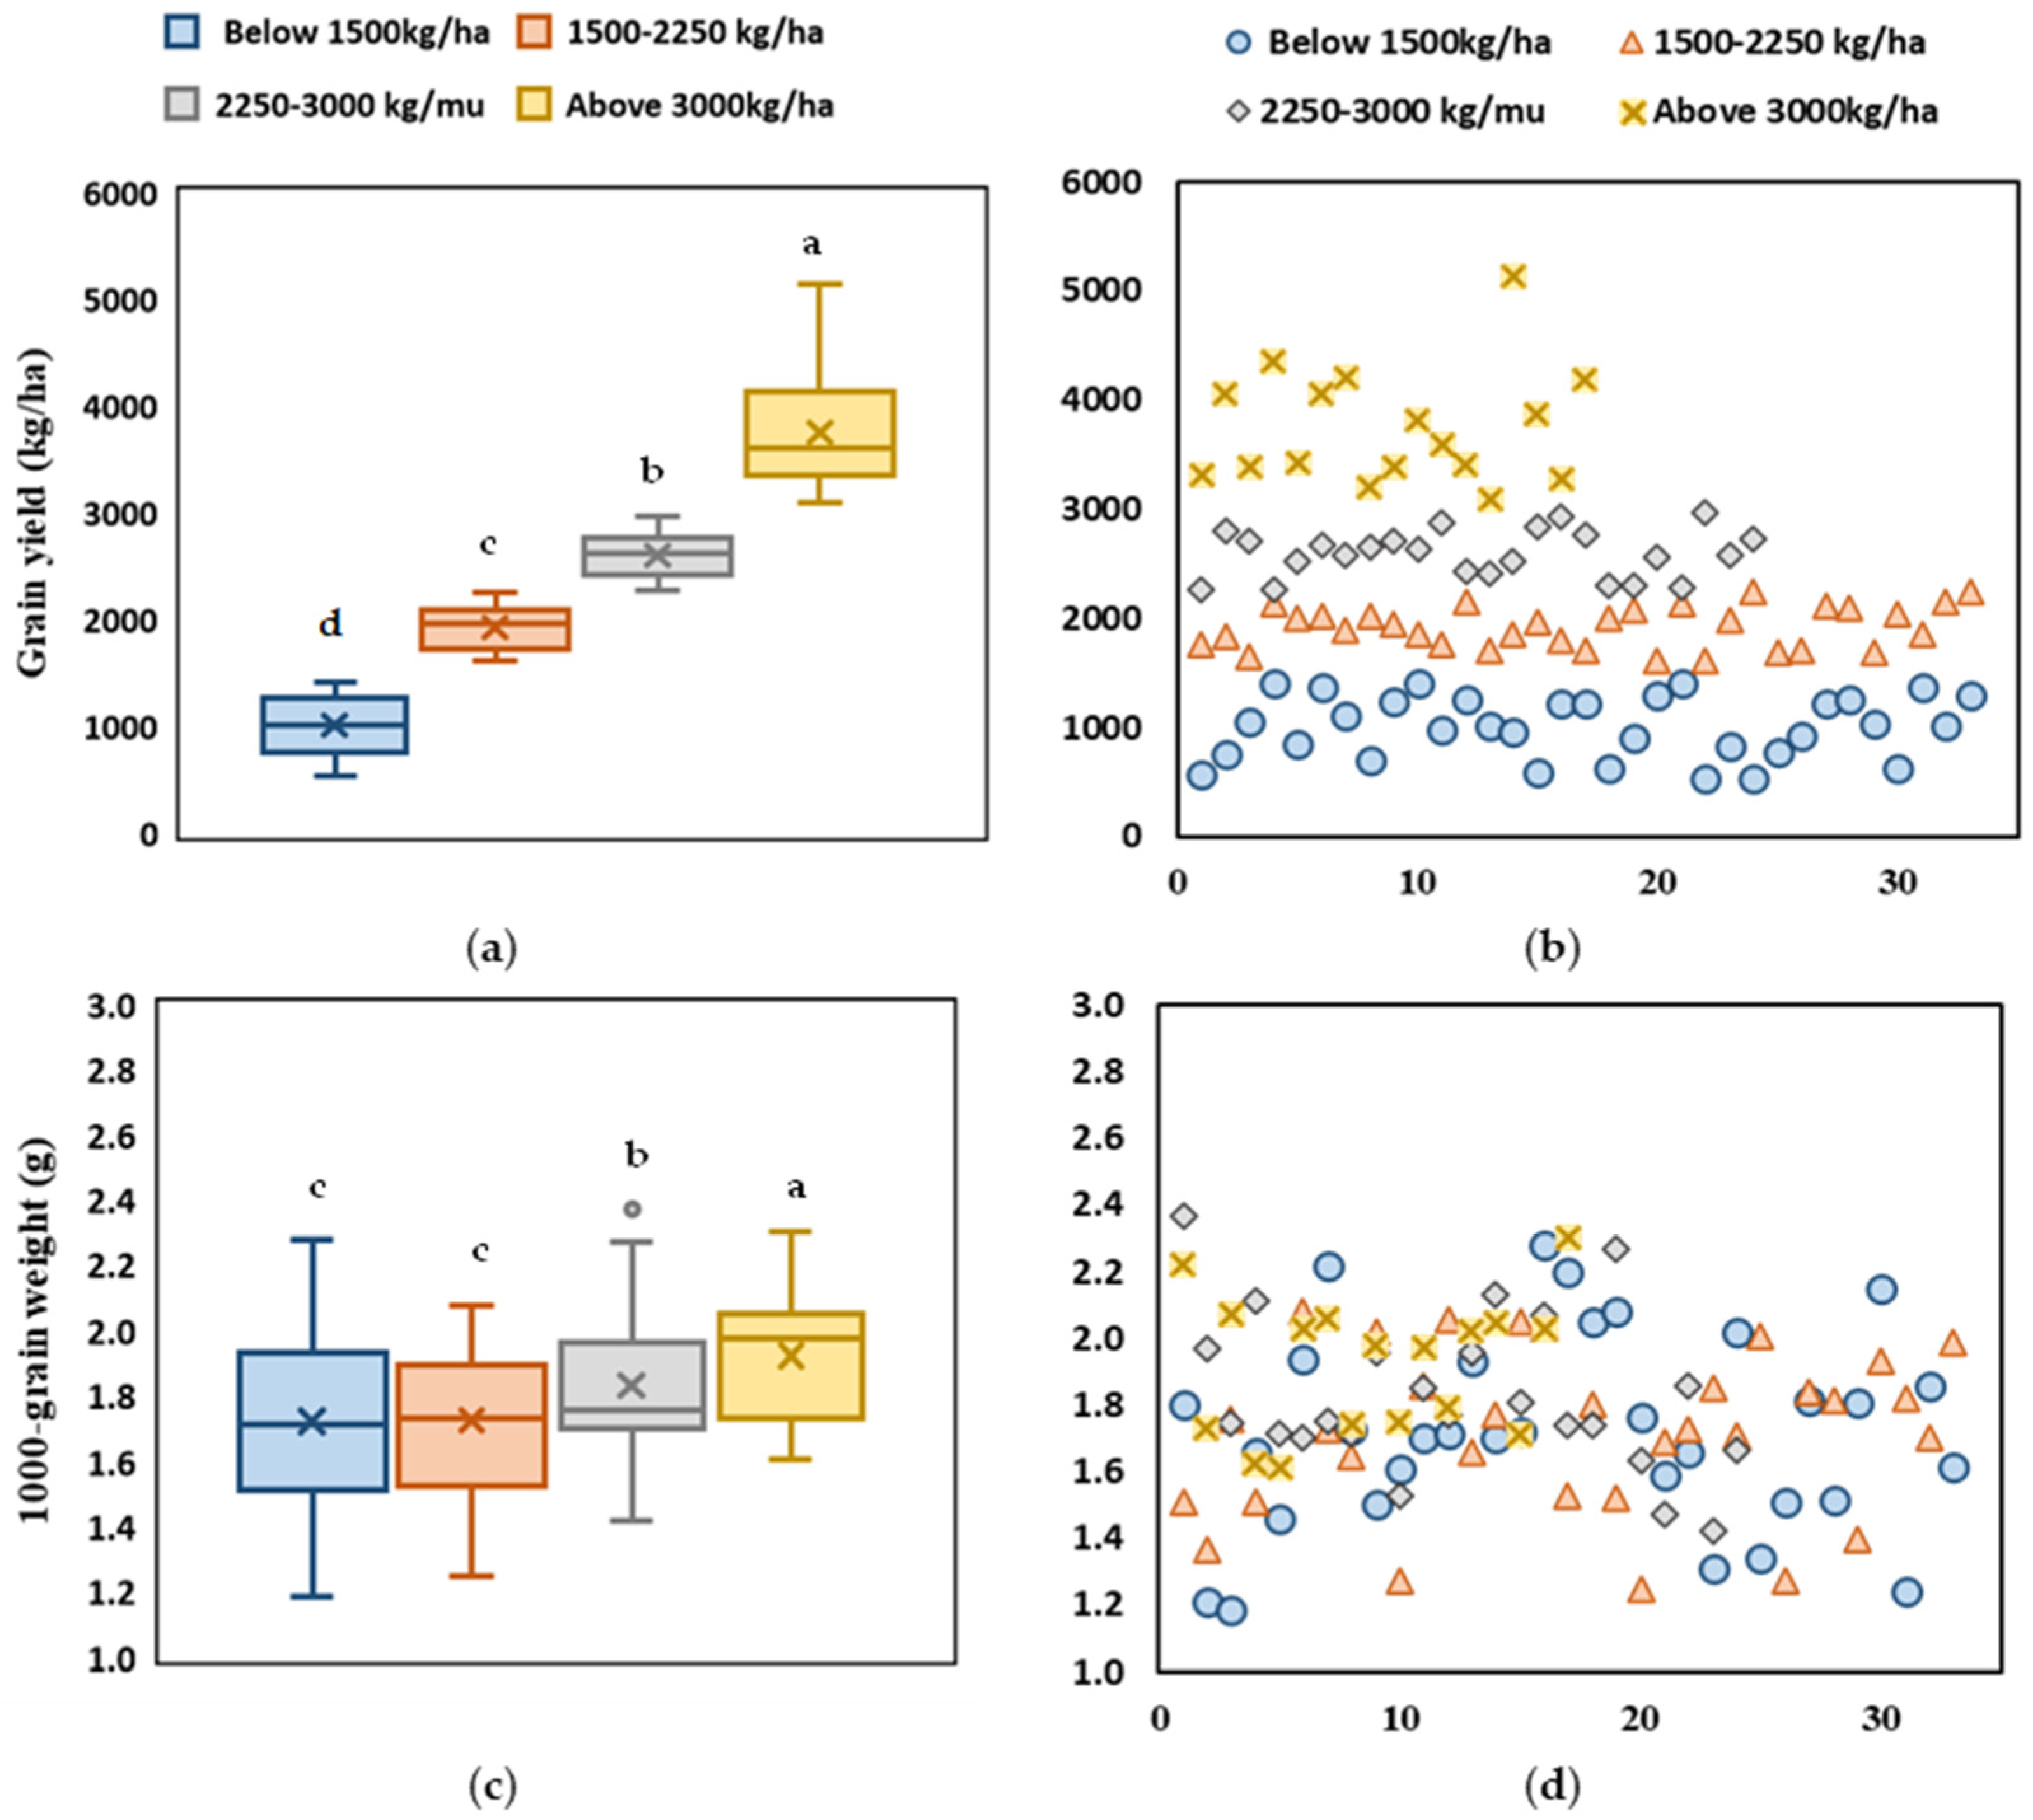
In the low-altitude area, the total growth stage of quinoa genotypes was 136–143 days (Tables S1–S4; Figure 2). From these, all the seven genotypes with a total growth duration of 136 days belong to the GY1 category, while 10 accessions showed the longest duration of 143 days, of which two, seven and one accessions belong to GY2, GY3, and GY4, respectively.
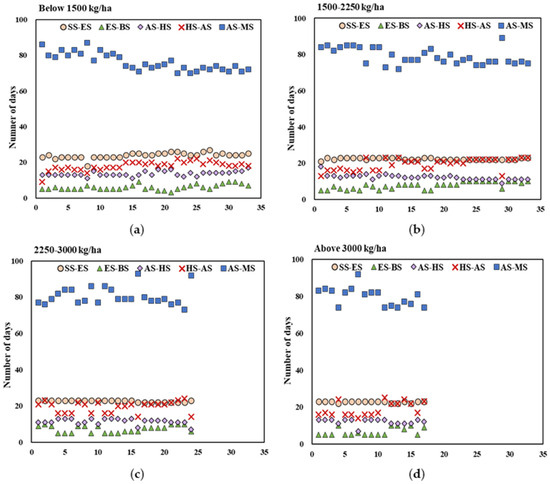
Figure 2.
The phenological developmental period during different growing stages of different quinoa genotypes with a yield of (a) below 1500 kg ha−1, (b) 1500–2250 kg ha−1, (c) 2250–3000 kg ha−1, and (d) above 3000 kg ha−1.
The average of the total growth period according to yield categories ranged from 138 to 142 days (Figure 2; Table 1). The genotypes with a yield below 1500 kg ha−1 (GY1) had the shortest total growth period of 137.8 days, while genotypes above 1500 kg ha−1 (GY2-GY4) showed a significantly longer growth period than GY1, ranging from 140.29 to 141.54 days. The growth period of GY1 genotypes was shortened by 0.65–1.61 days from emergence to branching, 0.97–1.47 days from ear development to flowering, and 2.82–3.36 days from flowering to maturity (Table 1).

Table 1.
The number of days during different growth stages (d) of the quinoa germplasm with different yield levels.
In addition, the number of days from ear development to flowering and flowering to ripening stages varied greatly; in particular, flowering to ripening was the most shortened stage, causing low yields (Figure 2). The growth stage of quinoa accessions that can bear fruit at low altitudes was about 140 days. The length of the flowering-to-maturity stage significantly affects the yield level. Among 107 quinoa accessions, 43 genotypes had a flowering to ripening duration of 80 days. In total, 9, 15, 9, and 10 genotypes belonging to yield ranges of GY1, GY2, GY3, and GY4, respectively, had a flowering-to-maturity stage of more than 80 days (Table S1–S4).
2.2.2. Accumulated Temperature at Each Growth Stage
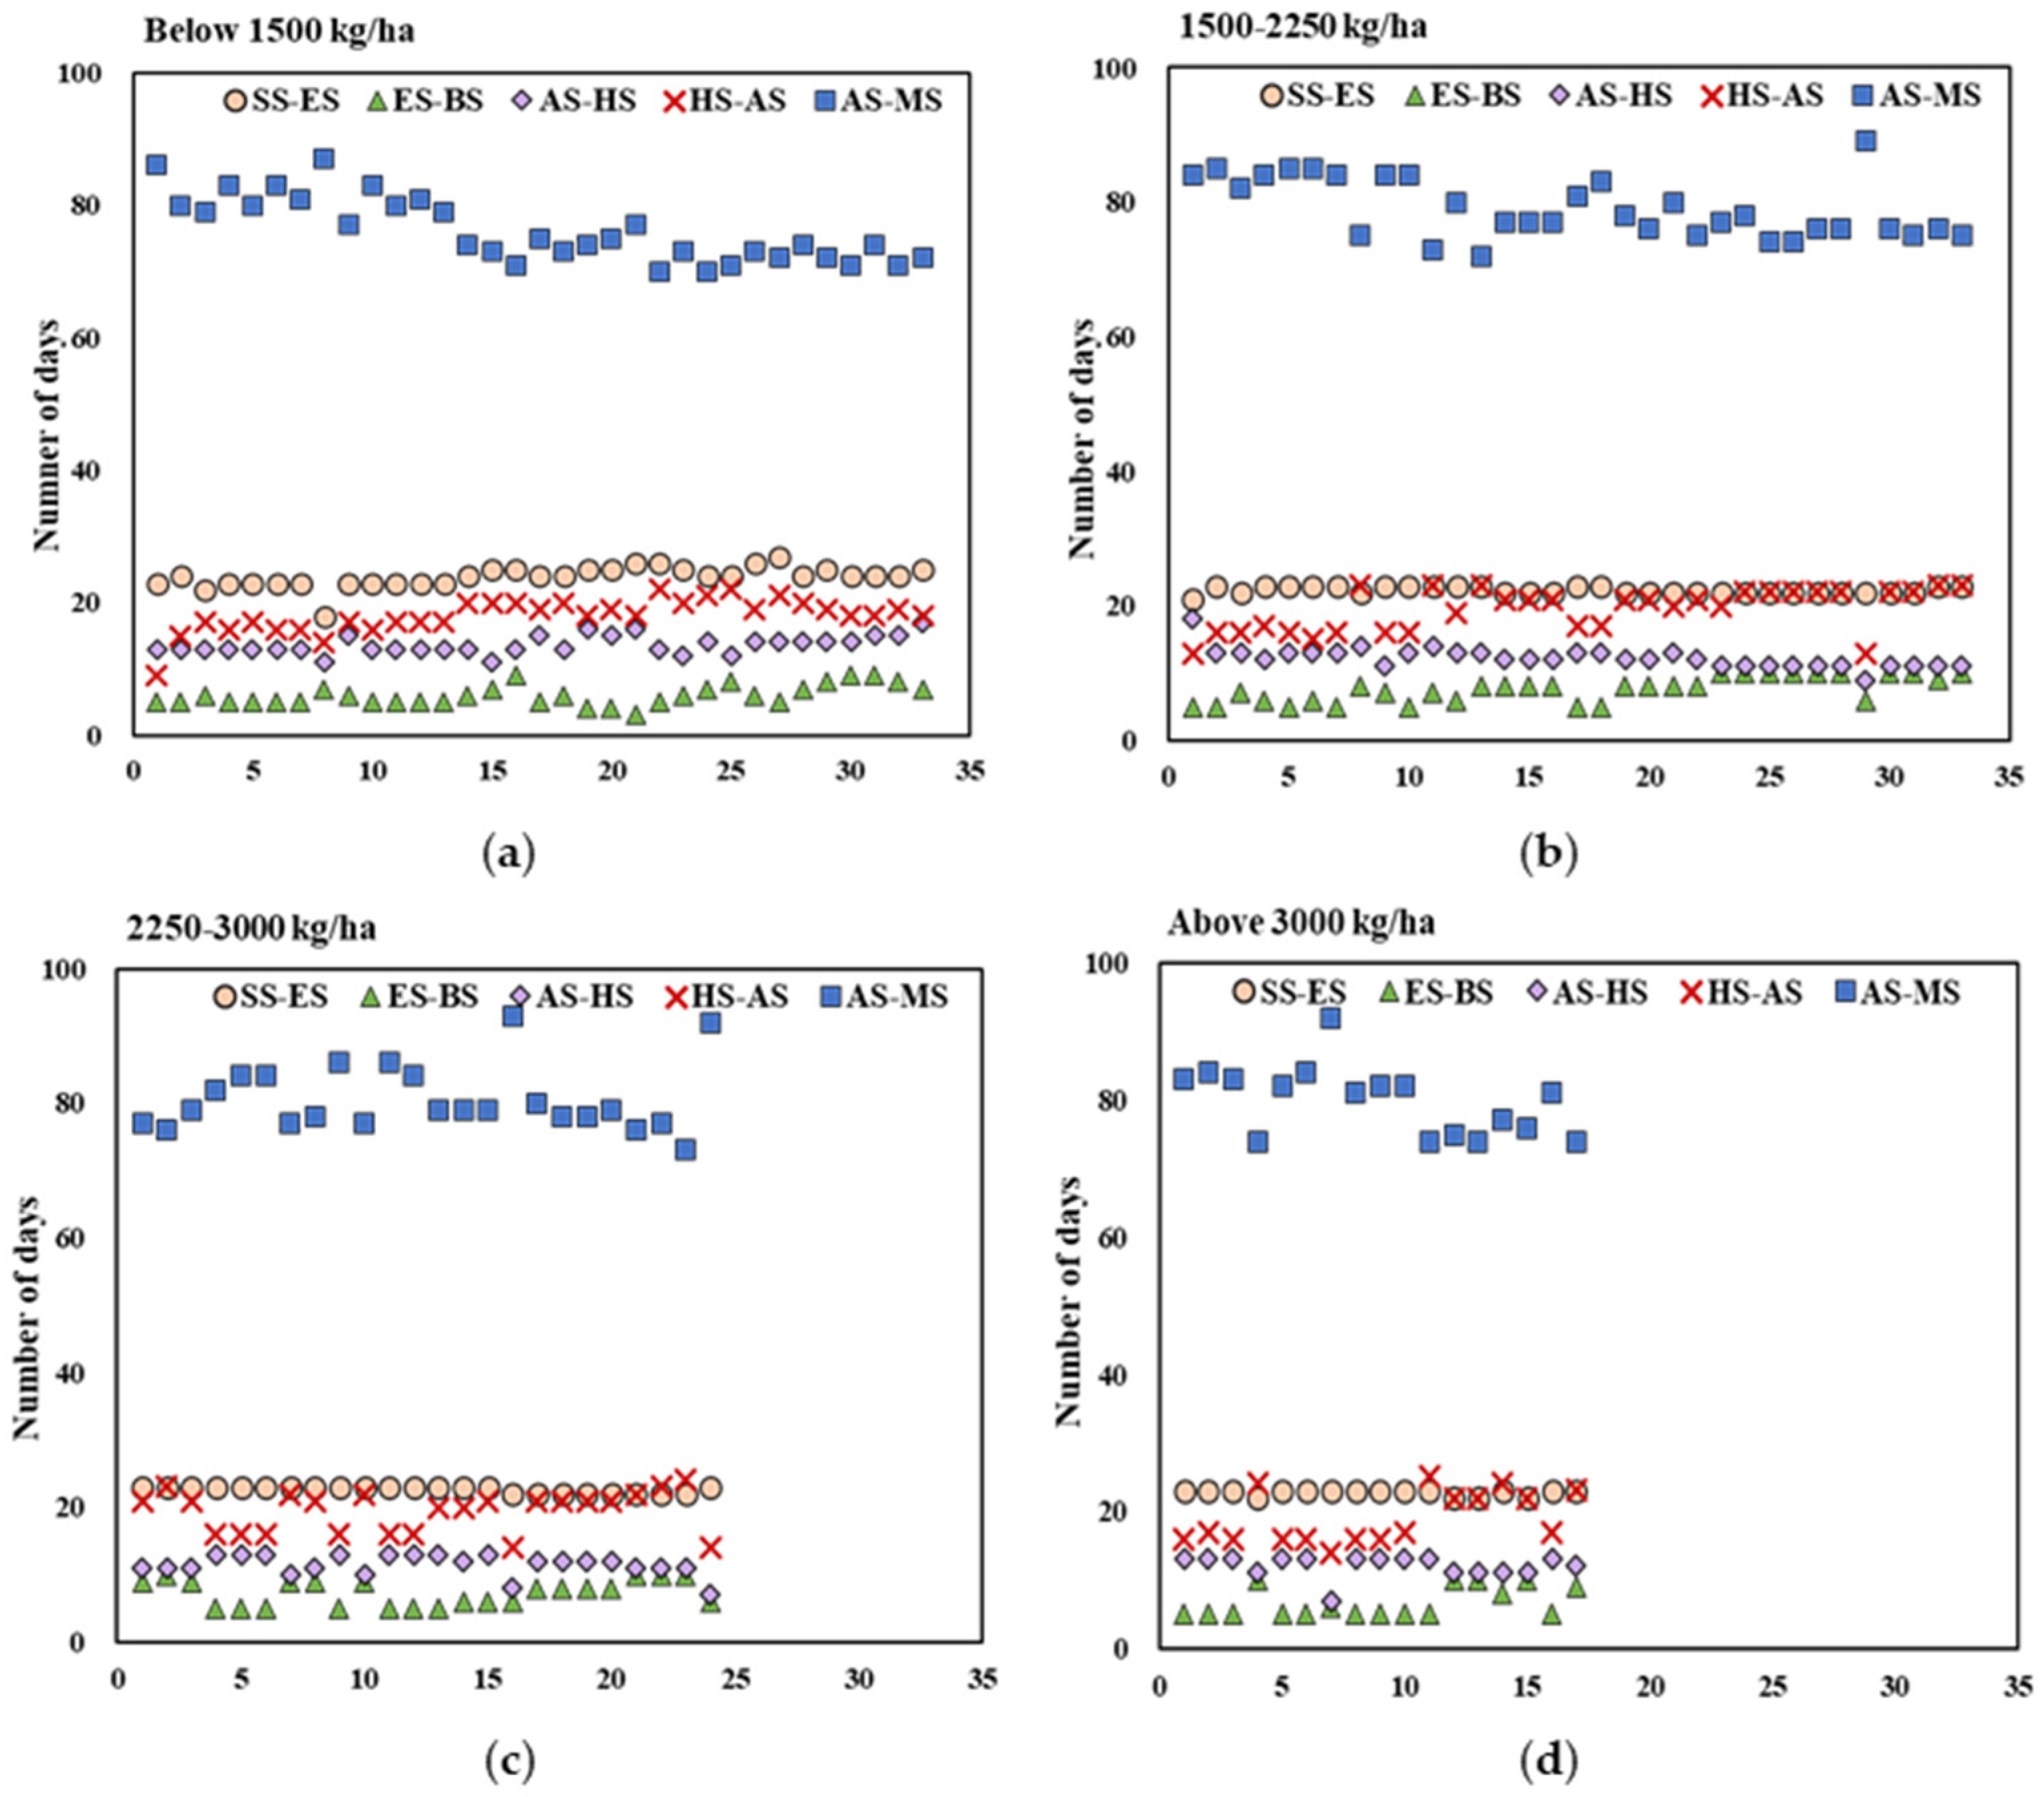
In the low-altitude area, the accumulated temperature of quinoa during the total growth period (TS) at different yield levels ranged from 2962 to 3003 °C (Table 2). The maximum accumulated temperature (3003 °C) was attained by genotypes producing yield GY3 and the lowest accumulated temperature (2962 °C) was attained by genotypes with yield GY1.
Table 2.
The accumulated temperature (°C) during the growth stages of the quinoa germplasm with different yield levels.
The highest accumulated temperature at the yield level of GY3 was mainly due to the higher accumulated temperature in the heading to flowering and flowering to maturity stages (Table 2). The accumulated temperature of quinoa resources with a flowering-to-maturity stage of more than 80 days reached 1844–2096 °C (Figure 3). These results showed that an accumulated temperature of about 3000 °C is required during the growth period at low altitude and the difference in accumulated temperature in the ear development to maturity stage affects the yield level.
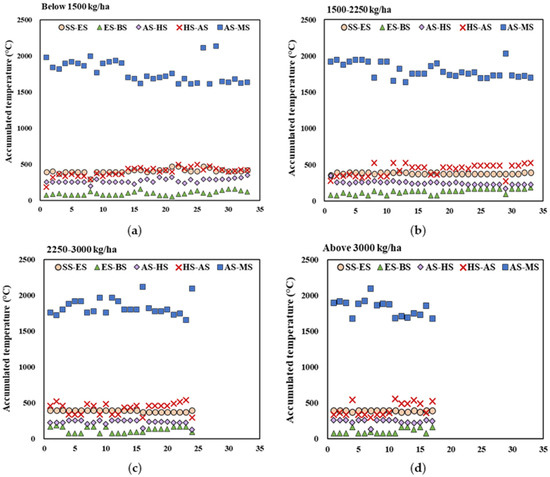
Figure 3.
Differences in accumulated temperature at different growing stages for different quinoa genotypes with a yield of (a) below 1500 kg ha−1, (b) 1500–2250 kg ha−1, (c) 2250–3000 kg ha−1, and (d) above 3000 kg ha−1.
2.3. Differences in Root Characteristics of Different Quinoa Accessions at the Maturity Stage
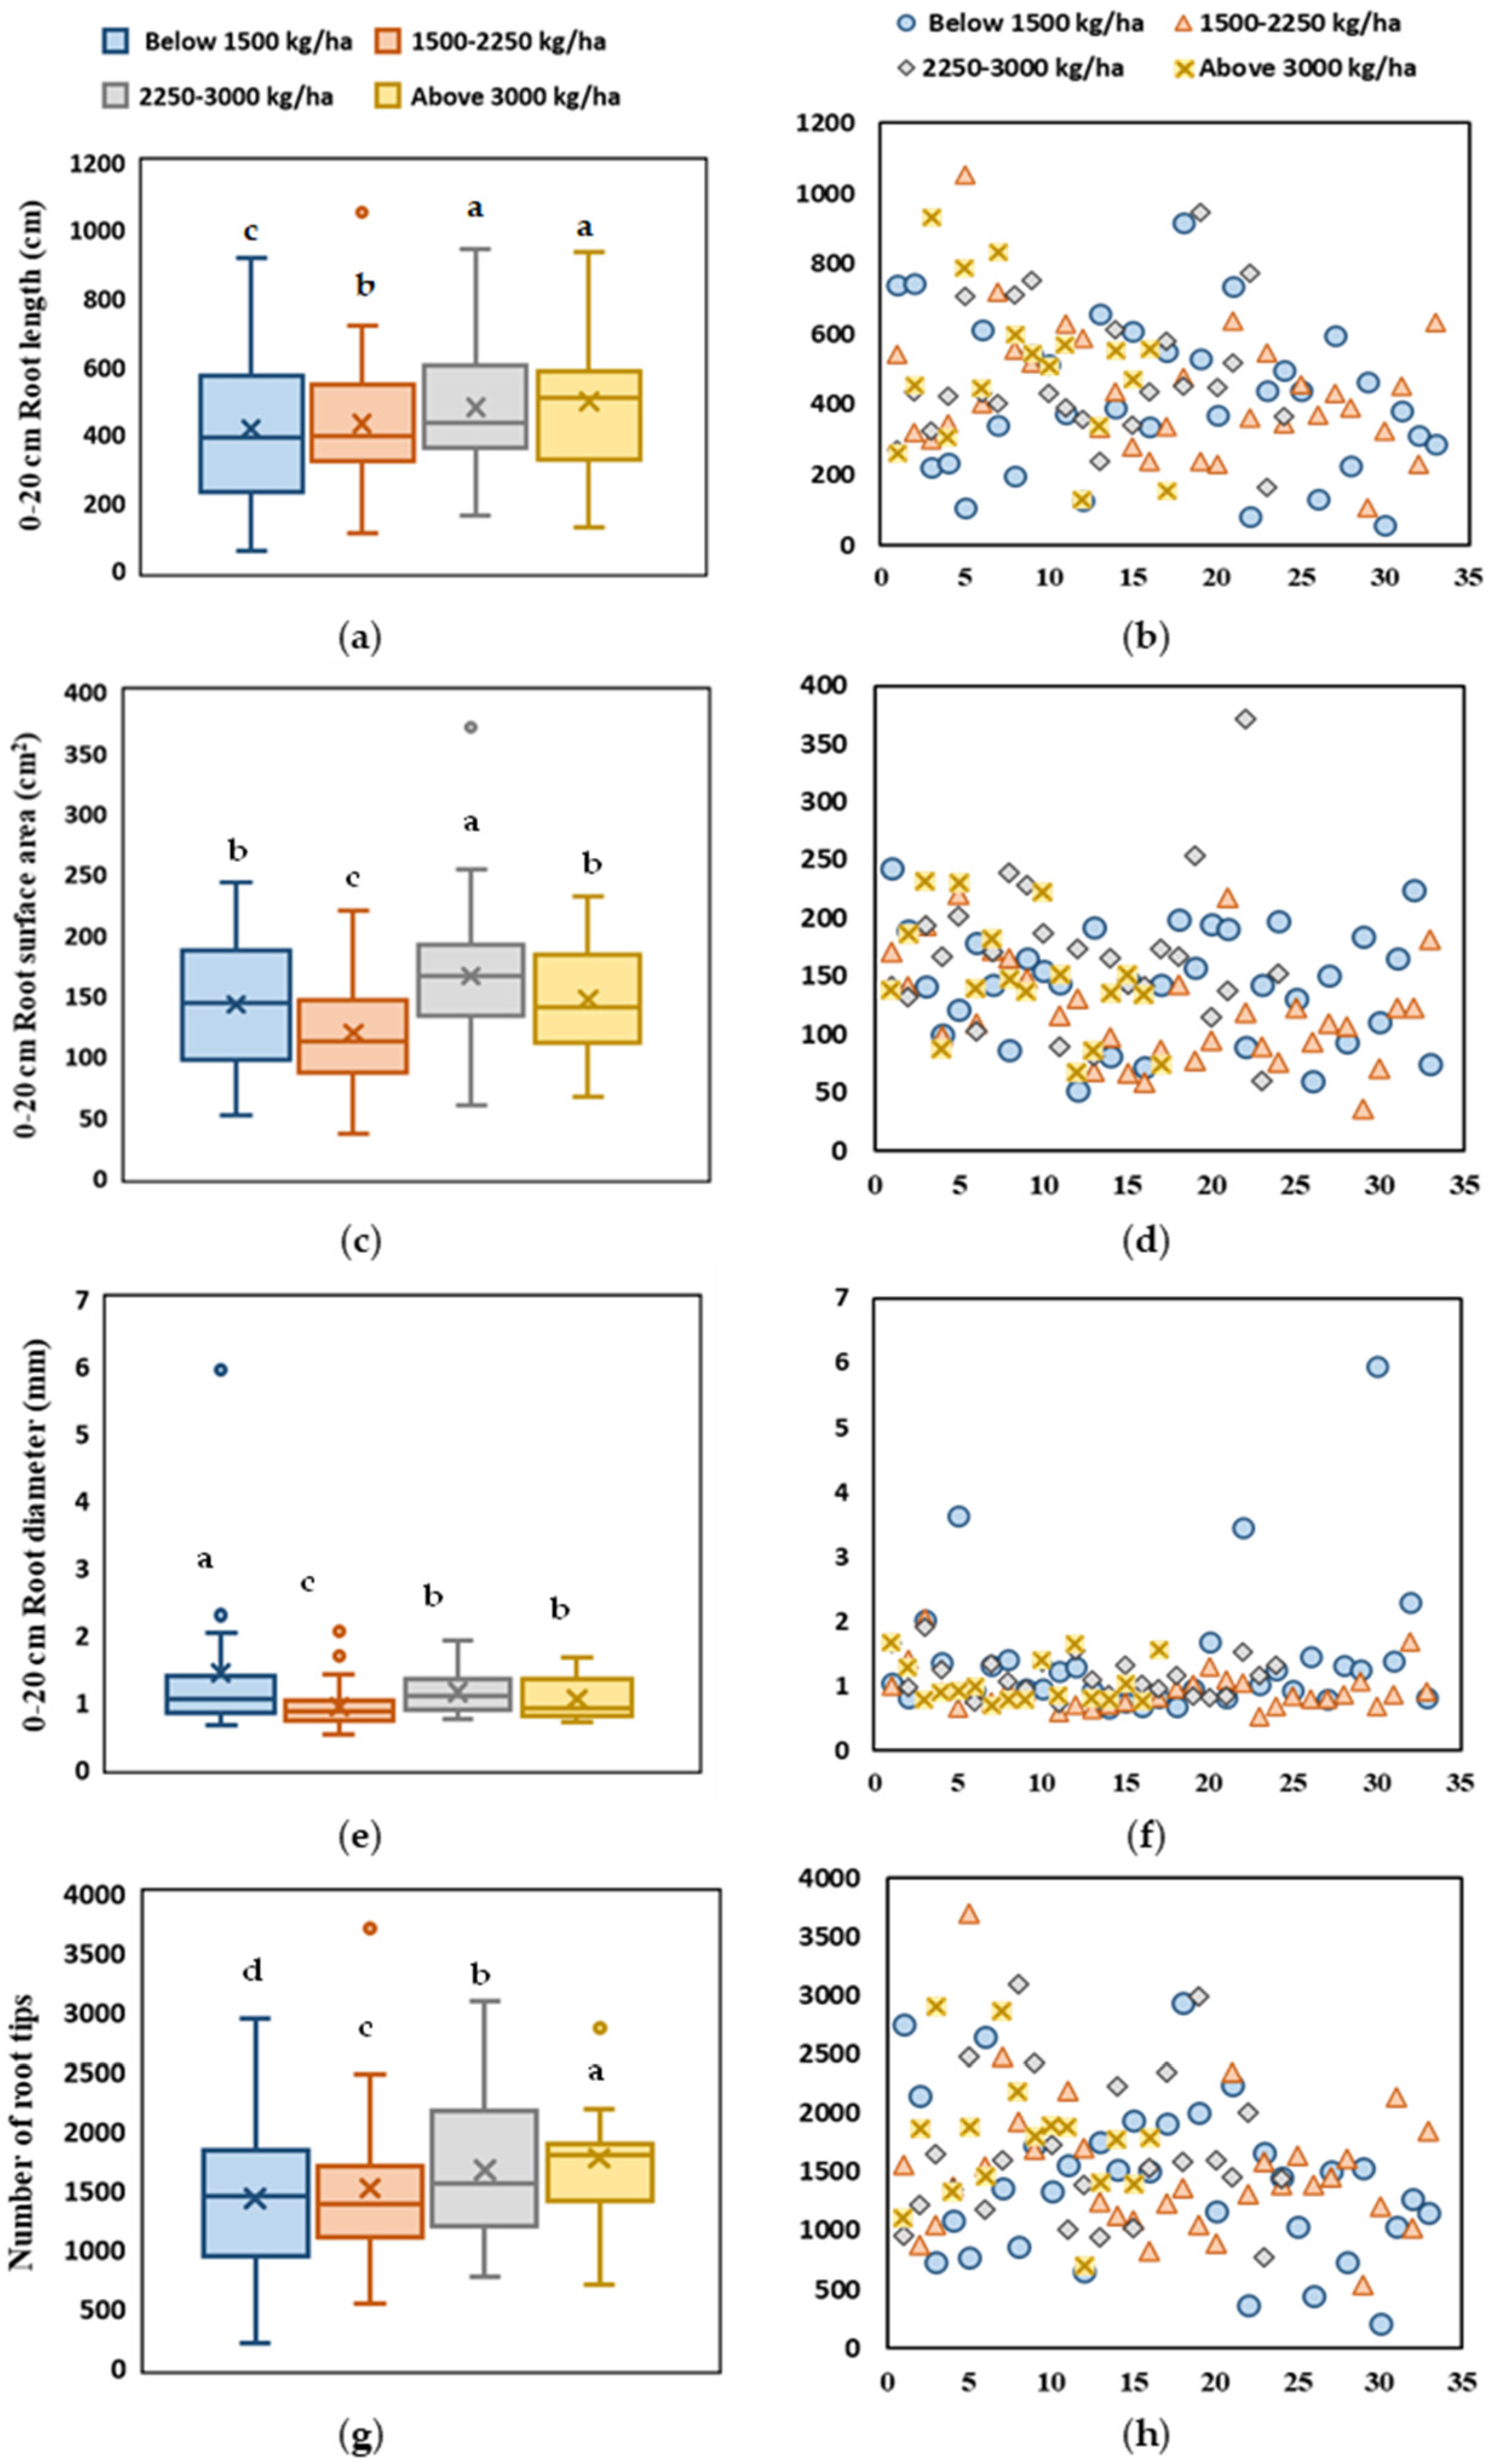
The root traits of 107 quinoa genotypes varied greatly (Figure 4). The 0–20 cm root length of quinoa ranges from 415 to 480 cm at different yield levels, with the highest for GY4 and the lowest for GY1 (Figure 4a,b). Of the 107 quinoa accessions, the root surface area of 55 genotypes exceeded the average of 144.16 cm2 (Figure 4c,d). The root surface area at 0–20 cm was 119.79–166.25 cm2; the highest was for GY3 and the lowest was for GY2. The root diameter at 0–20 cm was 0.93–1.39 mm; the highest was for GY1 and the lowest was for GY2 (Figure 4e,f). The number of roots at 0–20 cm ranged from 1439.76 cm to 1718.18 cm, with the highest level for GY4 and the lowest for GY1 (Figure 4g,h). The mean values of root length, root surface area, and number of root tips of GY4 were 19.1%, 2.8%, and 23.8% higher, while the root diameter was 27% lower than GY1.
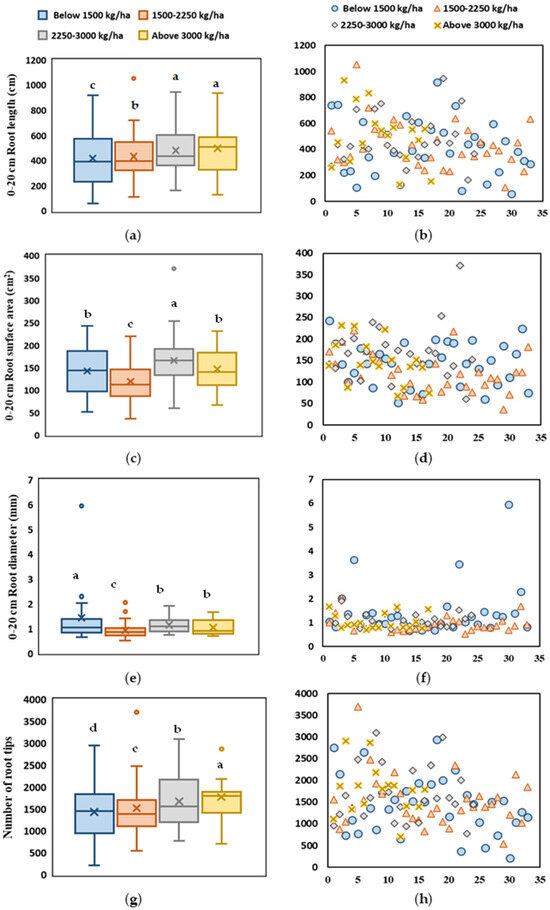
Figure 4.
Differences in 0–20 cm root characteristics of different quinoa genotypes at maturity. (a,b) Root length, (c,d) surface area, (e,f) diameter, and (g,h) number of root tips. Different letters indicate significant differences among means using the Tukey HSD test (p ≤ 0.05).
2.4. Stem Characteristics
The average stem base hardness of quinoa ranges from 336.69 to 374.76 kPa at different yield levels, with the highest for GY3 and the lowest for GY2 (Figure 5a). The hardness of the stem base was stronger than that of the middle. The hardness of the middle of the stem ranges from 257.74 to 280.56 kPa (Figure 5b). The highest center stem hardness was for the yield level of GY3 and the lowest was for GY1 and GY2. GY3 and GY4 exhibited 7.6 and 7.7% higher center stem hardness than GY1.
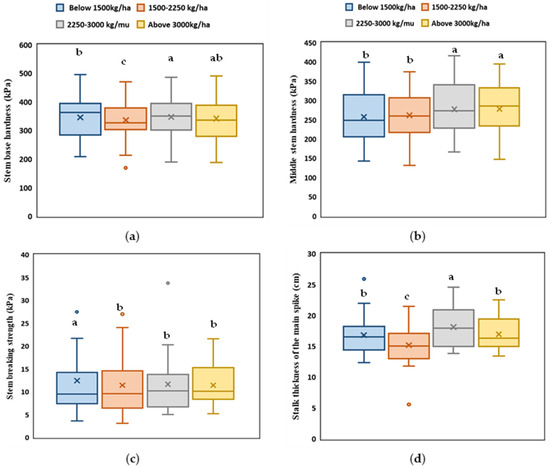
Figure 5.
Differences in stem characteristics for different quinoa genotypes at maturity. (a) Stem base hardness, (b) center stem hardness, (c) stem breaking strength, and (d) stalk thickness of the main panicle. Different letters indicate significant differences among means using the Tukey HSD test (p ≤ 0.05).
The average stem-breaking strength ranges from 11.42 to 12.45 kPa (Figure 5c). The highest stem-breaking strength was for the yield level of GY1 and was significantly higher than for GY2, GY3, and GY4. The average stem-breaking strength of GY2, GY3, and GY4 was 8, 6.3, and 8.2% less than GY1, respectively.
The average stalk thickness of the lower part of the main panicle ranges from 15.18 to 18.11 mm. The highest stem thickness was at the yield level of GY3 and the lowest was at GY2 (Figure 5d). The average stem thickness of 107 quinoa genotypes was 16.76 mm. A total of 49 genotypes had a higher stem thickness than the average stem thickness. JQ-02081 has the highest thickness of 25.9 cm. Of 107 genotypes, 16, 10, 15, and 8 genotypes belong to the yield range of GY1, GY2, GY3, and GY4, respectively.
2.5. Plant Height and Aboveground Dry Weight
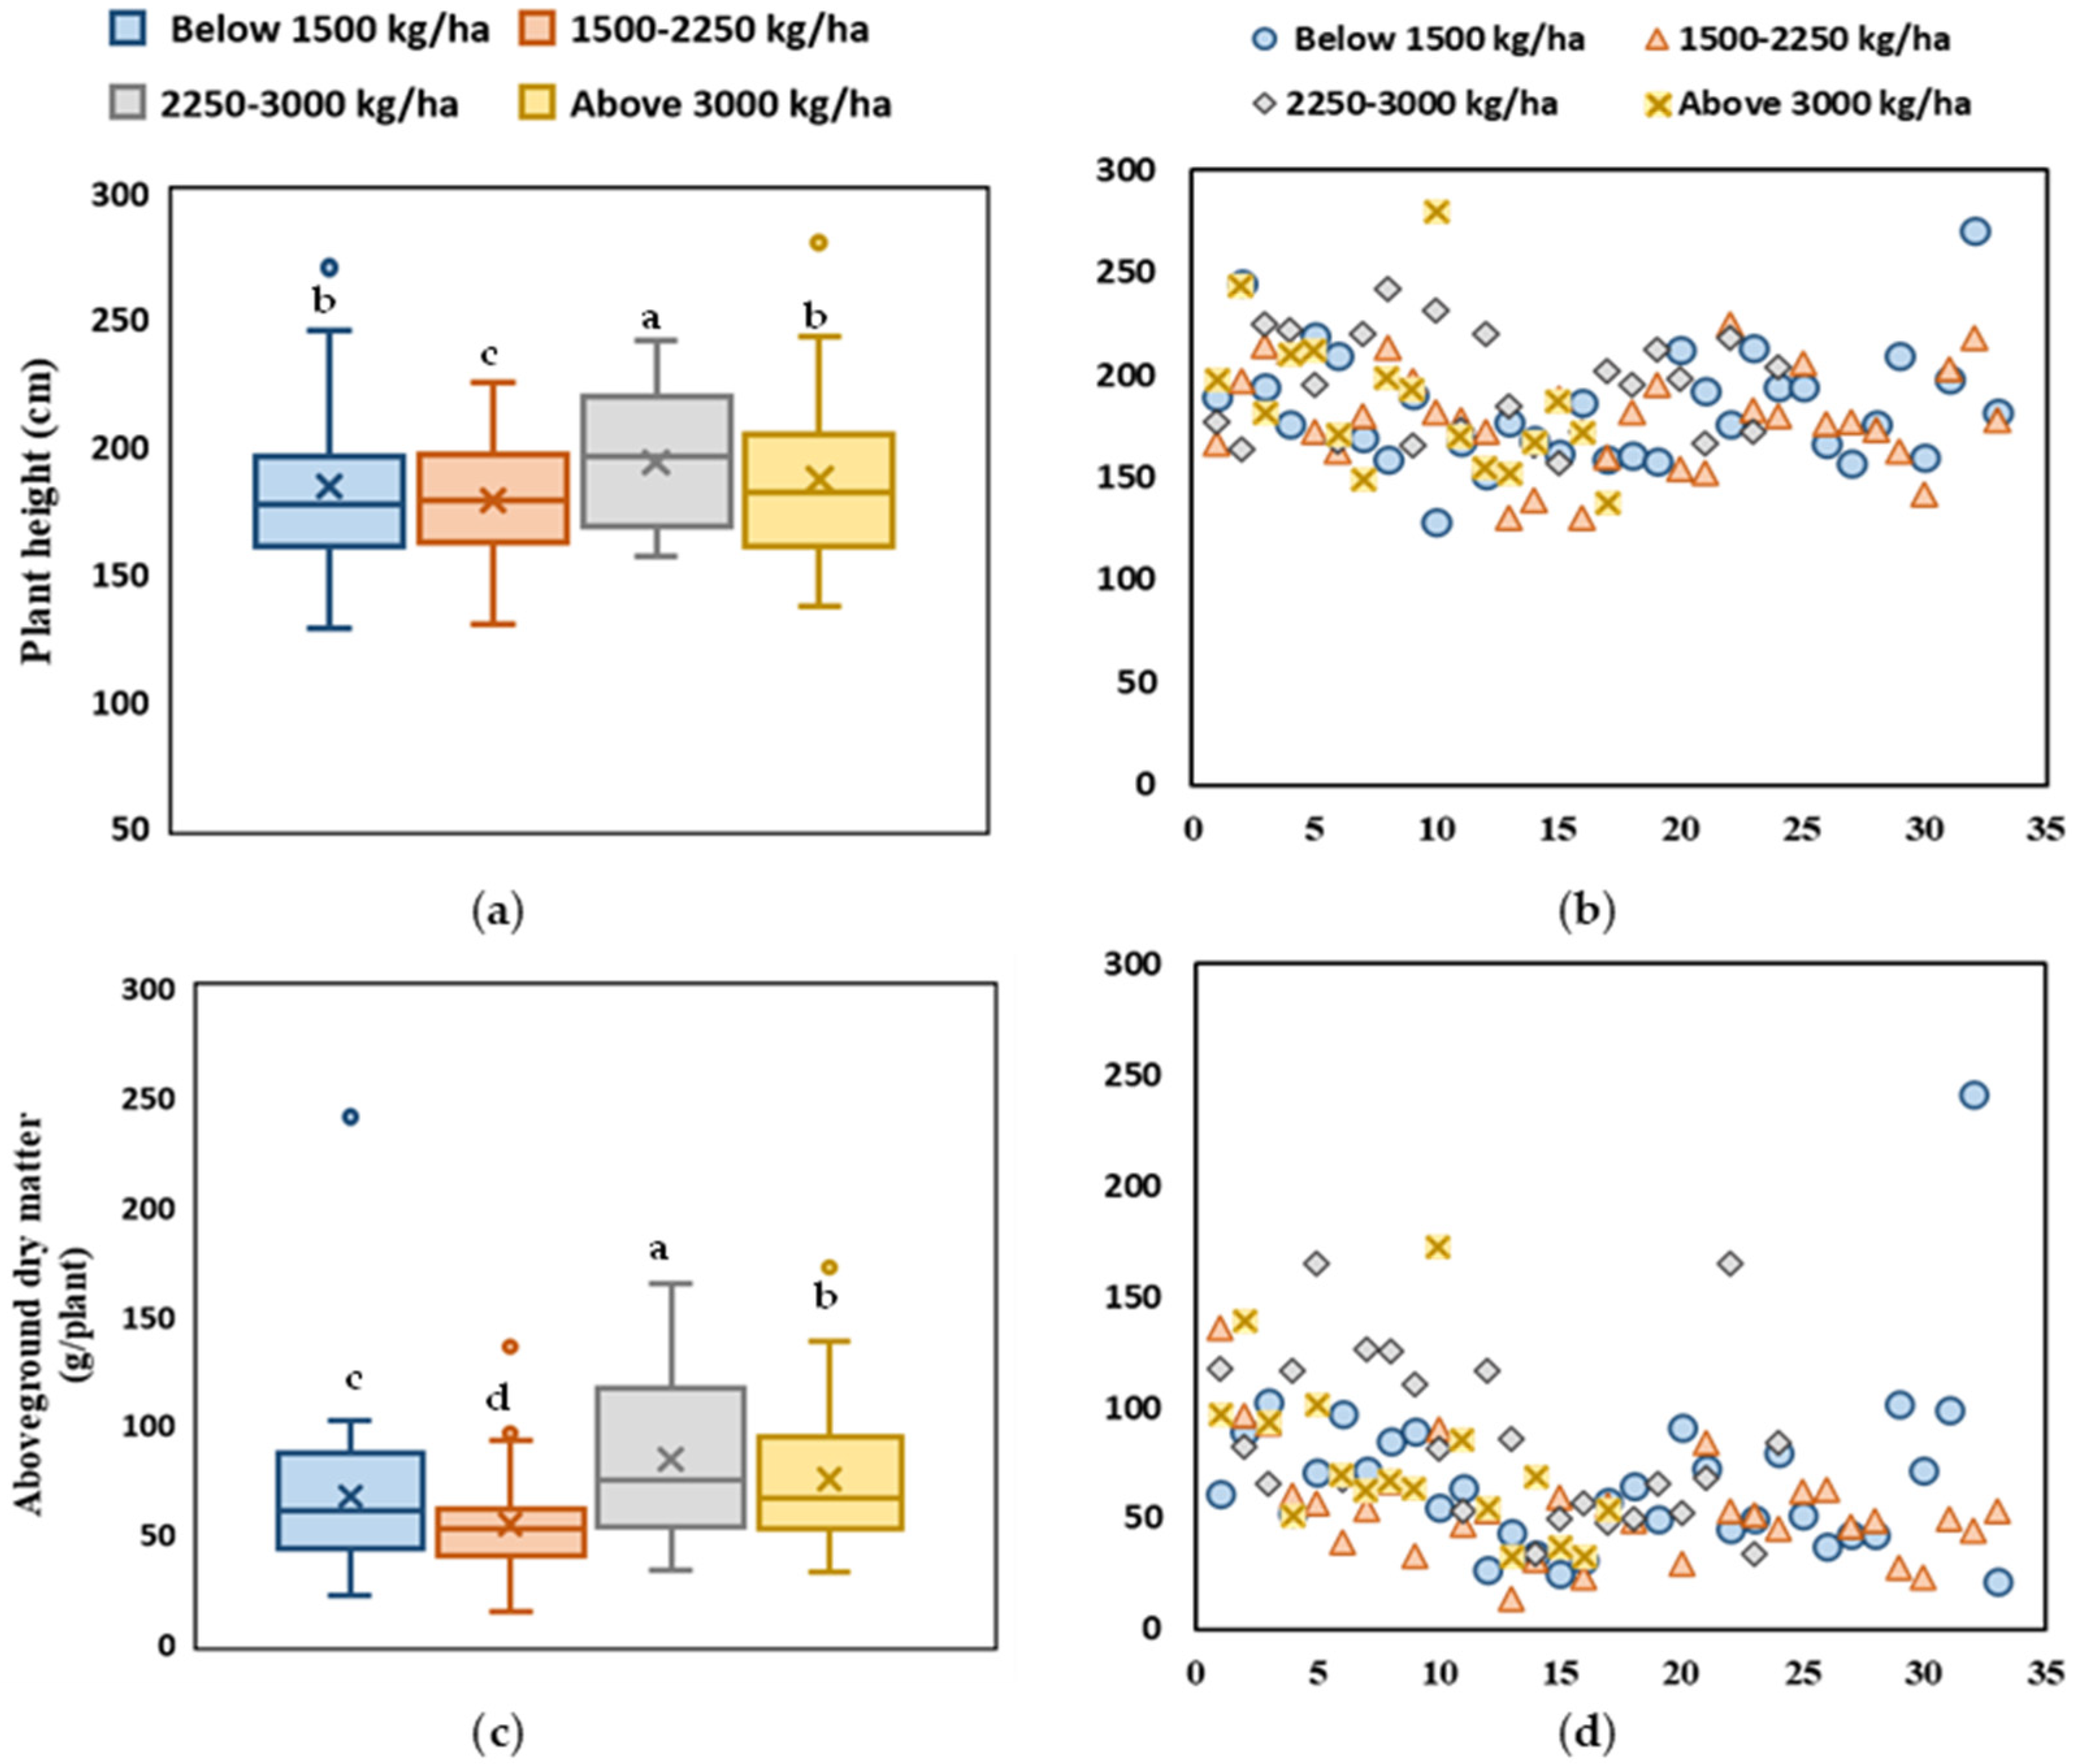
The plant height of all quinoa genotypes ranges from 137.1 to 279.75 cm (Figure 6a). The average plant height was highest at the yield level of GY3 and the lowest was at GY2. The average plant height of 107 quinoa genotypes was 185 cm, and 47 quinoa genotypes had a plant height higher than the average plant height, from which 16, 11, 11, and 9 genotypes belong to the yield range of GY1, GY2, GY3, and GY4, respectively (Figure 6b). When the yield level was above 2250 kg ha−1 (GY3-GY4), there were 20 quinoa genotypes with a lower plant height than the average plant height of 185 cm. The dry matter per plant for quinoa genotypes ranged from 22.27 to 241.31 g (Figure 6). The average dry matter was the lowest at GY2 and highest at GY3 (Figure 6a). The average plant height and dry matter of GY4 were 1.5 and 12% higher than those of GY1, respectively.
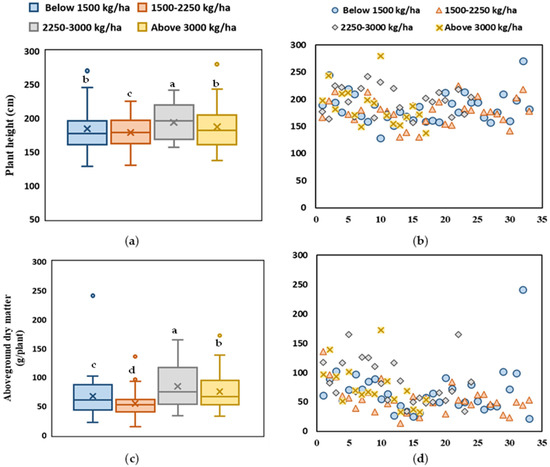
Figure 6.
Differences in plant height (a,b) and aboveground dry weight (c,d) of quinoa genotypes with different yield levels. Different letters indicate significant differences using the Tukey HSD test (p ≤ 0.05).
2.6. Panicle Characteristics
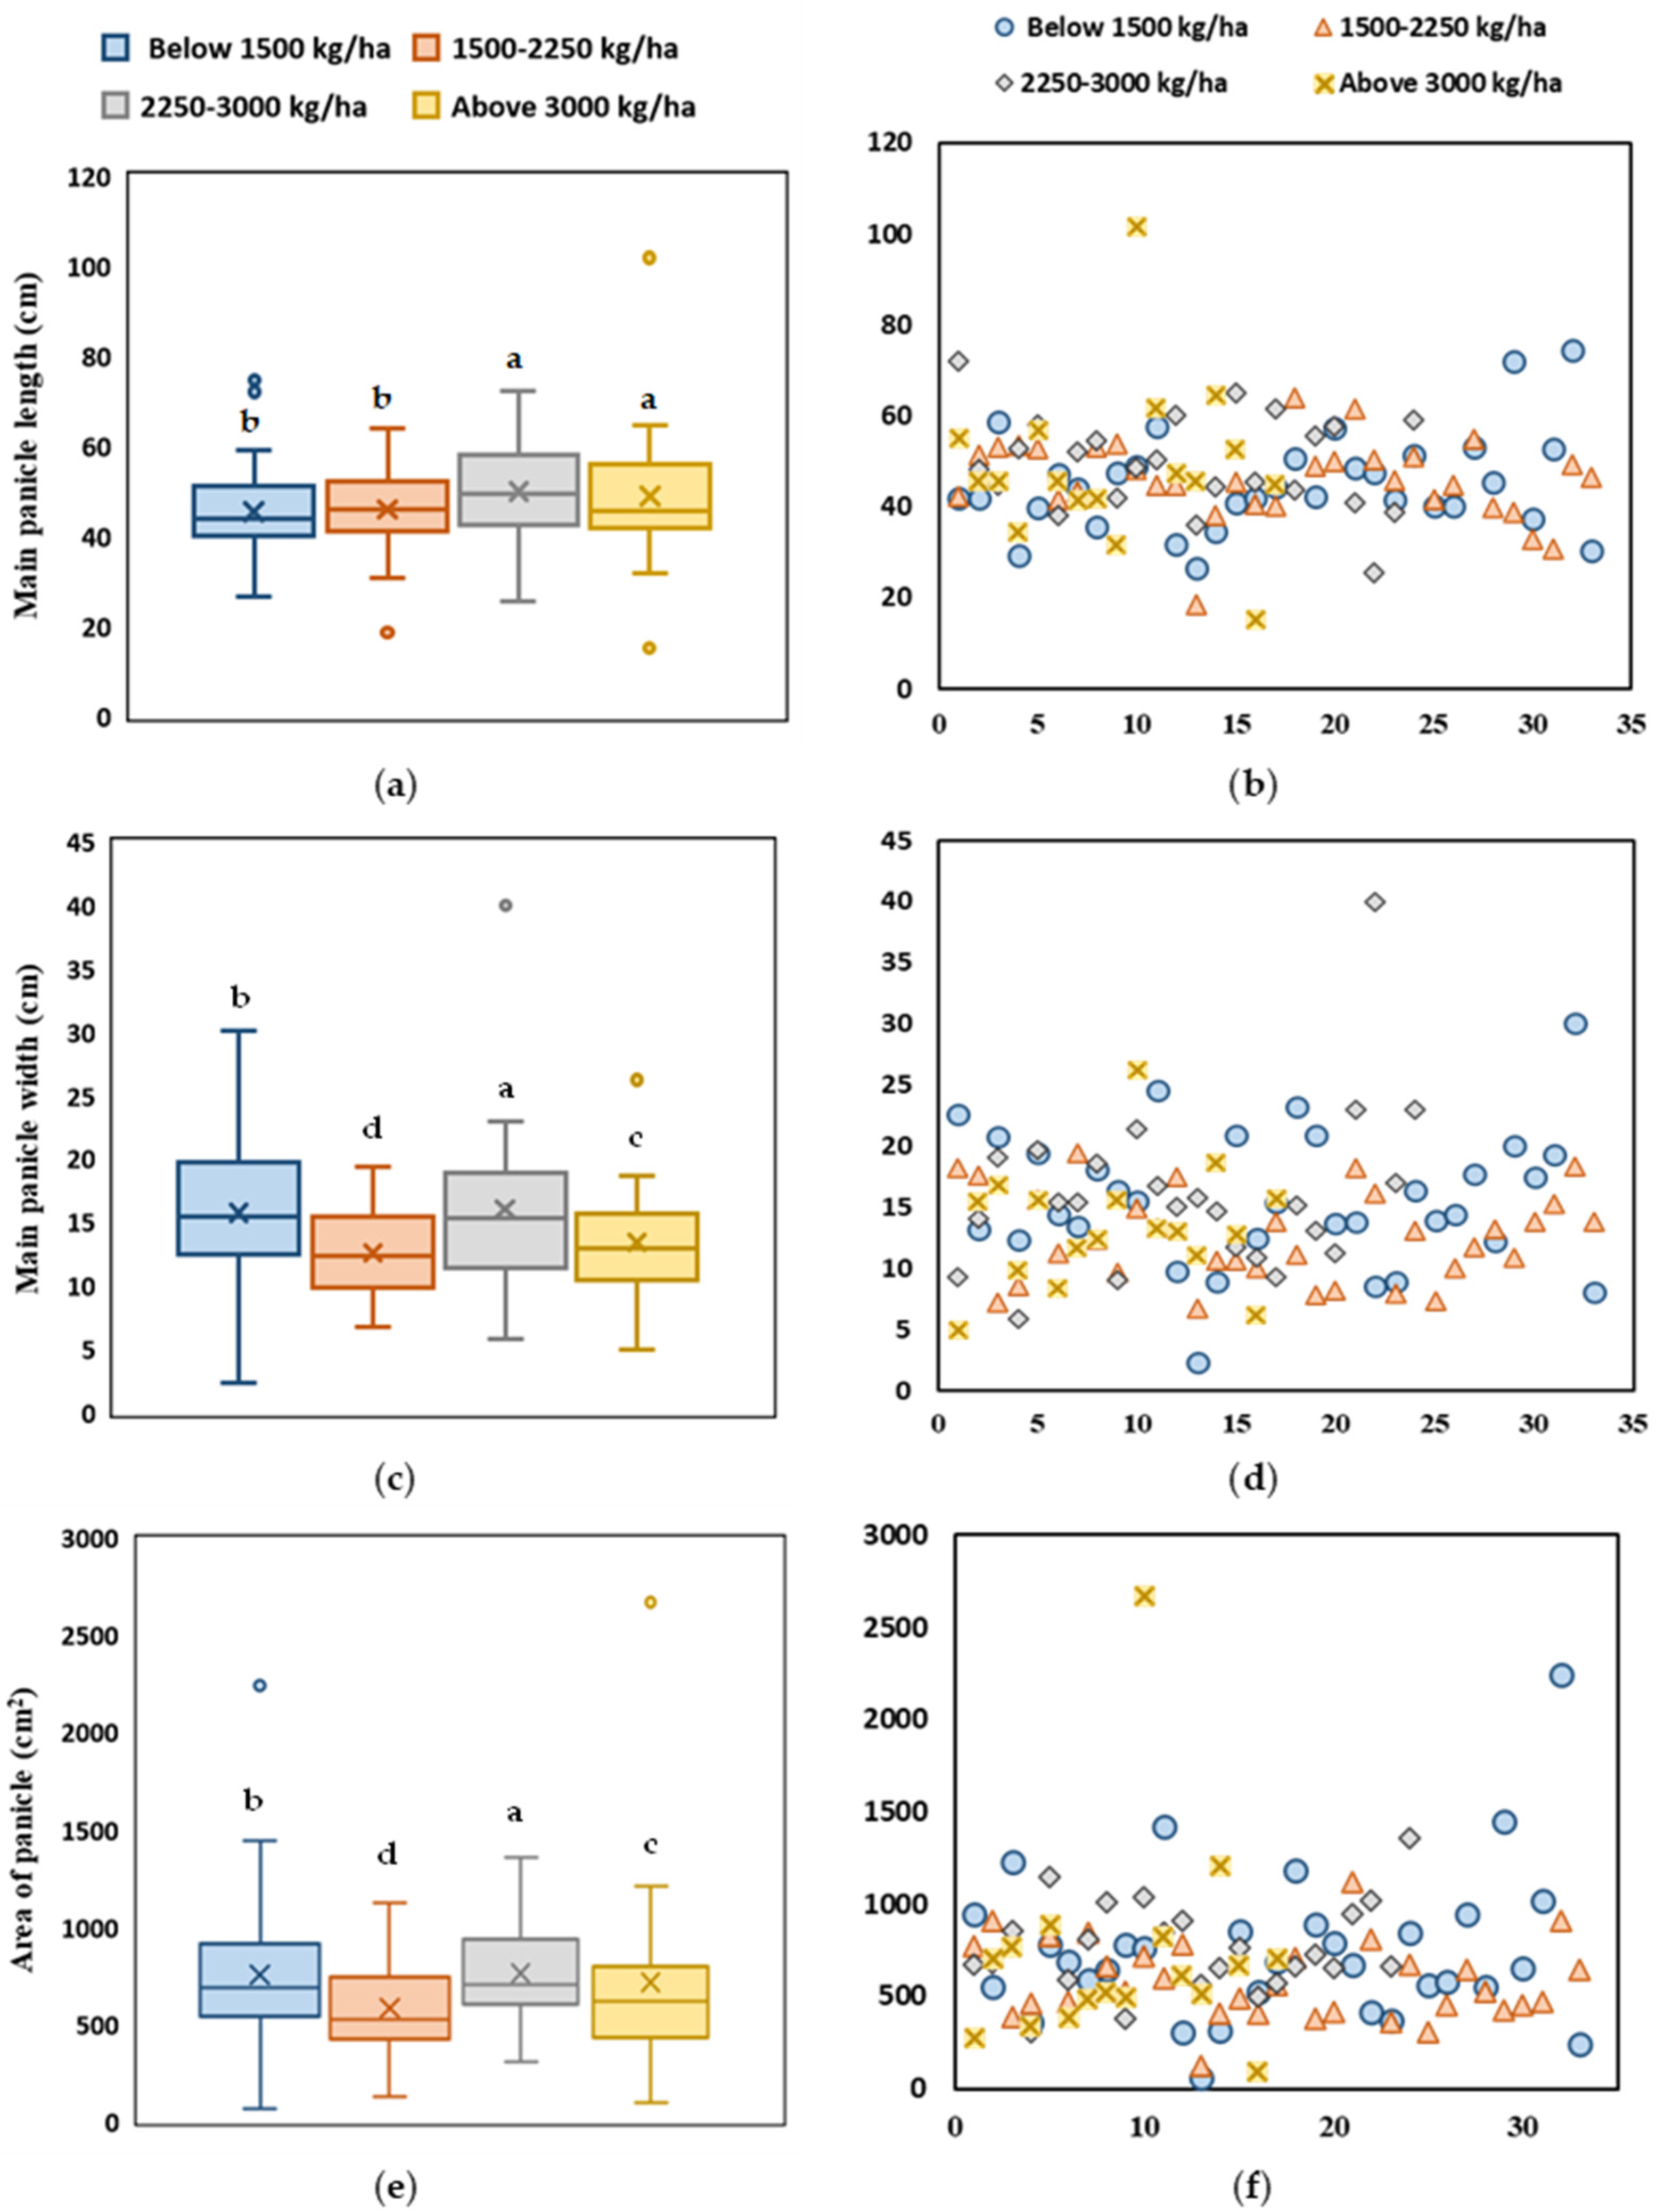
The average panicle length of quinoa genotypes at different yield levels ranged from 45.45 to 49.83 cm, with the highest at the yield level of GY3 and the lowest at the yield range of GY1 and GY2 (Figure 7a,b). The average panicle width ranged from 12.58 to 16.04 cm, with the highest yield for GY3 and the lowest for GY2 (Figure 7c,d). The average main panicle area ranges from 583.0 to 763.5 cm2, with the highest at a yield of GY3 and the lowest at a yield of GY2 (Figure 7e,f). From the 107 quinoa accessions, the main panicle area of 46 genotypes exceeded the average of 704 cm2 which could be suitable for low-altitude areas. Overall, GY4 showed a 7.7% higher average panicle length, while showing a 15% and 5.4% lower panicle width and panicle area, respectively, as compared to GY1 (Figure 7).
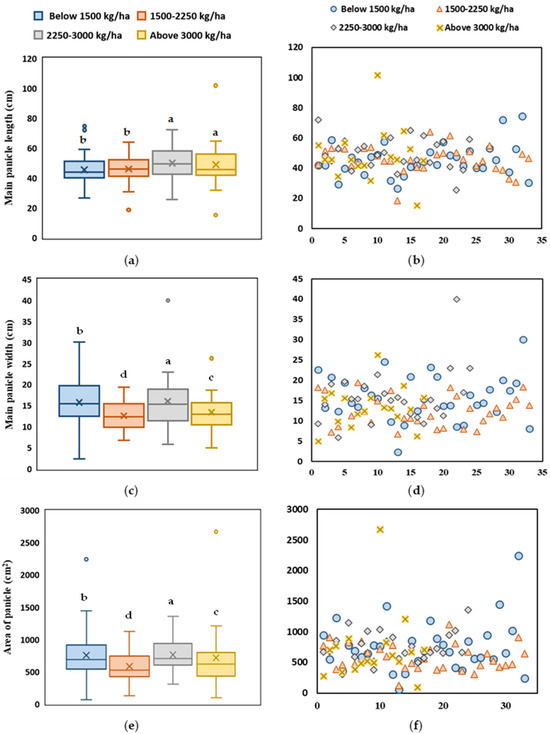
Figure 7.
Differences in length (a,b), width (c,d), and area (e,f) of the main panicle of different quinoa accessions at maturity. Different letters indicate significant differences using the Tukey HSD test (p ≤ 0.05).
2.7. Comprehensive Analysis of Agronomic Characters and 1000-Grain Weight of Quinoa Accessions at Different Yield Levels
At the yield level of GY1, JQ-00694 is the only genotype with a 1000-grain weight of over 2 g and a flowering-to-maturity stage of over 80 days (Table 3). JQ-00972, JQ-00984, and JQ-00988 were accessions with a 1000-grain weight over 2 g and a large root surface area. JQ-00984, JQ-00988, and JQ-01359 had a 1000-grain weight, stalk diameter, panicle area, panicle thickness, and root surface area more than the average values. JQ-00664, JQ-00715, and JQ-00782 were the accessions of quinoa with a 1000-grain weight of over 2 g and a flowering-to-maturity stage of over 80 days at the yield level of GY2.
Table 3.
The traits of quinoa germplasms with a yield below 1500 kg/ha and of 1500–2250 kg/ha.
Among quinoa accessions with a yield level of GY3, five quinoa accessions have a 1000-grain weight of more than 2 g (Table 4). The root surface area of JQ-00136 was larger, the stem thickness of the lower panicle was larger, and the plant height was lower than average. The flowering-to-maturity stage of JQ-00294 lasted for more than 80 days, the root surface area was larger, and the stem thickness of the lower panicle was larger. The root surface area of JQ-00769 was large and the plant height was low. The flowering-to-maturity stage of JQ-01141 was more than 80 days, the root surface area was large, and the plant height was low. JQ-01394 had a larger root surface area, higher panicle thickness, and larger panicle area.
Table 4.
The traits of quinoa germplasms with a yield range of 2250–3000 kg/ha.
Among quinoa accessions with a yield level of GY4, eight quinoa accessions had a 1000-grain weight of more than 2 g and ten genotypes had an anthesis-to-maturity stage of more than 80 days (Table 5). JQ-00084 met all the growth indices, i.e., its anthesis-to-maturity stage lasted more than 80 days and its root surface area, stem thickness of the lower panicle, and area of the main panicle were higher than the average, while the plant height was less than the average. JQ-00315, JQ-00521, JQ-01029, and JQ-01403 met the four agronomic criteria.
Table 5.
Analysis of quinoa resource traits for a yield of above 3000 kg/ha.
2.8. Heatmap Clustering and Correlation
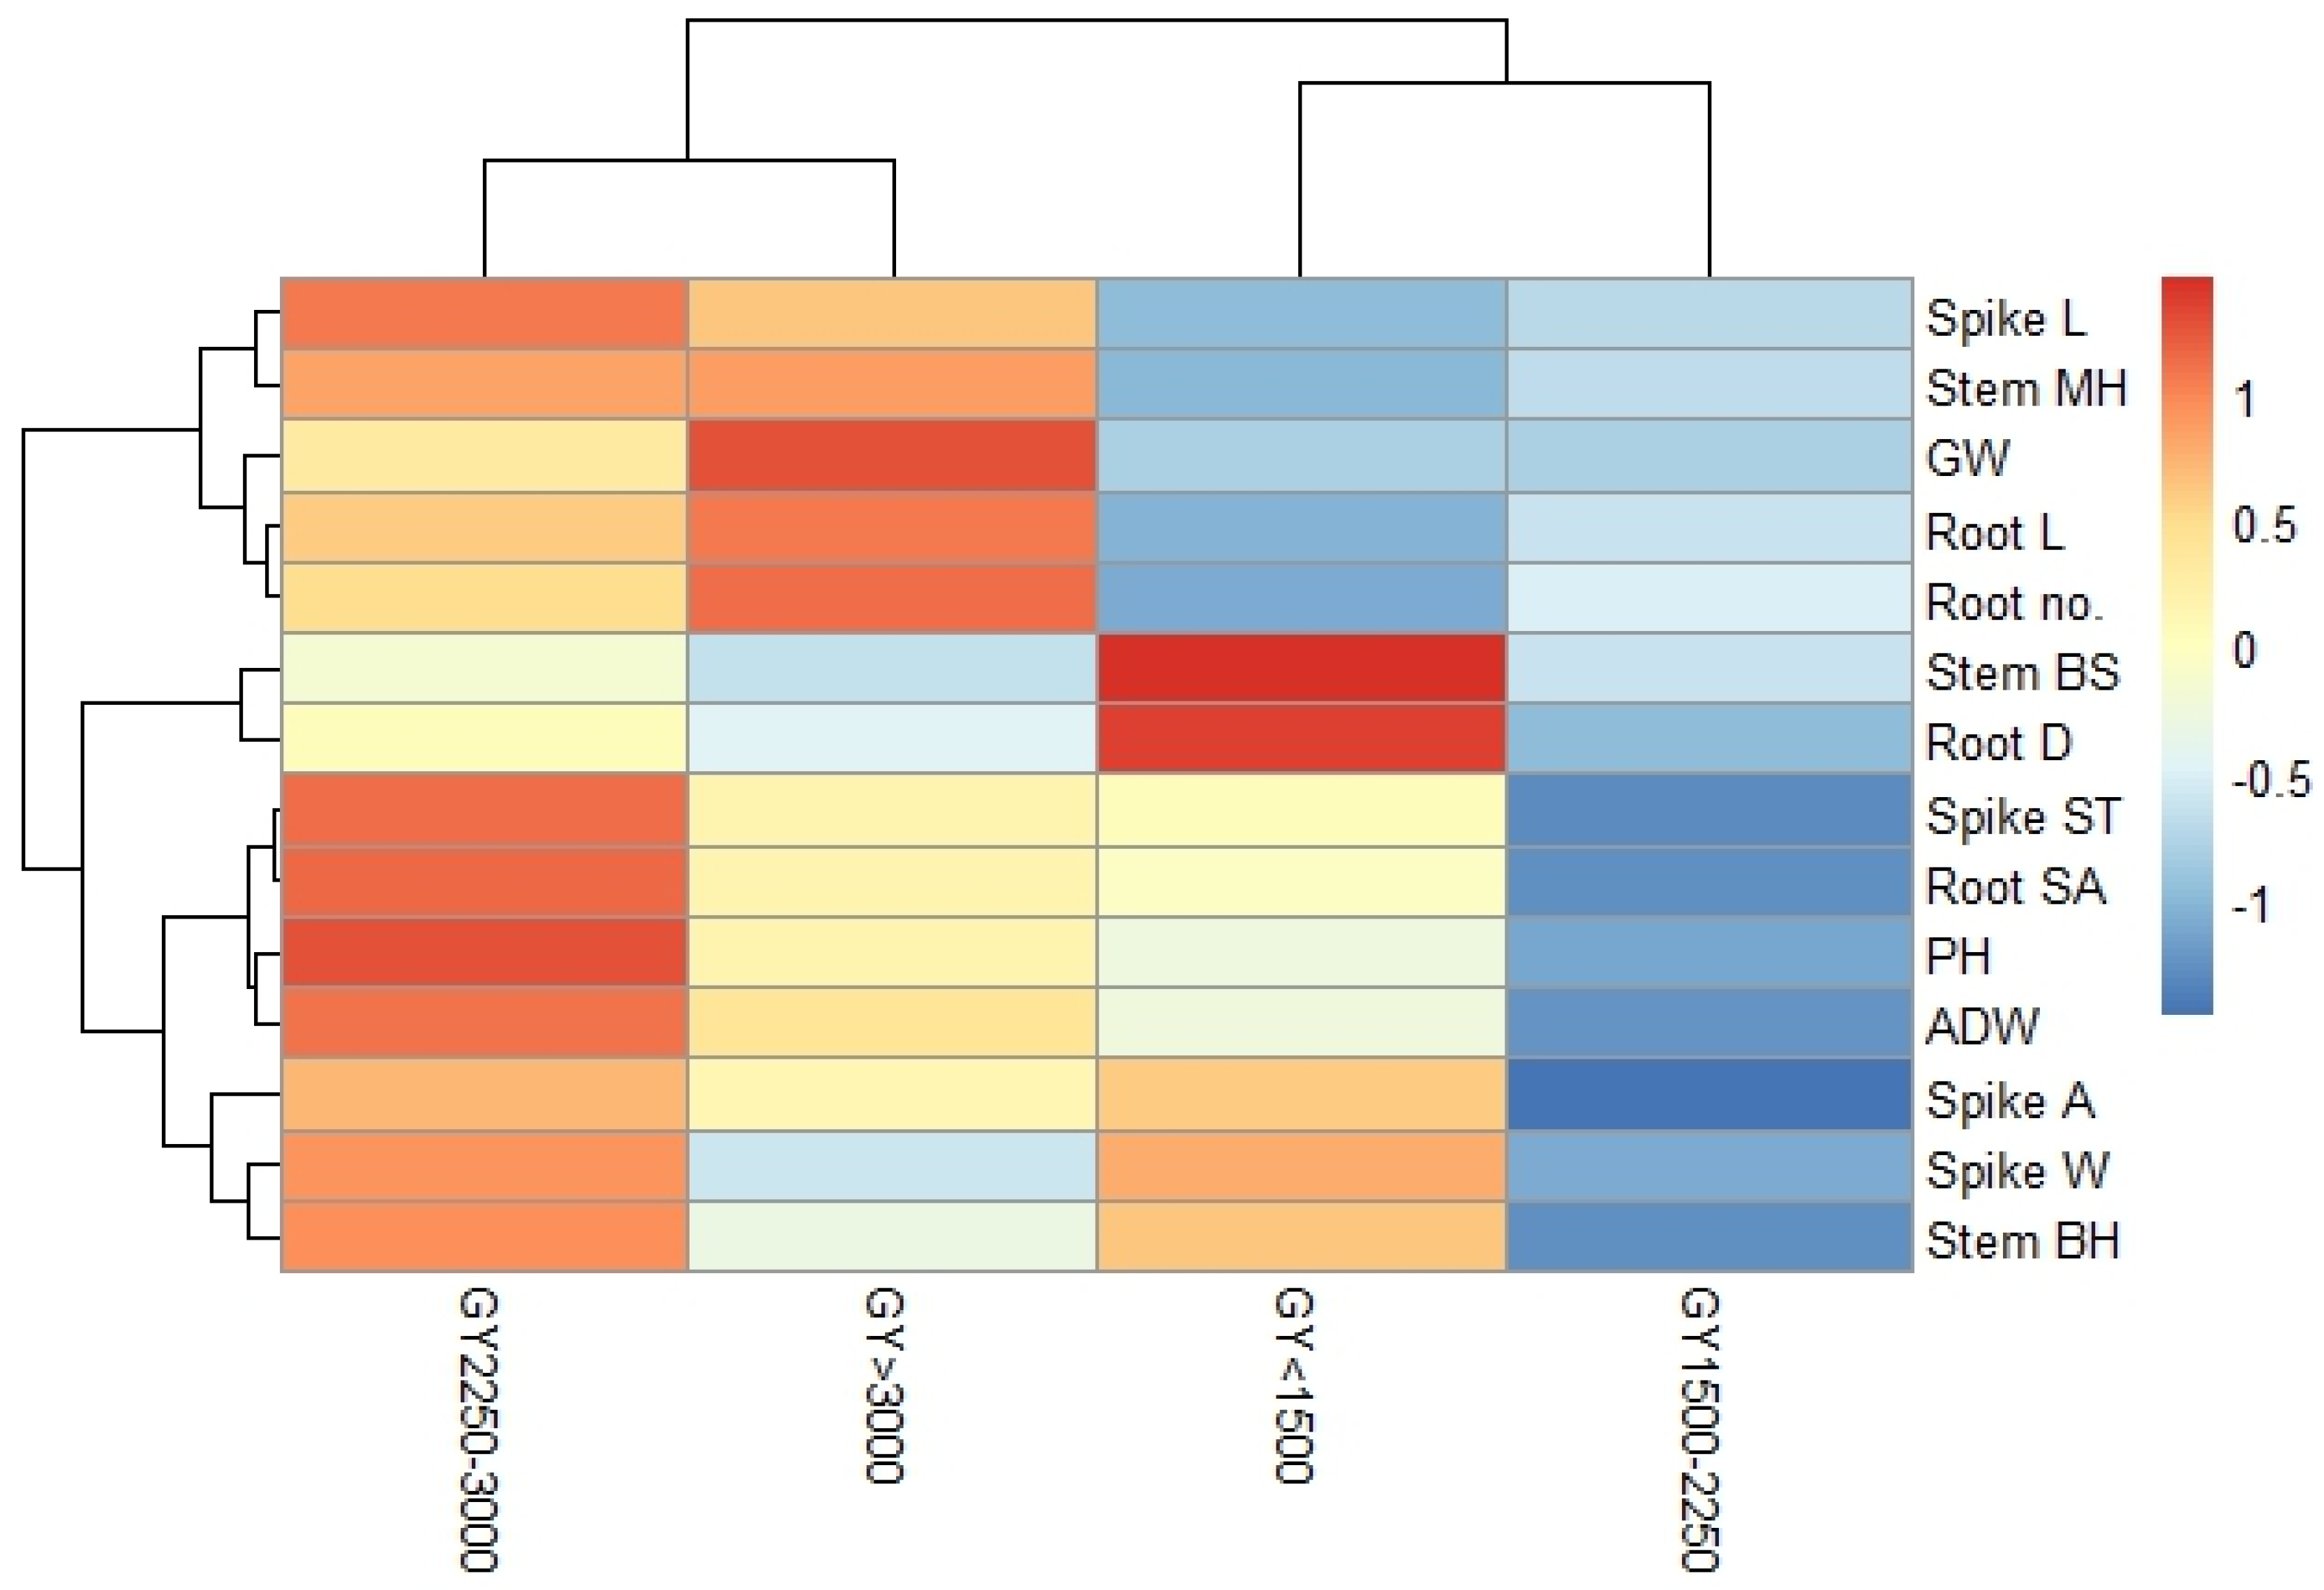
Heatmap clusters and a dendrogram of the traits were drawn for the different yield categories (Figure 8). The dendrogram showed the close clustering of yield groups of GY3 and GY4 and a similar clustering of GY1 with GY2. Among the variables, the panicle length is clustered with stem center hardness, the root length is clustered with the number of root tips, the plant height is clustered with aboveground dry weight, and the panicle weight is clustered with stem base hardness and panicle area. Most of the variables have the lowest values for grain yield categories GY1 and GY2, while grain yield category GY3 showed the highest values.

Figure 8.
The heatmap and dendrogram of the growth, stem hardness, and yield traits of quinoa genotypes are categorized under four yield levels. ADW: aboveground dry weight; GY: grain yield; GW: grain weight; PH: plant height; Root D: root diameter; Root SA: root surface area; Root L: root length; Root no.: number of root tips; Stem BH: stem base hardness; Stem MH: middle stem hardness; Spike L: panicle length; Spike W: panicle width; Spike A: area of panicle; Spike ST: stalk thickness of main panicle; Stem BS: stem breaking strength. Different colors indicate variation among traits by scaling rows (traits).
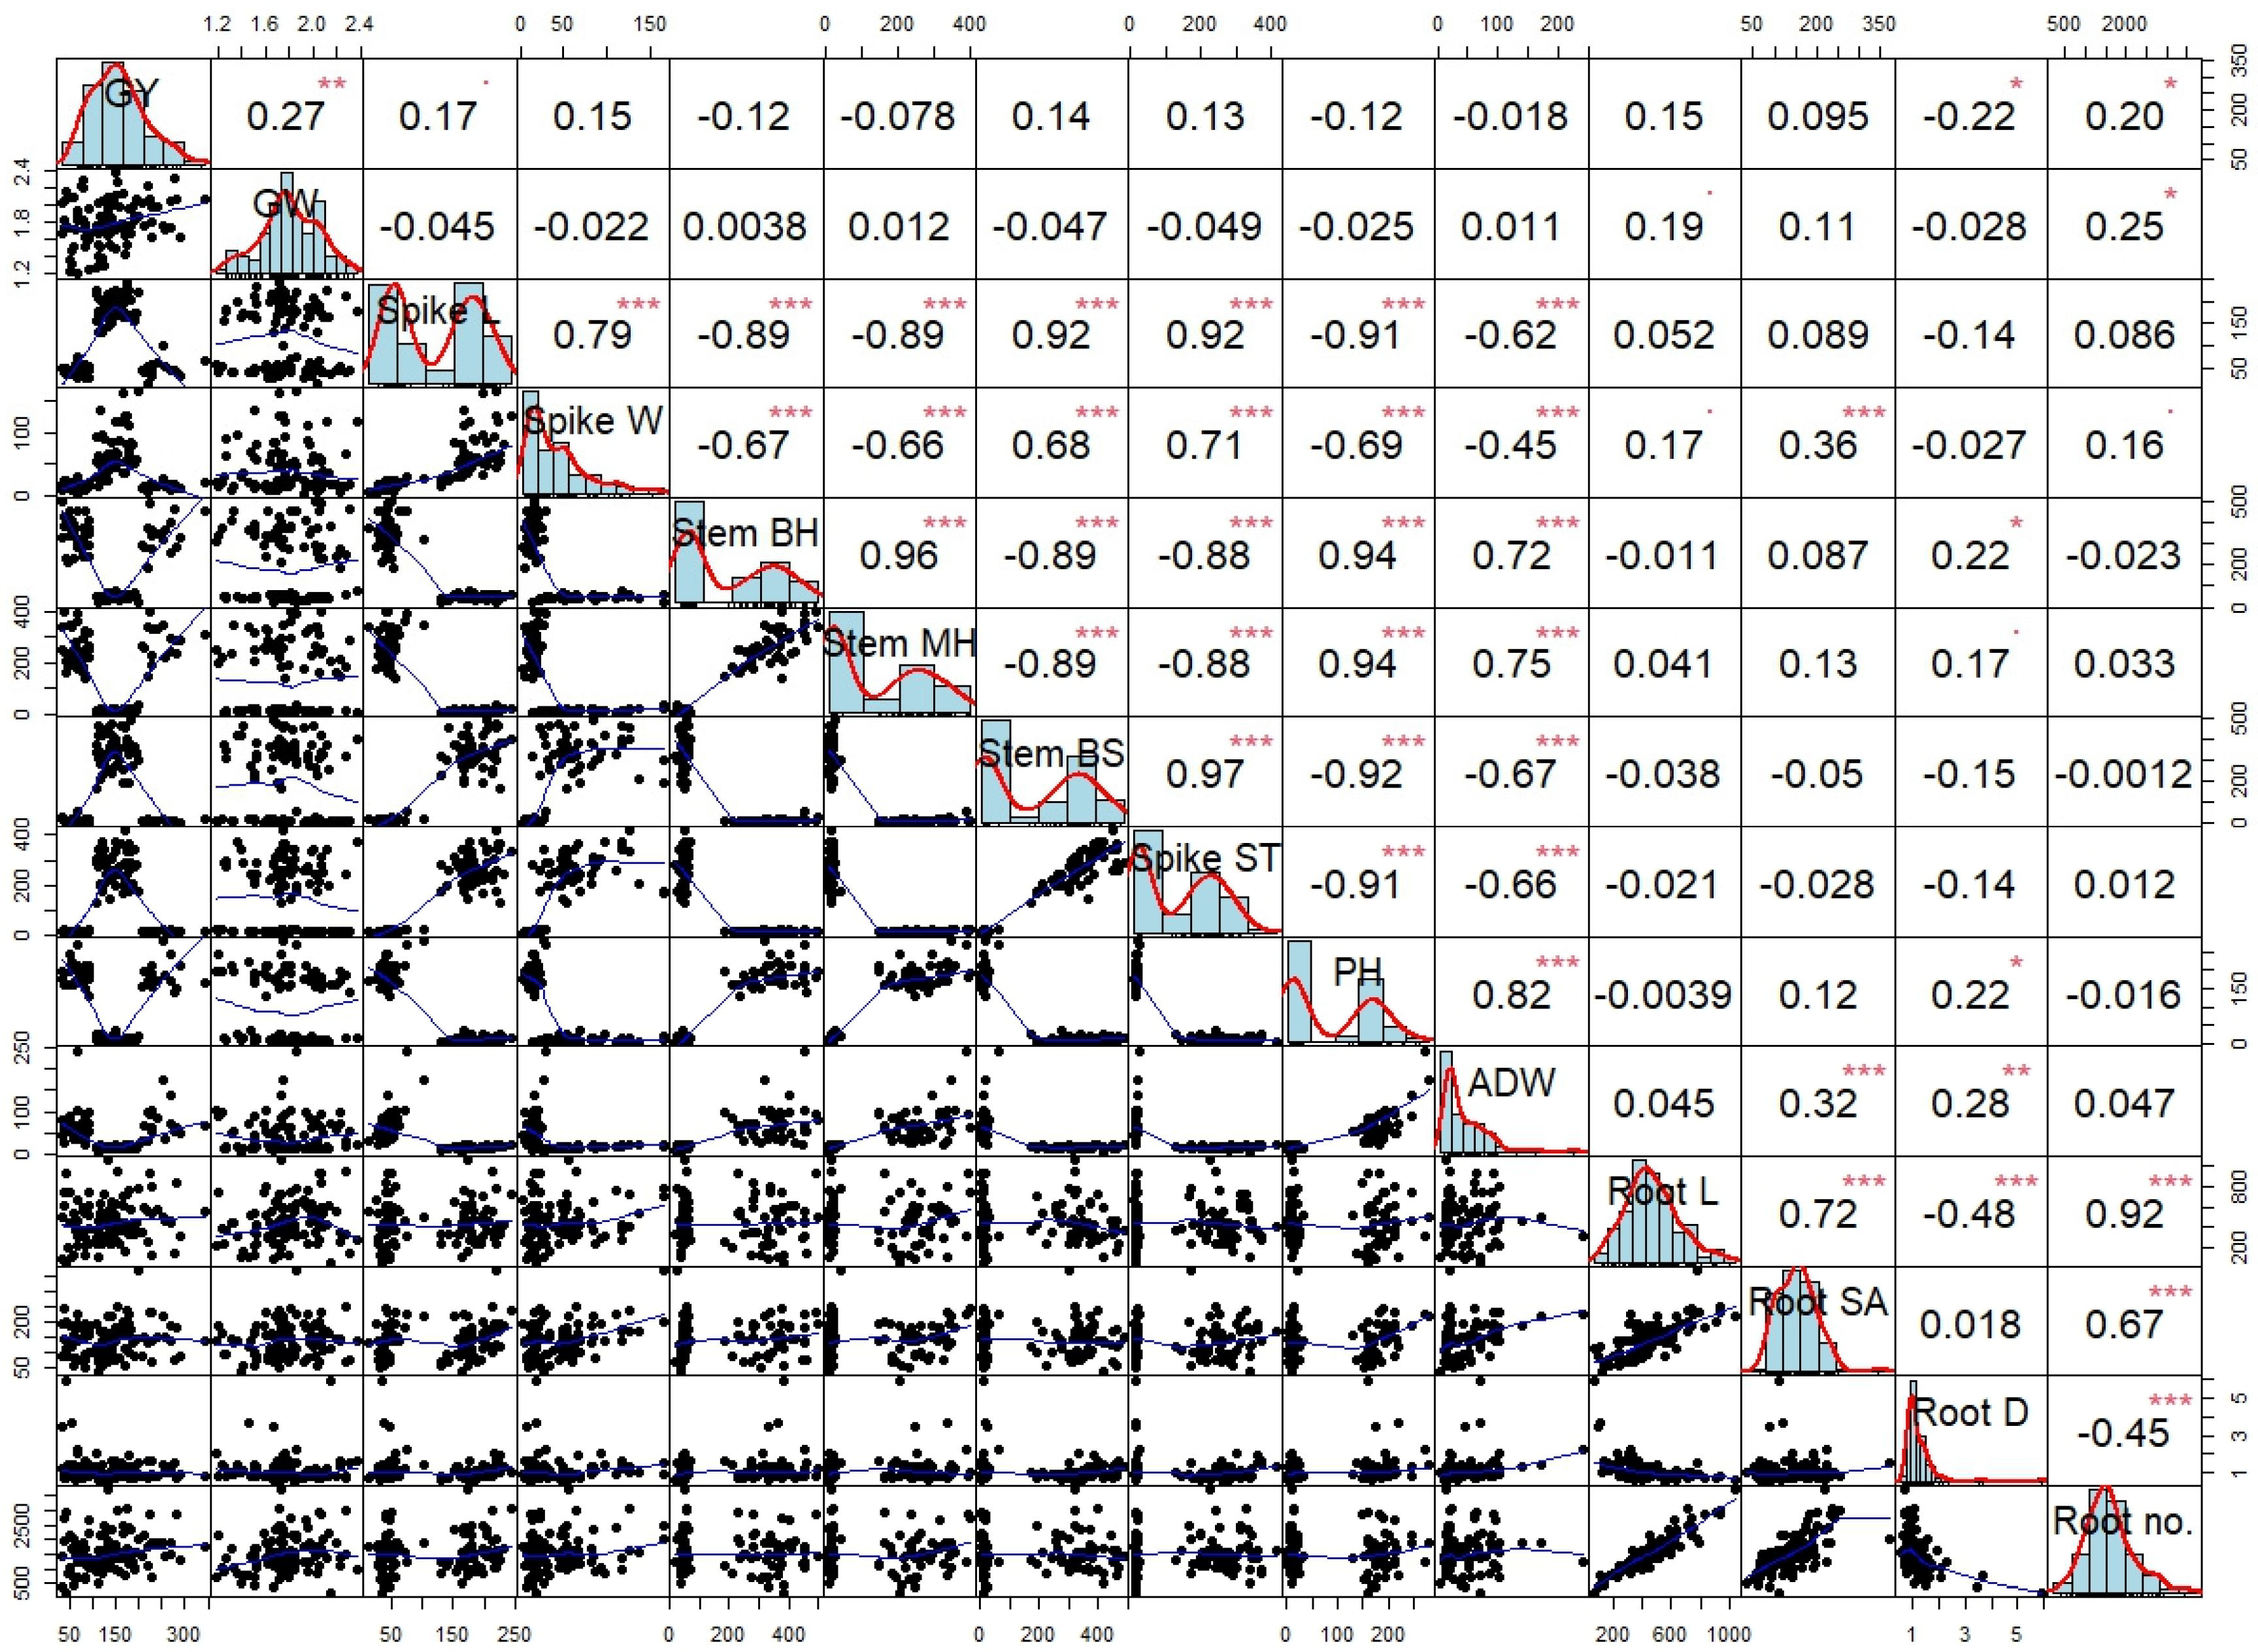
A correlogram was drawn for all studied traits of the 107 quinoa genotypes to determine the relationship among traits (Figure 9). The grain yield showed a positive association with the grain weight, root diameter, and number of root tips. The panicle length and panicle weight were positively associated with stem base hardness, stem center hardness, stem breaking strength, stalk thickness of the main panicle, plant height, and aboveground dry weight. The stem breaking strength was positively associated with stem base hardness, center stem hardness, stalk thickness of the main panicle, plant height, and aboveground dry weight.
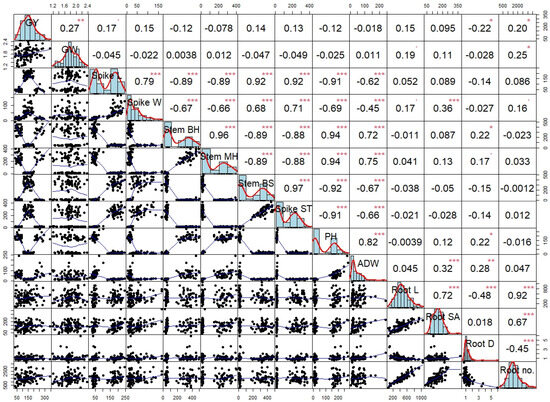
Figure 9.
Correlation matrix of all growth, stem hardness, and yield traits of quinoa germplasms. ADW: aboveground dry weight; GW: grain yield; GW: grain weight; PH: plant height; Root D: root diameter; Root SA: root surface area; Root L: root length; Root no.: number of root tips; Stem BH: stem base hardness; Stem MH: middle stem hardness; Spike L: panicle length; Spike W: panicle width; Spike A: area of the panicle; Spike ST: stalk thickness of main panicle; Stem BS: stem breaking strength. *, **, and *** indicate significance at 0.001, 0.01, and 0.05 probability levels, respectively, by Pearson correlation.
3. Discussion
Agroecological conditions fundamentally influence quinoa yields. Quinoa is well adapted to high-altitude regions in the tropics. However, extending quinoa cultivation to low-altitude areas requires further studies [16,40]. Quinoa genotypes exhibit extraordinary genetic variation, which could be utilized to identify genotypes suitable for low altitudes [41,42]. To assess the potential of quinoa cultivation in lower altitudes and address the specific challenges faced by this crop, a comprehensive screening of 300 quinoa germplasms was conducted. Out of the 300 studied genotypes, 107 successfully produced flowers and seeds at low altitudes. However, 193 accessions did not induce flowering, likely due to quinoa’s specific temperature and day-length requirements [43].
The 107 quinoa genotypes were categorized into four groups: below 1500 kg ha−1 (GY1), 1500–2250 kg ha−1 (GY2), 2250–3000 kg ha−1 (GY3), and above 3000 kg ha−1 (GY4). Significant differences in the yield and 1000-grain weight were observed, with yields ranging from 537.95 to 5132.42 kg ha−1 and 1000-grain weights ranging from 1.19 g to 2.37 g across the categories. Notably, genotype JQ-02068 achieved the highest yield of 5132 kg ha−1 (Figure 1; Table 5). The difference in yield is because of the genotypic differences [44], environmental factors, and agricultural practices [42,45]. El-Sadek [45] identified that the environment could be the primary source of quinoa yield variations, accounting for 88.5% of the total variation. The genotypes that better synchronized their developmental stages with the day length and temperature in altered environments showed higher yields [43].
The highest average 1000-grain weight was recorded in GY4 (1.93 g), followed by GY3 (1.83 g), with GY4 showing a significantly higher grain weight than the other yield categories (Figure 1c). The higher grain weight indicated that these genotypes maintained physiological activity and photosynthesis post-anthesis, with delayed flag leaf senescence promoting assimilate synthesis and increasing grain weights [40,46].
The study also explored phenological and agronomic traits of quinoa linked with the yield. At low altitudes, quinoa genotypes exhibit variations in growth durations. Across all 107 genotypes, the total growth cycle ranges from 136 to 143 days. Similar variations have been observed in quinoa genotypes at different altitude gradients [47].
Comparative studies in other regions have revealed site-specific and genotypic variations in growth duration. For example, quinoa accessions in southern Algeria exhibited significant variations in total growth durations across two sites among five varieties, ranging from 136 to 164 days [48]. These variations are likely attributed to temperature differences influenced by altitude, emphasizing the impact of environmental conditions on crop development [48,49]. Similarly, in South America, the quinoa growth duration ranges from 110 to 190 days [50], while in northern Europe, it ranges from 109 to 182 days [51], and in northern India, it ranges from 109 to 163 days [52]. These differences underscore quinoa’s adaptability to diverse climatic conditions and geographical areas.
Among the 107 genotypes, the growth duration ranged from 136 to 143 days. Seven genotypes, all in the GY1 category, had the shortest growth duration of 136 days. In contrast, 10 accessions (2, 7, and 1 belonging to GY2, GY3, and GY4, respectively) had longer growth durations. The average across yield categories showed that GY1 had the shortest growth period (137.8 days), while GY2-GY4 required longer growth periods (140.29–141.54 days) (Table 1). The genotypes with a higher grain yield showed earlier onset of emergence and branching stages and a longer duration from flowering to maturity. This suggests a connection between yield and growth duration, with lower-yielding genotypes having shorter growth durations, while longer grain filling durations (anthesis to maturity) significantly improved the yield [8]. A higher yield with a longer growth time is linked to a higher accumulated temperature.
The accumulated temperature, or growing degree days, was measured across different growth stages for quinoa genotypes. The accumulated temperature during the whole growth period ranged from 2962 to 3003 °C among the 107 genotypes. Notably, the GY3 genotypes achieved the highest accumulated temperature of about 3000 °C followed by GY4. The highest accumulated temperature for GY3 is due to the longest total growth duration, particularly from heading to flowering and flowering to maturity. GY2, GY3, and GY4 genotypes had significantly higher accumulated temperatures than GY1. This underscores the substantial impact of temperature on yield and highlights significant temperature variations among genotypes [53]. The accumulated temperature for quinoa resources with more than 80 days from flowering to maturity ranged from 1844 to 2096 °C (Figure 3). The difference in the accumulated temperature in the ear development-to-maturity stage could affect yield levels. Previous studies showed that the optimum accumulated temperature is required during the growth period at low altitudes [54]. In regions with sufficient heat resources, using cultivars with longer growth durations can significantly enhance yield [54,55].
The study also examined root characteristics, stem hardness, plant height, aboveground dry weight, panicle characteristics, and their relationship with yield levels. Variations in these traits were observed among quinoa accessions with different yield levels, providing insights into factors contributing to successful quinoa cultivation at low altitudes. Plant height and aboveground dry weight exhibited variations among genotypes and yield categories, with the plant height ranging from 137.1 to 279.75 cm across 107 genotypes, averaging 185.9 cm (Figure 6a,b). The highest average height was observed in the GY3 yield category, followed by GY4, indicating that a plant height exceeding 186.9 cm is not conducive to a higher grain yield. Hafeez et al. [10] reported that a medium plant height favors a high grain yield. The present study revealed the same trend for aboveground dry weight, with the lowest for GY2 and the highest for the GY3 category (Figure 6c,d). The positive association between plant height and aboveground dry weight indicates parallel increases [40,56]. These variations in plant height and biomass align with existing studies and underscore the influence of genotype plasticity and altitude on these traits [44,57,58].
The genotypes in GY3 and GY4 exhibited a higher plant height and aboveground weight compared to GY1 and GY2, confirming that taller plants often have the potential to yield more grains [14,38]. Research has indicated that there exists an optimal plant height for each crop variety, beyond which further increases in height may not proportionally enhance grain yields [10]. The plant height and aboveground weight of the GY3 and GY4 genotypes surpassed those of GY1 and GY2, highlighting the positive impact of biomass production [44]. GY3 demonstrated a greater plant height and aboveground weight than GY4, suggesting that GY3 genotypes allocate more resources to stem and leaf growth rather than grain development [40,44,59].
Root characteristics, including length, surface area, diameter, and the number of roots, exhibited significant variations across different yield categories (Figure 4). The average and median values of root length and the number of root tips for genotypes in GY4 were the highest. This indicates that higher root growth in genotypes with a GY4 yield improved yields. Meanwhile, the aboveground traits, i.e., plant length and biomass, of genotypes with yields of GY3 and GY4 were higher than in genotypes with yields of GY1 and GY2. This suggests that the high-yielding genotypes produce more biomass and have a longer root length to utilize resources efficiently for yield production [40,44].
Stem attributes, including stem hardness at the base and middle of the stem, stem breaking strength, and stalk thickness of the main panicle, also varied with yield levels. Stem hardness is a crucial factor that indicates the resistance of the stem’s outer surface to deformation, puncturing, and damage caused by mechanical injuries or pests [35]. The higher stem hardness of GY3 and GY4 favored the formation of high yields [40]. The stalk thickness of the main panicle was also greater for GY3 and GY4. Additionally, the stem breaking strength was higher in GY1 genotypes compared to those with a yield exceeding 1500 kg ha−1 (G2–G4) (Figure 5). The breaking force of the stem reflects the plant’s ability to support its weight and withstand environmental stresses [34]. Previous studies have noted significant variations in culm strength and plant height per stem weight between lodging-tolerant and susceptible varieties [60,61]. Thicker stems and higher stem hardness are structural characteristics that may contribute to increased yield stability and resistance to lodging [40,62,63].
The non-significant association of grain yield with stem hardness traits (Figure 9) indicates that stem hardness traits with a high fiber content in the quinoa plant might not be conducive to the formation of grains [21]. Sometimes, low-fiber and high-biomass quinoa is preferable for use as a fodder crop [64]. The contrast in culm hardness values suggests that lodging-tolerant genotypes possess a structural advantage, which could contribute to their ability to withstand lodging, especially during the crucial stages of pre-harvest and crop maturity. Furthermore, the variations in plant height per stem weight may also play a role in lodging resistance [65].
A heatmap clustering analysis revealed that certain traits clustered together, such as panicle length with stem middle hardness, plant height, and aboveground dry weight (Figure 8). The study also depicted correlations among traits, such as the positive association of grain yield with the grain weight and number of root tips, and grain weight with the number of root tips (Figure 9). The dendrogram of phenotypic traits showed a clear clustering of grain yield in GY3 with GY4 and GY1 with GY2, indicating differential phenotypic traits among genotypes with varying yields (Figure 8). Previous studies have reported clear segregation of phenotypic traits in lowland and highland quinoa genotypes, highlighting genotypic differences [11] and also variations in genotypes in lowland areas [40]. Most of the studied phenotypic traits, including panicle length, panicle width, panicle stem thickness, root surface area, plant height, and aboveground dry weight, were the highest for the group with GY3 yields. Eight genotypes from this group showed at least four traits higher than the average value of all genotypes (Table 4). From GY4, four genotypes exhibited at least four traits higher than the average value of all genotypes, with JQ-00084 meeting all six criteria (Table 5). These genotypes could be further explored to confirm their potential for high yields in low-altitude areas. In summary, this study provides comprehensive insights into the performance of quinoa genotypes across various yield categories and their associated traits. These findings contribute valuable knowledge to understanding quinoa’s adaptability and productivity in low-altitude areas, as well as informing future breeding and cultivation strategies. In future, the screened accessions should be further analyzed.
4. Materials and Methods
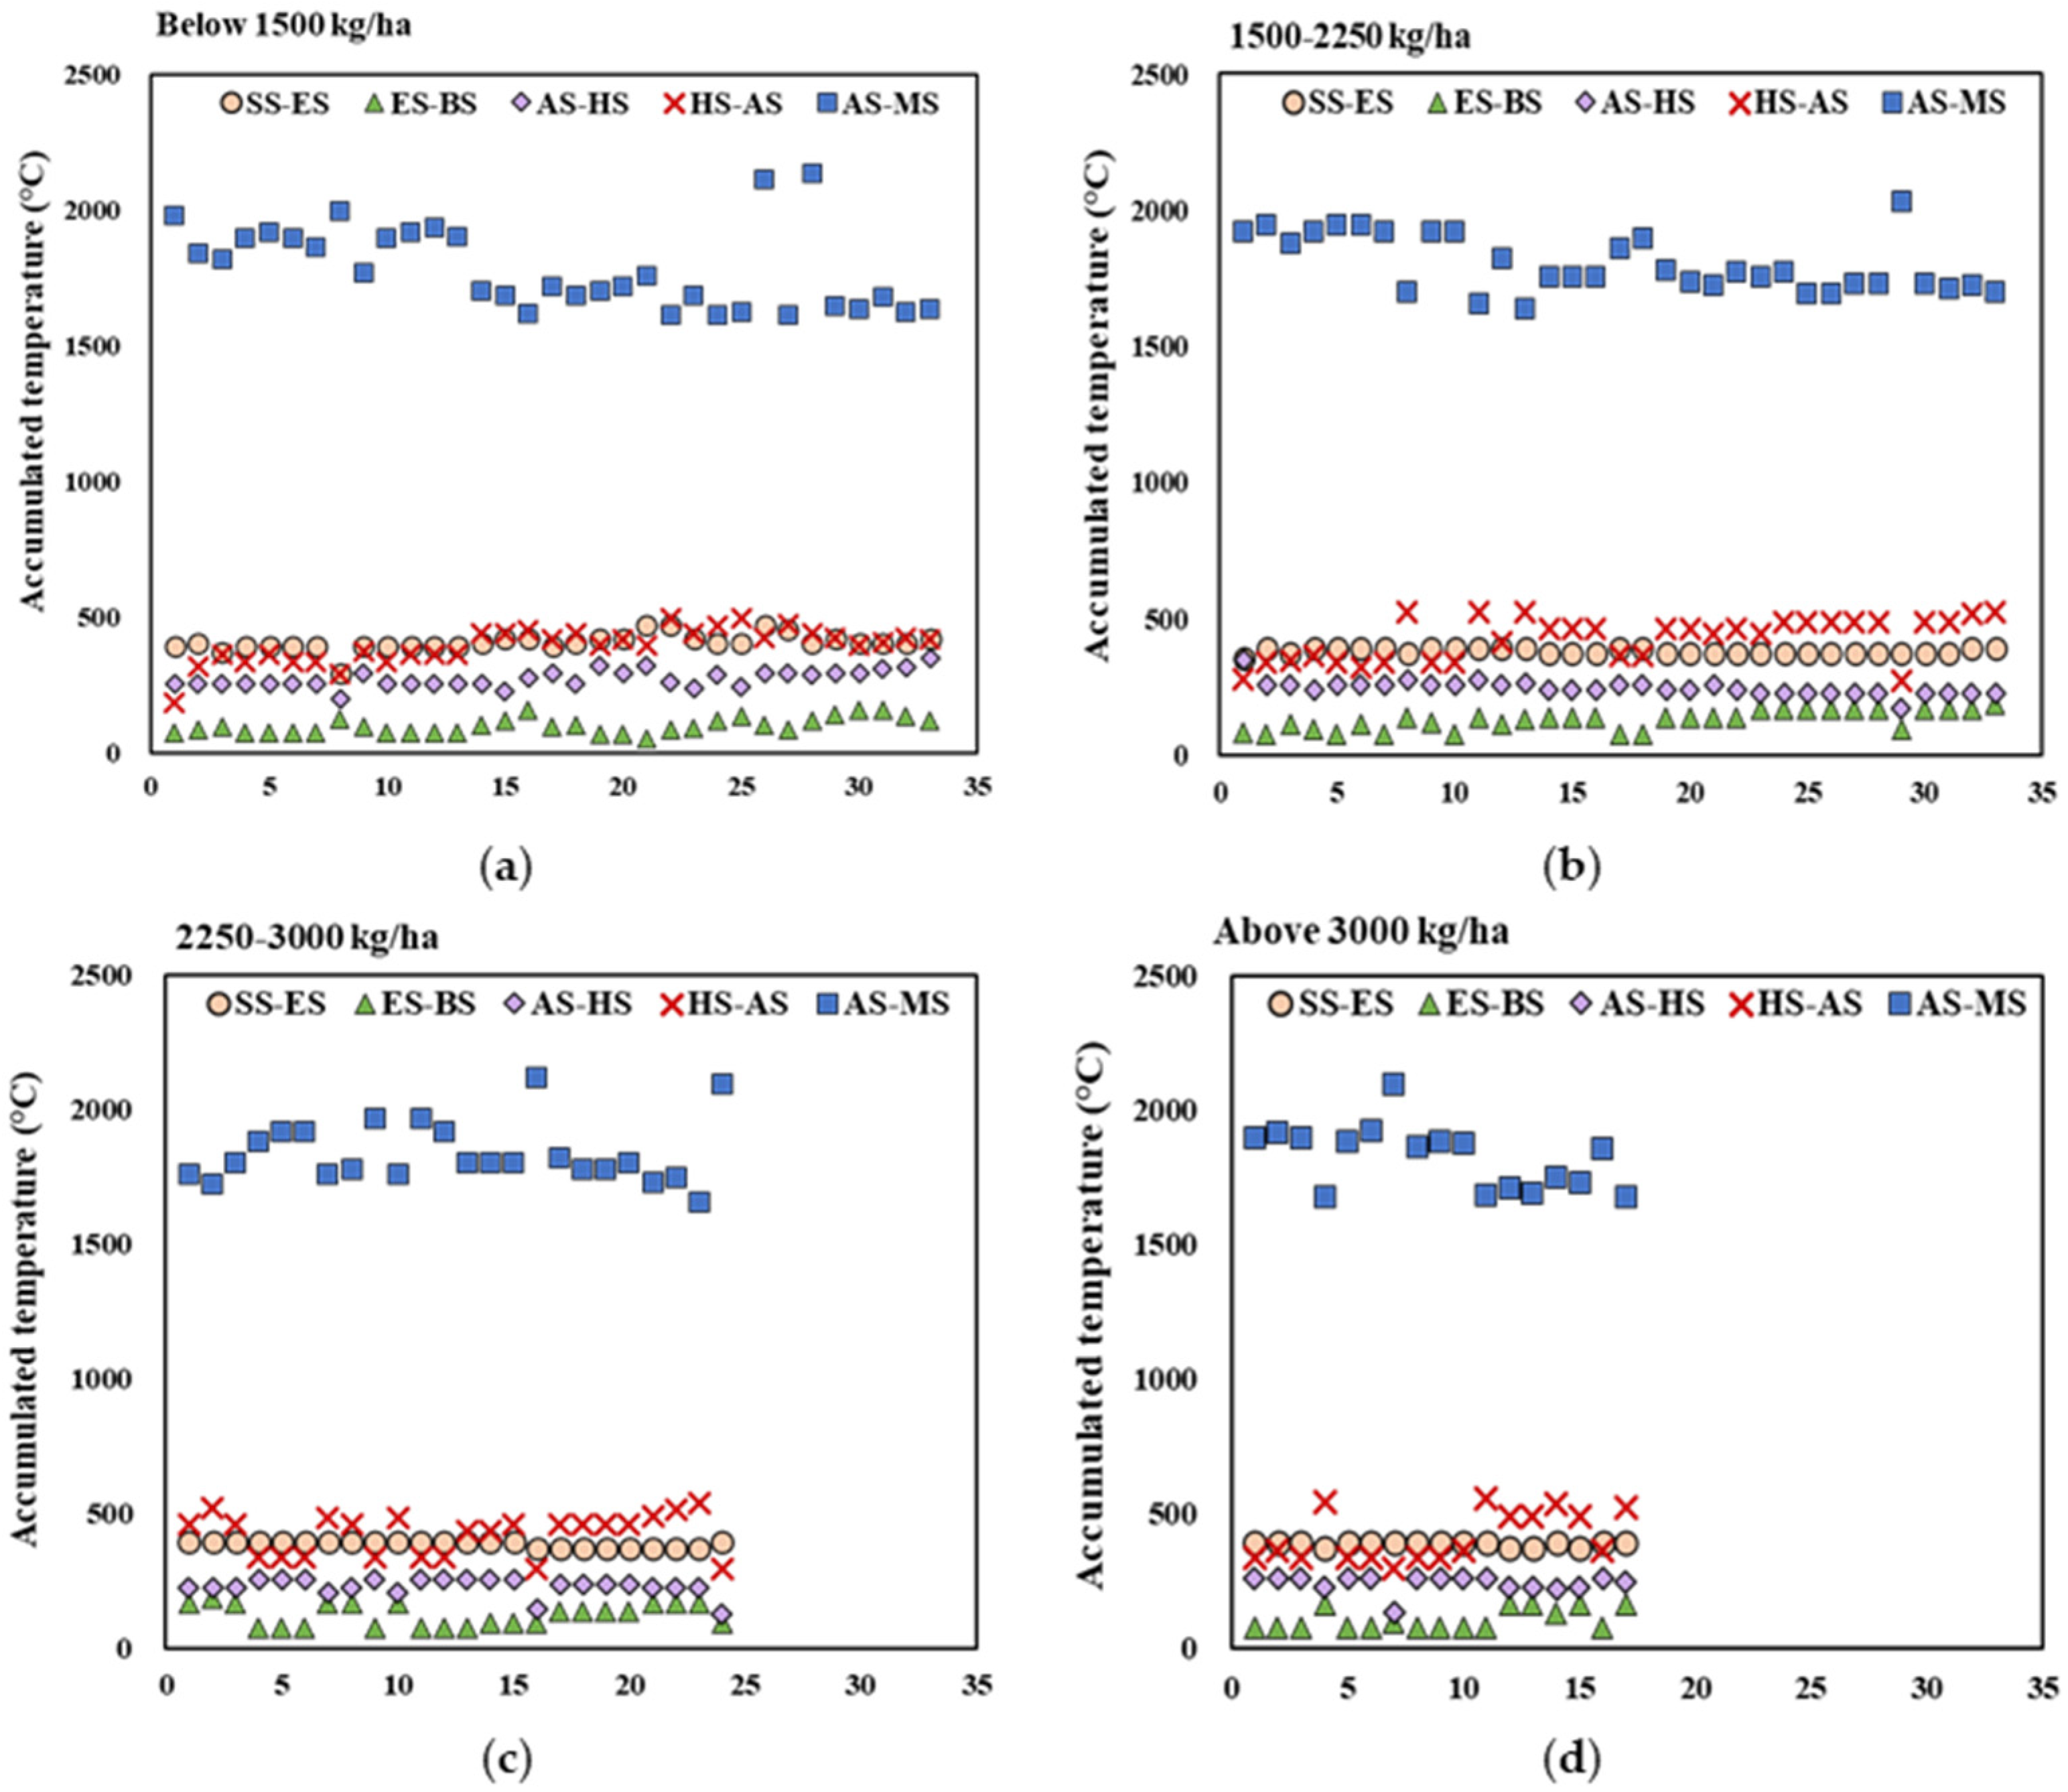
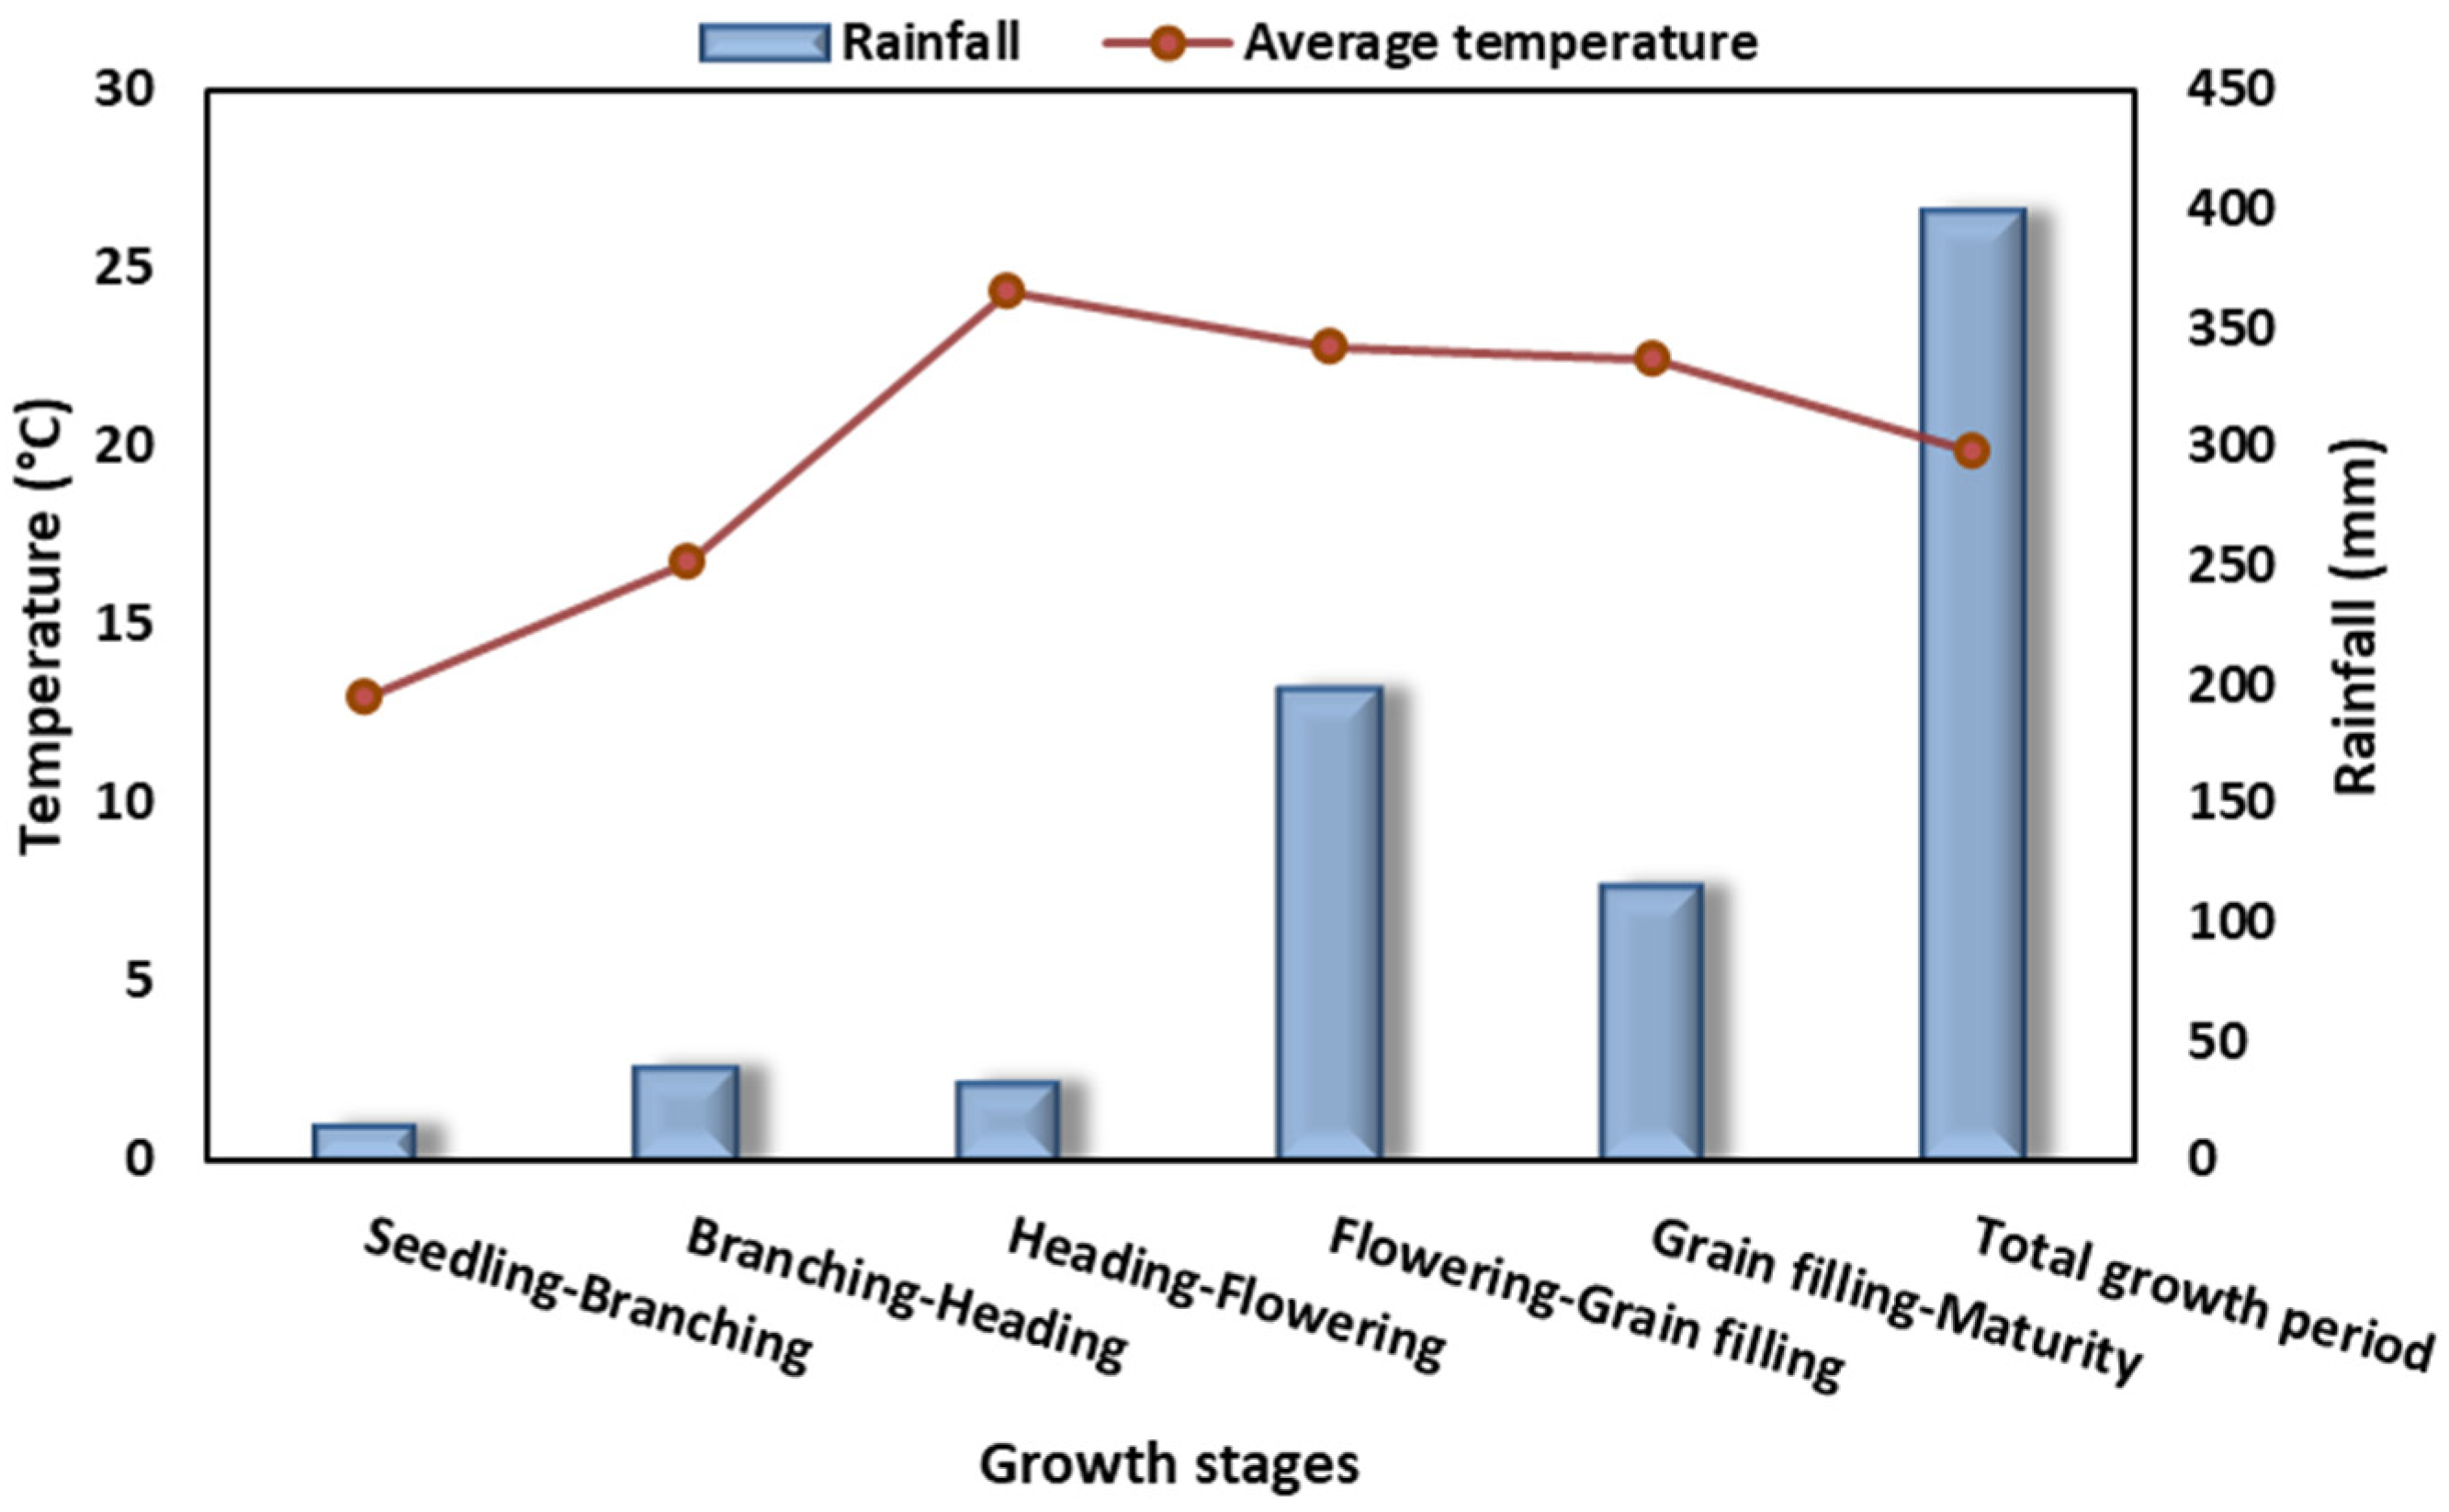
The experiment was conducted in 2021 at the Quinoa Experimental Area in Shenfeng Village, which is part of Shanxi Agricultural University located in Taigu District, Jinzhong City, Shanxi Province. The geographical coordinates of this location are approximately 112°28′–113°01′ E longitude and 37°12′–37°32′ N latitude. This area falls within a warm temperate continental climate with an elevation of 791 m above sea level. It is characterized by an annual sunshine duration ranging from 2500 to 2600 h and an annual average temperature fluctuation of 6 °C. The average annual precipitation is approximately 458 mm. The crop cultivation pattern for quinoa in this region follows a spring crop–fallow rotation, meaning that the crop is sown in spring, and the fields are left fallow during the winter season. Throughout the quinoa growth period, which spans from April to September, the total rainfall received was recorded at 397.3 mm, and the average temperature was 19.85 °C (Figure 10).
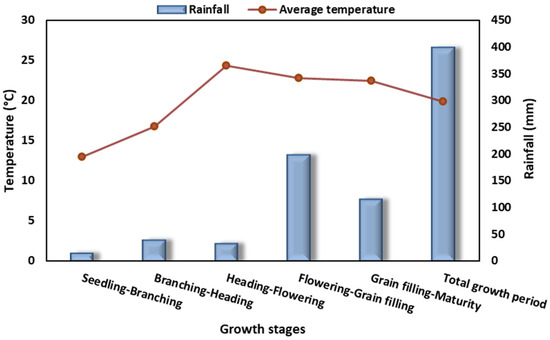
Figure 10.
The rainfall and average temperature at the experimental area during the growth stages of quinoa. The seedling, branching, heading, flowering, grain filling, and maturity stages commenced on 16 May, 30 May, 11 June, 23 June, and 9 August 2021, respectively.
The soil in the top 20 cm layer of this region exhibits a baseline fertility profile, with 12.65 g kg−1 of organic matter, 42.56 mg kg−1 of alkali-hydrolytic nitrogen, 15.65 mg kg−1 of available phosphorus, and 210.66 mg kg−1 of available potassium. These soil characteristics are essential factors to consider in the context of the quinoa cultivation experiments conducted in this area.
4.1. Experimental Design
The experiment was conducted utilizing a randomized complete block design (RCBD) and involved 300 quinoa germplasm accessions. These germplasm accessions were generously provided by Shanxi Jiaqi Agricultural Technology Co., LTD. The experiment commenced on 22 April 2021 with the sowing of quinoa seeds. Prior to sowing, 750 kg ha−1 of compound fertilizer (N-P-K 20-20-5) was evenly applied. The quinoa seeds were evenly broadcasted in the flat field [66], and the seeding rate employed was 5.25 kg per hectare. After broadcasting, the seeds were incorporated into the soil at a depth of 3–5 cm. Following the seeding process, micro-spraying irrigation was employed to facilitate seedling emergence, and thinning of seedlings was carried out at the six-leaf stage to achieve a target plant density of 150,000 plants per hectare (15 plants per m2). The field received irrigations at the ear stage and the early flowering stage, with local measures being taken for artificial weed control and the management of pests and diseases.
From the initial pool of 300 germplasm accessions, 107 quinoa germplasm accessions exhibiting stable growth and fruiting were carefully selected for further evaluation (as detailed in Table S1). To access the phenotypic differences in quinoa germplasms according to their yield levels, all 107 seed-producing genotypes were divided into the following four groups: below 1500 kg ha−1 (GY1), 1500–2250 kg ha−1 (GY2), 2250–3000 kg ha−1 (GY3), and above 3000 kg ha−1 (GY4). Each genotype was sown in three plots (replicates) and each plot occupied an area of 2 m × 2 m (4 m2).
4.2. Measurements
4.2.1. Agronomic Characteristic
Five quinoa plants of each genotype with uniform growth were randomly selected at the maturity stage from each replication, and the plant height was recorded by measuring the distance from the root neck to the top of the main stem. To determine the aboveground dry weight, at maturity, five plants were harvested and the stem was cut from the root base, oven-dried at 105 °C for 30 min, and then dried at 75 °C to a constant weight and weighed.
4.2.2. Root Characteristics
The same plants which were harvested to determine agronomic characteristics were used for the root characteristic determination. A 20 cm section of each root was cut from the tip, washed, and then spread on the glass plate of the root scanner and scanned using an Epson Perfection V850 Pro. Then, the scanned picture was analyzed in WinRHIZO software to obtain the parameters of total root length, root surface area, root diameter, and root tip number.
4.2.3. Stem Strength Characteristics
At maturity, the main stem base hardness, center stem hardness, stem breaking force, and stem thickness of the lower main panicle of quinoa were measured via a culm strength meter (YYD-1, Zhejiang Top Cluod Agri Technology Co., Ltd. Zhuji City, Zhejiang Province, China). Five plants were used from each replicate. The tester probe was placed perpendicular to the culm and the force needed to penetrate the cuticle of the stem from the base and the middle part was recorded as the stem hardness. The force needed to break the stem from the middle was recorded as the stem-breaking force. The area of the probe used to determine stem bending was 0.5 cm2 and for stem strength, the area was 1 mm2.
4.2.4. Panicle Characteristics
At maturity, five plants were used from each replicate to measure the length, width, and area of the main head of quinoa. The panicle area was calculated by multiplying length and width.
4.2.5. Yield and 1000-Grain Weight
All quinoa plants were harvested at maturity by hand. The stalks below the panicles were cut by hand, and grains were dried and weighed for the yield (kg ha−1). To determine the grain weight, 1000 grains of five quinoa plants were counted and weighed for the 1000-grain weight.
4.3. Statistical Analysis
Excel 2007 and Origin 2021 software were used for data processing and mapping, and SPSS27 software (version 27) was used for statistical analysis using analysis of variance. Tukey’s post hoc HSD test was used for significant differences among means, and the significance level was set at α = 0.05. A correlogram was drawn for the correlation among traits of all genotypes using the Performance Analytics package in RStudio 2023.06.1 software. A heat map of traits was drawn with the heatmap package in RStudio, and coloring was scaled according to rows (traits).
5. Conclusions
A total of 300 quinoa germplasms were studied for adaptation to low-altitude areas using 17 traits. From these, 107 genotypes successfully flowered and produced yields ranging from 538 to 5132 kg ha−1. These were categorized into four yield groups. Higher-yielding genotypes exhibited longer growth periods and larger 1000-grain weights. JQ-00084 was the standout genotype, exceeding 3000 kg ha−1 and meeting all key growth criteria. Phenological and agronomic trait analyses highlighted significant variations related to yield, such as plant height, biomass, and root characteristics. This study underscores the importance of selecting germplasms with optimal growth durations and specific trait combinations to enhance quinoa productivity in low-altitude regions. These findings provide a robust framework for future breeding programs aimed at improving quinoa adaptation and yield in diverse environments.
Supplementary Materials
The following supporting information can be downloaded at: https://www.mdpi.com/article/10.3390/agronomy14071354/s1, Table S1: The growth duration of quinoa accessions with yield lower than 1500 kg ha−1 (GY1); Table S2: The growth duration of quinoa accessions with yield 1500-2250 kg ha−1 (GY2); Table S3: The growth duration of quinoa accessions with yield 2250-3000 kg ha−1 (GY3); Table S4: The growth duration of quinoa accessions with yield higher than 3000 kg ha−1 (GY4).
Author Contributions
Conceptualization, M.S.; Software, P.D.; Formal analysis, A.R. and Z.J.; Investigation, J.D.; Data curation, A.R. and P.T.; Writing—original draft, R.W.; Writing—review & editing, A.R., S.A. and L.L.; Visualization, X.W.; Supervision, M.S.; Project administration, Z.G. All authors have read and agreed to the published version of the manuscript.
Funding
This research was funded by a Research Program Sponsored by the State Key Laboratory of Sustainable Dryland Agriculture (in preparation) Shanxi Agricultural University (No. 202003-2), The Key R&D Program Projects in Shanxi Province (202102140601007), Technology assistance projects for developing countries (KY202002002), the technology innovation team of Shanxi Province (No. 201605D131041), the Key Laboratory of Shanxi Province (No. 201705D111007), the “1331” Engineering Key Laboratory of Shanxi Province, and the “1331” Engineering Key Innovation Cultivation Team of Shanxi Province (No. SXYBKY201733).
Data Availability Statement
Data available on request due to privacy.
Conflicts of Interest
All authors declare that the research was conducted in the absence of any commercial or financial relationships that could be construed as a potential conflict of interest.
References
- Ruiz, K.B.; Biondi, S.; Oses, R.; Acuña-Rodríguez, I.S.; Antognoni, F.; Martinez-Mosqueira, E.A.; Coulibaly, A.; Canahua-Murillo, A.; Pinto, M.; Zurita-Silva, A.; et al. Quinoa biodiversity and sustainability for food security under climate change. A review. Agron. Sustain. Dev. 2014, 34, 349–359. [Google Scholar] [CrossRef]
- Lin, C.; Liu, Z.J.; Dong, Y.M.; Vales, M.; Mao, Z.C. Domesticated cultivation and genetic breeding of Chenopodium quinoa. Yi Chuan Hered. 2019, 41, 1009–1022. [Google Scholar] [CrossRef]
- Bhardwaj, R.; Yadav, R.; Vishwakarma, H.; Sharma, K.; Chandora, R.; Rana, J.C.; Riar, A. Agro-morphological and nutritional assessment of chenopod and quinoa germplasm-Highly adaptable potential crops. Food Sci. Nutr. 2023, 11, 5446–5459. [Google Scholar] [CrossRef] [PubMed]
- Food and Agriculture Organization (FAO). Assessment of the International Year of Quinoa 2013. Hundred and Forty-Ninth Session; CL 149/10;2014. Available online: https://www.fao.org/quinoa/en/ (accessed on 1 April 2024).
- Bazile, D.; Pulvento, C.; Verniau, A.; Al-Nusairi, M.S.; Ba, D.; Breidy, J.; Hassan, L.; Mohammed, M.I.; Mambetov, O.; Otambekova, M.; et al. Worldwide evaluations of quinoa: Preliminary results from post international year of quinoa FAO projects in nine countries. Front. Plant Sci. 2016, 7, 850. [Google Scholar] [CrossRef]
- Präger, A.; Boote, K.J.; Munz, S.; Graeff-Hönninger, S. Simulating growth and development processes of Quinoa (Chenopodium quinoa Willd.): Adaptation and evaluation of the CSM-CROPGRO model. Agronomy 2019, 9, 832. [Google Scholar] [CrossRef]
- Gómez-Caravaca, A.M.; Iafelice, G.; Lavini, A.; Pulvento, C.; Caboni, M.F.; Marconi, E. Phenolic compounds and saponins in quinoa samples (Chenopodium quinoa Willd.) grown under different saline and nonsaline irrigation regimens. J. Agric. Food Chem. 2012, 60, 4620–4627. [Google Scholar] [CrossRef] [PubMed]
- Hussain, M.I.; Muscolo, A.; Ahmed, M.; Asghar, M.A.; Al-Dakheel, A.J. Agro-morphological, yield and quality traits and interrelationship with yield stability in quinoa (Chenopodium quinoa Willd.) genotypes under saline marginal environment. Plants 2020, 9, 1763. [Google Scholar] [CrossRef]
- Bertero, H.D. Effects of photoperiod, temperature and radiation on the rate of leaf appearance in quinoa (Chenopodium quinoa Willd.) under field conditions. Ann. Bot. 2011, 87, 495–502. [Google Scholar] [CrossRef]
- Hafeez, M.B.; Iqbal, S.; Li, Y.; Saddiq, M.S.; Basra, S.M.; Zhang, H.; Zahra, N.; Akram, M.Z.; Bertero, D.; Curti, R.N. Assessment of phenotypic diversity in the USDA collection of quinoa links genotypic adaptation to germplasm origin. Plants 2022, 11, 738. [Google Scholar] [CrossRef]
- Christensen, S.A.; Pratt, D.B.; Pratt, C.; Nelson, P.T.; Stevens, M.R.; Jellen, E.N.; Coleman, C.E.; Fairbanks, D.J.; Bonifacio, A.; Maughan, P.J. Assessment of genetic diversity in the USDA and CIP-FAO international nursery collections of quinoa (Chenopodium quinoa Willd.) using microsatellite markers. Plant Genet. Resour. 2007, 5, 82–95. [Google Scholar] [CrossRef]
- Dostalíková, L.; Hlásná Čepková, P.; Janovská, D.; Svoboda, P.; Jágr, M.; Dvořáček, V.; Viehmannová, I. Nutritional evaluation of quinoa genetic resources growing in the climatic conditions of Central Europe. Foods 2023, 12, 1440. [Google Scholar] [CrossRef] [PubMed]
- Hour, A.L.; Hsieh, W.H.; Chang, S.H.; Wu, Y.P.; Chin, H.S.; Lin, Y.R. Genetic diversity of landraces and improved varieties of rice (Oryza sativa L.) in Taiwan. Rice 2020, 13, 82. [Google Scholar] [CrossRef]
- Alkhamisi, S.A.; Nadaf, S.K.; Al-Jabri, N.M.; Al-Hashmi, K.S.; Al-Shirawi, A.I.; Khan, R.R.; Al-Sulaimi, H.A.; Al-Azri, M.S. Productivity of quinoa genotypes across different agro-ecological regions of Oman. Open Agric. J. 2021, 15, 98–109. [Google Scholar] [CrossRef]
- Deng, Y.; Sun, X.; Zhang, Q.; Anwar, S.; Lu, J.; Guo, H.; Qin, L.; Zhang, L.; Wang, C. Comprehensive evaluation and physiological response of quinoa genotypes to low nitrogen. Agronomy 2023, 13, 1597. [Google Scholar] [CrossRef]
- Spehar, C.R.; da Silva Rocha, J.E. Exploiting genotypic variability from low-altitude Brazilian Savannah-adapted Chenopodium quinoa. Euphytica 2010, 175, 13–21. [Google Scholar] [CrossRef]
- Burbano-Erazo, E.; Cordero, C.; Pastrana, I.; Espitia, L.; Gomez, E.; Morales, A.; Pérez, J.; López, L.; Rosero, A. Interrelation of ecophysiological and morpho-agronomic parameters in low altitude evaluation of selected ecotypes of sweet potato (Ipomoea batatas [L.] Lam.). Horticulturae 2022, 6, 99. [Google Scholar] [CrossRef]
- Li, X.; Ran, R.; Chen, G.; Zhao, P. Genomic variation underlying the breeding selection of quinoa varieties Longli-4 and CA3-1 in China. Int. J. Mol. Sci. 2022, 23, 14030. [Google Scholar] [CrossRef]
- Fuentes, F.; Bhargava, A. Morphological analysis of quinoa germplasm grown under lowland desert conditions. J. Agron. Crop. Sci. 2011, 197, 124–134. [Google Scholar] [CrossRef]
- Rojas, W.; Pinto, M.; Alanoca, C.; Gómez-Pando, L.; León-Lobos, P.; Alercia, A.; Diulgheroff, S.; Padulosi, S.; Bazile, D. Quinoa genetic resources and ex situ conservation. In State of the Art Report on Quinoa Around the World 2013; Bazile, D., Bertero, D., Nieto, C., Eds.; FAO: Rome, Italy, 2015; pp. 56–82. [Google Scholar]
- Shah, S.S.; Shi, L.; Li, Z.; Ren, G.; Zhou, B.; Qin, P. Yield, agronomic and forage quality traits of different quinoa (Chenopodium quinoa Willd.) genotypes in northeast China. Agronomy 2020, 10, 1908. [Google Scholar] [CrossRef]
- Coronado, A.C.M.; Hernández, E.H.M.; Coronado, Y.M. Phenotypic diversity of agromorphological characteristics of quinoa (Chenopodium quinoa Willd.) germplasm in Colombia. Sci. Agric. 2021, 79, e20210017. [Google Scholar] [CrossRef]
- Xiu-Shi, Y.; Pei-You, Q.; Hui-Min, G.; Gui-Xing, R. Quinoa industry development in China. Int. J. Agric. Natural Res. 2019, 46, 208–219. [Google Scholar] [CrossRef]
- Capelin, M.A.; Madella, L.A.; Panho, M.C.; Meira, D.; Fernandes, R.A.; Colonelli, L.L.; Menegazzi, C.P.; Rosa, A.C.; Rodrigues, A.P.D.A.C.; Benin, G. Impact of altitude on grain yield, oil, and protein content of soybean. Aust. J. Crop. Sci. 2022, 16, 273–279. [Google Scholar] [CrossRef]
- Sivirihauma, C.; Blomme, G.; Ocimati, W.; Vutseme, L.; Sikyolo, I.; Valimuzigha, K.; De Langhe, E.; Turner, D.W. Altitude effect on plantain growth and yield during four production cycles in North Kivu, eastern Democratic Republic of Congo. In Proceedings of the XXIX International Horticultural Congress on Horticulture: Sustaining Lives, Livelihoods and Landscapes (IHC2014), Brisbane, Australia, 2014; IX 1114. pp. 139–148. [Google Scholar]
- Keleş, S.Ö. The effect of altitude on the growth and development of Trojan fir (Abies nordmanniana subsp. equi-trojani [Asch. & Sint. ex Boiss] Coode & Cullen) saplings. Cerne 2020, 26, 381–392. [Google Scholar]
- Mei, L.; Bao, G.; Tong, S.; Yin, S.; Bao, Y.; Jiang, K.; Hong, Y.; Tuya, A.; Huang, X. Elevation-dependent response of spring phenology to climate and its legacy effect on vegetation growth in the mountains of northwest Mongolia. Ecol. Indic. 2021, 126, 107640. [Google Scholar] [CrossRef]
- Zhao, Y.; Yu, L.X.; Ai, J.; Zhang, Z.F.; Deng, J.; Zhang, Y.B. Climate variations in the low-latitude Plateau contribute to different sugarcane (Saccharum spp.) yields and sugar contents in China. Plants 2023, 12, 2712. [Google Scholar] [CrossRef] [PubMed]
- Ntawuruhunga, P.; Whyte, J.B.A.; Rubaihayo, P. Effect of altitude and plant age on cyanogenic potential, dry matter, starch and sugar content in cassava genotypes. In Proceedings of the 13th ISTRC Symposium, Arusha, Tanzania, 9–14 November 2007; pp. 177–185. [Google Scholar]
- Razafindrazaka, A.; Stuerz, S.; Cotter, M.; Rajaona, A.; Asch, F. Genotypic yield responses of lowland rice in high-altitude cropping systems. J. Agron. Crop. Sci. 2020, 206, 444–455. [Google Scholar] [CrossRef]
- Spehar, C.R.; Santos, R.L.B. Quinoa (Chenopodium quinoa Willd) BRS Piabiru alternative for crop diversification. Pesqui. Agropecu. Bras. 2002, 37, 889–893. [Google Scholar]
- Oustani, M.; Mehda, S.; Halilat, M.T.; Chenchouni, H. Yield, growth development and grain characteristics of seven Quinoa (Chenopodium quinoa Willd.) genotypes grown in open-field production systems under hot-arid climatic conditions. Sci. Rep. 2023, 13, 1991. [Google Scholar] [CrossRef]
- Colque-Little, C.; Abondano, M.C.; Lund, O.S.; Amby, D.B.; Piepho, H.P.; Andreasen, C.; Schmöckel, S.; Schmid, K. Genetic variation for tolerance to the downy mildew pathogen Peronospora variabilis in genetic resources of quinoa (Chenopodium quinoa). BMC Plant Biol. 2021, 21, 1–19. [Google Scholar] [CrossRef] [PubMed]
- Shah, D.U.; Reynolds, T.P.; Ramage, M.H. The strength of plants: Theory and experimental methods to measure the mechanical properties of stems. J. Exp. Bot. 2017, 68, 4497–4516. [Google Scholar] [CrossRef]
- Irum, R.; Daowu, H.; Adeel, A.; Hongge, L.; Shoupu, H.; Mian Faisal, N.; Xiaoyang, W.; Yinhua, J.; Zhaoe, P.; Peng, Z.; et al. Correlation analysis of stem hardness traits with fiber and yield-related traits in core collections of Gossypium hirsutum. J. Cotton. Res. 2021, 4, 1–10. [Google Scholar]
- Ishimaru, K.; Togawa, E.; Ookawa, T.; Kashiwagi, T.; Madoka, Y.; Hirotsu, N. New target for rice lodging resistance and its effect in a typhoon. Plant 2008, 227, 601–609. [Google Scholar] [CrossRef]
- Beeck, C.P.; Wroth, J.; Cowling, W.A. Genetic variation in stem strength in field pea (Pisum sativum L.) and its association with compressed stem thickness. Aust. J. Agric. Res. 2006, 57, 193–199. [Google Scholar] [CrossRef]
- Dierig, D.A.; Adam, N.R.; Mackey, B.E.; Dahlquist, G.H.; Coffelt, T.A. Temperature and elevation effects on plant growth, development, and seed production of two Lesquerella species. Indus. Crops Prod. 2006, 24, 17–25. [Google Scholar] [CrossRef]
- Altuhaish, A.A.K.; Yahya, S. Field adaptation of some introduced wheat (Triticum aestivum L.) genotypes in two altitudes of tropical agro-ecosystem environment of Indonesia. Hayati, J. Biosci. 2014, 21, 31–38. [Google Scholar] [CrossRef]
- Tang, P.; Ren, A.; Jiang, Z.; Wang, R.; Cui, K.; Wu, X.; Sun, M.; Gao, Z.; Anwar, S. Evaluation of Quinoa Varieties for Adaptability and Yield Potential in Low Altitudes and Correlation with Agronomic Traits. Agronomy 2024, 14, 852. [Google Scholar] [CrossRef]
- Bazile, D. Global trends in the worldwide expansion of quinoa cultivation. Biol Life Sci Forum 2023, 25, 13. [Google Scholar] [CrossRef]
- Taaime, N.; Rafik, S.; El Mejahed, K.; Oukarroum, A.; Choukr-Allah, R.; Bouabid, R.; El Gharous, M. Worldwide development of agronomic management practices for quinoa cultivation: A systematic review. Front. Agron. 2023, 5, 1215441. [Google Scholar] [CrossRef]
- Christiansen, J.L.; Jacobsen, S.E.; Jørgensen, S.T. Photoperiodic effect on flowering and seed development in quinoa (Chenopodium quinoa Willd.). Acta Agric. Scand. Sec. B-Soil Plant Sci. 2010, 60, 539–544. [Google Scholar]
- Pathan, S.; Ndunguru, G.; Clark, K.; Ayele, A.G. Yield and nutritional responses of quinoa (Chenopodium quinoa Willd.) genotypes to irrigated, rainfed, and drought-stress environments. Front. Sustain. Food Sys. 2023, 7, 1242187. [Google Scholar] [CrossRef]
- El-Sadek, A. Multi-environmental evaluation for grain yield and its components of quinoa genotypes across the north western coast of Egypt. Egypt J. Desert Res. 2017, 67, 65–82. [Google Scholar] [CrossRef]
- Lu, J.; Zhang, Q.; Sun, X.; Deng, Y.; Guo, H.; Wang, C.; Zhao, L. Study on the mechanism of slow-release fertilizer and nitrogen fertilizer on the senescence characteristics of quinoa Leaves. Agronomy 2024, 14, 884. [Google Scholar] [CrossRef]
- García-Parra, M.; Roa-Acosta, D.; Bravo-Gómez, J.E. Effect of the altitude gradient on the physiological performance of quinoa in the Central Region of Colombia. Agronomy 2022, 12, 2112. [Google Scholar] [CrossRef]
- Maamri, K.; Zidane, O.D.; Chaabena, A.; Fiene, G.; Bazile, D. Adaptation of some quinoa genotypes (Chenopodium quinoa Willd.), grown in a saharan climate in Algeria. Life 2022, 12, 1854. [Google Scholar] [CrossRef] [PubMed]
- Tan, M.; Temel, S. Performance of some quinoa (Chenopodium quinoa Willd.) genotypes grown in different climate conditions. Turk. J. Field Crops 2018, 23, 180–186. [Google Scholar] [CrossRef]
- Jacobsen, S.E.; Stølen, O. Quinoa—Morphology and phenology and prospects for its production as a new crop in Europe. Eur. J. Agron. 1993, 2, 19–29. [Google Scholar] [CrossRef]
- Jacobsen, S.E. The scope for adaptation of quinoa in Northern Latitudes of Europe. J. Agrn. Crop. Sci. 2017, 203, 603–613. [Google Scholar] [CrossRef]
- Bhargava, A.; Shukla, S.; Ohri, D. Genetic variability and interrelationship among various morphological and quality traits in quinoa (Chenopodium quinoa Willd.). Field Crop Res. 2007, 101, 104–116. [Google Scholar] [CrossRef]
- Hou, P.; Liu, Y.; Xie, R.; Ming, B.; Ma, D.; Li, S.; Mei, X. Temporal and spatial variation in accumulated temperature requirements of maize. Field Crops Res. 2014, 158, 55–64. [Google Scholar] [CrossRef]
- Liu, Y.; Hou, P.; Xie, R.; Hao, W.; Li, S.; Mei, X. Spatial variation and improving measures of the utilization efficiency of accumulated temperature. Crop Sci. 2015, 55, 1806–1817. [Google Scholar] [CrossRef]
- García-Parra, M.A.; Roa-Acosta, D.F.; Stechauner-Rohringer, R.; García-Molano, F.; Bazile, D.; Plazas-Leguizamón, N. Effect of temperature on the growth and development of quinoa plants (Chenopodium quinoa Willd.): A review on a global scale. Sylwan 2020, 164, 411–433. [Google Scholar]
- Proffitt, C.E.; Travis, S.E.; Edwards, K.R. Genotype and elevation influence Spartina alterniflora colonization and growth in a created salt marsh. Ecol. Appl. 2003, 13, 180–192. [Google Scholar] [CrossRef]
- Mahmood, R.S.; AL-Taweel, S.K. Physiological response of genotypes and sowing dates in the growth and yield of Chenopodium quinoa Willd. IOP Conf. Ser. Earth Environ. Sci. 2022, 1060, 01211. [Google Scholar] [CrossRef]
- Manugade, R.P.; Bhalekar, N.B.; Hamane, G.M. Screening of quinoa (Chenopodium quinoa Willd.) genotypes for morphological parameters. Pharma. Innov. J. 2023, 12, 2717–2719. [Google Scholar]
- Yan, D.; Juan-Ling, W.; Anwar, S.; Chuang-Yun, W.; Li, Z.; Li-Guang, Z.; Hong-Xia, G.; Li-Xia, Q.; Hua, L.; Mei-Xia, W. Phenology, lodging and yield traits of Chenopodium quinoa under the effect of planting density and row spacings. Fresenius Env. Bull 2021, 30, 11757–11767. [Google Scholar]
- Khobra, R.; Sareen, S.; Meena, B.K.; Kumar, A.; Tiwari, V.; Singh, G.P. Exploring the traits for lodging tolerance in wheat genotypes: A review. Physiol. Mol. Biol. Plants 2019, 25, 589–600. [Google Scholar] [CrossRef]
- Gupta, S.K.; Shaikh, C.G.; Ponnaiah, G.; Kalleshappa, C.C.; Kholova, J.; Jayalekha, A.K.; Verma, Y.S. Culm Strength: Key Trait to Identify Lodging Tolerant Genotypes in Pearl Millet. In Proceedings of the 16th ROME International Conference on Advances in Agricultural, Biological and Environmental Sciences, RAABE-20, Rome, Italy, 3–5 February 2020; pp. 91–92. [Google Scholar]
- Muhammad, A.; Hao, H.; Xue, Y.; Alam, A.; Bai, S.; Hu, W.; Sajid, M.; Hu, Z.; Samad, R.A.; Li, Z.; et al. Survey of wheat straw stem characteristics for enhanced resistance to lodging. Cellulose 2020, 27, 2469–2484. [Google Scholar] [CrossRef]
- Wang, D.; Ding, W.H.; Feng, S.W.; Hu, T.Z.; Li, G.; Li, X.H.; Yang, Y.Y.; Ru, Z.G. Stem characteristics of different wheat cultivars and their relationship with lodging resistance. Chin. J. Appl. Ecol. 2016, 27, 1496–1502. [Google Scholar]
- Ahmad, S.; Jabbar, M.; Khalique, A.; Shahzad, F.; Ahmad, N.; Fiaz, M.; Younas, U. Effect of different levels of NDF on voluntary feed intake, dry matter digestibility and nutrients utilization in dry Nili Ravi buffaloes. JAPS 2014, 24, 1602–1605. [Google Scholar]
- Deng, Y.; Zhao, L.; Anwar, S.; Zhang, L.G.; Shafiq, F.; Guo, H.X.; Qin, L.X.; Wang, M.X.; Wang, C.Y. Phosphorus fertigation conferred lodging tolerance and improved grain quality in Chenopodium quinoa via enhanced root proliferation and stalk strength. J. Soil Sci. Plant Nutr. 2022, 22, 5099–5110. [Google Scholar] [CrossRef]
- Ali, S.; Chattha, M.U.; Hassan, M.U.; Erils, L. Growth, Biomass Production, and Yield Potential of Quinoa (Chenopodium quinoa Willd.) as Affected by Planting Techniques Under Irrigated Conditions. Int. J. Plant Prod. 2020, 14, 427–441. [Google Scholar] [CrossRef]

Disclaimer/Publisher’s Note: The statements, opinions and data contained in all publications are solely those of the individual author(s) and contributor(s) and not of MDPI and/or the editor(s). MDPI and/or the editor(s) disclaim responsibility for any injury to people or property resulting from any ideas, methods, instructions or products referred to in the content. |
© 2024 by the authors. Licensee MDPI, Basel, Switzerland. This article is an open access article distributed under the terms and conditions of the Creative Commons Attribution (CC BY) license (https://creativecommons.org/licenses/by/4.0/).