Abstract
Dichloroquinolinic acid is a hormone-type herbicide widely used to control barnyard grass during crop cultivation. However, it can seriously inhibit the growth of susceptible crops, including tobacco, because it degrades slowly under field conditions. Additionally, the mechanism by which it damages crops is unclear. More specifically, the transcriptional changes in plants induced by dichloroquinolinic acid remain unknown. In this study, differentially expressed genes (DEGs) in tobacco treated with dichloroquinolinic acid (varying concentrations and durations) were analyzed and validated to explore the global transcriptome changes. The number of DEGs, which were determined according to the FPKM, varied from 758 to 21,340. The KEGG analysis revealed that many DEGs were involved in starch and sucrose metabolism, phenylpropanoid biosynthesis, photosynthesis, porphyrin and chlorophyll metabolism, and glutathione metabolism. Transcriptomic analyses indicated that dichloroquinolinic acid can inhibit tobacco growth by inhibiting photosynthesis and storage of energy. We discovered that the toxicity mechanism of the hormone herbicide dichloroquinolinic acid differs from that of high concentrations of IAA (Indoleacetic acid), despite studies confirming that the effects of hormone herbicides are consistent with the physiological disturbances and growth inhibition exhibited by plants in IAA overdose. Particularly, dichloroquinolinic acid suppresses photosynthesis while high concentration IAA stimulates nucleotide synthesis and photosynthesis. More importantly, we found by editing the IAA-responsive gene IAA16, tobacco could develop resistance to dichloroquinolinic acid. The results will help clarify plant responses to hormone-type herbicides at the transcriptional level, thereby providing insights into the diversity in the gene’s response to herbicides, the molecular targets of hormone-type herbicides, and the mechanism underlying the susceptibility of tobacco to dichloroquinolinic acid. Accordingly, this study may be helpful for future research to enhance crop resistance to herbicides residues.
1. Introduction
Auxin herbicides are highly efficient and widely used to increase agricultural production. However, the extensive application of the auxin-type herbicide dichloroquinolinic acid (3,7-dichloro-8-quinolinecarboxylic acid) may be harmful to rice [1], tomato [2], maize [3], and tobacco. Additionally, the inclusion of dichloroquinolinic acid in the growth medium leads to a decrease in the total chlorophyll content and an increase in ethylene/cyanide biosynthesis in maize leaves [4,5]. Dichloroquinolinic acid can also increase the level of endogenous abscisic acid and restrict photosynthetic CO2 fixation [6].
The application of dichloroquinolinic acid can damage the herbicide-sensitive model plant species tobacco, thereby adversely affecting tobacco production. Under field conditions, tobacco plants damaged by dichloroquinolinic acid typically contain deformed new leaves. More specifically, the leaves are abnormally narrow and thick and incapable of extending, with rolled leaf edges and a crinkled underside. In severe cases, the leaves appear thread-like. The long-lasting dichloroquinolinic acid residues in the soil can severely affect the growth and development of tobacco plants in the subsequent cropping season during tobacco–rice crop rotations [7]. The threshold teratogenic concentration of dichloroquinolinic acid (2.08 × 10⁻³ mg/kg) in field tobacco was reported by Zhang et al. [8], we found that in the pre-spray treatment experiment, the critical dichloroquinolinic acid concentration in tobacco seedlings was 1 mg/L [7], greater than the threshold teratogenic concentration that Zhang had reported.
Previous studies revealed the effectiveness of transcriptome sequencing (RNA-seq) analyses for the bulk mining of herbicide response or resistance genes, especially for weeds that have evolved resistance to herbicides. For example, the RNA-seq analysis of HPPD herbicide-resistant and susceptible waterhemp populations identified SNPs applicable for distinguishing between the resistant and susceptible genotypes [9]. Notably, many transcriptome-mined resistance genes are involved in the stress responses and detoxification-related processes of various weeds [10,11], including jungle rice (Echinochloa colona L.) in rice fields [12] and Aegilops tauschii Coss. in wheat fields [13]. The susceptibility of crops to herbicides may be related to the inability to sense herbicides and induce the expression of gene-encoding proteins (e.g., enzymes) that can detoxify herbicides [14].
Recent studies have focused on the structure, properties, and mechanism of action of dichloroquinolinic acid, but its effects on the molecular mechanism and gene regulatory network of plants remain relatively unknown. In this study, we analyzed the tobacco transcriptome to screen for candidate genes regulating herbicide resistance. The study findings may provide the basis for future research aimed at precisely dissecting the regulatory networks and molecular mechanisms underlying the herbicide resistance of plants.
2. Materials and Methods
2.1. Plant Materials and RNA Isolation
Previous research has proved that the critical concentration of dichloroquinolinic acid damage in seedling tobacco is 1 mg/L [7]. Accordingly, we prepared two sets of materials for the RNA-seq analysis. In one set, tobacco seeds (Nicotiana tabacum L. cv. ‘Honghuadajinyuan’) were sown in MS medium containing different herbicide and hormone concentrations (i.e., 0, 0.1, and 1 mg/L dichloroquinolinic acid and 100 mg/L IAA (Indoleacetic acid)). After 10 and 20 days, whole seedlings were collected, with three biological replicates (three seedlings each) per treatment. In the other set, tobacco seeds were uniformly sown in seedling trays (55.5 cm × 25.5 cm), with 0.04 g seeds per tray. At 28 days after sowing, the surfaces of the seedling leaves were uniformly saturated with 0 or 1 mg/L dichloroquinolinic acid (spray application). The leaves and roots were collected 7 and 14 days later. The treatments were conducted using three biological replicates (three seedlings each). All collected samples were immediately frozen in liquid nitrogen and stored at −80 °C. Total RNA was isolated from 100 mg frozen tissue using reagent kit (QIAGEN, Hilden, NRW, Germany). After determining the RNA quantity and purity using the NanoDrop ND-1000 spectrophotometer (NanoDrop Technologies, Wilmington, DE, USA), 5 mg RNA (50 μL reaction volume) and AMV reverse transcriptase (Takara Biotechnology, Kusatsu, Japan) were used for the first-strand cDNA synthesis (reverse transcription), which was completed at 42 °C for 1 h.
2.2. RNA-Seq Library Construction and Sequencing
For each sample, 3 μg of extracted RNA was sent to Novogene Bioinformatics Institute (Beijing, China) for the Illumina sequencing analysis. The RNA-seq libraries were constructed using the NEBNext® Ultra™ RNA Library Prep Kit for Illumina® Kit (Illumina, NEB, Ipswich, MA, USA) and analyzed using the Agilent 2100 Bioanalyzer (Agilent, Santa Clara, CA, USA). A quantitative real-time polymerase chain reaction (qRT-PCR) analysis was conducted to ensure the library quality was appropriate for sequencing. Raw data (reads) in the fastq format were filtered by removing adapter sequences, reads containing poly-N sequences, and low-quality reads. The clean reads were mapped to the N. tabacum reference genome (https://solgenomics.net/organism/Nicotiana_tabacum/genome, accessed on 6 March 2021) using the HISAT2 software (https://daehwankimlab.github.io/hisat2/hisat-3n, accessed on 5 May 2024) [15].
2.3. Data Analysis
The new transcripts were assembled and annotated. The expected number of fragments per kilobase of transcript sequence per million base pairs sequenced (FPKM) value was calculated on the basis of the gene length and the number of reads mapped to the gene. Differentially expressed genes (DEGs) were identified using DESeq2 [16]. An adjusted p value of 0.05 and a log2(fold-change) of 1 were set as the thresholds for detecting significant DEGs. The clusterProfiler software 4.0 was used for the GO functional enrichment and KEGG pathway enrichment analyses of the DEGs [17].
2.4. qRT-PCR
The candidate DEGs responsive to dichloroquinolinic acid were validated by qRT-PCR. Total RNA was reverse transcribed using the RevertAid™ First-Strand cDNA Synthesis Kit (MBI Fermentas, Québec City, QC, Canada). The synthesized cDNA along with TB Green™ Premix Ex Taq™ II (Tli RNaseH Plus; TaKaRa, Kusatsu, Japan) and candidate gene-specific primers (Table 1), which were designed using Primer3Plus (http://primer3plus.com/cgi-bin/dev/primer3plus.cgi, accessed on 5 May 2024), were used for the qRT-PCR analysis performed using the 7500 Real-Time PCR System (Applied Biosystems, Foster City, CA, USA). Three fully independent biological replicates were prepared for the qRT-PCR runs conducted in triplicate. Candidate gene expression levels were calculated using the 2−ΔΔCt method [18].

Table 1.
Primer sequences of candidate genes used for qRT-PCR.
2.5. Gene Editing and Phenotypic Analysis of Dichloroquinolinic Acid Resistance in Edited Material
The CDS sequence of IAA16 was utilized to design target sites, which were constructed into highly efficient gene editing vector pDC45 [19] from the Institute of Tobacco Research, Chinese Academy of Agricultural Sciences (CAAS). The recombinant vector was transformed into Agrobacterium tumefaciens strain EHA105 and introduced into cultivated Nicotiana tabacum L. cv. ‘honghuadajinyuan’ plants using the leaf disc method. Transgenic plants were selected on MS media containing 10 mg/mL hygromycin. The transgenic plants were selected by PCR using the specific primers NtIAA-sgF and NtIAA-sgR (Table 1). For the T1 generation editing materials, dichloroquinolinic acid resistance was examined in two different ways: first, 10 days after spot seeding, the editing materials were transferred to medium containing 0.2 mg/L dichloroquinolinic acid, and phenotypes were observed and photos were taken; second, 28 days after sowing, the editing materials were spotted and sprayed with 1 mg/L dichloroquinolinic acid, and phenotypes were observed and photos were taken 14 days later.
3. Results
3.1. Effects of Different Dichloroquinolinic Acid and IAA Concentrations on Tobacco Seed Germination and Seedling Growth
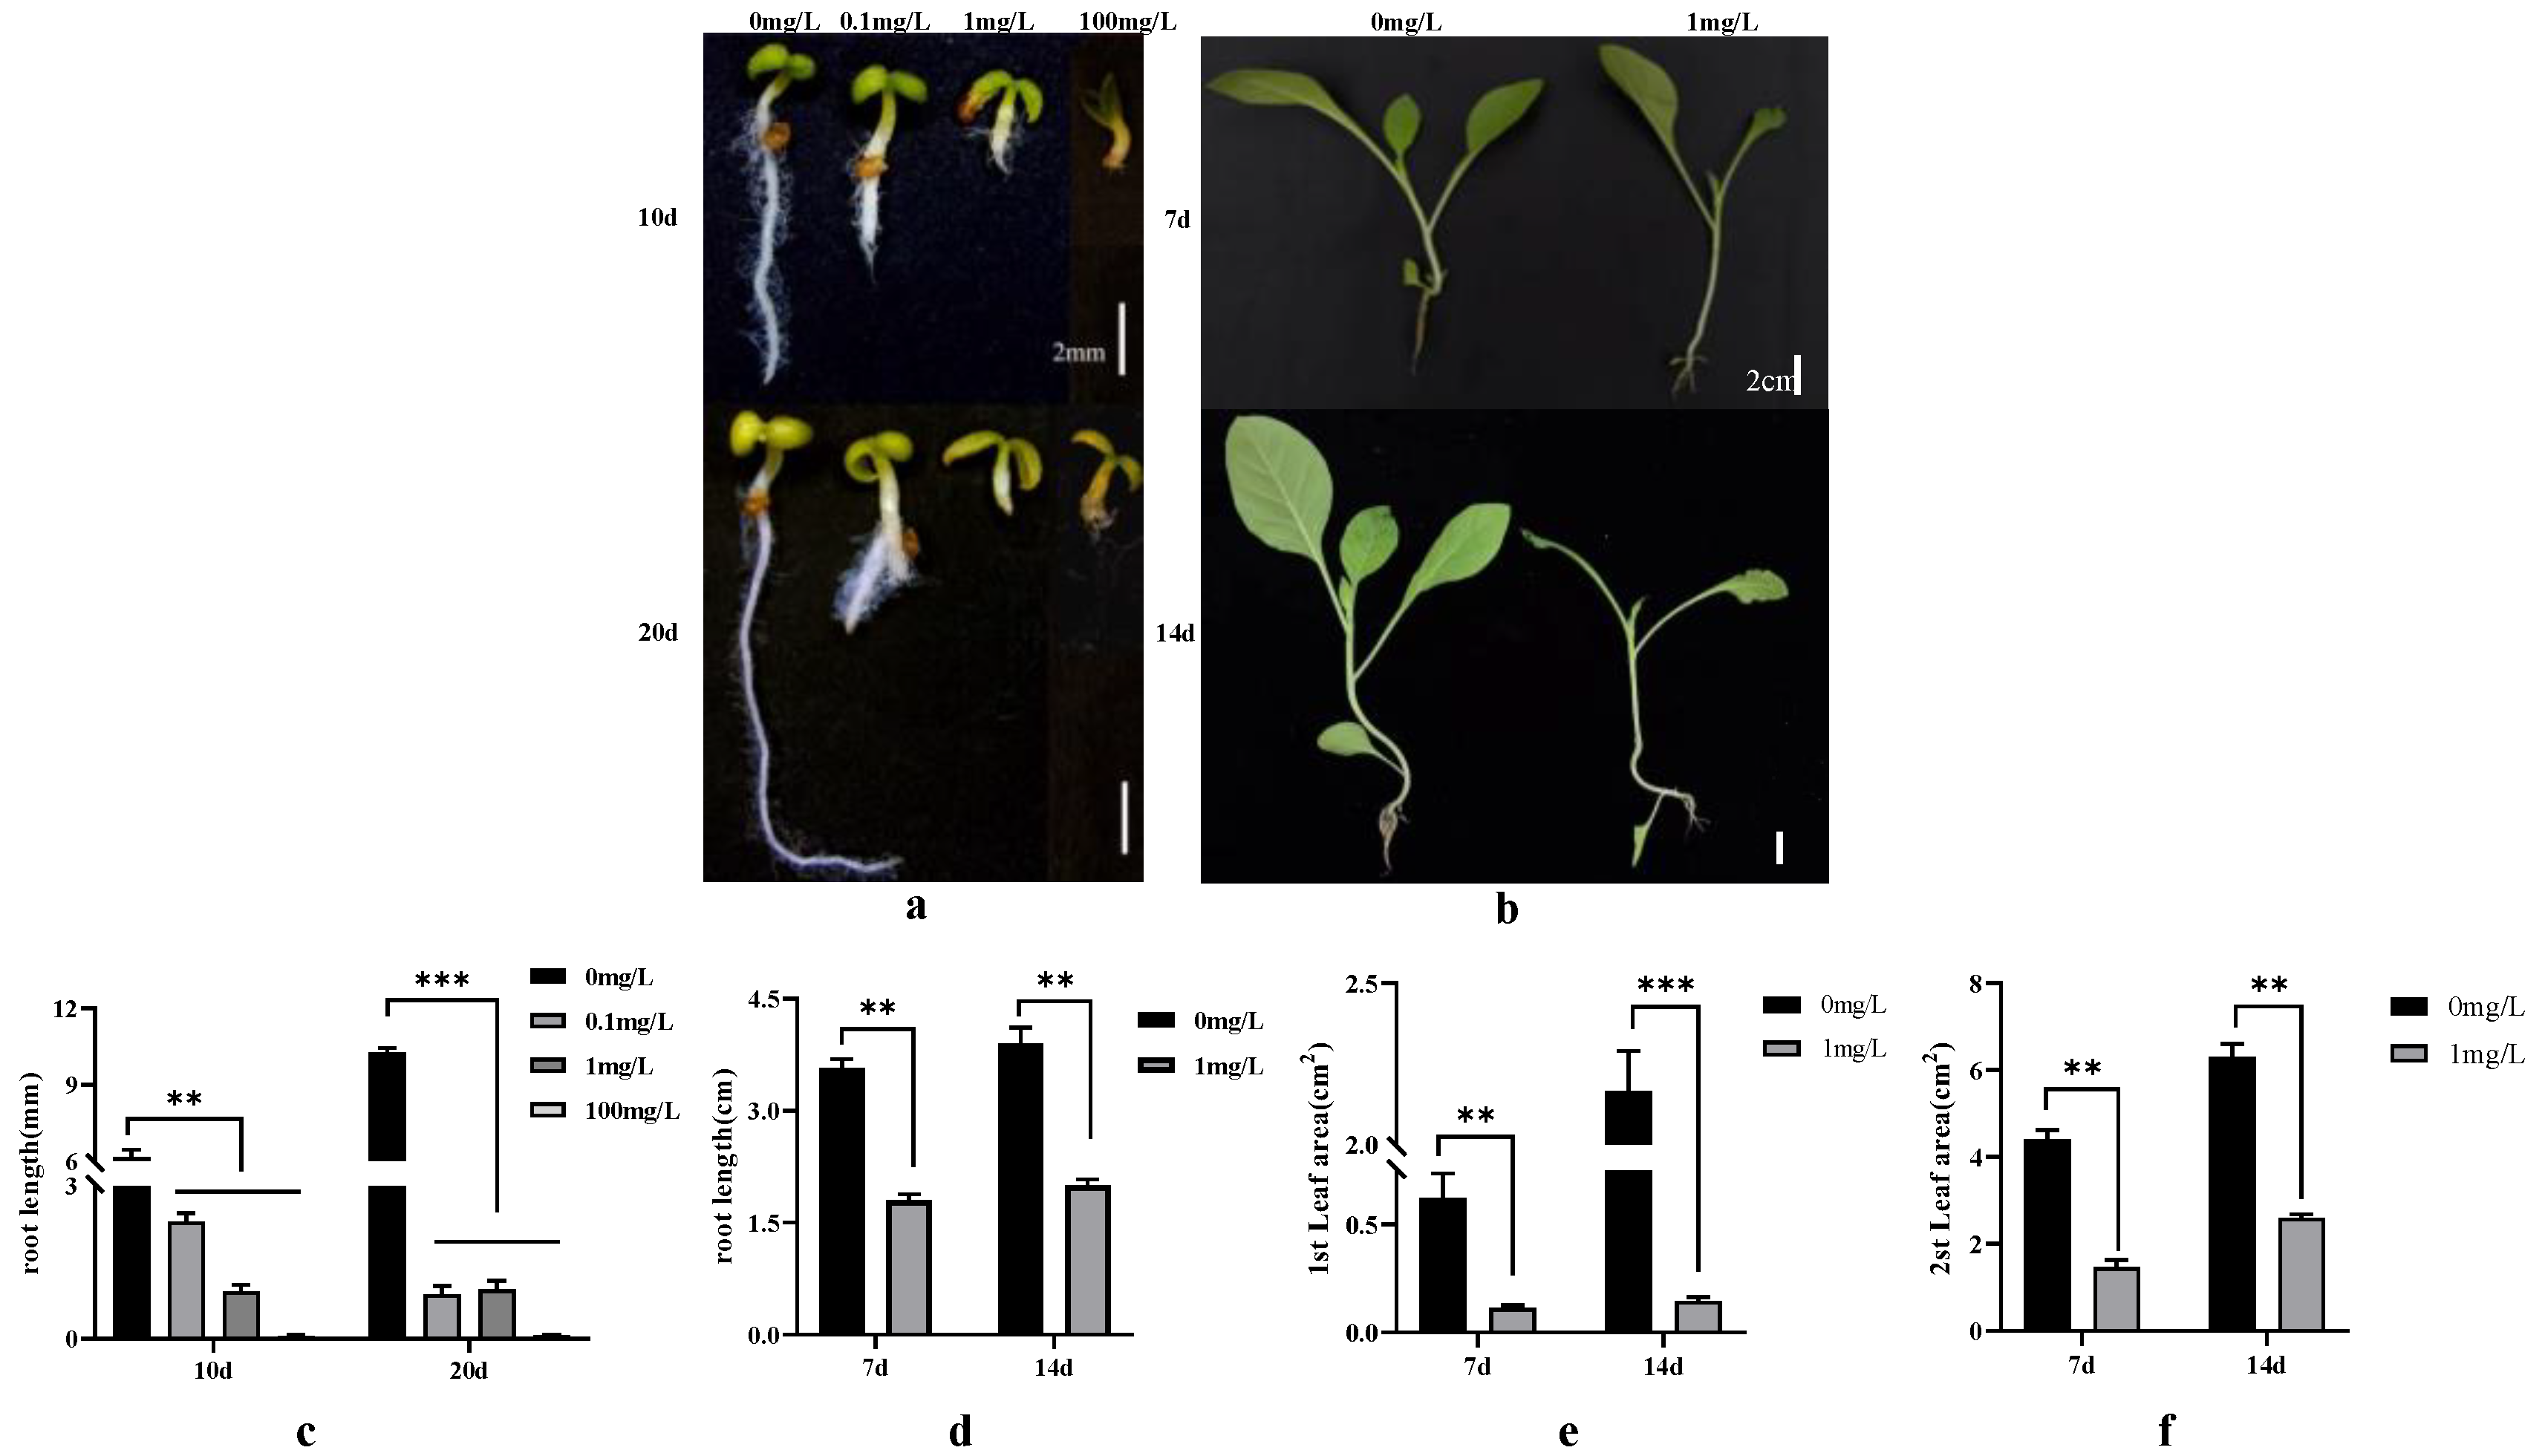
The seedling growth status varied significantly among the treatment concentrations and durations. Increases in the dichloroquinolinic acid and IAA concentrations resulted in decreases in the root length and seedling growth (Figure 1). To explore the transcriptional changes induced by the different treatment concentrations and durations, 24 RNA-seq libraries (Q0_10_1, Q0_10_2, Q0_10_3, Q01_10_1, Q01_10_2, Q01_10_3, Q1_10_1, Q1_10_2, Q1_10_3, IAA_10_1, IAA_10_2, IAA_10_3, Q0_20_1, Q0_20_2, Q0_20_3, Q01_20_1, Q01_20_2, Q01_20_3, Q1_20_1, Q1_20_2, Q1_20_3, IAA_20_1, IAA_20_2, and IAA_20_3) were constructed for the germinating seeds. Another 24 RNA-seq libraries (QL0_7_1, QL0_7_2, QL0_7_3, QL1_7_1, QL1_7_2, QL1_7_3, QR0_7_1, QR0_7_2, QR0_7_3, QR1_7_1, QR1_7_2, QR1_7_3, QL0_14_1, QL0_14_2, QL0_14_3, QL1_14_1, QL1_14_2, QL1_14_3, QR0_14_1, QR0_14_2, QR0_14_3, QR1_14_1, QR1_14_2, and QR1_14_3) were constructed for the seedlings. The library names were determined on the basis of the following: 7, 10, 14, and 20, treatment duration; Q0, Q01, and Q1, treatment concentration; L, leaf and R, root, with three biological replicates, each corresponding to three independent plants (Table 2).

Figure 1.
Tobacco seed germination and seedling growth in response to varying dichloroquinolinic acid/IAA treatment durations and concentrations. (a) Germination of tobacco seeds after 10/20 days of treatment with different concentrations of dichloroquinolinic acid/IAA; (b) growth of tobacco seedlings after 7 days/14 days of treatment with different concentrations of dichloroquinolinic acid; (c) root length of tobacco seeds treated with different concentrations of dichloroquinolinic acid/IAA for 10/20 days; (d) root length of tobacco seedlings treated with different concentrations of dichloroquinolinic acid for 7/14 days; (e) leaf area of the first leaf of tobacco seedlings treated with different concentrations of dichloroquinolinic acid for 7/14 days; (f) leaf area of the second leaf of tobacco seedlings treated with different concentrations of dichloroquinolinic acid for 7/14 days. ** represents p-value less than 0.01 and *** represents p-value less than 0.001.
Table 2.
Explanation of each category.
3.2. Illumina HiSeq Transcriptome Sequencing Analysis
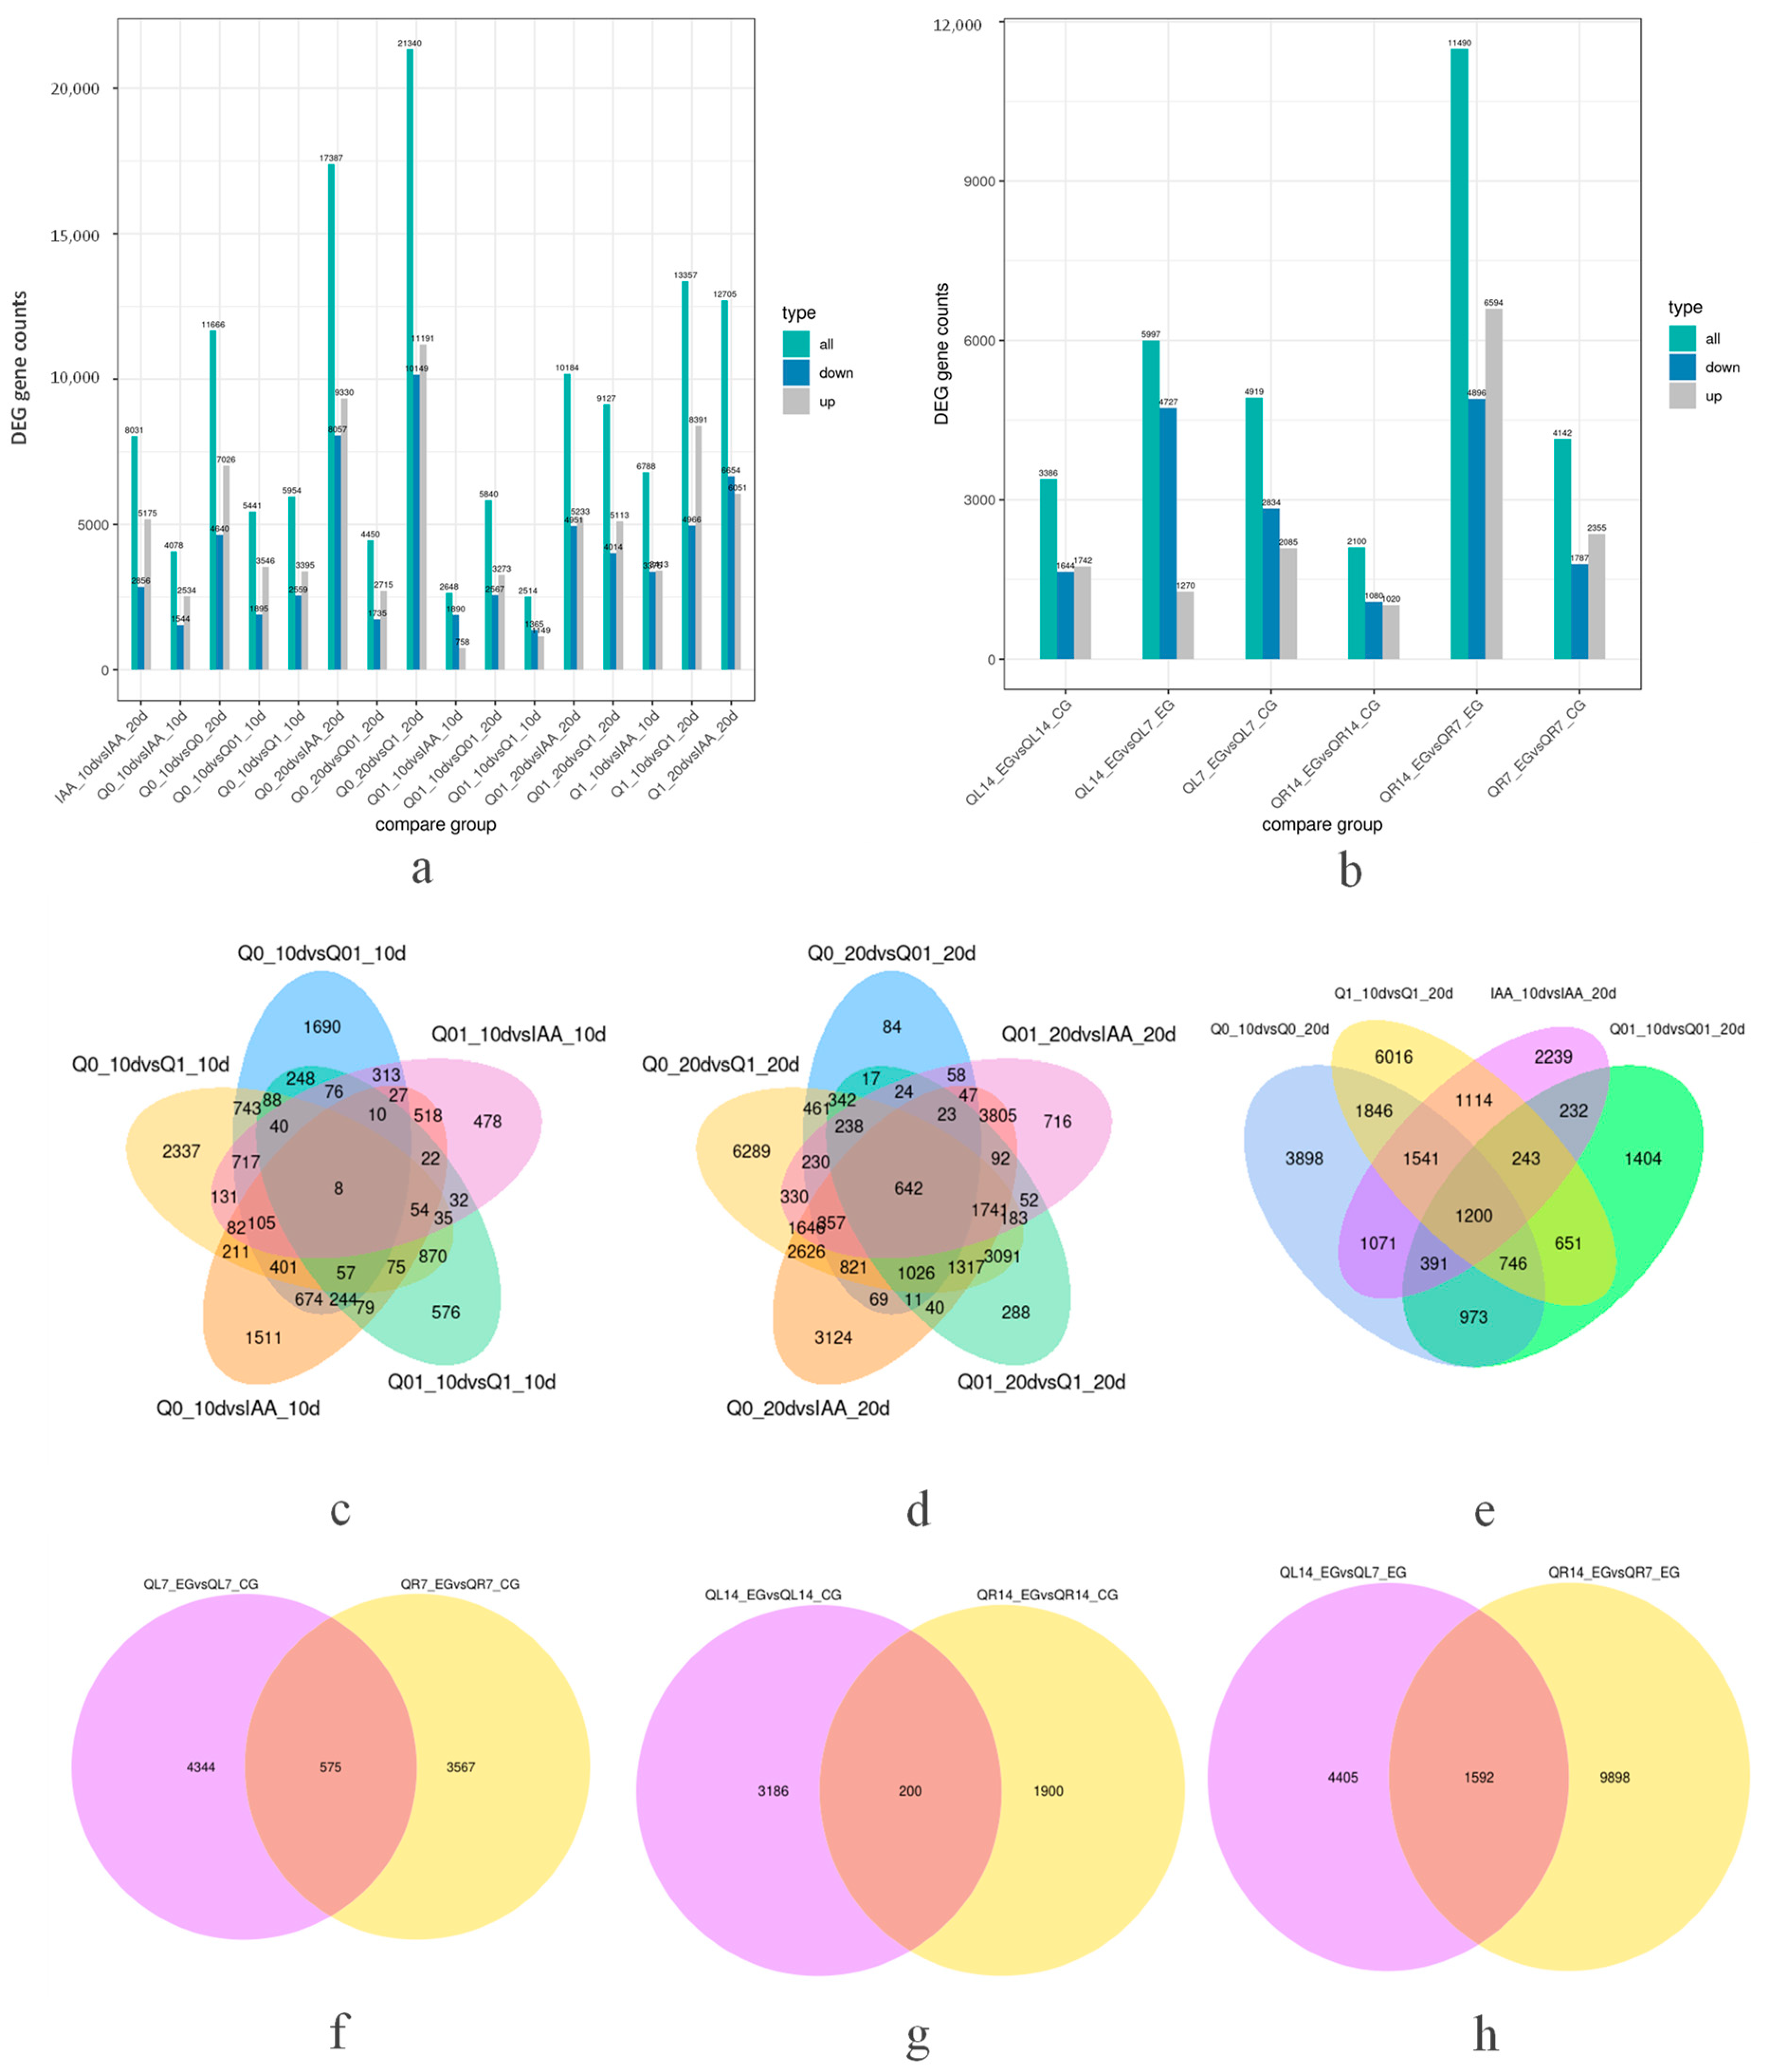
For seed libraries, the sequencing of each RNA-seq library generated more than 6 Gb of clean reads, with Q20 exceeding 97%. Additionally, 94.37–96.42% of the clean reads were aligned to the N. tabacum reference genome (https://solgenomics.net/organism/Nicotiana_tabacum/genome, accessed on 6 March 2021). More than 89% of the clean reads were uniquely mapped to the genome (Supplemental Table S1). The HTSeq (v0.6.1) program was used to determine the number of reads mapped to each gene. After removing the low-quality genes, 81,972 genes were obtained for the 24 libraries, including 7701 newly annotated genes. To identify the key regulatory genes responsive to the dichloroquinolinic acid and IAA treatments, the differences in gene expression among the analyzed libraries were examined, with DEGs identified via pairwise comparisons. On the basis of the fragments per kilobase million mapped reads (FPKM) values (adjusted p < 0.05 and |log2(fold-change)| > 1.0), 758–21,340 DEGs were detected (Figure 2a). The relationships between different DEG groups were visualized using Venn diagrams (Figure 2c–e). For the pairwise comparisons, we focused on the germination and growth period after sowing as well as the herbicide and hormone treatment concentrations. Thus, 5441, 5954, 4078, 2514, and 2648 DEGs were revealed by the Q0_10 vs. Q01_10, Q0_10 vs. Q1_10, Q0_10 vs. IAA_10, Q01_10 vs. Q1_10, and Q01_10 vs. IAA_10 comparisons, respectively, with eight common DEGs among the comparisons. In addition, 4450, 21,340, 17,387, 9127, and 10,184 DEGs were revealed by the Q0_20 vs. Q01_20, Q0_20 vs. Q1_20, Q0_20 vs. IAA_20, Q01_20 vs. Q1_20, and Q01_20 vs. IAA_20 comparisons, respectively, with 642 common DEGs among the comparisons. Moreover, 11,666, 5840, 13,357, and 8031 DEGs were revealed by the Q0_10 vs. Q0_20, Q01_10 vs. Q01_20, Q1_10 vs. Q1_20, and IAA_10 vs. IAA_20 comparisons, respectively, with 1200 common DEGs among the comparisons.
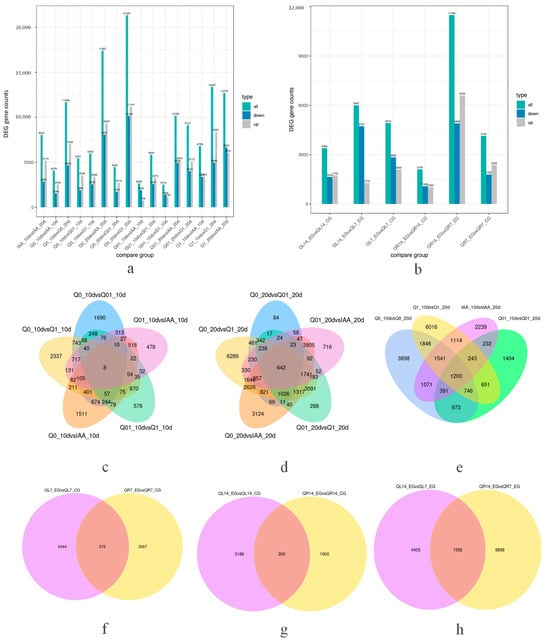
Figure 2.
Number of differentially expressed genes and Venn diagram between different comparison groups. (a) Number of differentially expressed genes for seed libraries; (b) number of differentially expressed genes for seedling libraries; (c) Venn diagram between varied dichloroquinolinic acid and IAA concentrations 10 days after treatment for seed samples; (d) Venn diagram between varied dichloroquinolinic acid and IAA concentrations 20 days after treatment for seed samples; (e) Venn diagram between duration of dichloroquinolinic acid and IAA treatment for seed samples; (f) Venn diagram between organs of dichloroquinolinic acid 7 days after treatment for seedling samples; (g) Venn diagram between organs of dichloroquinolinic acid 14 days after treatment for seedling samples; (h) Venn diagram between durations of dichloroquinolinic acid after treatment for seedling samples.
For seedling libraries, the sequencing of each RNA-seq library generated more than 6.4 Gb of clean reads, with Q20 exceeding 97.7% (Supplemental Table S1). The HTSeq (v0.6.1) program was used to determine the number of reads mapped to each gene. After removing the low-quality genes, 80,720 genes were obtained for the 24 libraries, including 6448 newly annotated genes. To identify the key regulatory genes responsive to the dichloroquinolinic acid treatments in leaves and roots, the differences in gene expression among the analyzed libraries were examined, with DEGs identified via pairwise comparisons. On the basis of the fragments per kilobase million mapped reads (FPKM) values (adjusted p < 0.05 and |log2(fold-change)| > 1.0), 2100–11,490 DEGs were detected (Figure 2b). The relationships between different DEG groups were visualized using Venn diagrams (Figure 2f–h). For the pairwise comparisons, we focused on the organ as well as the herbicide treatment concentrations. Thus, 4919 and 4142 DEGs were revealed by the QL7_EG vs. QL7_CG and QR7_EG vs. QR7_CG comparisons, respectively, with 575 common DEGs among the comparisons. In addition, 3386 and 2100 DEGs were revealed by the QL14_EG vs. QL14_CG and QR14_EG vs. QR14_CG comparisons, respectively, with 200 common DEGs among the comparisons. Moreover, 5997 and 11,490 DEGs were revealed by the QL14_EG vs. QL7_EG and QR14_EG vs. QR7_EG comparisons, respectively, with 1592 common DEGs among the comparisons.
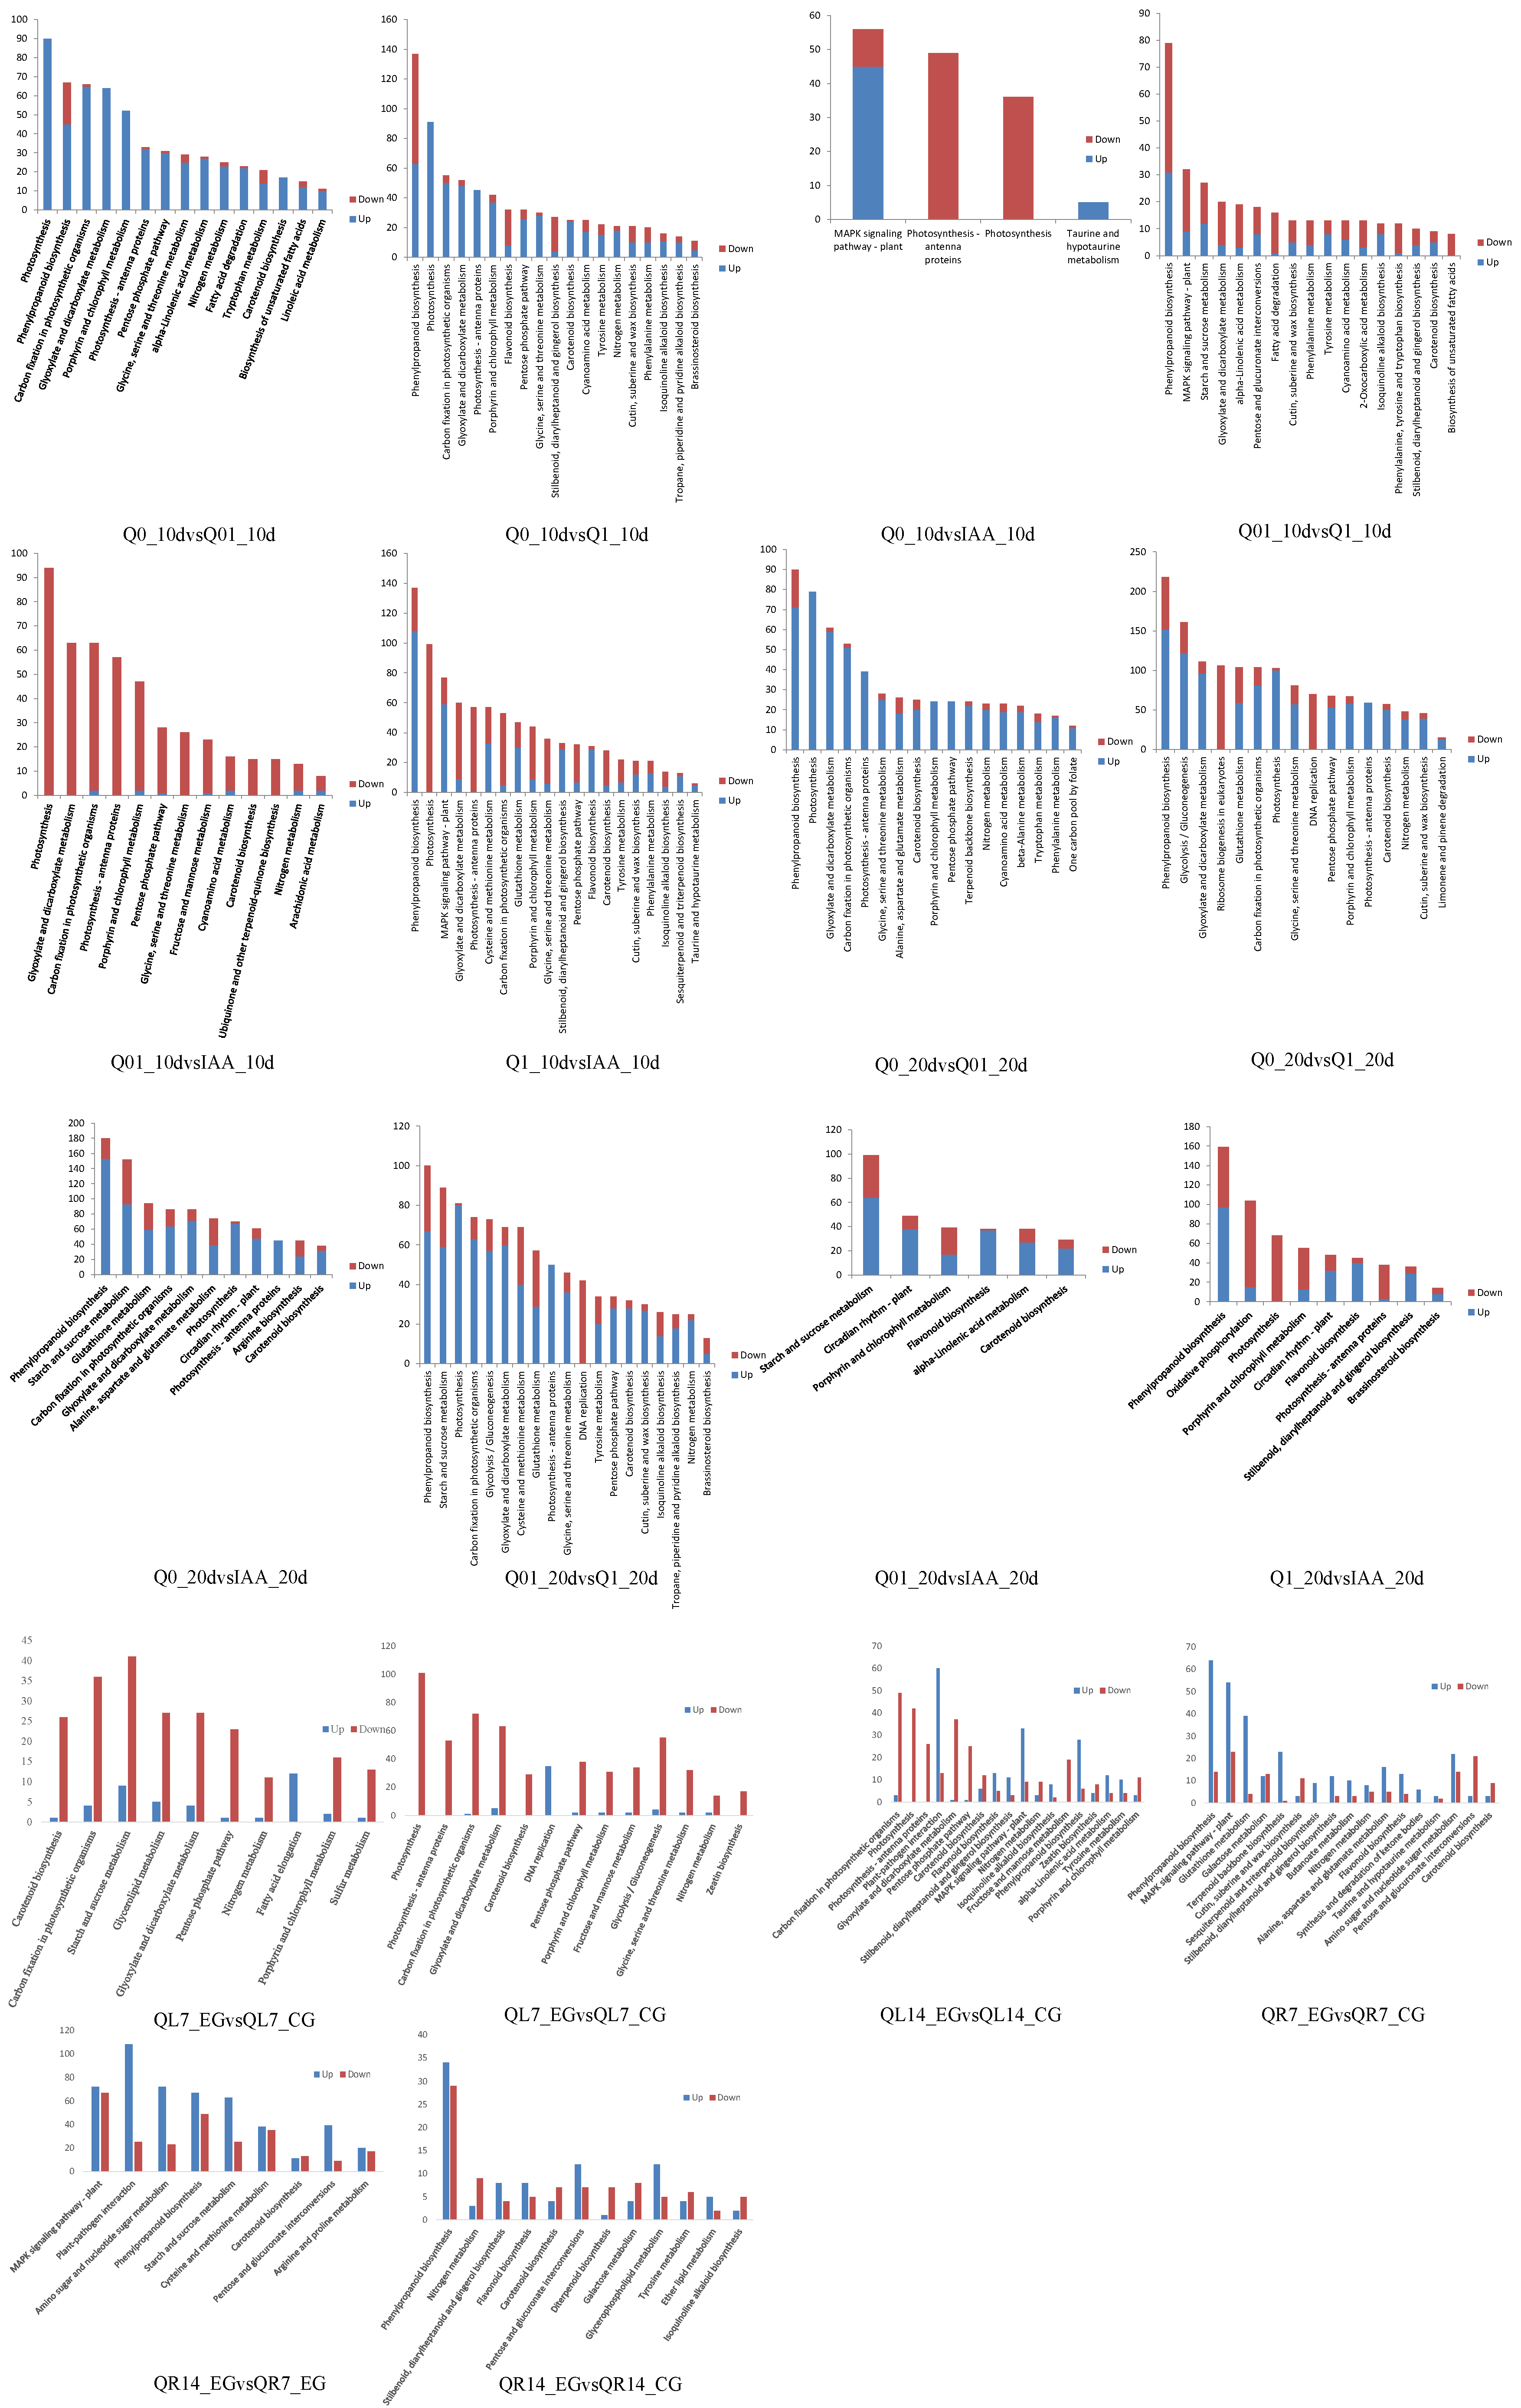
3.3. KEGG Pathway Enrichment Analysis
The significantly enriched KEGG pathways among the DEGs were determined (Figure 3), with the top three enriched pathways for the DEGs in each comparison analyzed further. The top three enriched KEGG pathways for the 10-day and 20-day treatments were similar (e.g., glyoxylate and dicarboxylate metabolism, phenylpropanoid biosynthesis, photosynthesis, porphyrin and chlorophyll metabolism, starch and sucrose metabolism, glycolysis/gluconeogenesis, and pyruvate metabolism). There were additional enriched KEGG pathways for the 10-day treatment (e.g., carbon fixation and MAPK signaling pathway) and 20-day treatment (e.g., circadian rhythm, glutathione metabolism, and oxidative phosphorylation). For almost all comparisons, many of the DEGs were associated with photosynthesis. In contrast, the top three enriched KEGG pathways for the root treatments are primarily associated with phenylpropanoid biosynthesis, the MAPK signaling pathway, and pitrogen metabolism. The top three enriched KEGG pathways for the leaf treatments concentrate on photosynthesis, ptarch and sucrose metabolism, and parotenoid biosynthesis.
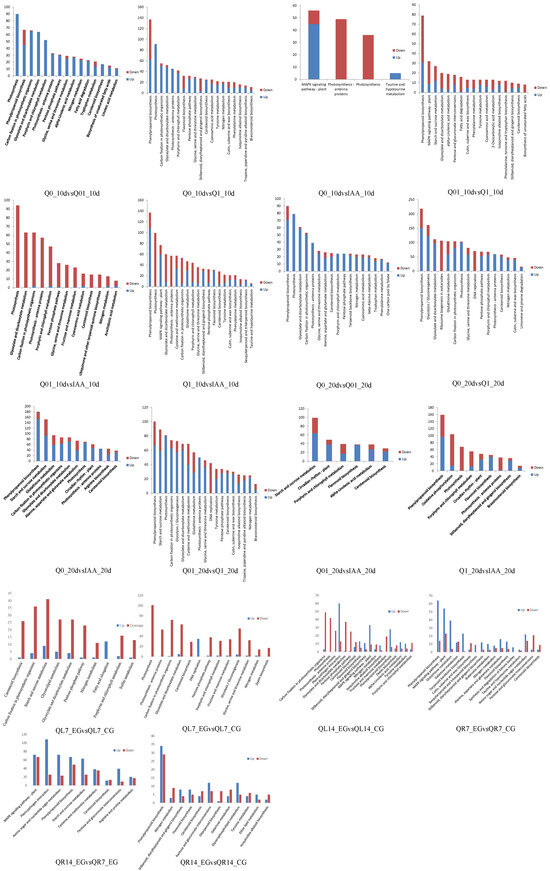
Figure 3.
KEGG analysis of DEGs.
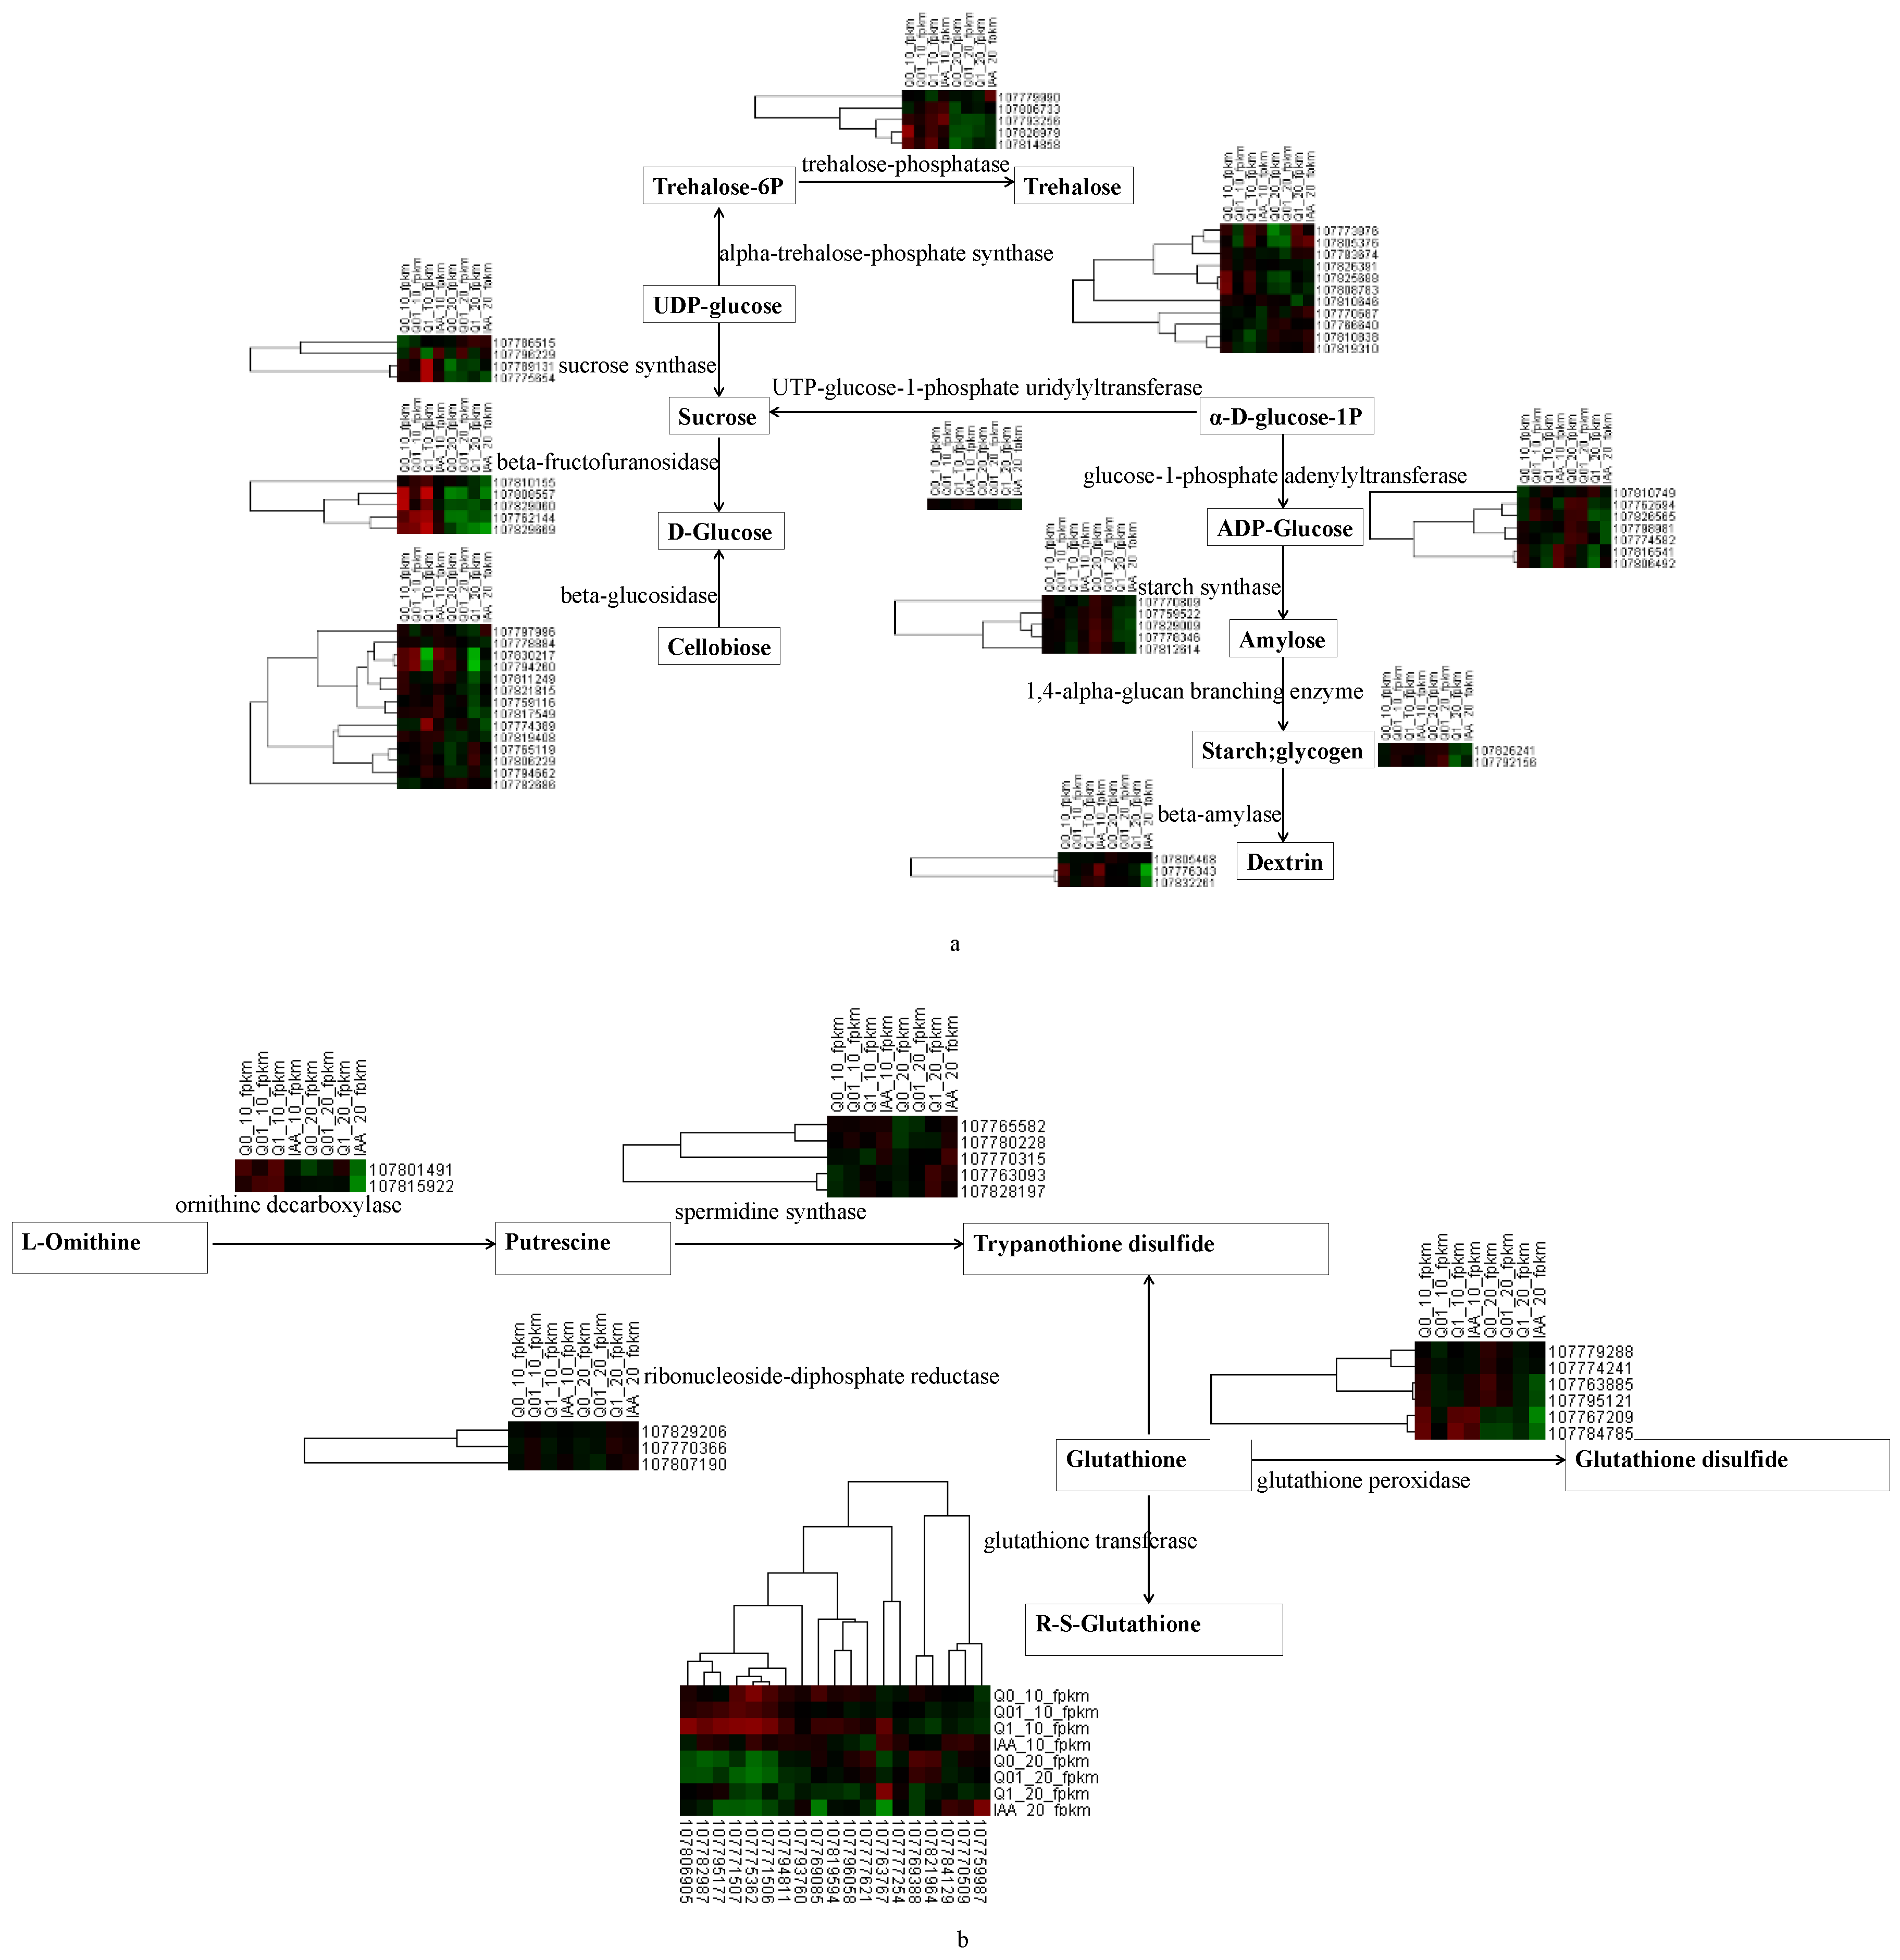
In terms of the biosynthetic pathways, starch and sucrose metabolism was analyzed further because of its importance for plant responses to hormone-type herbicides [20]. A map based on the KEGG pathway database and the DEGs was constructed. The following 10 key enzymes involved in starch and sucrose metabolism were identified, with notable changes in the expression of the corresponding genes: trehalose-phosphatase, alpha-trehalose-phosphate synthase, sucrose synthase, UTP-glucose-1-phosphate uridylyltransferase, beta-fructofuranosidase, glucose-1-phosphate adenylyltransferase, beta-glucosidase, starch synthase, 1,4-alpha-glucan branching enzyme, and beta-amylase (Figure 4a). Five starch synthase genes (107770809, 107759522, 107829009, 107778346, and 107812614) had relatively consistent expression patterns (i.e., continuous decrease as the dichloroquinolinic acid concentration increased). In contrast, five beta-fructofuranosidase genes (107810155, 107808557, 107829060, 107762144, and 107829669), which contribute to sucrose synthesis, had the opposite expression trends on days 10 and 20 of the treatment period.
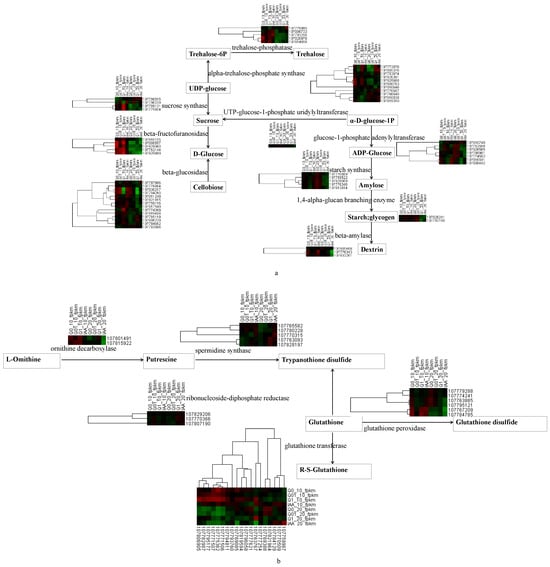
Figure 4.
Heat map showing the expression of key KEGG enzymes involved in the metabolism of starch/sucrose (a) and glutathione (b) in response to dichloroquinolinic acid/IAA treatment.
In terms of the DEGs associated with glutathione metabolism (Figure 4b), increases in the dichloroquinolinic acid concentration resulted in decreases in the expression of six glutathione peroxidase genes (107779288, 107774241, 107763885, 107767209, 107784785, and 107795121), but increases in the expression of five spermidine synthase genes (107765582, 107780228, 107763093, 107828197, and 107770315).
3.4. Rapid Systemic Transcriptional Response of Tobacco to Dichloroquinolinic Acid
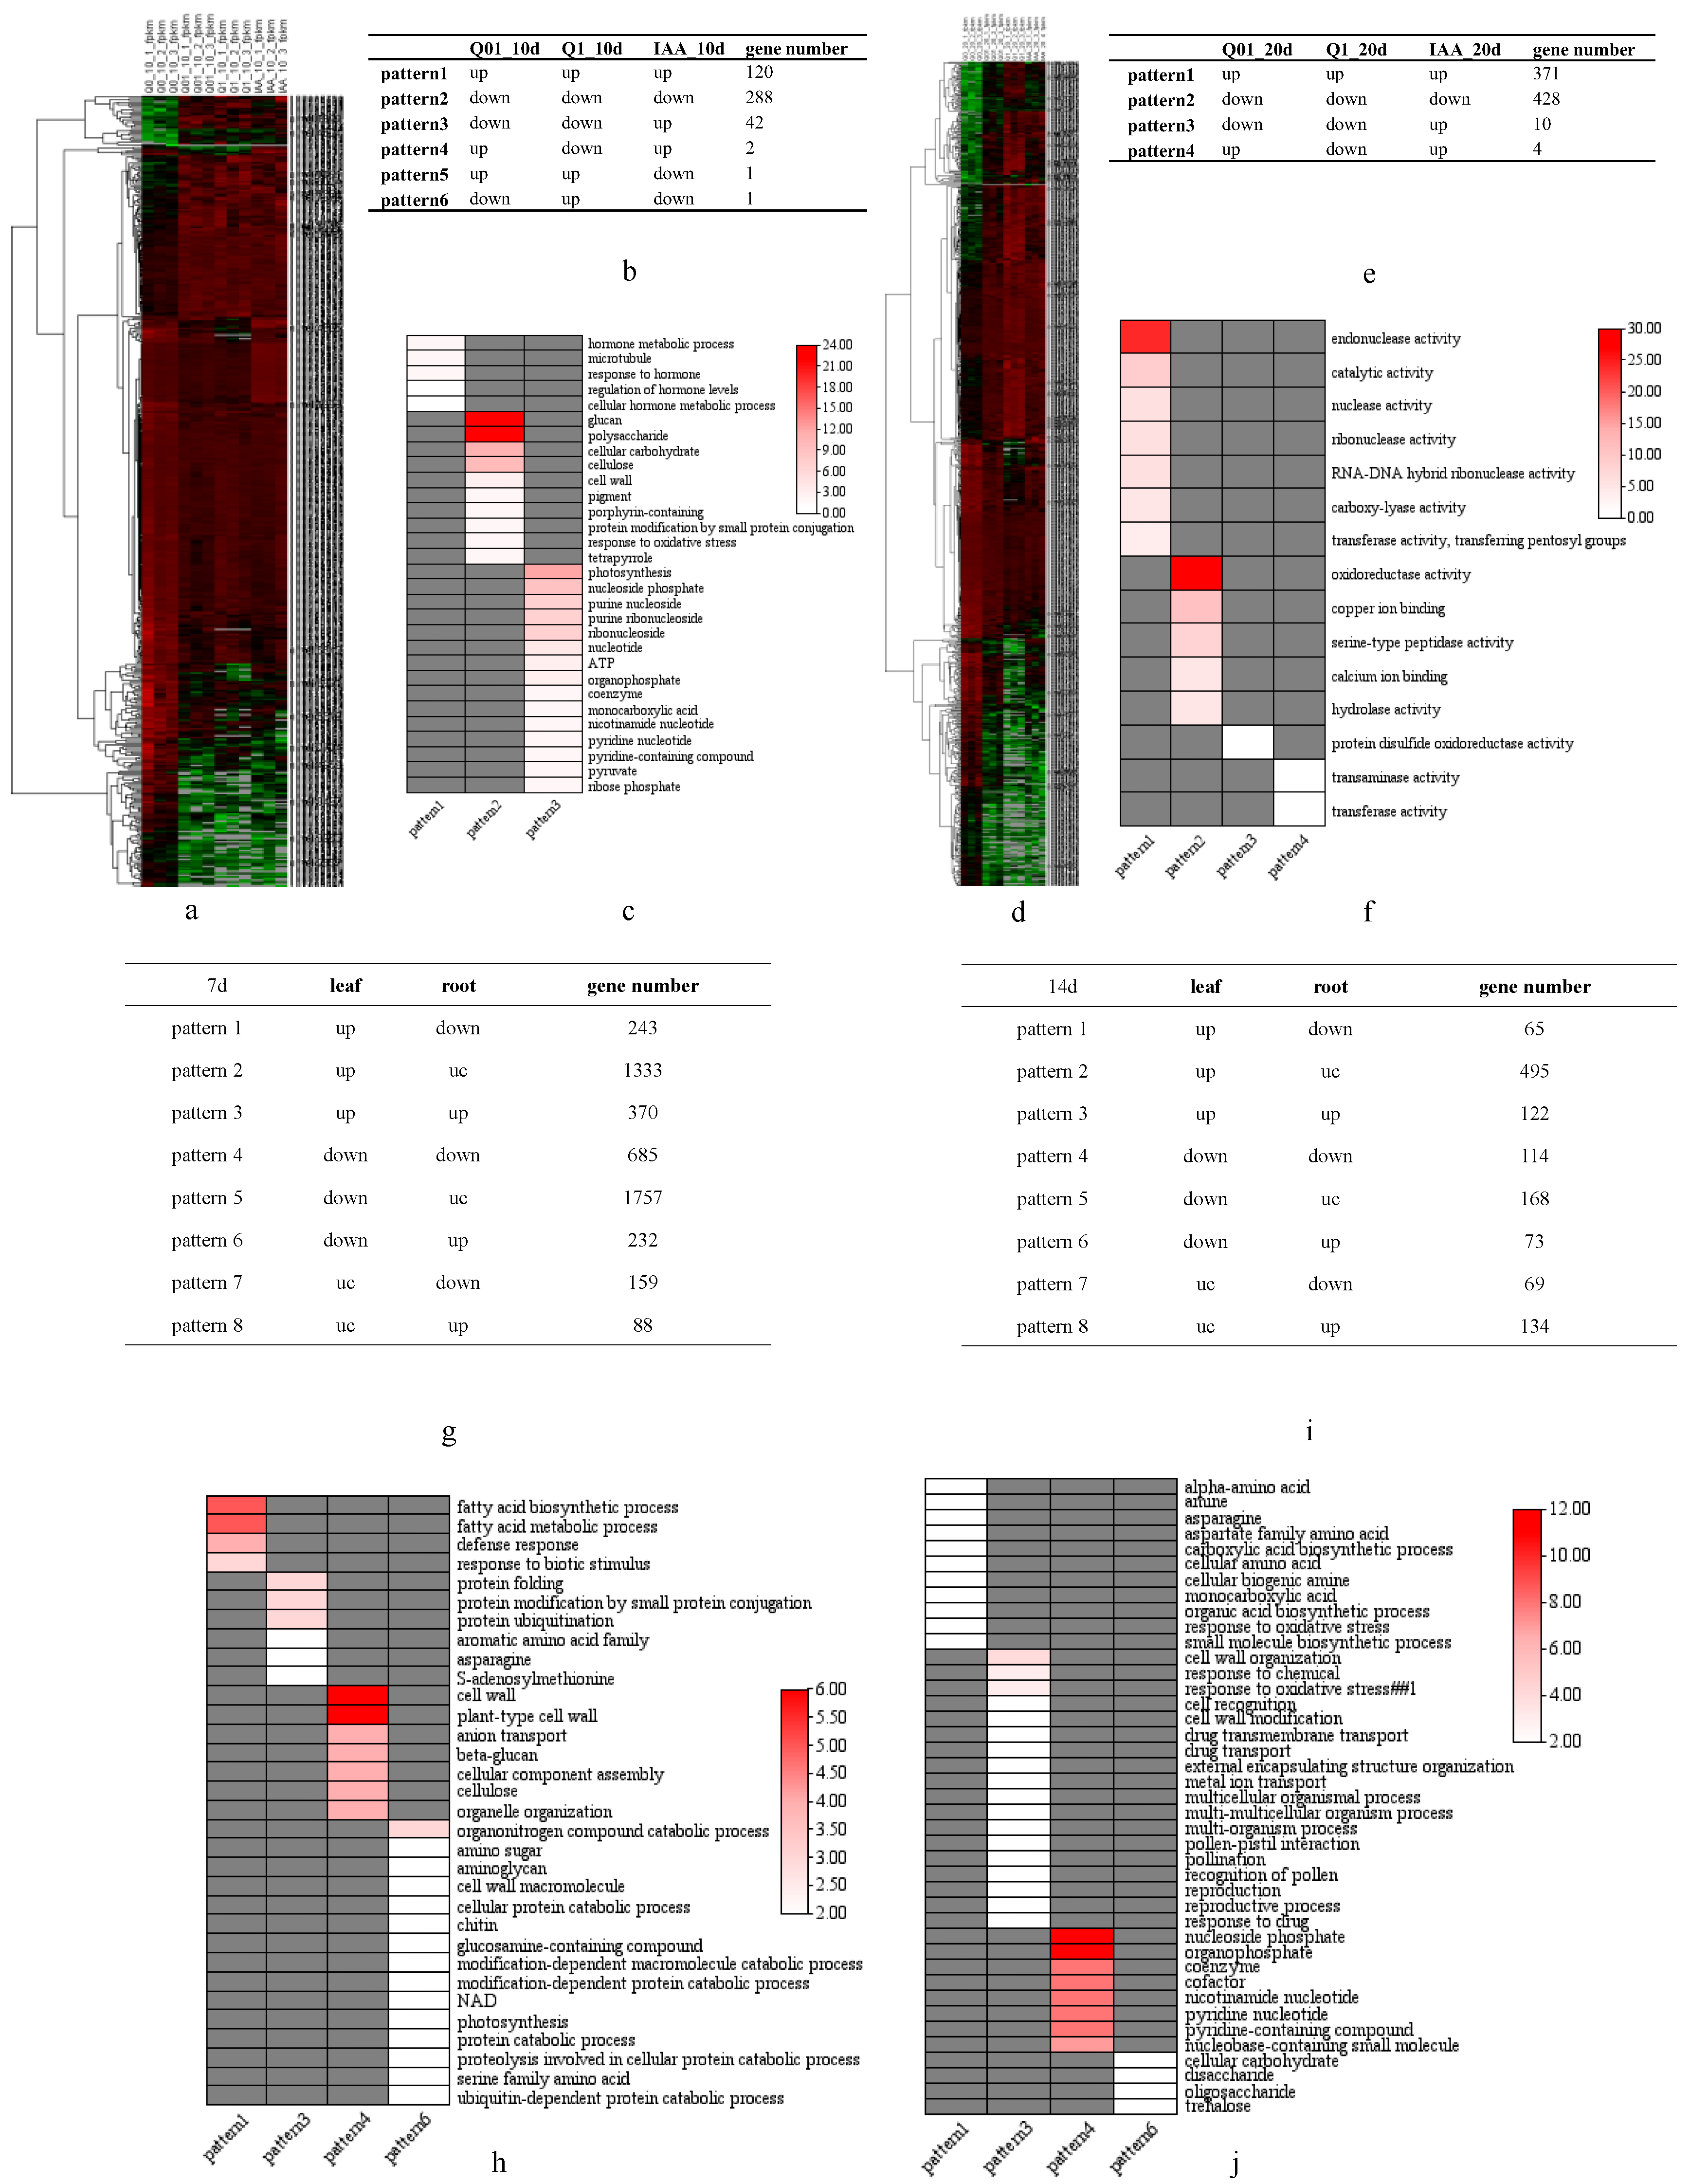
We performed transcriptional analyses using whole seedlings after 10-day and 20-day dichloroquinolinic acid treatments during the germination stage as well as the leaves and roots of plants after 7-day and 14-day dichloroquinolinic acid treatments at the seedling stage to investigate the systemic response of tobacco. For the germinating seeds treated with dichloroquinolinic acid, 454 and 813 genes were differentially expressed 10 and 20 days later (Supplemental Tables S2 and S3, respectively (adjusted p < 0.05 and |log2(fold-change)| > 1.0) (Figure 5a,d). The DEGs were further categorized on the basis of the up-regulated or down-regulated expression mode in response to various treatment concentrations (Figure 5b,e). The genes with up-regulated expression levels after treatments with different dichloroquinolinic acid and IAA concentrations (relative to the Q0_10d expression levels) were mostly involved in hormone responses, whereas the genes with down-regulated expression levels following the dichloroquinolinic acid and IAA treatments (relative to the Q0_10d expression levels) were mostly related to cell wall polysaccharides and cellulose. Interestingly, the genes with down-regulated and up-regulated expression trend following the dichloroquinolinic acid and IAA treatments, respectively, were mostly involved in photosynthesis (Figure 5c). These findings imply that dichloroquinolinic acid can inhibit the synthesis of cellulose as well as photosynthetic activities in tobacco, which is similar to the effects of herbicides known to target cellulose biosynthesis and photosynthesis. For the 20-day treatment, the genes with up-regulated or down-regulated expression levels in response to various treatments (relative to the Q0_20d expression levels) were mostly related to enzyme activities (Figure 5f). According to pattern3 in Figure 5c and pattern3 in Figure 5f, we speculate that dichloroquinolinic acid suppresses photosynthesis whereas high concentration IAA stimulates photosynthesis as well as nucleotide synthesis.

Figure 5.
Heatmap of DEGs after dichloroquinolinic acid/IAA treatment and KEGG analysis of DEGs with different expression patterns. (a) Heatmap of DEGs 10 days after dichloroquinolinic acid/IAA treatment for seeds; (b) number of DEGs with various expression patterns 10 days after dichloroquinolinic acid/IAA treatment for seeds; (c) KEGG of DEGs with various expression patterns 10 days after dichloroquinolinic acid/IAA treatment for seeds; (d) heatmap of DEGs 20 days after dichloroquinolinic acid/IAA treatment for seeds; (e) number of DEGs with various expression patterns 20 days after dichloroquinolinic acid/IAA treatment for seeds; (f) KEGG of DEGs with various expression patterns 20 days after dichloroquinolinic acid/IAA treatment for seeds; (g) number of DEGs with various expression patterns 7 days after dichloroquinolinic acid treatment for seedlings; (h) KEGG of DEGs with various expression patterns 7 days after dichloroquinolinic acid treatment for seedlings; (i) number of DEGs with various expression patterns 14 days after dichloroquinolinic acid treatment for seedlings; (j) KEGG of DEGs with various expression patterns 14 days after dichloroquinolinic acid treatment for seedlings.
A total of 4867 and 1240 DEGs (adjusted p < 0.05 and |log2(fold-change)| > 1.0) were detected 7 and 14 days after seedlings were treated, respectively (Supplemental Tables S4 and S5). The DEGs were categorized on the basis of their up-regulated or down-regulated expression trends in the examined tissues (Figure 5g,h). The genes with an up-regulated and down-regulated expression trend in the leaves and roots, respectively, were mostly related to fatty acids, defense responses, and amino acids (Figure 5h–j). In contrast to dichloroquinolinic acid, biosynthetic inhibitors can suppress amino acid production [21] and prevent fatty acid elongation [22]. The expression levels of genes related to glucose synthesis were down-regulated in the leaves, but up-regulated in the roots, which is in accordance with the previously reported increases in the sugar contents of potato tubers and sugar beet roots following herbicide treatments [23].
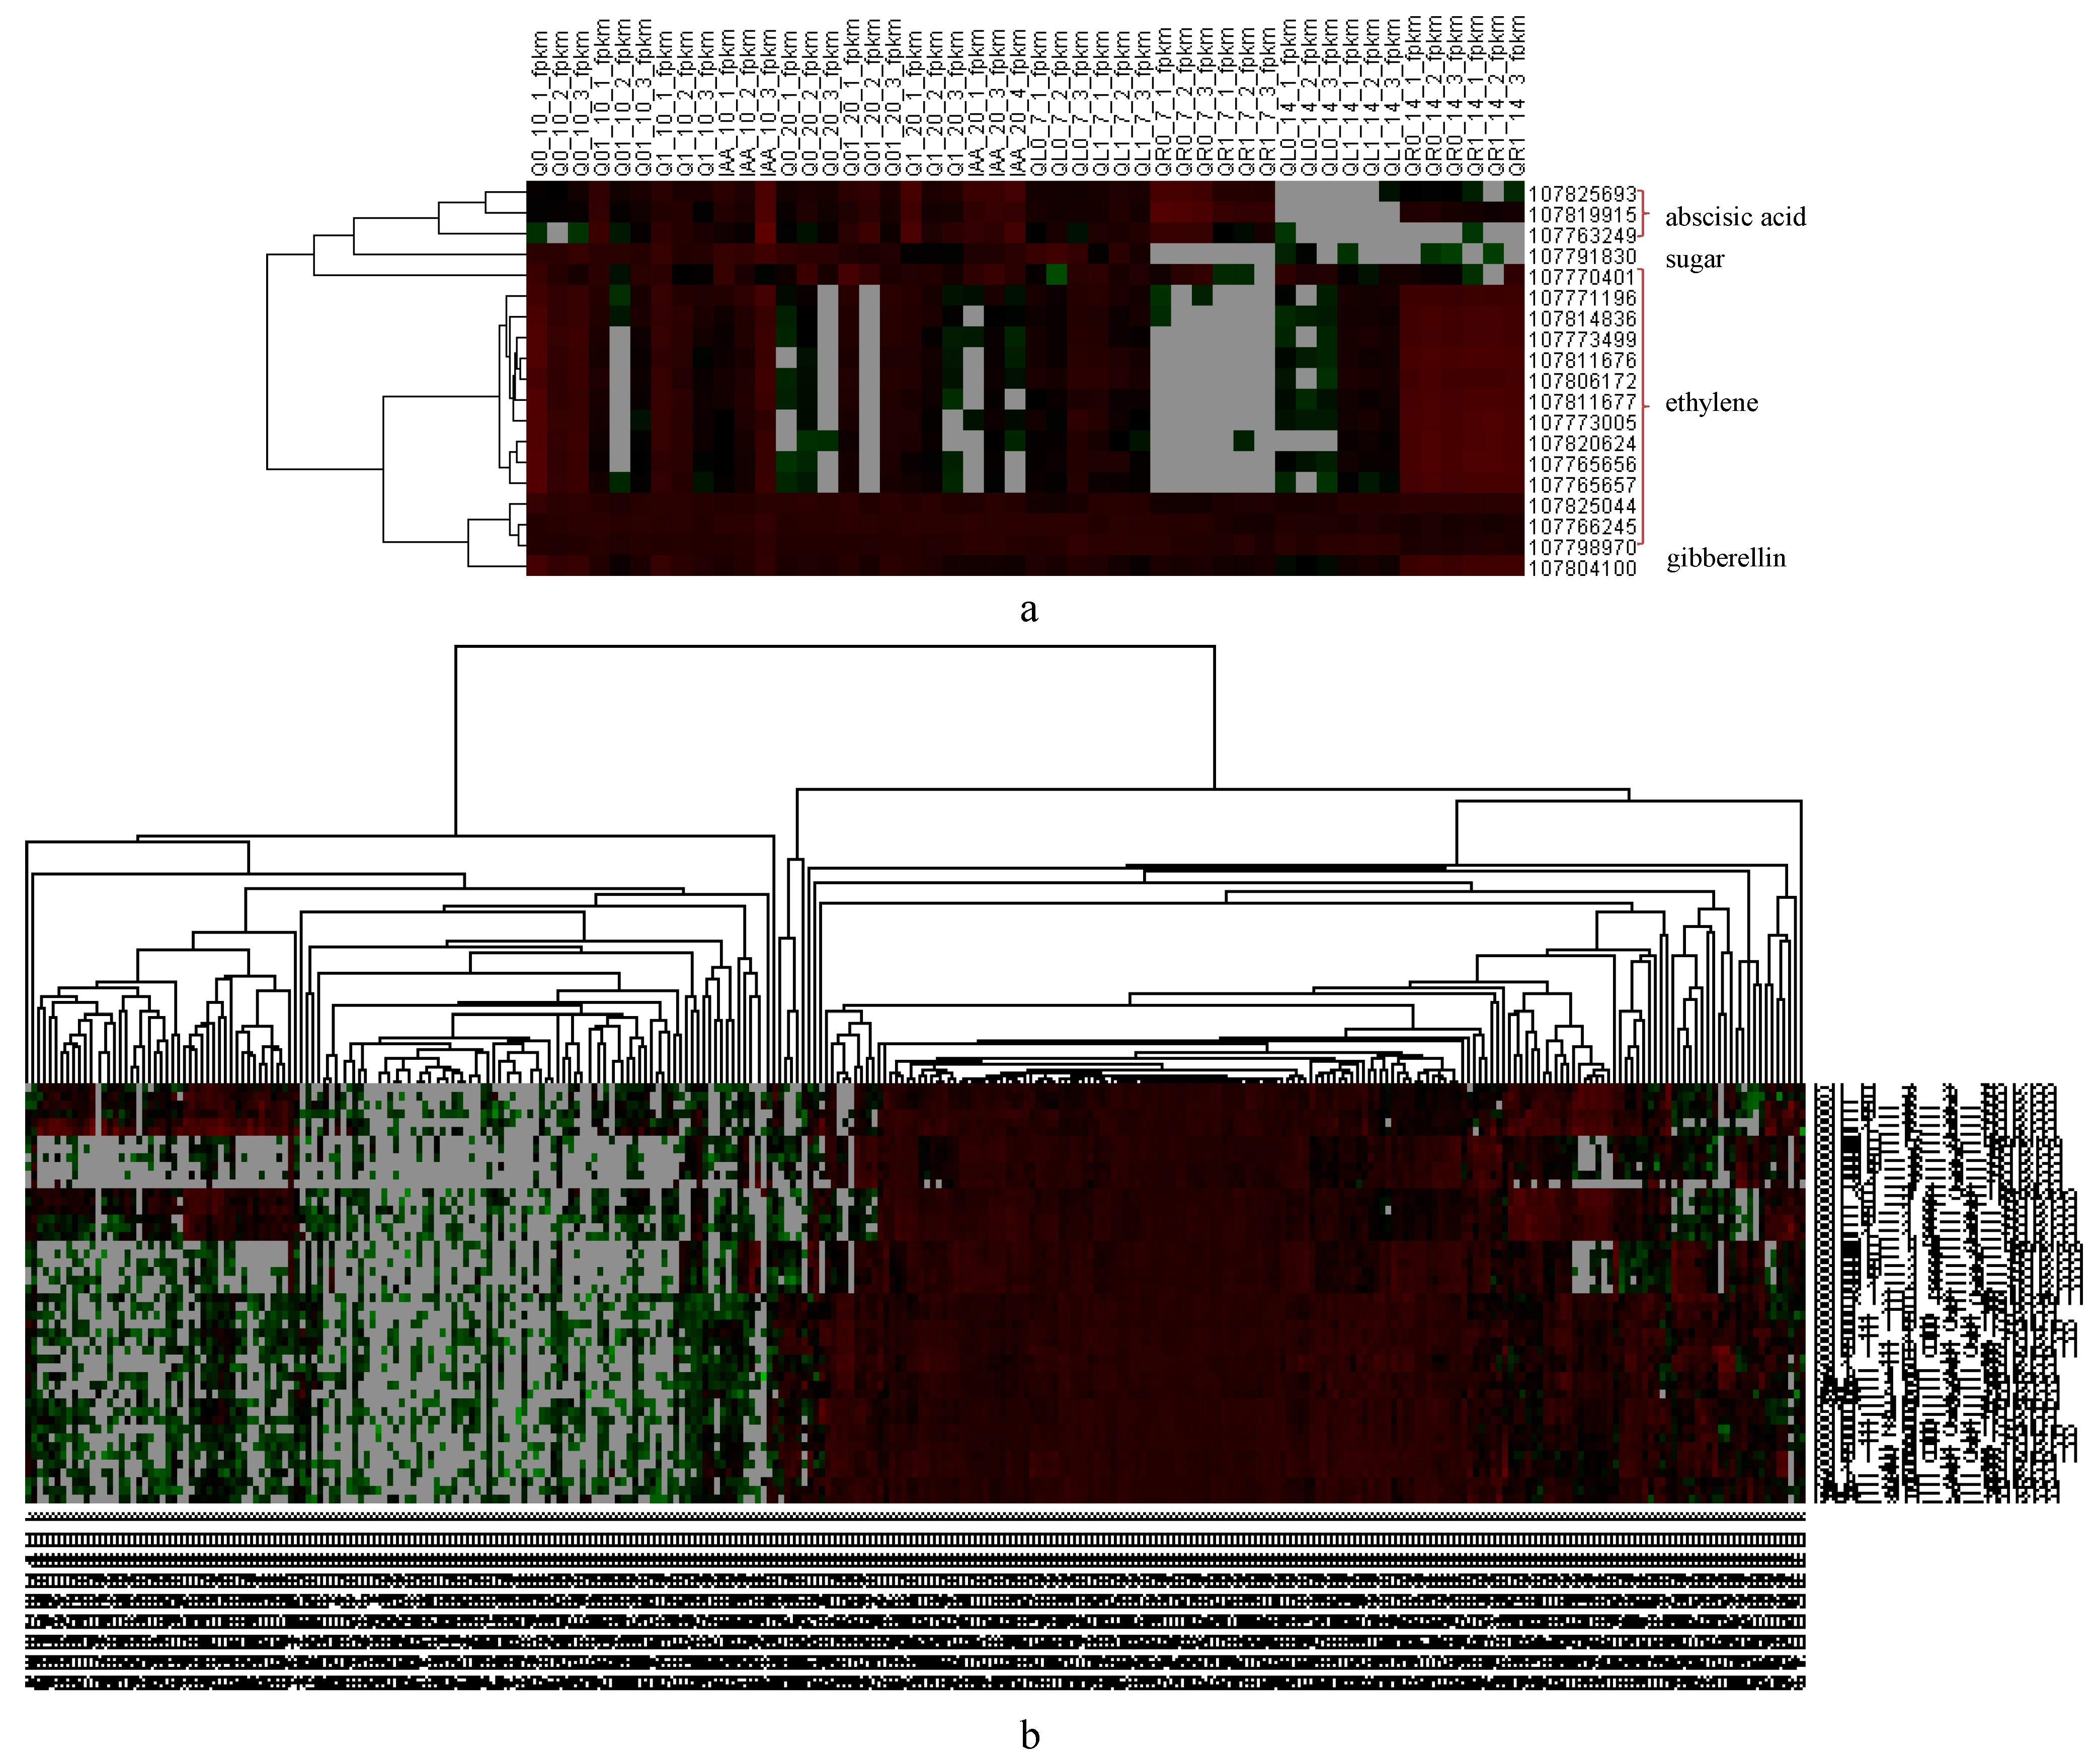
3.5. Significant Changes in Hormone-Related Gene Expression
A dichloroquinolinic acid treatment can substantially increase the abscisic acid, salicylic acid, and jasmonic acid levels in barnyard grass [24]. Similarly, in the current study, the DEGs included many genes responsive to hormones, including gibberellins, ethylene, and abscisic acid, as well as gene-encoding sugar transporters (Figure 6a).
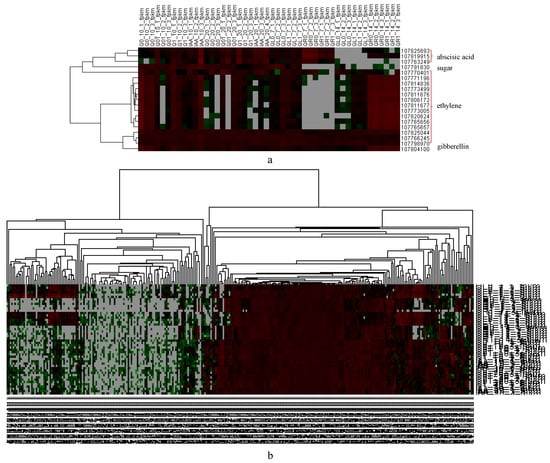
Figure 6.
Heatmap of hormone-related DEGs. (a) Heatmap of representative DEGs related with hormones; (b) heatmap of IAA-related DEGs.
The application of dichloroquinolinic acid, which is an auxin herbicide, altered the expression of 305 IAA-related genes (Figure 6b, Supplemental Table S6), among which, four gene-encoding auxin-responsive proteins (two IAA1-like, one IAA28-like, and one IAA33-like) had continuously up-regulated expression levels (relative to the expression levels in the controls that were not treated with dichloroquinolinic acid or IAA). A previous study demonstrated that the 2,4-D resistance of Sisymbrium orientale is due to an in-frame deletion of 27 nucleotides in SoIAA2, which encodes an auxin co-receptor [25].
These observations suggest that the delayed tobacco development following auxin herbicide treatments may be mainly associated with the up-regulated production of IAA receptors. Hence, IAA receptors should be the focus of future research on the mechanism mediating the resistance of tobacco to dichloroquinolinic acid.
3.6. Verification of Gene Expression via qRT-PCR
To verify the DEGs identified by RNA-seq, we performed a qRT-PCR analysis of 12 selected DEGs, including four hormone-inducible genes (107773639, 107766245, 107773505, and 107825693), two secondary metabolism-related genes (107825967 and 107794305), and one stress response-related gene (107782725). The qRT-PCR data for these genes were consistent with the RNA-seq data (Figure 7).
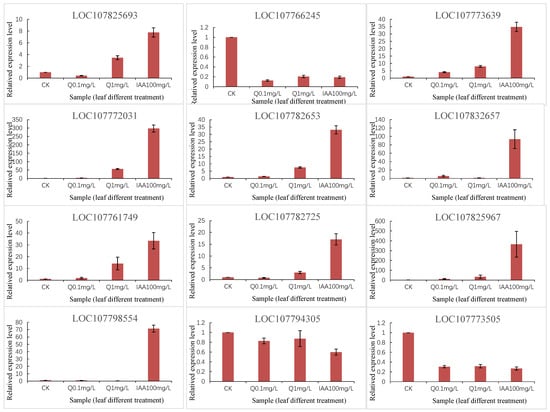
Figure 7.
qRT-PCR validation of representative DEGs.
3.7. Verification of Dichloroquinolinic Acid Resistance in IAA-Related Gene Editing Plants
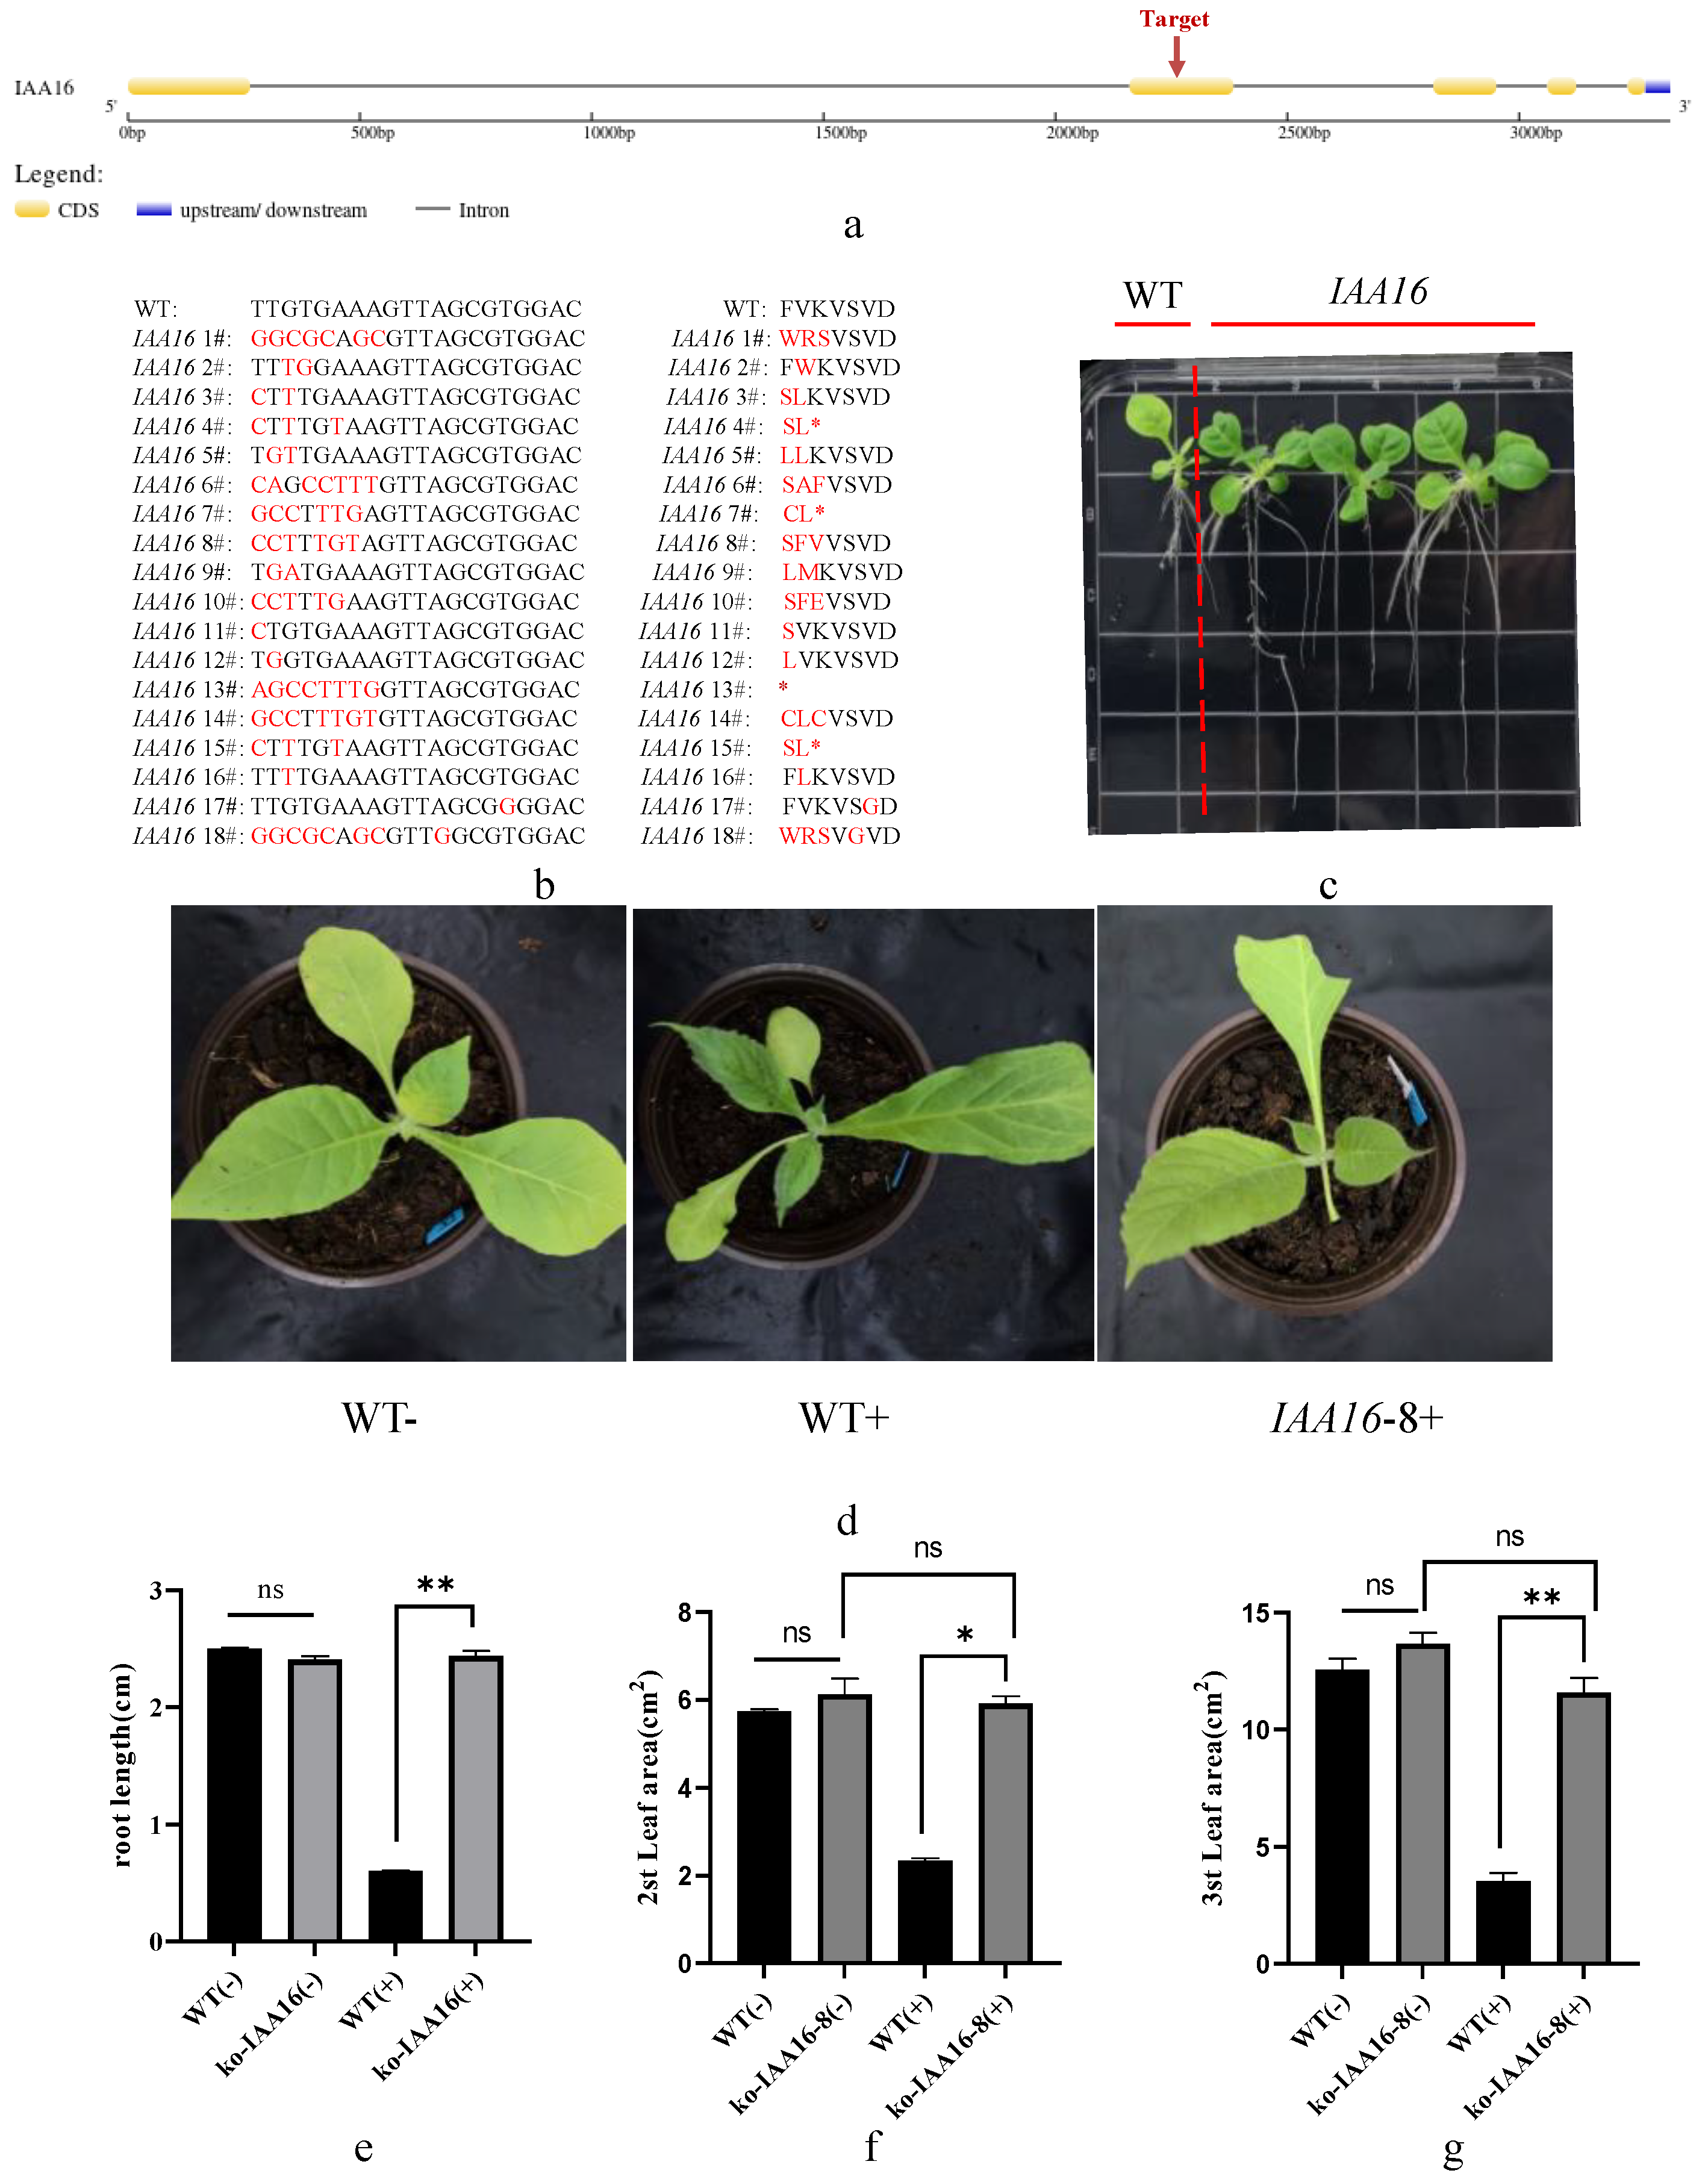
Previous research showed that the 2,4-D resistance of Sisymbrium orientale is caused by an in-frame deletion of 27 nucleotides in SoIAA2, which is also present in tobacco NtIAA2. Sequence comparison results showed that IAA16 does not have nucleotide deletion at the same site (Supplemental Figure S1), so we chose it as the editing target. This allowed us to confirm that the recognition site of dichloroquinolinic acid is distinct from that of 2,4-D and to confirm that the tobacco IAA-related genes are viable options for dichloroquinolinic acid resistance. We selected IAA16 for gene editing and examined the T1 generation edited material for traits indicative of resistance to the dichloroquinolinic acid. We selected the target site on the second exon of IAA16 (Figure 8a) for editing and obtained 18 edit types in the T1 generation of edited material (Figure 8b). We discovered that the T1 generation of the IAA16 edited material exhibited a longer root system than the control on a medium containing dichloroquinolinic acid (Figure 8c), we chose IAA16-8, one of the homozygous strains, for potting experiments. The findings demonstrated that in contrast to the control, the IAA16-8 edited material had normal leaves following the application of dichloroquinolinic acid (IAA16-8+), while the control plants displayed normal leaf growth prior to the application of dichloroquinolinic acid (WT−) and new leaf deformity and leaf narrowing following the application (WT+). Measurements of root length and leaf area in control and edited material further confirmed these findings (Figure 8e–g). The expression of genes involved in photosynthesis (107779077, 107824520), β-fructofuranosidase genes involved in sucrose synthesis (107810155, 107808557), and starch synthase genes (107770809, 107759522) were significantly up-regulated, as revealed by fluorescence quantitative PCR of representative genes in the edited and control materials (Supplemental Figure S2). This finding offers an explanation for the development of dichloroquinolinic acid resistance in the edited material. It is confirmed by the data that IAA-related genes may be potential candidates for tobacco resistance to dichloroquinolinic acid. According to earlier research, SoIAA2 lacks a 27 bp region, which prevents the hormone herbicide 2,4-D from binding to TIR1 and causes Sisymbrium orientale to become resistant to the herbicide. The resistance to dichloroquinolinic acid in tobacco was caused by a 7 bp mutation that was created in this study by editing IAA16. This suggests that since 2,4-D and dichloroquinolinic acid are both hormone herbicides and have different target sites; more research into the protein structure and molecular mechanism is required.
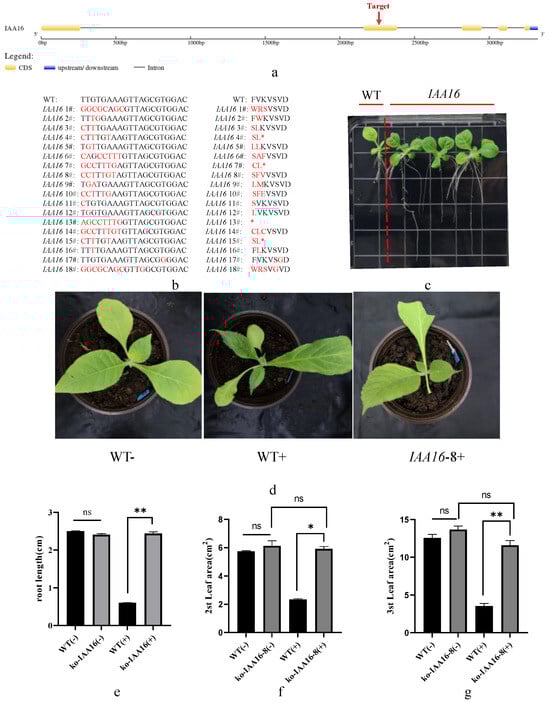
Figure 8.
Types of sequence variation and dichloroquinolinic acid resistance in IAA16 gene-editing plants. (a) The primary structure pattern and target site of IAA16 nucleotide sequence; (b) sequence analysis of T1 generation of IAA16 edited plants; (c) root development of control and T1 generation IAA16 edited plants on medium containing 0.2 mg/L dichloroquinolinic acid after 14 days after sowing; (d) phenotypes of control plants and T1 generation IAA16 edited plants 28 days after sowing and transplanted to soil containing 1 mg/L dichloroquinolinic acid for 14 days; (e) root length of control and T1 generation IAA16 edited plants on medium containing 0.2 mg/L dichloroquinolinic acid 14 days after sowing; (f) leaf area of the second leaves of control plants and T1 generation IAA16 edited plants 28 days after sowing and transplanted to soil containing 1 mg/L dichloroquinolinic acid for 14 days; (g) leaf area of the third leaves of control plants and T1 generation IAA16 edited plants 28 days after sowing and transplanted to soil containing 1 mg/L dichloroquinolinic acid for 14 days; “−” indicates dichloroquinolinic acid was not applied and “+” indicates dichloroquinolinic acid was applied. * represents p-value less than 0.05 and ** represents p-value less than 0.01. ns represents no significant difference, * in (b) stands for stop codon.
4. Discussion
The symptoms of plants treated with the common hormone-type herbicide dichloroquinolinic acid are similar to those caused by excessive IAA levels. More specifically, decreases in cell development, internode extension, and leaf and stem growth as well as extensive chlorosis and necrosis are the harmful effects of an exposure to high concentrations of dichloroquinolinic acid [26]. There are two theories regarding the mechanism of action of dichloroquinolinic acid. First, it inhibits cell wall biosynthesis [27]. Second, it adversely affects plant growth via processes that are influenced by ethylene and cyanide concentrations in plants as well as the 1-aminocyclopropane-1-carboxylic acid synthase activity [28]. Our transcriptome analysis revealed that under quinolinic acid stress conditions, the expression levels of genes related to cell wall polysaccharides and cellulose, photosynthesis, carbon fixation, and porphyrin metabolism were down-regulated in tobacco seedlings. Photosynthetic activities lead to increases in plant biomass via carbon fixation and the Calvin cycle. We hypothesize that dichloroquinolinic acid can quickly inhibit photosynthesis and disrupt cell wall formation in tobacco seedlings, thereby suppressing the initial plant growth and development.
When plants are subjected to abiotic and biotic stresses, the starch synthase activity and starch content decrease, whereas the glucose content increases [29]. These changes may be related to starch hydrolysis, which enhances the plant osmotic pressure in response to external stresses [30]. According to our transcriptome analysis of tobacco seedlings treated with dichloroquinolinic acid, sucrose synthase gene expression levels decreased, but β-fructofuranosidase gene expression levels increased, leading to a decrease in the starch content and an increase in the glucose content. Hence, the application of hormone-type herbicides can inhibit photosynthesis, while also restricting the storage of energy (e.g., as starch) in tobacco seedlings.
Glutathione, which is one of the main components of the plant defense system, is involved in many detoxification mechanisms. For example, glutathione S-transferase (GST) can detoxify herbicides by catalyzing the formation of herbicide conjugates [31]. Increasing the GST level reportedly improves the herbicide tolerance of various crops, including maize and rice [32,33,34]. We speculated that increases in the GST level are important for the detoxification of herbicides. By analyzing our transcriptome data, we identified 19 candidate genes encoding GSTs with significant changes in expression (Figure 5). With the exception of five genes (107777254, 107763767, 107795177, 107782987, and 107806905), the expression of these genes decreased as the dichloroquinolinic acid concentration increased. Comprehensive investigations into these candidate genes may generate valuable insights into tobacco resistance to herbicides.
The changes in DEG expression induced by dichloroquinolinic acid were not completely consistent with those caused by IAA. The main consequence of these differences was that high IAA concentrations promoted photosynthesis and nucleotide synthesis, whereas dichloroquinolinic acid had the opposite effect on these processes (Figure 5c,f). Earlier research showed that an exogenous auxin application can significantly increase photosynthetic activities [35], suggesting that even though dichloroquinolinic acid is a hormone-type herbicide, the mechanism underlying its toxicity to tobacco differs from that of high IAA concentrations. Although high concentrations of dichloroquinolinic acid and IAA have detrimental effects on plant cell wall formation, their effects on photosynthesis differ. The molecular basis of this difference will need to be investigated.
Tobacco can become resistant to dichloroquinolinic acid (DQA) by editing the appropriate target site of IAA-responsive genes. The experimental results showed that different hormone herbicides have different target sites, so further study of the target site’s protein structure and action site may be useful in creating more herbicide-resistant materials.
5. Conclusions
In summary, we analyzed the transcriptome-level changes in tobacco seedlings treated with different concentrations of dichloroquinolinic acid and IAA. The results indicate that dichloroquinolinic acid restricts seedling growth primarily by inhibiting photosynthesis, glutathione regulation, chlorophyll synthesis, sucrose and starch metabolism, and other important pathways. Notably, the toxic effects of high concentrations of dichloroquinolinic acid and IAA are mediated by different mechanisms. More importantly, dichloroquinolinic acid-resistant tobacco can be obtained by editing the appropriate target sites of IAA-responsive genes. These findings will help elucidate the mechanisms protecting tobacco plants from herbicides, which may ultimately lead to improved methods for enhancing tobacco herbicide resistance.
Supplementary Materials
The following supporting information can be downloaded at https://www.mdpi.com/article/10.3390/agronomy14071364/s1, Table S1. Sequencing output statistics; Table S2. List of differentially expressed genes 10 days after dichloroquinolinic acid treatments for the germinating seeds; Table S3. List of differentially expressed genes 20 days after dichloroquinolinic acid treatments for the germinating seeds; Table S4. List of differentially expressed genes 7 days after dichloroquinolinic acid treatments for the seedlings; Table S5. List of differentially expressed genes 14 days after dichloroquinolinic acid treatments for the seedlings; Table S6. List of IAA-related genes. Figure S1. Sequence comparison of NtIAA16 and NtIAA2. The red dotted box indicates in-frame deletion sites leading to the 2,4-D resistance. Figure S2. Differential expression of representative genes in control and edited plants.
Author Contributions
Methodology, B.L.; Software, B.L. and J.L.; Validation, B.L. and W.W.; Formal analysis, J.L.; Investigation, B.L. and A.D.; Resources, M.C.; Writing—original draft, J.L.; Writing—review & editing, J.L.; Supervision, Y.S. and C.D.; Project administration, C.D.; Funding acquisition, J.L. All authors have read and agreed to the published version of the manuscript.
Funding
The Agricultural Science and Technology Innovation Program (ASTIP-TRIC02). China Tobacco Genome Project [110202101036 (JY-13)]. China Tobacco Genome Project [110202201006 (JY-06)]. China Tobacco Genome Project [110202201009 (JY-09)]. Natural Science Foundation of Shandong Province (ZR2023QC159). Key Laboratory of Tobacco Pest Monitoring and Integrated Management (KLTPMIMT2022-03).
Data Availability Statement
The original contributions presented in the study are included in the article/Supplementary Material, further inquiries can be directed to the corresponding author.
Conflicts of Interest
The authors declare no conflict of interest.
References
- Wang, J.; Lv, M.; Islam, F.; Gill, R.A.; Yang, C.; Ali, B.; Zhou, W. Salicylic acid mediates antioxidant defense system and ABA pathway related gene expression in Oryza sativa against quinclorac toxicity. Ecotoxicol. Environ. Saf. 2016, 133, 146–156. [Google Scholar] [CrossRef] [PubMed]
- Lovelace, M.L.; Hoagland, R.E.; Talbert, R.E.; Scherder, E.F. Influence of Simulated Quinclorac Drift on the Accumulation and Movement of Herbicide in Tomato (Lycopersicon esculentum) Plants. J. Agric. Food Chem. 2009, 57, 6349–6355. [Google Scholar] [CrossRef] [PubMed]
- Sunohara, Y.; Matsumoto, H. Quinclorac-induced cell death is accompanied by generation of reactive oxygen species in maize root tissue. Phytochemistry 2008, 69, 2312–2319. [Google Scholar] [CrossRef] [PubMed]
- Sunohara, Y.; Matsumoto, H. Comparative Physiological Effects of Quinclorac and Auxins, and Light Involvement in Quinclorac-Induced Chlorosis in Corn Leaves. Pestic. Biochem. Physiol. 1997, 58, 125–132. [Google Scholar] [CrossRef]
- Vignola, M.D.; Sainz, M.; Saldain, N.E.; Marchesi, C.; Bonnecarrère, V.; Gadea, P.D. Limited induction of ethylene and cyanide synthesis are observed in quinclorac-resistant barnyardgrass (Echinochloa crus-galli) in Uruguay. Weed Sci. 2020, 68, 348–357. [Google Scholar] [CrossRef]
- Song, D.; Jiang, X.; Wang, D.; Fang, S.; Zhou, H.; Kong, F. From the effective herbicide to the environmental contaminant: A review of recent studies on quinclorac. Environ. Exp. Bot. 2022, 193, 104706. [Google Scholar] [CrossRef]
- Li, B.; Wang, L.; Song, Q.; Xu, P.; Lv, J.; Cui, M.; Sun, Y.; Dai, C. Screening and Identification of Quinclorac Resistance Lines in Tobacco. Chin. Tob. Sci. 2022, 43, 9–14. [Google Scholar] [CrossRef]
- Zhang, Q.; Guo, W.; Song, C.; Guan, Z.; Wang, J.; Mou, S.; Wang, G.; Li, Y. Degradation Dynamics of Quinclorac and its Influencing Factors in Four Soils. Chin. Tob. Sci. 2013, 34, 83–88. [Google Scholar]
- Kohlhase, D.R.; O’rourke, J.A.; Owen, M.D.K.; Graham, M.A. Using RNA-seq to characterize responses to 4-hydroxyphenylpyruvate dioxygenase (HPPD) inhibitor herbicide resistance in waterhemp (Amaranthus tuberculatus). BMC Plant Biol. 2019, 19, 182. [Google Scholar] [CrossRef]
- Baek, Y.S.; Goodrich, L.V.; Brown, P.J.; James, B.T.; Moose, S.P.; Lambert, K.N.; Riechers, D.E. Transcriptome Profiling and Genome-Wide Association Studies Reveal GSTs and Other Defense Genes In-volved in Multiple Signaling Pathways Induced by Herbicide Safener in Grain Sorghum. Front. Plant Sci. 2019, 10, 192. [Google Scholar] [CrossRef]
- Rangani, G.; Rouse, C.E.; Saski, C.; Noorai, R.E.; Shankar, V.; Lawton-Rauh, A.L.; Werle, I.S.; Roma-Burgos, N. High Resistance to Quinclorac in Multiple-Resistant Echinochloa colona Associated with Elevated Stress Tolerance Gene Expression and Enriched Xenobiotic Detoxification Pathway. Genes 2022, 13, 515. [Google Scholar] [CrossRef]
- Wright, A.A.; Sasidharan, R.; Koski, L.; Rodriguez-Carres, M.; Peterson, D.G.; Nandula, V.K.; Ray, J.D.; Bond, J.A.; Shaw, D.R. Transcriptomic changes in Echinochloa colona in response to treatment with the herbicide imazamox. Planta 2018, 247, 369–379. [Google Scholar] [CrossRef]
- Zhang, D.; Li, X.; Bei, F.; Jin, T.; Jia, S.; Bu, R.; Liu, W. Investigating the Metabolic Mesosulfuron-Methyl Resistance in Aegilops tauschii Coss. by Transcriptome Sequencing Combined with the Reference Genome. J. Agric. Food Chem. 2022, 70, 11429–11440. [Google Scholar]
- Casey, A.; Köcher, T.; Caygill, S.; Champion, C.; Bonnot, C.; Dolan, L. Transcriptome changes in chlorsulfuron-treated plants are caused by acetolactate synthase inhibition and not induction of a herbicide detoxification system in Marchantia polymorpha. bioRxiv 2022. bioRxiv:2022.08.31.505973. [Google Scholar] [CrossRef] [PubMed]
- Zhang, Y.; Park, C.; Bennett, C.; Thornton, M.; Kim, D. Rapid and accurate alignment of nucleotide conversion sequencing reads with HISAT-3N. Genome Res. 2021, 31, 1290–1295. [Google Scholar] [CrossRef] [PubMed]
- Love, M.I.; Huber, W.; Anders, S. Moderated estimation of fold change and dispersion for RNA-seq data with DESeq2. Genome Biol. 2014, 15, 550. [Google Scholar] [CrossRef]
- Wu, T.; Hu, E.; Xu, S.; Chen, M.; Guo, P.; Dai, Z.; Feng, T.; Zhou, L.; Tang, W.; Zhan, L.; et al. clusterProfiler 4.0: A universal enrichment tool for interpreting omics data. Innovation 2021, 2, 100141. [Google Scholar] [CrossRef]
- Damgaard, M.V.; Treebak, J.T. Protocol for qPCR analysis that corrects for cDNA amplification efficiency. STAR Protoc. 2022, 3, 101515. [Google Scholar] [CrossRef]
- Li, B.; Shang, Y.; Wang, L.; Lv, J.; Wang, F.; Chao, J.; Mao, J.; Ding, A.; Wu, X.; Cui, M.; et al. Highly efficient multiplex genome editing in dicots using improved CRISPR/Cas systems. bioRxiv 2022. [Google Scholar] [CrossRef]
- Miyazawa, Y.; Kutsuna, N.; Inada, N.; Kuroiwa, H.; Kuroiwa, T.; Yoshida, S. Dedifferentiation of starch-storing cultured tobacco cells: Effects of 2,4-dichlorophenoxy acetic acid on multiplication, starch content, organellar DNA content, and starch synthesis gene expression. Plant Cell Rep. 2002, 21, 289–295. [Google Scholar] [CrossRef]
- Baldwin, A.; Rogers, H.J.; Francis, D.; Harwood, J.L. Fatty acid elongation is important in the activity of thiocarbamate herbicides and in safening by dichlormid. J. Exp. Bot. 2003, 54, 1289–1294. [Google Scholar] [CrossRef]
- Chen, S.; Chen, H.; Chen, Z.; Wen, Y.; Liu, W. Enantioselective Phytotoxic Disturbances of Fatty Acids in Arabidopsis thaliana by Dichlorprop. Environ. Sci. Technol. 2019, 53, 9252–9259. [Google Scholar] [CrossRef] [PubMed]
- Domaradzki, K.; Marczewska-Kolasa, K.; Bortniak, M. Evaluation of the effectiveness of a mixture of herbicides and biostimulators in the cultivation of sugar beet. Przem. Chem. 2015, 94, 787–792. [Google Scholar]
- Cao, J.; Peng, Q.; Yang, X.; Yang, Q.; Bai, L.; Li, Y.; Zhang, Z.; Gu, T. Differences in exogenous methyl jasmonate-induced quinclorac resistance between resistant and sensitive barnyardgrass and the underlying mechanism. Chin. J. Appl. Ecol. 2020, 31, 2293–2298. [Google Scholar]
- Figueiredo, M.R.D.; Küpper, A.; Malone, J.M.; Petrovic, T.; Figueiredo, A.B.T.D.; Campagnola, G.; Gaines, T.A. An in-frame deletion mutation in the degron tail of auxin coreceptor IAA2 confers resistance to the herbicide 2,4-D in Sisymbrium orientale. Proc. Natl. Acad. Sci.USA 2022, 119, e2105819119. [Google Scholar] [CrossRef] [PubMed]
- Van Eerd, L.L.; McLean, M.D.; Stephenson, G.R.; Hall, J.C. Resistance to quinclorac and ALS-inhibitor herbicides in Galium spurium is conferred by two distinct genes. Weed Res. 2010, 44, 355–365. [Google Scholar] [CrossRef]
- Koo, S.J.; Neal, J.C.; DiTomaso, J.M. Mechanism of Action and Selectivity of Quinclorac in Grass Roots. Pestic. Biochem. Physiol. 1997, 57, 44–53. [Google Scholar] [CrossRef]
- Hansen, H.; Grossmann, K. Auxin-Induced Ethylene Triggers Abscisic Acid Biosynthesis and Growth Inhibition. Plant Physiol. 2000, 124, 1437–1448. [Google Scholar] [CrossRef] [PubMed]
- Prathap, V.; Ali, K.; Singh, A.; Vishwakarma, C.; Krishnan, V.; Chinnusamy, V.; Tyagi, A. Starch accumulation in rice grains subjected to drought during grain filling stage. Plant Physiol. Biochem. 2019, 142, 440–451. [Google Scholar] [CrossRef]
- Saucedo, M.C.C.; Alvarado, A.D.; Téllez, L.C.; Hernández, V.G.; Tapia-Campos, E.; Varela, A.S.; García-De Los Santos, G. Changes in carbohydrate concentration in leaves, PODS and seeds of dry bean plants under drought stress. Interciencia 2012, 37, 168–175. [Google Scholar]
- Katerova, Z.I.; Miteva, P.E. Glutathione and Herbicide Resistance in Plants. In Ascorbate-Glutathione Pathway and Stress Tolerance in Plants; Springer: Dordrecht, The Netherlands, 2010; pp. 191–207. [Google Scholar]
- Nemat Alla, M.M.; Badawi, A.H.M.; Hassan, N.M.; El-Bastawisy, Z.M.; Badran, E.G. Herbicide tolerance in maize is related to increased levels of glutathione and glutathione-associated enzymes. Acta Physiol. Plant. 2008, 30, 371–379. [Google Scholar] [CrossRef]
- Hu, T.; Qv, X.; Xiao, G.; Huang, X. Enhanced tolerance to herbicide of rice plants by over-expression of a glutathione S-transferase. Mol. Breed. 2009, 24, 409–418. [Google Scholar] [CrossRef]
- Miteva, L.P.-E.; Ivanov, S.V.; Alexieva, V.S.; Karanov, E.N. Effect of atrazine on glutathione levels, glutathione s-transferase and glutathione reductase activities in pea and wheat plants. Plant Prot. Sci. 2004, 40, 160. [Google Scholar] [CrossRef]
- Jin, M.; Liu, Y.; Shi, B.; Yuan, H. Exogenous IAA improves the seedling growth of Syringa villosa via regulating the endogenous hormones and enhancing the photosynthesis. Sci. Hortic. 2023, 308, 111585. [Google Scholar] [CrossRef]

Disclaimer/Publisher’s Note: The statements, opinions and data contained in all publications are solely those of the individual author(s) and contributor(s) and not of MDPI and/or the editor(s). MDPI and/or the editor(s) disclaim responsibility for any injury to people or property resulting from any ideas, methods, instructions or products referred to in the content. |
© 2024 by the authors. Licensee MDPI, Basel, Switzerland. This article is an open access article distributed under the terms and conditions of the Creative Commons Attribution (CC BY) license (https://creativecommons.org/licenses/by/4.0/).