Article

Effects of Seasonal Freezing and Thawing on Soil Moisture and Salinity in the Farmland Shelterbelt System in the Hetao Irrigation District

1
School of Soil and Water Conservation, Beijing Forestry University, Beijing 100083, China
2
State Key Laboratory of Efficient Production of Forest Resources, Beijing 100083, China
3
Forest Ecosystem Studies, National Observation and Research Station, Jixian 042200, China
4
China Inner Mongolia Dengkou Desert Ecosystem National Observation Research Station, National Forestry and Grassland Administration, Dengkou 015200, China
5
Experimental Center of Desert Forestry, Chinese Academy of Forestry, Dengkou 015200, China
*
Author to whom correspondence should be addressed.
Agronomy 2024, 14(7), 1425; https://doi.org/10.3390/agronomy14071425
Submission received: 2 May 2024 / Revised: 15 June 2024 / Accepted: 24 June 2024 / Published: 30 June 2024
(This article belongs to the Special Issue Influence of Irrigation and Water Use on Agronomic Traits of Crop)

Abstract

:
Water resources are scarce, and secondary soil salinization is severe in the Hetao Irrigation District. Farmland shelterbelt systems (FSS) play a critical role in regulating soil water and salt dynamics within the irrigation district. However, the understanding of soil water and salt migration within FSS during the freeze–thaw period remains unclear due to the complex and multifaceted interactions between water and salt. This study focused on a typical FSS and conducted comprehensive monitoring of soil moisture, salinity, temperature, and meteorological parameters during the freeze–thaw period. The results revealed consistent trends in air temperature and soil temperature overall. Soil freezing durations exceeded thawing durations, and both decreased with an increasing soil depth. At the three critical freeze–thaw nodes, the soil moisture content at a 0–20 cm depth was significantly lower than at a 40–100 cm depth (p < 0.05). The soil water content increased with time and depth at varying distances from the shelterbelt, with an average increase of 7.63% after freezing and thawing. The surface water content at the forest edge (0.3H, 4H) was lower than inside the farmland (1H, 2H, 3H). Soil salt accumulation occurred during both freezing stable periods and melting–thawing periods in the 0–100 cm soil layer near the forest edge (0.3H, 4H), with the highest soil salinity reaching 0.62 g·kg−1. After the freeze–thaw period, the soil salt content in each layer increased by 11.41–47.26% compared to before the freeze–thaw period. Salt accumulation in farmland soil near the shelterbelt was stronger than in the far shelterbelt. The multivariate statistical model demonstrated goodness of fit for soil water and salt as 0.94 and 0.72, respectively, while the BP neural network model showed goodness of fit for soil water and salt as 0.82 and 0.85, respectively. Our results provide an efficient theoretical basis for FSS construction and agricultural water management practices.

1. Introduction

The Hetao Irrigation District in Inner Mongolia is the largest irrigation district along the Yellow River in China and serves as a crucial grain-producing region in northwest China [1]. It plays a pivotal role in ensuring regional food security. However, the Hetao Irrigation District faces challenges due to its arid climate, limited water resources, and significant secondary soil salinization [2]. The seasonal freeze–thaw cycles occurring in winter and spring exacerbate soil salt accumulation, thereby impacting the growth and yield of crop seedlings [3]. This issue severely limits the sustainable development of the agricultural industry and the ecological environment in the region [4]. Therefore, studying the movement of water and salt in farmland soil during the freeze–thaw period holds immense significance for mitigating soil salinization and developing scientifically informed spring sowing practices.
The farmland shelterbelt serves as a crucial ecological barrier in arid regions, and the farmland shelterbelt system (FSS), comprising farmland and farmland shelterbelt, represents a typical agricultural planting unit in the Hetao Irrigation District [5]. Farmland shelterbelts can influence soil temperature and humidity by providing shading, reducing wind speed, and facilitating root water absorption [6], thereby impacting the soil freezing and thawing process. Soil moisture and salt content in farmland exhibit a coupling effect [7]. During the freezing and thawing process of soil, the interaction among the temperature gradient, moisture gradient, and solute concentration gradient results in a varied spatial distribution of soil water and salt. Previous studies indicate that the soil moisture content at different distances from the leeward side of the main shelterbelt (1 H, 5 H, and 10 H) surpasses that in farmland lacking protective forests [8]. The closer the distance to the shelterbelt, the lower the water content and the higher the salt content in the farmland soil [9]. Under drip-irrigation conditions, the desalination effect of farmland shelterbelts becomes evident, with closer proximity to the shelterbelts associated with a lower soil salt content [10,11]. Currently, most research on soil water and salt transport focuses on non-freeze–thaw periods, with fewer studies investigating soil water and salt dynamics in FSSs during freezing and thawing periods. Therefore, further analysis of the soil freezing and thawing process in shelterbelts is necessary to elucidate changes in farmland soil moisture and solutes during freezing and thawing periods, providing theoretical references for local agricultural production.
Soil freezing and thawing is a complex process, mainly reflected in the complexity of soil water and heat transport, water phase transition, and salt accumulation [12]. There exists a significant correlation between the soil temperature and air temperature during the freeze–thaw period, with air temperature being the dominant factor in soil freezing and thawing [13]. Changes in soil temperature also profoundly affect the soil moisture content [14] and the migration of soil solutes [15]. Solutes in soil solutions can be transported through convection, diffusion, and dispersion. A previous study has found that during the freezing and thawing process, the movement of soil water and salt exhibits consistency, with water and salt migrating upward from the bottom [16]. The process of soil freezing and thawing exerts periodic influences on the soil water potential, water migration, and potential evaporation, whereby the freezing effect leads to a significant accumulation of soil salt near the permafrost zone [17]. Some researchers have utilized soil water and salt data to construct multiple regression models. The simulation outcomes can more accurately depict soil conditions, thus laying the groundwork for subsequent investigations into the coupling relationship between soil and plants. Similarly, some scholars have employed the backpropagation (BP) neural network model to forecast soil water and salt conditions in summer, demonstrating the model’s high accuracy in simulating soil water and salt dynamics [18,19]. However, previous literature on soil water and salt simulation mainly focused on the non-freeze–thaw period, with scant reports on simulating soil water and salt dynamics during freeze–thaw cycles.
This study focused on the typical FSS in the Hetao Irrigation District during the freeze–thaw period, monitoring the soil water, salt content, and temperature, and constructing soil water and salt prediction models. The main objectives of this research were (i) to elucidate the seasonal freezing and thawing process of soil in the FSS, (ii) to investigate soil water and salt transport characteristics and the influence of farmland shelterbelts on soil water and salt distribution, and (iii) to assess the applicability of multiple regression and BP neural network models during freeze–thaw periods. The results of this study can offer a scientific foundation and data support for land salinization prevention and the development of FSSs in the Hetao Irrigation District, Inner Mongolia.

2. Materials and Methods

2.1. Study Area

The study area was located in Dengkou, Bayan Nur, Inner Mongolia, China (106°35′–106°59′ E, 40°17′–40°29′ N). The area has a temperate semi-arid continental climate (a temperate continental monsoon climate) with an average altitude of 1050 m. The annual average temperature is 8 °C, with a large temperature difference between day and night. The annual sunshine time is 3000 h, the frost-free period is 136 days, the evaporation is 2388 mm, and the multi-year average precipitation is 145 mm. The rainfall is mainly concentrated from June to September (accounting for 70–80% of the annual precipitation). Strong winds often occur in spring and winter seasons, with an average annual wind speed of 4.5 m/s. The main soil types are aeolian sand soil, irrigated silt soil, and saline–alkali soil. The maximum depth of frozen soil reached 1 m, and the groundwater level ranged between 3–4 m deep (Figure 1). The soil composition at a depth of 0–1 m in the experimental site mainly consisted of sandy loam. Agricultural irrigation in the area primarily employed flood irrigation methods.

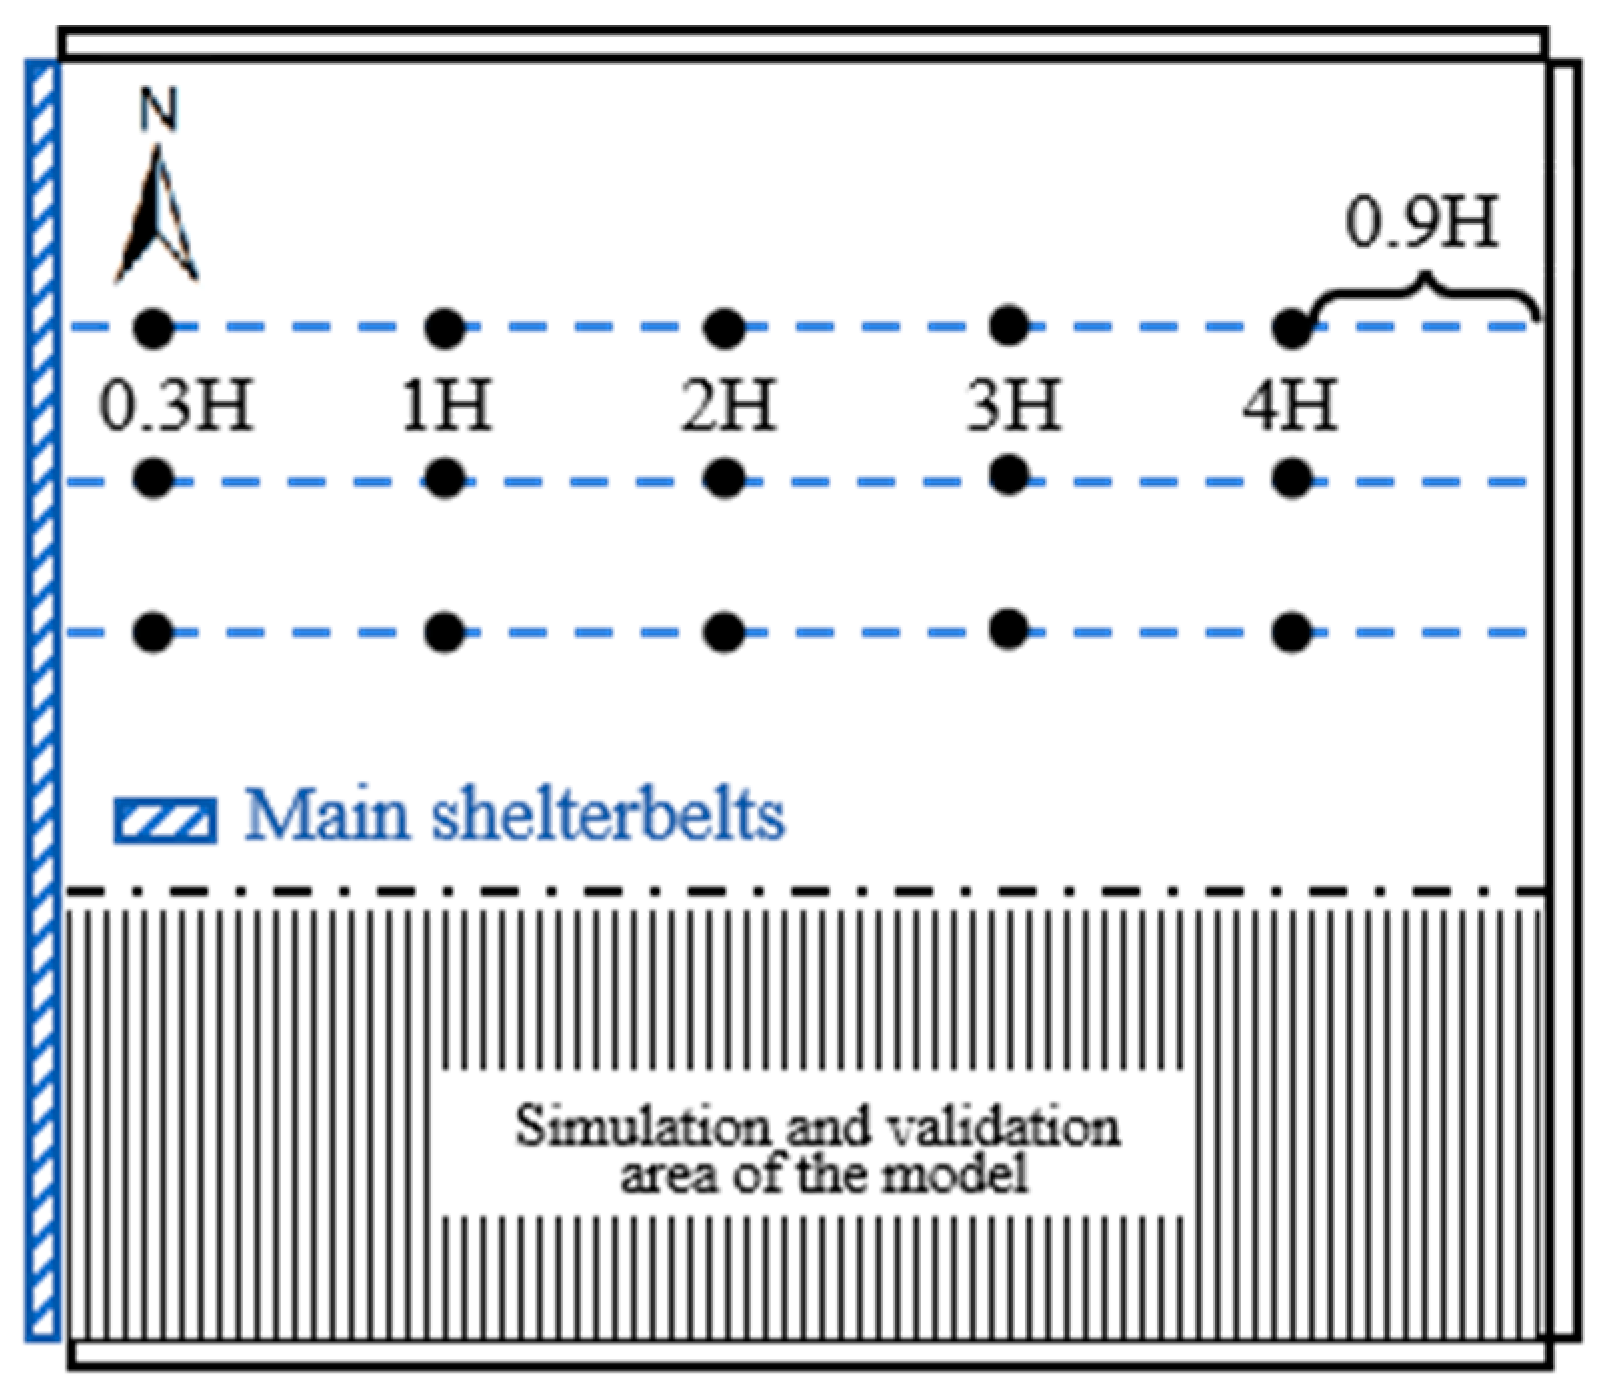
2.2. Experimental Design

The experiment was conducted from October 2020 to April 2021. The study focused on a typical farmland shelterbelt comprising four rows: two rows of Populus simonii and two rows of Populus gansuensis, with a mixed arrangement between rows. The external dimensions of the shelterbelt area were 340 m in length and 120 m in width, with the forest belt oriented in a north–south direction. The trees aged at 31 years, with an average tree height (H) of 25 m and the average diameter at breast height of 23 cm. The spacing between rows was 2.5 m × 1.5 m.
This study followed a method from previous research [20] and divided the soil freezing and thawing process into three stages. The first stage, occurring from 5 December 2020, to 4 January 2021, was the initial freeze–thaw period. During this stage, the soil temperature fluctuated above and below zero within a day. Due to differences in temperature between day and night, the soil thawed during the day and froze at night, resulting in a continuous phase transition between water and ice. The second stage, from 5 January 2021, to 24 February 2021, was the stable freezing period. The soil continued to freeze, the depth of frozen soil increased, and the soil continued its transformation from water to ice. The third stage, from 25 February 2021, to 10 April 2021, was the melting and thawing period. During this phase, the temperature rose, causing the soil to thaw, and the soil continuously transitioned from ice to water. The critical points of the initial freezing period, stable freezing period, and melting and thawing period were 5 December 2020, 5 January 2021, and 25 February 2021, respectively.
The main shelterbelt in the farmland shelterbelt network was located on the west side, and three vertical sampling lines were set up along it. Five sampling points were placed at 0.3 H (near the farmland edge), 2 H, 3 H, and 4 H (0.9 H away from the opposite side of the forest) from the main forest belt (Figure 2). During the freeze–thaw period, soil samples were collected at each sampling point using soil augers, with sampling depths of 0–20 cm, 20–40 cm, 40–60 cm, 60–80 cm, and 80–100 cm. The samples were split into two parts: one for measuring soil moisture and the other for assessing soil salinity. During the experiment, the sampling frequency was 2–3 times per month, with a total frequency of 14 times. The sampling reference date was set as 5 October 2020 (day 0). The data collected below the sampling lines for the farmland were used to construct and validate predictive models.

2.3. Data collection and Measurements

2.3.1. Soil Moisture

The soil samples collected from the sampling points were placed into aluminum boxes, and their moisture content (%) was determined using the drying method (105 °C, 10 h).

2.3.2. Soil Salinity

The concentration of electrolytes in the soil solution can indicate soil salinity. In this study, soil samples were air-dried, ground, and sieved (1 mm), and a soil leach solution was prepared with a soil-to-water mass ratio of 1:5. The EC value of the leach solution was measured using a DDS-307A conductivity meter (Shanghai INESA Scientific Instruments Co., Ltd., shanhai, China). Based on an empirical formula [21], the EC value was converted into the mass fraction of soil water–soluble total salt.
C = (S + 9.2)/2000
In the equation, C denotes the mass content of soil salt (g/kg), and S represents the conductivity of soil leachate (μS/cm).

2.3.3. Soil Temperature and Meteorological Index

The soil temperature of each layer at every sampling point was continually monitored using a WatchDog B101 recorder (Spectrum Industrial Technologies, Chicago, Illinois, USA), with measurements taken every half hour. Temperature data were collected from miniature weather stations (WatchDog 2700, Spectrum Industrial Technologies, Chicago, Illinois, USA) positioned at the sample sites.

2.4. Soil Moisture and Salt Prediction Model

2.4.1. Multiple Regression Model

This study utilized soil water, temperature, salt, and air temperature data collected during the freeze–thaw period (from October 2020 to February 2021) as training samples for model development. The soil water and salt data from spring (March 2021) were used as prediction and testing samples to validate the model’s performance. The freeze–thaw model was constructed using soil temperature (X1), air temperature (X2), soil moisture content (X3), and soil salt content (X4) as independent variables during the freeze–thaw period, with spring soil water (Y1) and salt (Y2) serving as dependent variables. Multiple regression analysis was employed to establish the relationship between these variables [22].

2.4.2. BP neural Network Model

Addressing the issues of soil water, heat, and salt conditions in farmland protected by shelterbelts in the Hetao Irrigation District, this study aimed to predict the spatial distribution of soil water and salt in the spring of the following year (March 2021) using soil water, salt, and temperature indicators during the freeze–thaw period (from October 2020 to February 2021). A 3-layer neural network model was employed for training and testing. The transfer function utilized an S-shaped function, and a linear function was applied in the output layer. Training samples were processed using the L-M backpropagation algorithm [23]. The learning function employed learngdm to train the network, with the network structure determined by adjusting the number of hidden layer neurons. The experimental model underwent 10,000 training iterations, with a learning rate set at 0.01 and a minimum learning error threshold of 0.000001.

2.5. Data Processing

The original data were analyzed using WPS 2019 (Kingsoft Office Corporation, Beijing, China). Plotting was carried out using Origin 2017 (Origin Lab, Northampton, MA, USA) and Surfer 13.0 (Golden Software, Inc., Oakland, California, USA). SPSS 25 (IBM SPSS Inc., Chicago, Illinois, USA) was utilized for correlation analysis, variance analysis, and multiple regression analysis. Training and prediction of the BP neural network model were performed using Matlab R2017b (MathWorks, Inc., Natick, Massachusetts, USA).

3. Results

3.1. Soil Freezing and Thawing Process in Farmland Shelterbelt System

The surface soil temperature of farmland decreased as the air temperature decreased, but the soil temperature had a certain lag and stability relative to the air temperature (Figure 3a). On 15 November 2020, the air temperature dropped to 16.67 °C, while the soil temperature in the 0–20 cm layer began declining on 17 November 2020, decreasing by 10.30 °C. With an increasing soil depth, the range of soil temperature changes decreased gradually. The 0–20 cm layer’s soil temperature was most influenced by the air temperature, and its variation trend was closest to that of the air temperature. During the freeze–thaw period, the maximum temperature difference reached 38.59 °C, with the maximum and minimum differences in soil temperature recorded in each layer at 25.56 °C (0–20 cm) and 12.82 °C (80–100 cm), respectively.
The soil-freezing process lasted 82 days, longer than the melting process, which lasted 45 days. Both freezing and melting durations decreased gradually with an increasing soil depth. Throughout the entire freeze–thaw period, the soil temperature in the 0–20 cm layer within the farmland (1 H, 2 H, and 3 H) increased by an average of 176.25% compared to the forest edge (0.3 H and 4 H) (Figure 3b). In the 0–80 cm soil layer, the temperature difference between the soil near the forest edge (0.3 H) and inside the farmland (2 H) decreased progressively with the soil depth. The maximum and minimum temperature differences were −3.47 °C (0–20 cm) and 0.03 °C (20–40 cm), respectively. In the 80–100 cm soil layer, no significant difference in soil temperature was observed in farmland locations at different distances from the forest belt (Figure 3f).

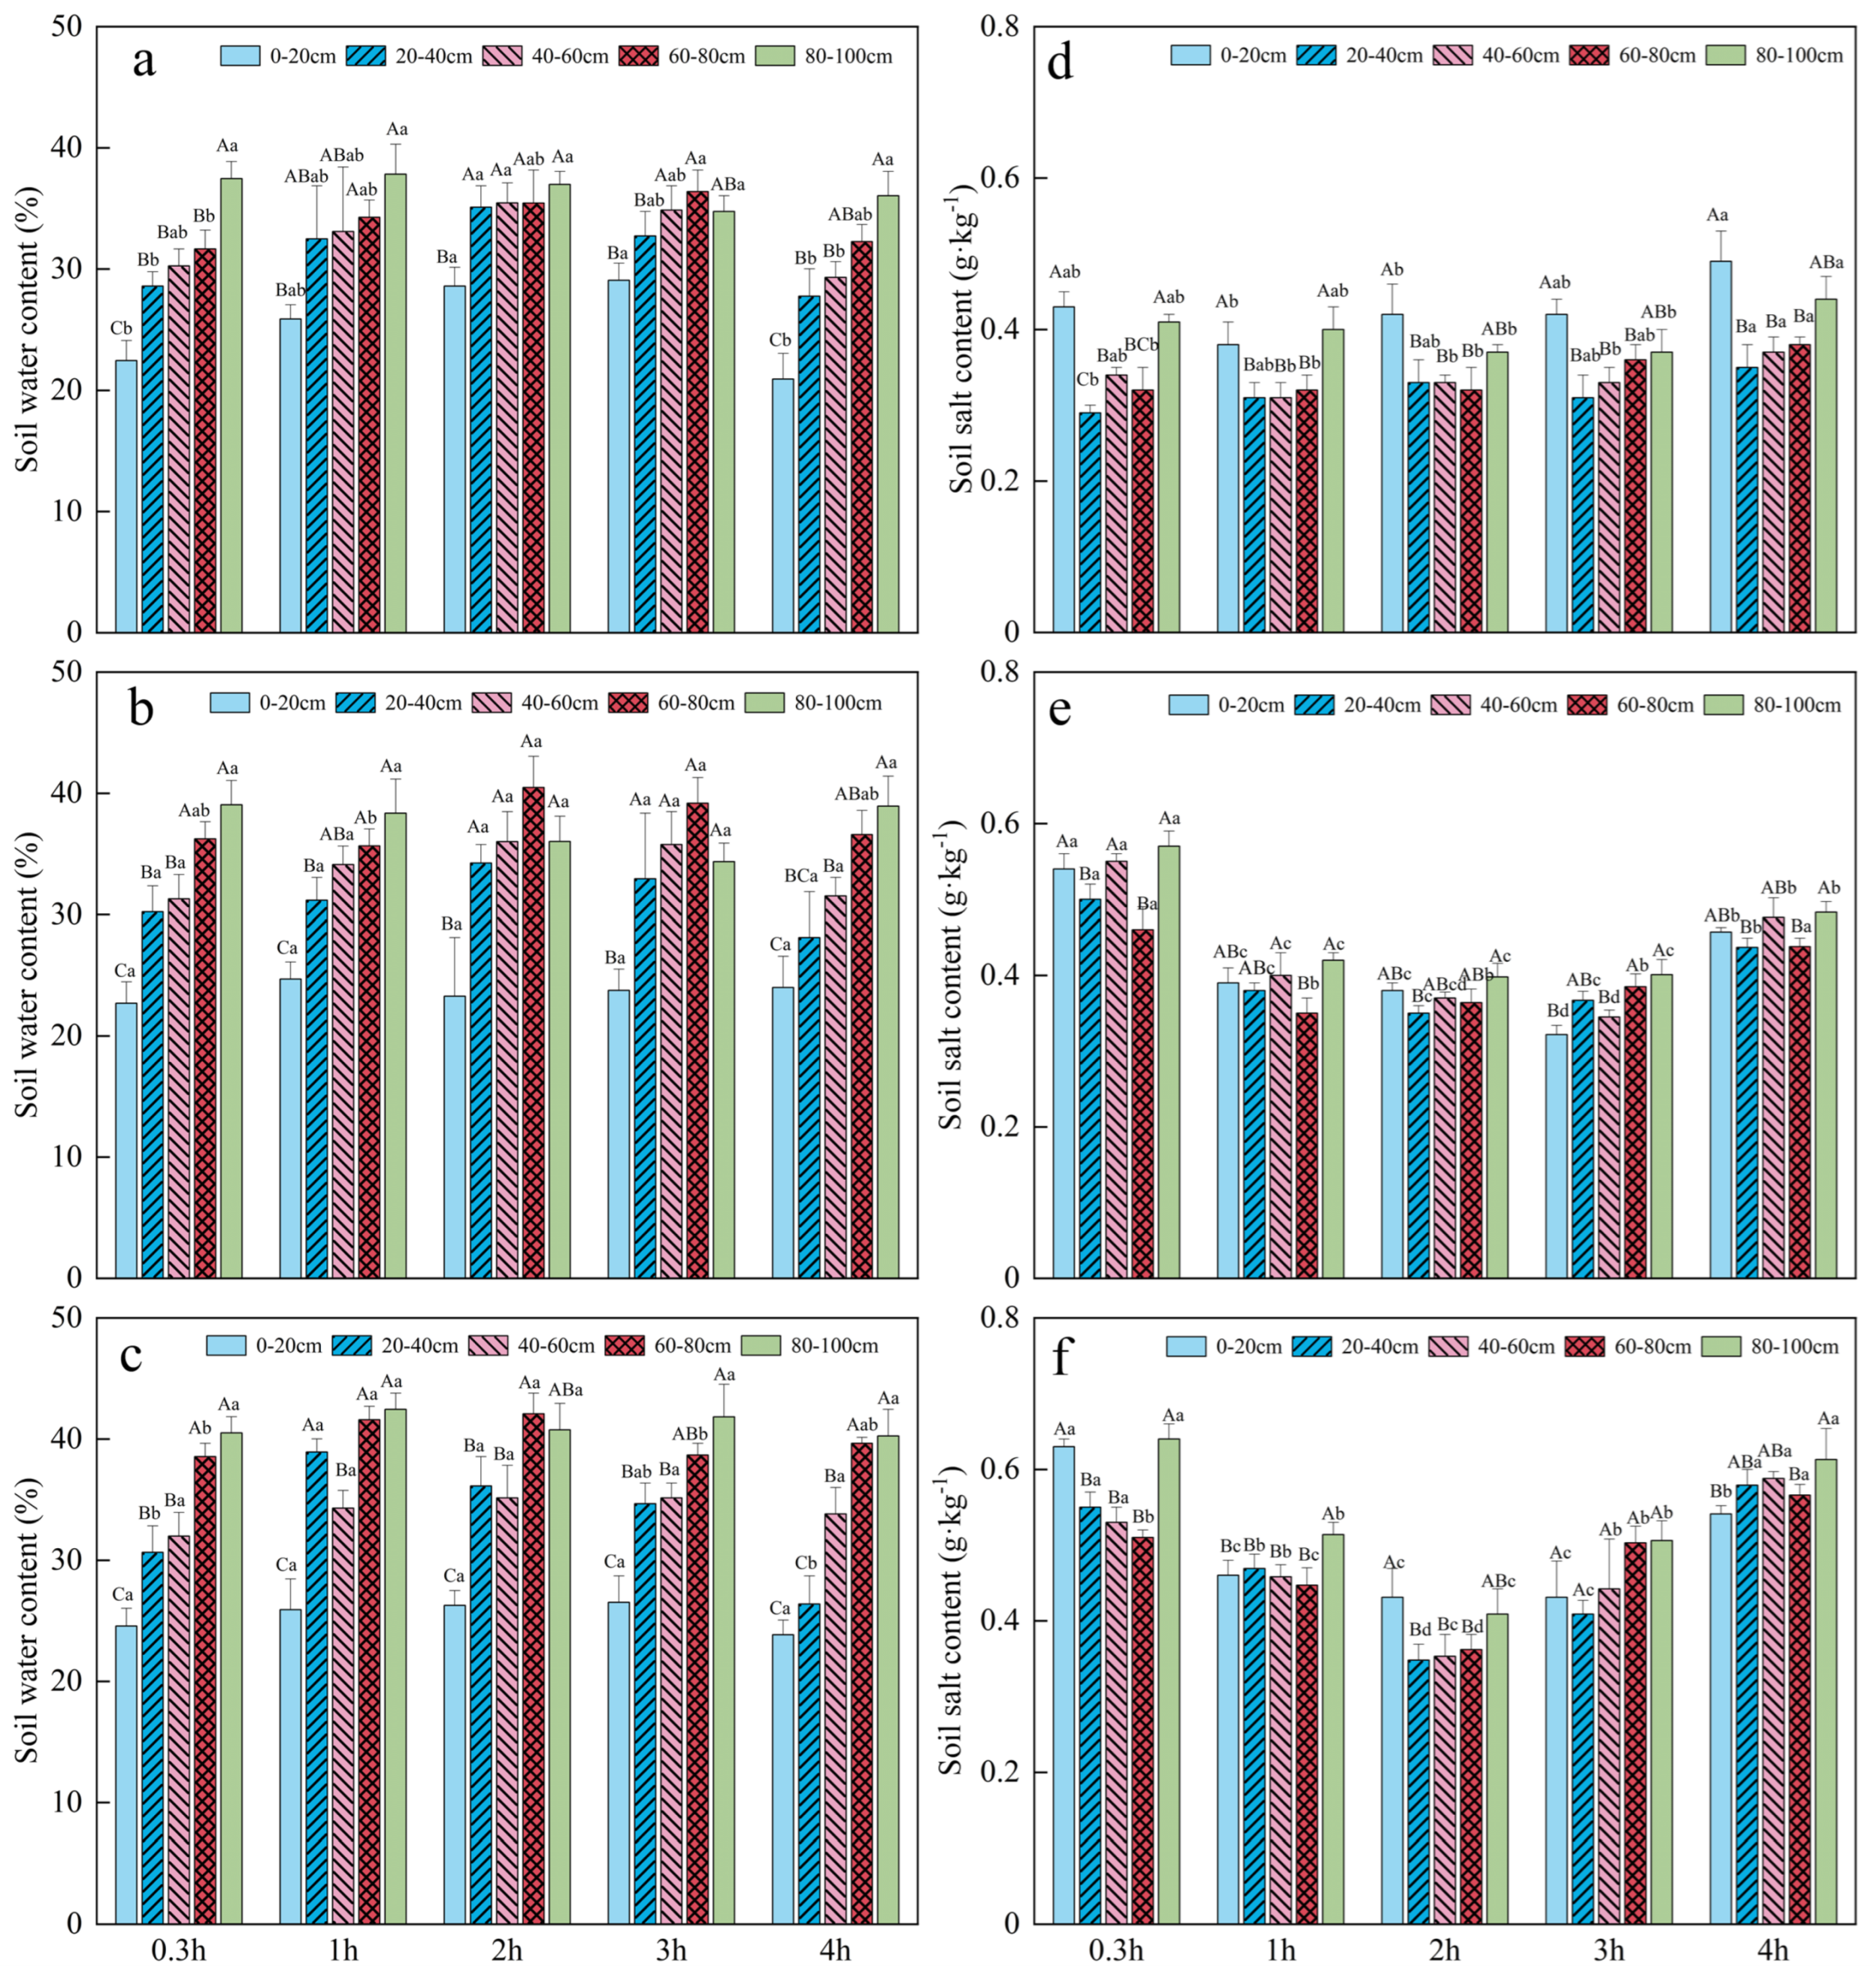
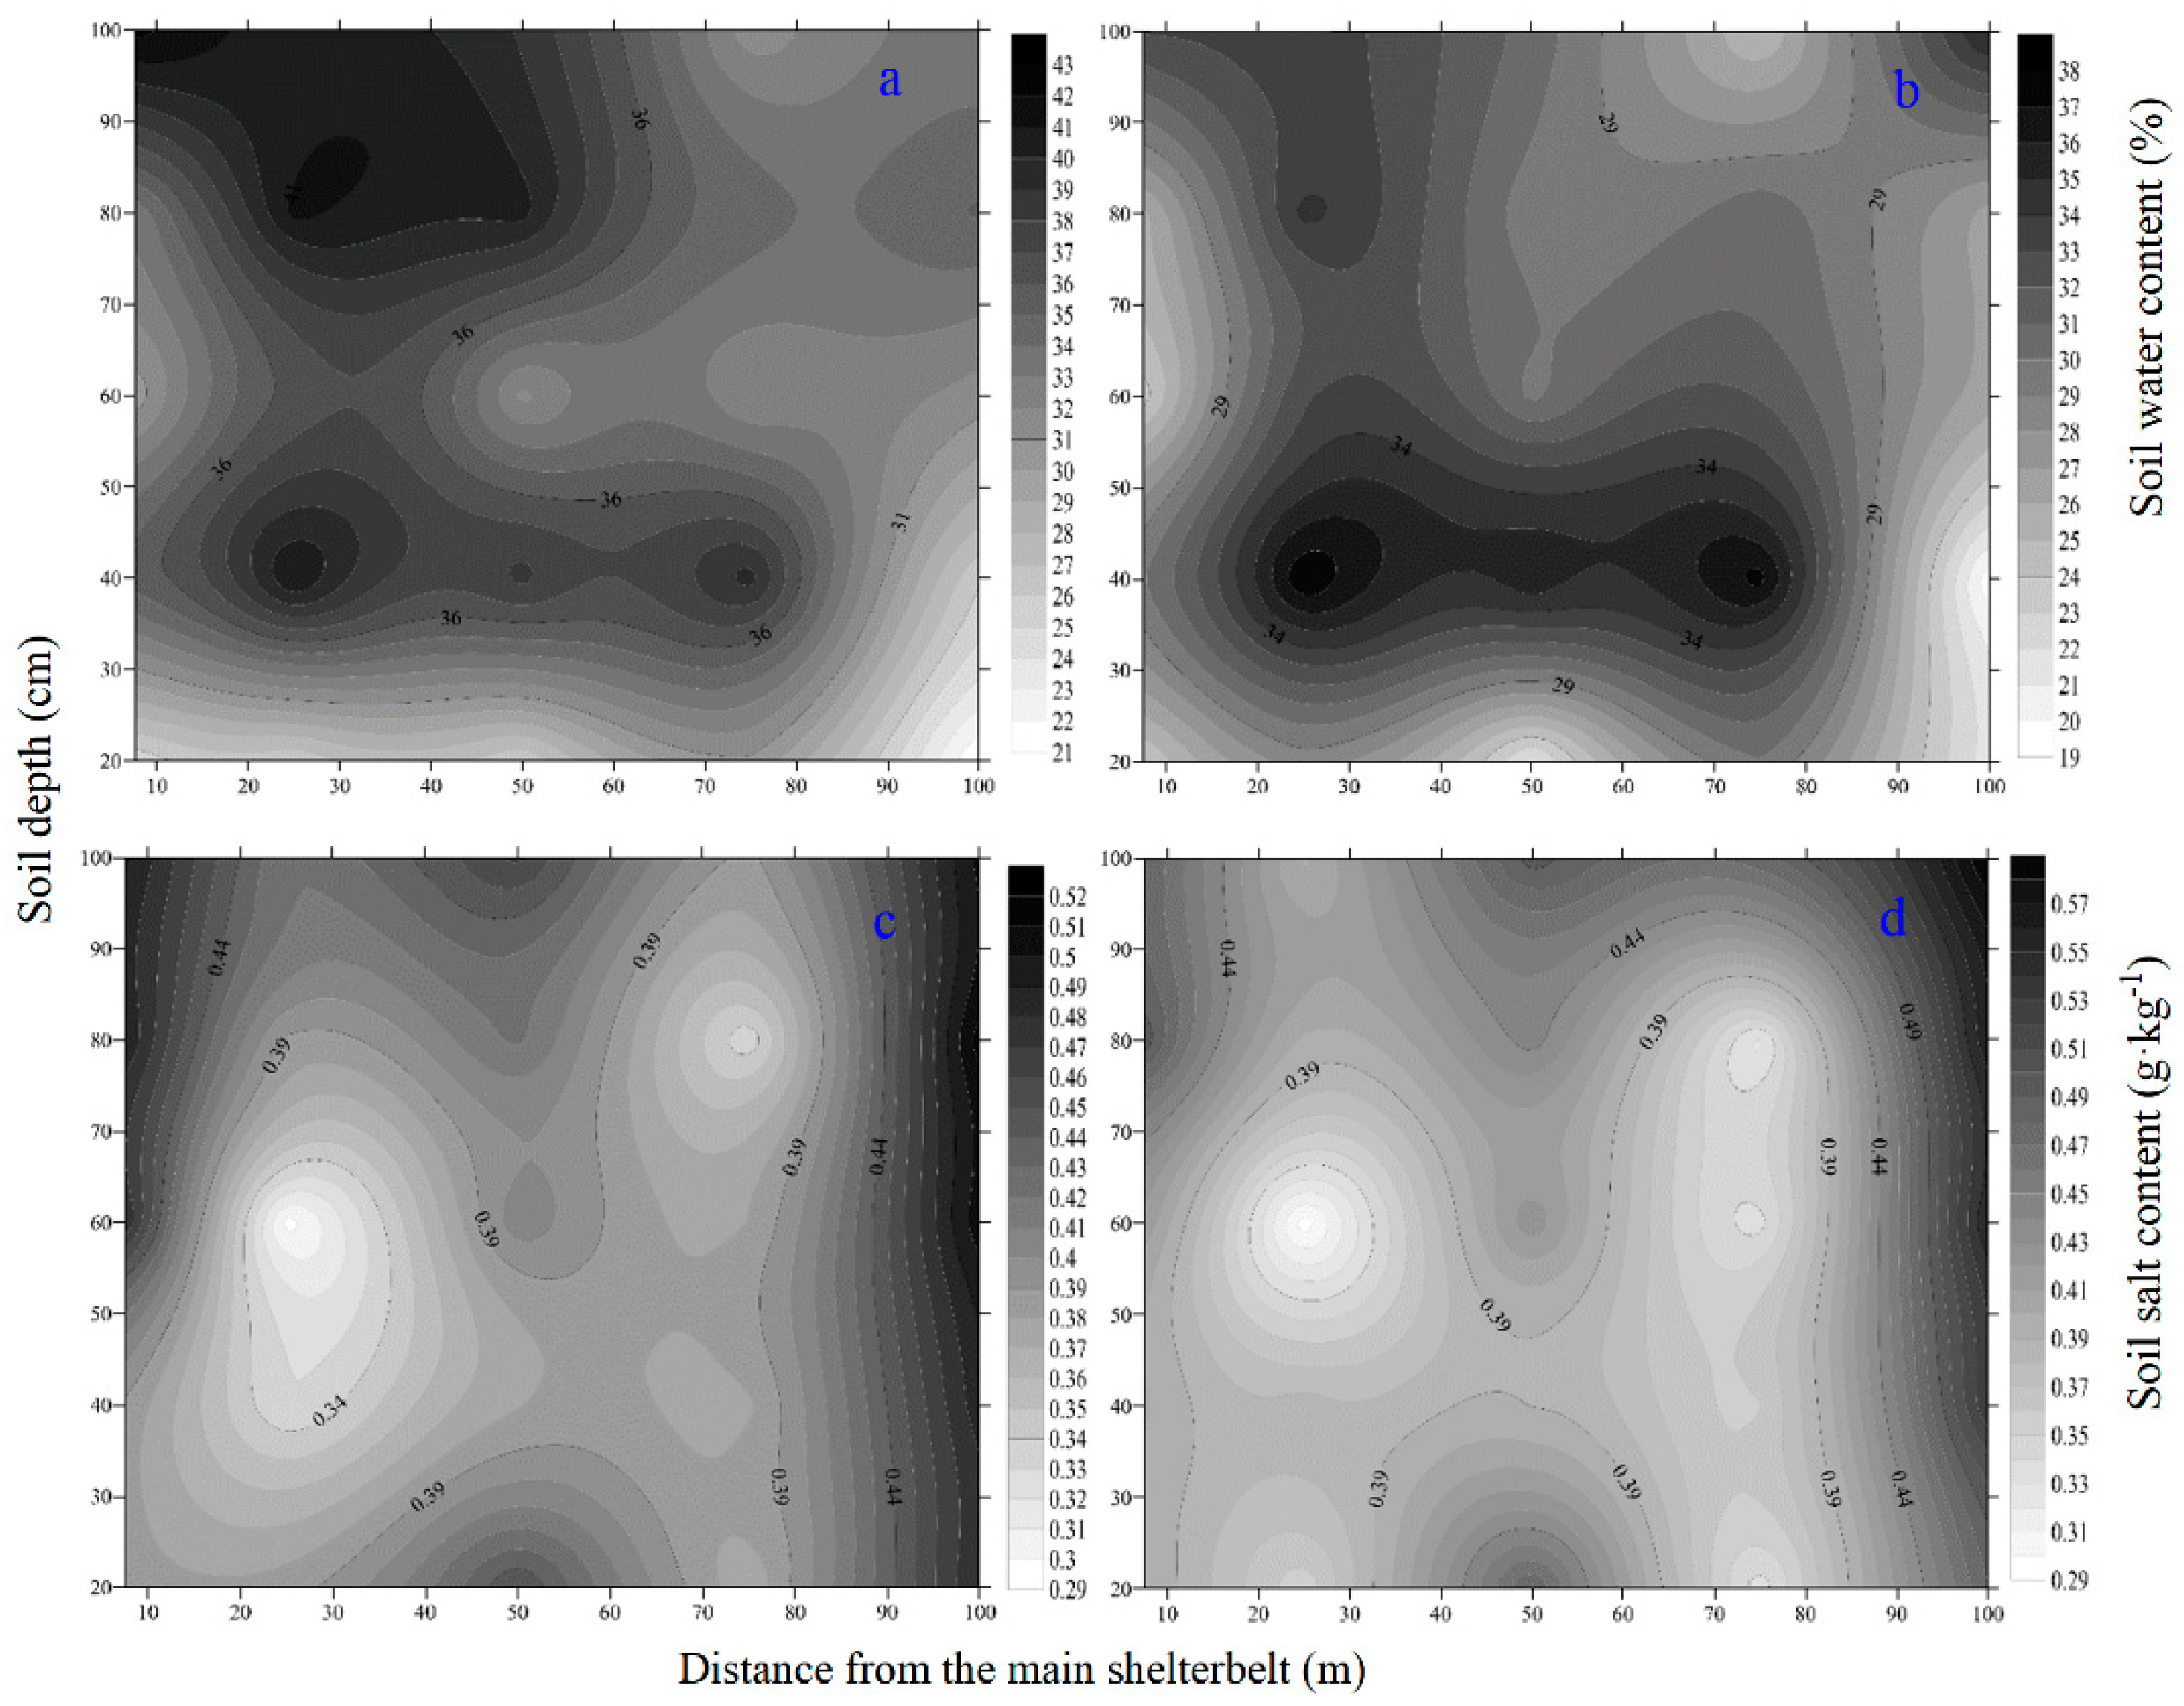
3.2. Spatial Distribution of Soil Water and Salt at Critical Points during Freeze–Thaw Period

In the horizontal direction, the average soil water content at the three freeze–thaw critical points initially increased and then decreased with the distance from the main forest belt, peaking at 1 H or 2 H (Figure 4a–c). Compared to the average soil water content near the forest edge (average of 0.3 H and 4 H), the average soil water content within the farmland (average of 1 H, 2 H, and 3 H) increased by 12.99% (initial freezing period), 4.60% (stable freezing period), and 9.10% (melting and thawing period), respectively. Vertically, the soil water content increased with the soil depth at all three freeze–thaw critical points. In the 0–20 cm layer, the soil moisture content was significantly lower than in the 40–100 cm layer at the three critical points (p < 0.05). Compared to the 0–40 cm layer, the soil water content in the 40–100 cm layer increased by 21.31% (initial freezing period), 31.69% (stable freezing period), and 30.85% (melting and thawing period) during the three freezing and thawing stages.
In the horizontal direction, unlike soil moisture, the average soil salinity at each freeze–thaw critical point initially decreased and then increased as the distance from the main forest belt increased, reaching its peak at 0.3 H or 4 H (Figure 4d–f). Compared to the interior of the farmland (average of 1 H, 2 H, and 3 H) at each freeze–thaw critical point, the soil salt content near the forest edge (average of 0.3 H and 4 H) increased by 8.52% (initial freezing period critical point), 31.03% (stable freezing period critical point), and 31.77% (critical point of melting and thawing period), respectively. Vertically, each freeze–thaw critical point exhibited a pattern of initially decreasing and then increasing with soil depth, with the maximum value appearing at 0–20 cm or 80–100 cm. During the initial freezing period and the melting and thawing period, the soil salt content in the 0–20 cm or 80–100 cm layer was significantly higher than that in the middle 20–80 cm layer at each position (p < 0.05).

3.3. Temporal and Spatial Distribution of Farmland Soil Water and Salt in the Protection Forest during the Freeze–Thaw Period

3.3.1. Spatial and Temporal Distribution of Farmland Soil Moisture in the Protection Forest during the Freeze–Thaw Period

During the freeze–thaw period, the soil moisture content in farmland varied from 21.02% to 43.34% (Figure 5). The change patterns in the soil moisture content were similar at different locations away from the main forest belt. The soil moisture content increased with time and soil depth at each location. Following freezing and thawing, there was an average increase of 7.63% in the soil moisture content at each location. At different locations away from the main forest belt, the soil moisture content of each soil layer increased by 5.95–18.09% after freezing–thawing compared to before, with the largest increase in the soil moisture content at 60–80 cm layers at each location. In the vertical direction, the lowest and highest soil moisture content values appeared at the 0–20 cm layer (ranging from 22.60% to 38.48%) and the 80–100 cm layer (ranging from 37.38% to 38.66%), respectively.
Overall, the soil water content near the forest edge of farmland was lower than that inside the farmland. During the freeze–thaw period, the minimum average moisture content of farmland soil near the forest edge (0.3 H and 4 H) was 22.60%, while the maximum average soil moisture content within the farmland (1 H, 2 H, and 3 H) was 38.66%. The maximum differences in soil water content between near the forest edge and inside the farmland were 15.82%, 25.63%, 14.67%, 10.02%, and 3.00% in the 0–20 cm, 20–40 cm, 40–60 cm, 60–80 cm, and 80–100 cm soil layers, respectively. Vertically, the soil water content exhibited significant increases during the initial freezing period and the melting and thawing period, with greater increases observed as the soil depth increased. The soil water content in the 0–20 cm layer increased mainly during the initial freezing period, while in the 20–100 cm layer, it increased mainly during the melting and thawing period.

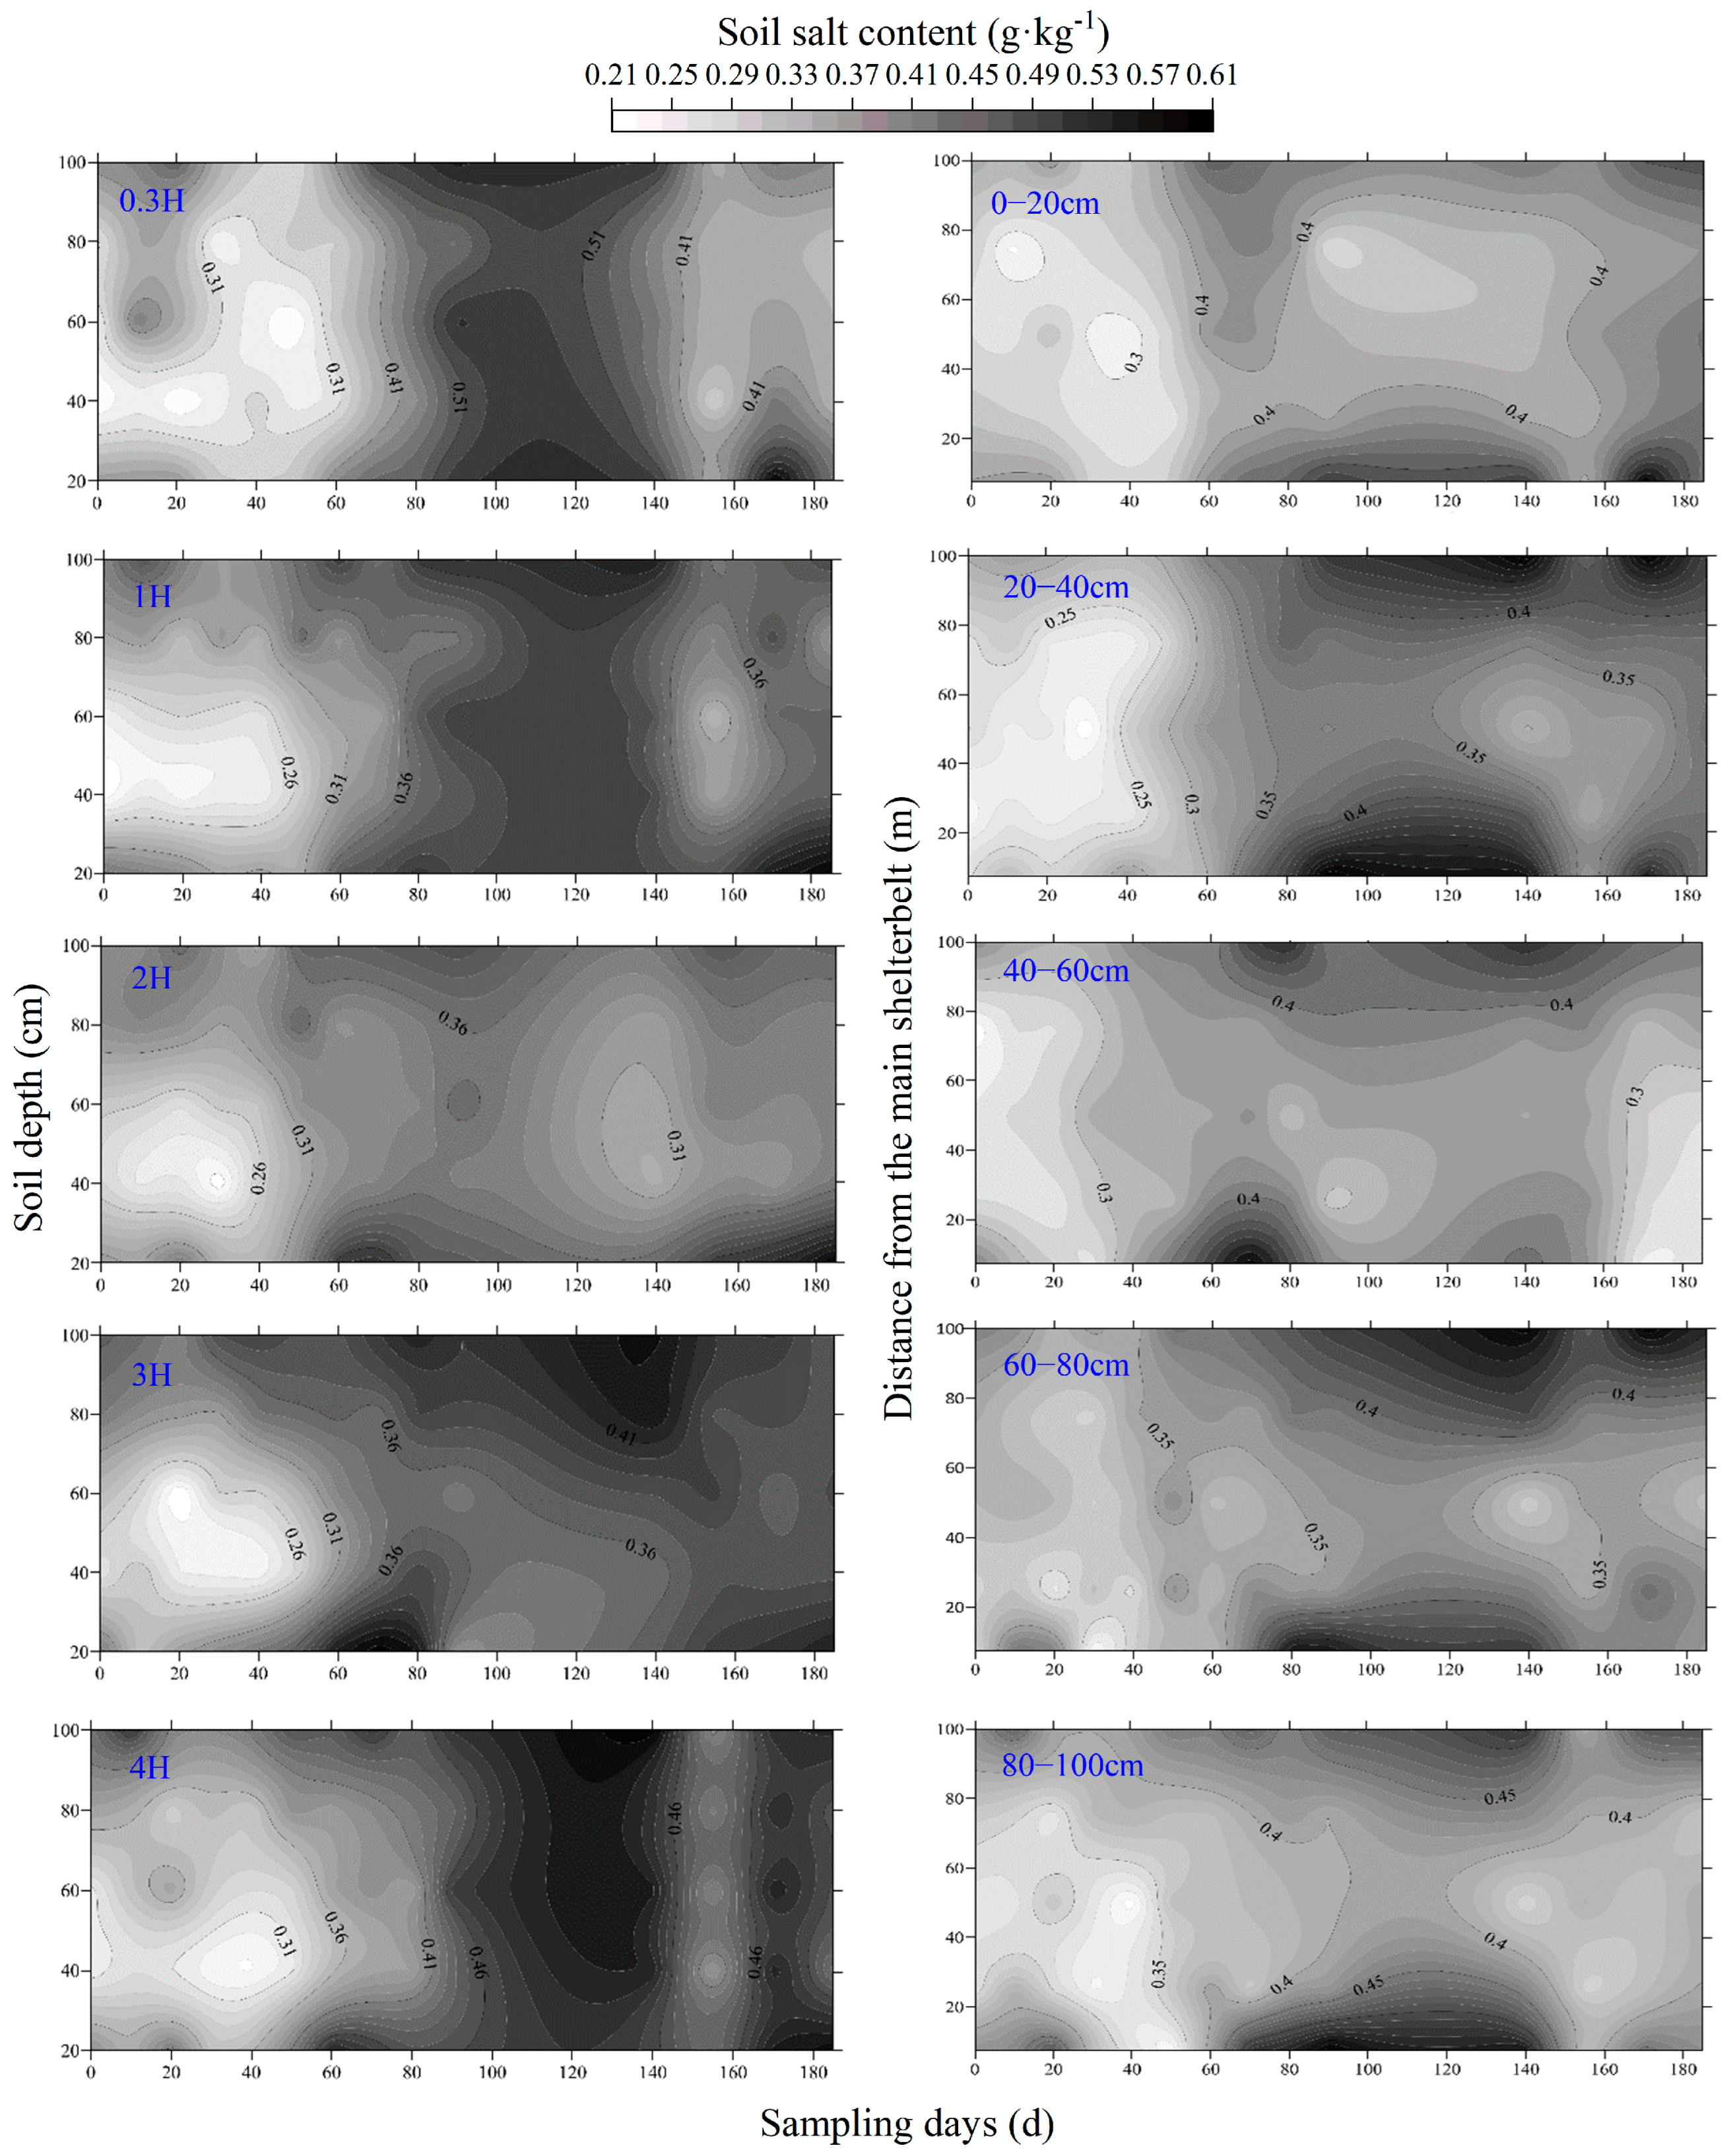
3.3.2. Temporal and Spatial Distribution of Farmland Soil Salinity in the Protection Forest during the Freeze–Thaw Period

The soil salt content at distances of 0.3 H, 1 H, 2 H, 3 H, and 4 H from the main forest belt increased by 26.55%, 27.79%, 18.80%, 27.23%, and 28.99%, respectively, after freezing and thawing compared to before (Figure 6). Farmland soil salt migrated to the surface due to freeze–thaw action, leading to two aggregation phenomena. During the first aggregation, the average soil salinity at distances of 0.3 H, 1 H, 2 H, 3 H, and 4 H from the main forest zone was 0.53 g·kg−1, 0.39 g·kg−1, 0.37 g·kg−1, 0.37 g·kg−1, and 0.42 g·kg−1, respectively. During the second aggregation, the average soil salinity at distances of 0.3 H, 1 H, 2 H, 3 H, and 4 H from the main forest zone was 0.62 g·kg−1, 0.46 g·kg−1, 0.47 g·kg−1, 0.42 g·kg−1, and 0.52 g·kg−1, respectively.
The salt content of farmland soil near the forest edge (average value of 0.3 H and 4 H) generally exceeded that inside the farmland (average value of 1 H, 2 H, and 3 H). The soil salt content near the forest edge was elevated by 18.92%, 20.00%, 25.81%, 11.43%, and 18.42% compared to depths inside the farmland at 0–20 cm, 20–40 cm, 40–60 cm, 60–80 cm, and 80–100 cm, respectively. Throughout the freeze–thaw period, the maximum soil salt content at 0–20 cm, 20–40 cm, 40–60 cm, 60–80 cm, and 80–100 cm reached 0.62 g·kg−1, 0.50 g·kg−1, 0.50 g·kg−1, 0.49 g·kg−1, and 0.58 g·kg−1, respectively. Soil salt accumulation occurred twice in each soil layer near the forest edge (0.3 H and 4 H) during the freezing stable period and the melting and thawing period. After freezing and thawing, the soil salt content exhibited an overall increasing trend, with greater increases observed in the 0–60 cm layer compared to the 60–100 cm layer. The salt content in each soil layer increased by 29.17% (0–20 cm), 47.26% (20–40 cm), 33.90% (40–60 cm), 15.78% (60–80 cm), and 11.41% (80–100 cm), respectively.

3.3.3. The Correlation between Soil Moisture and Salinity

The investigation into the relationship between soil water and salt across various soil layers during the freeze–thaw period revealed a notable correlation within the 0–20 cm, 20–40 cm, and 40–60 cm soil depths (p < 0.05), whereas the association within the 60–80 cm and 80–100 cm layers was comparatively weak (p > 0.05) (Table 1). Overall, the correlation between soil water and salt throughout the freeze–thaw period was highly significant, yielding a comprehensive correlation coefficient of −0.99 (p < 0.01).

3.4. Construction of Soil Water and Salt Prediction Model

3.4.1. Multiple Regression Model

The R2 of the multiple regression model for soil moisture content reached 0.94 (Y1 = − 9.36 – 0.39 × 1 − 0.06 × 2 + 1.28 × 3 + 12.59 × 4) (Figure 7). The surface moisture content of the soil was relatively low, and the soil moisture content gradually increased with the depth of the soil layer. The highest measured and predicted soil moisture content values were 43.34% (80–100 cm) and 42.84% (80–100 cm), respectively. Measured and predicted values at varying distances from the forest belt revealed that the soil moisture content near the forest edge was lower than inside the farmland. The difference in the soil moisture content from the forest belt showed a trend of first increasing and then decreasing with the soil depth. The measured values of the soil moisture content for soil layers far and near the forest belt differed by 27.15%, 36.66%, 12.28%, 15.81%, and 6.17% in soil layers of 0–20 cm, 20–40 cm, 40–60 cm, 60–80 cm, and 80–100 cm, respectively. The predicted values of the soil moisture content for soil layers far and near the forest belt differed by 19.68%, 29.71%, 20.06%, 13.10%, and 7.74% in soil layers of 0–20 cm, 20–40 cm, 40–60 cm, 60–80 cm, and 80–100 cm, respectively. The predicted soil moisture content distribution appeared flatter than the measured values, with minimal changes in the middle soil layer and few abrupt changes. The measured values showed a slightly higher soil moisture content in the 40–60 cm soil layer at a distance of 1 H and 3 H from the forest belt, while the predicted values did not show this characteristic.
The R2 of the multiple regression model for soil salinity reached 0.72 (Y2 = 0.40 + 0.01 × 1 − 0.01 × 3 + 0.56 × 4). Predicted soil salinity values were lower than the measured values. The soil salt content exhibited a strong accumulation phenomenon in both surface soil and deep soil at the end of the freeze–thaw period. The measured values of the soil salt content for soil layers far and near the forest belt differed by 25.65%, 35.04%, 37.65%, 28.55%, and 21.59% in soil layers of 0–20 cm, 20–40 cm, 40–60 cm, 60–80 cm, and 80–100 cm, respectively. The predicted values of the soil salt content for soil layers far and near the forest belt differed by 16.01%, 30.15%, 28.36%, 15.82%, and 19.38% in soil layers of 0–20 cm, 20–40 cm, 40–60 cm, 60–80 cm, and 80–100 cm, respectively.

3.4.2. BP Neural Network Model

The R2 of BP neural network models for soil water and salt were 0.82 and 0.85, respectively (Figure 8). The soil moisture content in the 0–40 cm layer was low, and the soil water content in the 40–60 cm and 80–100 cm layer was high. The measured values of soil moisture content for soil layers far and near the forest belt differed by 43.38%, 55.62%, 20.42%, 19.80%, and 24.07% in soil layers of 0–20 cm, 20–40 cm, 40–60 cm, 60–80 cm, and 80–100 cm, respectively. The difference in predicted soil moisture content near the forest edge and within the farmland showed a trend of first increasing and then decreasing with the soil depth. The predicted values of the soil moisture content for soil layers far and near the forest belt differed by 33.15%, 101.09%, 33.37%, 22.58%, and 12.51% in soil layers of 0–20 cm, 20–40 cm, 40–60 cm, 60–80 cm, and 80–100 cm, respectively. The predicted range of soil moisture content was lower than the measured value, and the predicted value of the soil moisture content in the 80–100 cm soil layer was lower than the measured value. At the end of the freeze–thaw period, the soil salt content accumulated strongly in both surface and deep layers. The highest measured and predicted soil salt content values were 0.55 g·kg−1 (80–100 cm) and 0.63 g·kg−1 (80–100 cm), respectively. Soil salinity in farmland near the forest edge was higher than that inside the farmland.

4. Discussion

4.1. Soil Freezing and Thawing Process

Understanding the key change points during the freeze–thaw period can elucidate the distribution patterns of soil water and salt and help comprehend their transport mechanisms and interactions. The trend of soil temperature changes in different soil layers of farmland during the freeze–thaw period was basically consistent with the air temperature, with soil temperature changes lagging behind those of air temperature (Figure 3). This lag was primarily due to temperature fluctuations being the main driver of the freezing and thawing processes [24]. Variations in soil temperature during freezing and thawing induced heat conduction in the soil, leading to transitions between solid and liquid states of soil moisture and migration of soil solutes, ultimately impacting agricultural crop growth [25]. Soil solutes can cause liquid water to coexist with ice at subzero temperatures, lowering the soil freezing point. Moreover, the reduction in liquid water diminishes the concentration and mobility of soil solutes, impeding the soil freezing process [26]. During the freeze–thaw process, freezing lasted longer (82 days) than thawing (45 days). As the soil depth increased, the durations of freezing and thawing shortened progressively. These occur because soil freezing and thawing proceed in a downward direction from the surface. When soil freezes, moisture in the soil absorbs heat, leading to negative soil temperatures. With an increasing soil depth, the consumption of negative temperature rose, thus extending the freezing duration. The change pattern of the farmland soil temperature gradually decreased with the deepening of the soil layer. This was attributed to the increased volumetric heat capacity and thermal conductivity of soil with depth, resulting in a reduced energy exchange at the soil–atmosphere interface [27]. During the thawing period, the surface soil was influenced by temperature, forming a non-frozen layer in the soil. Deeper soil experienced bidirectional thawing due to insulation from upper soil layers and the influence of groundwater.

4.2. Soil Water and Salt Migration and Distribution

The distribution of soil water and salt at critical points during the freeze–thaw period aligned with the overall trend observed (Figure 4). Horizontally, soil moisture and salinity exhibited contrasting trends with an increasing distance from the main forest belt. This indicated that farmland soil salts tended to migrate toward shelterbelts, and shelterbelts could absorb salt to some extent during the freeze–thaw period. Following freezing and thawing, the soil moisture content increased to varying degrees at different distances from the main forest belts, consistent with previous research on the freeze–thaw process [28]. Freezing and thawing led to a significant increase in the water content of the deep soil. Although the water content of the surface layer increased slightly, it remained lower than that of the deep soil. These possible reasons included soil freezing initiation from the surface, large day–night temperature variations causing alternating surface soil freezing and melting, night-time temperature drops, and subsequent soil moisture freezing. Capillary water formed due to water film viscosity and surface tension, creating a water potential difference between soil particles and frozen ice crystals [29]. During freezing, water accumulated on ice crystals. Soil melting during the day increased liquid water, facilitating continuous water migration under daily freezing and thawing cycles. The freezing effect outweighed the thawing effect, resulting in an increase in the soil water content [30]. During the melting and thawing period, the soil moisture content at 1 H, 2 H, and 3 H inside the farmland exhibited a more pronounced accumulation compared to the 40–60 cm and 60–80 cm soil layers near the forest edge (0.3 H and 4 H). This may be attributed to the growth and absorption of water by the root system of the shelterbelt in spring, which led to a decrease in soil moisture in farmland near the forest edge.
The moisture content of farmland soil near the forest edge was lower than that of the soil inside the farmland. The soil moisture content of farmland near and far from the forest belt differed by up to 25.63%. The difference in the moisture content gradually decreased as the soil layer deepened (Figure 5). During the freeze–thaw period, the soil moisture content was affected by surface evaporation and the action of the root system in the forest belt [31]. The shading of the forest belt and the water absorption by the root system caused the soil near the forest edge to freeze early and quickly [3]. The water content at the edge of the forest belt was low, and the movement of soil moisture in farmland near and far from the protective forest belt was obviously different. This was mainly due to the influence of autumn irrigation on farmland and the water and fertilizer tendency of protective forest roots, as well as the occurrence of water exchange between farmland and protective forest [32], which led to different spatial distributions of soil moisture at different distances from the forest belt. The results of this study were consistent with previous studies [33], indicating that the freezing process led to an increase in soil moisture in forest and farmland areas, while the melting process led to a decrease in the overall soil moisture content from 0 to 40 cm. Water movement was the potential hydraulic head gradient between hot and cold soil caused by the influence of temperature on the matric potential of frozen soil. A previous study has shown that the initial soil moisture content through the difference in hydraulic conductivity had a significant impact on the water redistribution caused by freezing [34]. Therefore, rational use of autumn watering to control the farmland moisture content can regulate the degree of soil freezing and ensure smooth thawing in spring.
Under freeze–thaw action, soil salinity in farmland migrated to the surface, resulting in two aggregation phenomena (Figure 6). The temperature gradually decreased during the initial freezing period, and agricultural activities such as autumn watering caused some surface salts to be leached and transported to the deep soil. As the freezing front continued to deepen, the salt formed different concentration gradients during the freezing process for dispersion and migration [35]. The frozen layer continued to deepen, and the freezing front developed downward. Under the action of temperature and water potential gradients, a large amount of salt accumulated in the frozen layer. Continuous soil freezing in winter led to further salt accumulation in the frozen layer, mainly due to water migration towards it and frost heaving, causing soil voids to expand and leading to saturation and salt accumulation. During the cooling process, the upward migration of soil salt surpassed that observed during warming, leading to the accumulation of salt in the surface soil as it circulated. This accumulation ultimately gave rise to soil salinization [36]. During the melting period, surface evaporation depleted upper soil water, while the middle layer of frozen soil hindered surface meltwater penetration, causing stagnant water in the upper layer and inducing secondary salt rise. The soil salt content could reach a maximum of 0.62 g·kg−1, increasing the overall soil salt content, especially in surface soil, where serious salt accumulation occurred, leading to salt’s return in spring. The results of this study were consistent with previous studies [37], which showed that as soil water and salt moved from the frozen layer to the frozen layer, the salt of the frozen layer gathered in the upper layer of the soil layer. Farmland soil near the forest edge (a mean value of 0.3 H and 4 H) generally exhibited a higher salt content than that inside farmland (a mean value of 1 H, 2 H, and 3 H). High soil salt accumulation at the forest belt edge exacerbated its negative effect and facilitated soil salinization during the sowing season, affecting spring crop growth and development [38]. Agricultural measures such as autumn irrigation or rational organization and distribution can mitigate salt-accumulation effects in forest belts.

4.3. Soil Water and Salt Prediction Model

The process of soil water and salt migration during the freeze–thaw period is complex and influenced by various factors [39]. Observing and studying multiple indicators are necessary to reveal connections between variables. Two models were used to simulate farmland soil water and salt during this period and predict their conditions during the spring sowing stage. The goodness of fit of the multivariate statistical model for predicting soil water and salt was 0.94 and 0.72, respectively. Predictions were generally aligned with reality, albeit with some errors at mutation points. The simulated soil moisture content distribution was flatter than measured values, attributed to possible unfrozen ice layers hindering water infiltration, resulting in a higher actual soil moisture content [40]. The randomness of soil melting led to an uneven spatial distribution, limiting the model’s accuracy. Increasing measured points can enhance model accuracy. The distribution pattern of soil salinity based on measured values was similar to that of predicted values, while the predicted values of soil salinity were lower than the measured values. As soil salt continuously precipitates during melting, it also accumulates in deep soil layers as soil water infiltrates. In addition, soil salt transport was also affected by other factors, such as groundwater [41], so it was necessary to expand the analysis of the correlation characteristics between other factors and soil salinity and then introduce them into the model. Near the forest edge, the soil moisture content was lower than inside farmland, with differences showing a trend of increasing, then decreasing, then increasing with the soil layer depth. The goodness of fit of soil water and salt in the BP neural network model was 0.82 and 0.85, respectively. Predictions were generally accurate, ensuring accuracy for each soil part. Both multivariate statistical and BP neural network models were suitable for soil water and salt prediction, with the latter showing significantly higher fitting goodness for soil salt content prediction due to its suitability for nonlinear characteristics. Combining soil moisture and nutrient results, the BP neural network model demonstrated better comprehensive prediction ability than the multivariate statistical model.

5. Conclusions

This study focused on investigating the migration patterns of farmland soil water and salt during freeze–thaw periods, utilizing the shelterbelt system in the Hetao Irrigation Area as the research subject. Freeze–thaw phenomena in seasonal areas were primarily driven by temperature, with soil temperature changes lagging behind air temperature fluctuations. The soil temperature increased with depth, but the rate of change decreased. Soil freezing lasted longer than thawing, and the cycle duration decreased with depth. The protective forest belt significantly influenced water and salt transport in farmland soil, with lower moisture and a higher salt content near the forest edge. Horizontal migration of soil salt to the surface occurred during freezing and thawing, leading to secondary surface salt accumulation and soil salinization. The salt content near the forest edge exceeded that within the farmland, indicating a stronger land-threatening effect. Agricultural measures like autumn irrigation can mitigate salt accumulation. The measured soil moisture and salt content corresponded well with predictions. Including groundwater parameters in future studies could enhance model accuracy. Both the multivariate statistical model and the BP neural network effectively predicted freeze–thaw soil water and salt dynamics, with the latter showing superior predictive capabilities.

Author Contributions

Conceptualization, H.X.; methodology, K.H.; software, K.H.; validation, C.L.; formal analysis, C.L.; investigation, K.H. and X.J.; resources, Z.X.; data curation, K.H.; writing—original draft preparation, C.L.; writing—review and editing, R.W., H.X. and J.Z.; visualization, C.L.; supervision, R.W.; project administration, Z.X.; funding acquisition, H.X. All authors have read and agreed to the published version of the manuscript.

Funding

This research was funded by the Provincial Scientific Research Projects of Inner Mongolia, China (2022YFHH0065), the National Key Research and Development Program of China (2023YFF1304204, 2023YFE0121800), the National Natural Science Fund (32371961), and Inner Mongolia Autonomous Region ‘Unveiling the List and Leading the Project’ (2024JBGS0002).

Data Availability Statement

The data presented in this study are available on request from the corresponding author.

Acknowledgments

The authors would like to thank Huaiyuan Liu (Experimental Center of Desert Forestry, Chinese Academy of Forestry) and XinTong Zhang for their efforts in collecting and preprocessing the data.

Conflicts of Interest

The authors declare no conflicts of interest.

References

  1. Zhao, Y.j.; Mao, F.; Yang, X.H. Soil Salinization and Its Improvement in Arid Hetao Plain, Inner Mongolia: Irrigation Roles. Chin. For. Sci. Technol. 2010, 3, 27–35. [Google Scholar]
  2. Guo, S.S.; Ruan, B.Q.; Chen, H.R.; Guan, X.Y.; Wang, S.L.; Xu, N.N.; Li, Y.P. Characterizing the spatiotemporal evolution of soil salinization in Hetao Irrigation District (China) using a remote sensing approach. Int. J. Remote Sens. 2018, 39, 6805–6825. [Google Scholar] [CrossRef]
  3. Huang, Q.; Xu, X.; Lü, L.; Ren, D.; Ke, J.; Xiong, Y.; Huo, Z.; Huang, G. Soil salinity distribution based on remote sensing and its effect on crop growth in Hetao Irrigation District. Trans. Chin. Soc. Agric. Eng. 2018, 34, 102–109. [Google Scholar]
  4. Katekhong, W.; Charoenrein, S. Effect of rice ageing and freeze-thaw cycle on textural properties of cooked rice (Oryza sativa L.) cv. Khao Dawk Mali 105. Int. J. Food Sci. Technol. 2014, 49, 2283–2289. [Google Scholar] [CrossRef]
  5. Wu, T.; Yu, M.; Wang, G.; Wang, Z.; Duan, X.; Dong, Y.; Cheng, X. Effects of stand structure on wind speed reduction in a Metasequoia glyptostroboides shelterbelt. Agrofor. Syst. 2013, 87, 251–257. [Google Scholar] [CrossRef]
  6. Cui, L.; Zhao, Y.; Yi, J.; Zhang, J.; Wang, Y.; Wang, Y. Soil Water and Heat Dynamics in Soil Freezing-Thawing Processes of Farmland.Desert Transitional Zone in Middle Reach of Heihe River. Bull. Soil Water Conserv. 2014, 6, 94–100. [Google Scholar]
  7. Kang, Y.; Chen, M.; Wan, S. Effects of drip irrigation with saline water on waxy maize (Zea mays L. var. ceratina Kulesh) in North China Plain. Agric. Water Manag. 2010, 97, 1303–1309. [Google Scholar]
  8. Zheng, C. Research on evapotranspiration benefits of farmland protective forests in sandy areas. Sci. Technol. Qinghai Agric. For. 1999, 4, 51. [Google Scholar]
  9. Guo, Y.; Yin, X.; Li, Y.; Chen, Y.; Cui, M. Soil water and salt dynamics and its coupling model at cropland-treebelt-desert compound system. Trans. Chin. Soc. Agric. Eng. 2019, 35, 87–101. [Google Scholar]
  10. Wu, Y.Y.; Ma, B.; Jiang, Y. Influence of Typical Desert Farmland Shelter Forest on Soil Water and Salt Dynamics in Cotton Fields. Xinjiang Agric. Sci. 2021, 58, 1012–1020. [Google Scholar]
  11. Bing, H.; He, P.; Zhang, Y. Cyclic freeze–thaw as a mechanism for water and salt migration in soil. Environ. Earth Sci. 2015, 74, 675–681. [Google Scholar] [CrossRef]
  12. Zhang, D.; Wang, S. Mechanism of freeze–thaw action in the process of soil salinization in northeast China. Environ. Geol. 2001, 41, 96–100. [Google Scholar] [CrossRef]
  13. Hu, G.; Zhao, L.; Wu, X.; Wu, T.; Li, R.; Xie, C.; Xiao, Y.; Pang, Q.; Liu, G.; Hao, J.; et al. A mathematical investigation of the air-ground temperature relationship in permafrost regions on the Tibetan Plateau. Geoderma 2017, 306, 244–251. [Google Scholar] [CrossRef]
  14. Todd, R.; Evett, S.; Howell, T.; Klocke, N. Soil Temperature and Water Evaporation of Small Steel and Plastic Lysimeters Replaced Daily. Soil Sci. 2000, 165, 890–895. [Google Scholar] [CrossRef]
  15. Rennie, D.A.; Heimo, M. Soil and fertilizer-n transformations under simulated zero till: Effect of temperature regimes. Can. J. Soil Sci. 1984, 1, 1–8. [Google Scholar] [CrossRef]
  16. Bao, W.; Xie, Y.; Yang, X. A laboratory test study on water and salt migration in natural saline soils and associated shear strength changes under freezing and thawing cycles. J. Eng. Geol. 2006, 3, 380–385. [Google Scholar]
  17. Zhang, L.; Han, W.; Gu, T. The Influence of Freezing and Thawing on the Moisture-Salt Activity of Soil in Caowotan Basin of Jingdian Irrigated Area. J. Glaciol. Geocryol. 2003, 25, 297–302. [Google Scholar]
  18. Zhong, Y.Q.; Chen, Y.X.; Shi, H.B.; Wei, Z.M. An Artificial Neural Network Forecast Model for Regional Soil Water-Salt Regime. Irrig. Drain. 2002, 21, 40–44. [Google Scholar]
  19. Huo, Z.L.; Shi, H.B.; Kong, D.; Zhang, L.H.; Cheng, Y.X.; Wei, Z.M.; Qu, Z.Y. Preliminary Study on Crop-Water-Salt Response with Aritificial Neural Network. J. Inn. Mong. Agric. Univ. 2003, 24, 66–70. [Google Scholar]
  20. Zheng, D.M.; Xu, L.S.; Luo, J.M.; Bao, C.H. Research on the Water and Salt Dynamics in Salinized Wetlands of Songnen Plain During the Freezing/Thawing Period-Taking the lakebeach in Shisan lake, Changling District as an example. Wetl. Sci. 2005, 3, 48–53. [Google Scholar]
  21. Hao, K.; Xiao, H.; Xin, Z.; Wang, B.; Cao, Q. The Seasonal Freezing and Thawing Process of the Soil and the Characteristies of Water and Salt Transport in the Farmland Shelter Forest Net in the Hetao lrrigation Distriet. J. Soil Water Conserv. 2022, 36, 231–237. [Google Scholar]
  22. Flerchinger, G.N.; Saxton, K.E. Simultaneous Heat and Water Model of a Freezing Snow-Residue-Soil System I. Theory and Development. Trans. ASAE 1989, 32, 573–576. [Google Scholar] [CrossRef]
  23. Coulibaly, P.; Anctil, F.; Aravena, R.; Bobée’, B. Artifcial neural network modeling of water table depth Huctuations. Water Resour. Res. 2001, 37, 885–896. [Google Scholar] [CrossRef]
  24. Bai, R.Q.; Lai, Y.M.; Zhang, M.Y.; Jiang, H.Y. Investigating the thermo-hydro-mechanical behavior of loess subjected to freeze-thaw cycles. Acta Geotech. 2024. [Google Scholar] [CrossRef]
  25. Zhang, Y.; Ma, Y.; Zhang, Z.; Gao, H.; Zhai, J. Hillslope patterns in thaw-freeze cycle and hydrothermal regimes on Tibetan Plateau. Chin. Sci. Bull. 2015, 60, 664–673. [Google Scholar]
  26. Wu, M.; Tan, X.; Huang, J.; Wu, J.; Jansson, P. Solute and water effects on soil freezing characteristics based on laboratory experiments. Cold Reg. Sci. Technol. 2015, 115, 22–29. [Google Scholar] [CrossRef]
  27. Gan, L.; Peng, X.; Peth, S.; Horn, R. Effects of grazing intensity on soil thermal properties and heat flux under Leymus chinensis and Stipa grandis vegetation in Inner Mongolia, China. Soil Tillage Res. 2012, 118, 147–158. [Google Scholar] [CrossRef]
  28. Liu, X.; Liu, Q.; Liu, T.; Duan, L.; Yue, C. Rules of the dynamic water heat-salt transfer in soil of Horqin meadow during freezing and thawing period. Adv. Water Sci. 2015, 26, 331–339. [Google Scholar]
  29. Ala, M.S.; Liu, Y.; Wang, A.Z.; Niu, C.Y. Characteristics of soil freeze-thaw cycles and their effects on water enrichment in the rhizosphere. Geoderma 2016, 264, 132–139. [Google Scholar]
  30. Wang, L.; Seki, K.; Miyazaki, T.; Ishihama, Y. The causes of soil alkalinization in the Songnen Plain of Northeast China. Paddy Water Environ. 2009, 7, 259–270. [Google Scholar] [CrossRef]
  31. Zhang, H.; Zhi, B.; Liu, E.L.; Wang, T.H. Study on Varying Characteristics of Temperature Field and Moisture Field of Shallow Loess in the Freeze-Thaw Period. Adv. Mater. Sci. Eng. 2020, 2020, 1690406. [Google Scholar] [CrossRef]
  32. Shen, Q.; Gao, G.; Fu, B.; Lü, Y. Sap flow and water use sources of shelter-belt trees in an arid inland river basin of Northwest China. Ecohydrology 2015, 8, 1446–1458. [Google Scholar] [CrossRef]
  33. Yi, J.; Zhao, Y.; Shao, M.A.; Zhang, J.; Cui, L.; Si, B. Soil freezing and thawing processes affected by the different landscapes in the middle reaches of Heihe River Basin, Gansu, China. J. Hydrol. 2014, 519, 1328–1338. [Google Scholar] [CrossRef]
  34. Nagare, R.M.; Schincariol, R.A.; Quinton, W.L.; Hayashi, M. Laboratory calibration of time domain reflectometry to determine moisture content in undisturbed peat samples. Eur. J. Soil Sci. 2011, 62, 505–515. [Google Scholar] [CrossRef]
  35. Wang, T.; Li, P.; Li, Z.B.; Hou, J.M.; Xiao, L.; Ren, Z.P.; Xu, G.C.; Yu, K.X.; Su, Y.Y. The effects of freeze-thaw process on soil water migration in dam and slope farmland on the Loess Plateau, China. Sci. Total Environ. 2019, 666, 721–730. [Google Scholar] [CrossRef] [PubMed]
  36. Wu, D.; Zhou, X.; Jiang, X. Water and Salt Migration with Phase Change in Saline Soil during Freezing and Thawing Processes. Groundwater 2017, 56, 742–752. [Google Scholar] [CrossRef] [PubMed]
  37. Guo, K.; Liu, X.R. Salt leaching process in coastal saline soil by infiltration of melting saline ice under field conditions. J. Soil Water Conserv 2020, 75, 549–562. [Google Scholar] [CrossRef]
  38. Oogathoo, S.; Duchesne, L.; Houle, D.; Kneeshaw, D.; Bélanger, N. Precipitation and relative humidity favours tree growth while air temperature and relative humidity respectively drive winter stem shrinkage and expansion. Front. For. Glob. Change 2024, 7, 1368590. [Google Scholar] [CrossRef]
  39. Zhang, H.B.; Wang, J.; Liu, Z.K.; Ma, C.Y.; Song, Z.S.; Cui, F.; Wu, J.Q.; Song, X.G. Strength characteristics of foamed concrete under coupling effect of constant compressive loading and freeze-thaw cycles. Constr. Build. Mater. 2024, 411, 134565. [Google Scholar] [CrossRef]
  40. Jin, J.X.; Zhang, X.L.; Liu, X.L.; Li, Y.H.; Li, S.H. Study on critical slowdown characteristics and early warning model of damage evolution of sandstone under freeze-thaw cycles. Front. Earth Sci. 2023, 10, 1006642. [Google Scholar] [CrossRef]
  41. Lyu, H.; Li, H.; Zhang, P.; Cheng, C.; Zhang, H.; Wu, S.S.; Ma, Q.C.; Su, X.S. Response mechanism of groundwater dynamics to Freeze-thaw process in seasonally frozen soil areas: A comprehensive analysis from site to regional scale. J. Hydrol. 2023, 625, 129861. [Google Scholar] [CrossRef]
Figure 1. Geographical location map of the study area.
Agronomy 14 01425 g001
Figure 2. Distribution of sampling points in the farmland shelterbelt system. The letter H represents the average height of the main shelterbelts.
Agronomy 14 01425 g002
Figure 3. Soil temperature and air temperature changes at different locations in farmland. The letter H represents the average height of the main shelterbelts. The abbreviation AT stands for air temperature. Figure (a) represents the variation of average soil temperature in different soil layers, while Figures (bf) show the variation of soil temperature at different distances from the forest belt.
Agronomy 14 01425 g003
Figure 4. Spatial distribution of soil water and salt at critical points during different freeze–thaw periods. Different lowercase letters indicate significant differences between the different depths (p < 0.05). Different uppercase letters indicate significant differences in the same depth between the different distances from the shelterbelt (p < 0.05). Figures (ac) and (df) represent the soil moisture and salt content at different distances from the forest belt, respectively.
Agronomy 14 01425 g004
Figure 5. Changes in soil moisture at different locations during the freeze–thaw period. The letter H represents the average height of the main shelterbelts.
Agronomy 14 01425 g005
Figure 6. Changes in soil salinity at different locations during the freeze–thaw period. The letter H represents the average height of the main shelterbelts.
Agronomy 14 01425 g006
Figure 7. The true value and the predicted value of the multiple regression model of the spatial distribution of soil water and salt. Figures (a) and (b) represent the measured and simulated values of soil moisture content, respectively. Figures (c) and (d) represent the measured and simulated values of soil salt content, respectively.
Agronomy 14 01425 g007
Figure 8. The actual value of soil water and salt spatial distribution and the predicted value of BP neural network model. Figures (a) and (b) represent the measured and simulated values of soil moisture content, respectively. Figures (c) and (d) represent the measured and simulated values of soil salt content, respectively.
Agronomy 14 01425 g008
Table 1. Correlation between soil moisture and salinity at different depths during freeze–thaw cycles. * and ** indicate significance at the 0.05 and 0.01 levels, respectively.
Soil Layer (cm)0–2020–4040–6060–8080–1000–100 (Mean)
Correlation coefficient−0.95 *−0.99 **−0.99 **−0.58−0.03−0.99 **
Disclaimer/Publisher’s Note: The statements, opinions and data contained in all publications are solely those of the individual author(s) and contributor(s) and not of MDPI and/or the editor(s). MDPI and/or the editor(s) disclaim responsibility for any injury to people or property resulting from any ideas, methods, instructions or products referred to in the content.

