Article

Research on the Control System for the Use of Biogas Slurry as Fertilizer

1
Research Center of Fluid Machinery Engineering and Technology, Jiangsu University, Zhenjiang 212013, China
2
Jiangsu Province and Education Ministry Co-Sponsored Synergistic Innovation Center of Modern Agricultural Equipment, Jiangsu University, Zhenjiang 212013, China
3
Farmland Irrigation Research Institute, Chinese Academy of Agricultural Sciences, Xinxiang 453014, China
4
College of Water Resources and Civil Engineering, China Agricultural University, Beijing 100083, China
5
YTO Group Corporation, Luoyang 471004, China
*
Authors to whom correspondence should be addressed.
Agronomy 2024, 14(7), 1439; https://doi.org/10.3390/agronomy14071439
Submission received: 5 June 2024 / Revised: 24 June 2024 / Accepted: 29 June 2024 / Published: 1 July 2024

Abstract

:
Due to its rich nutritional composition, biogas slurry can serve as a special liquid fertilizer. However, the application of slurry in agricultural fields currently faces challenges such as reliance on skilled famers’ experience, low precision, and difficulty in accurately controlling the irrigation dosage. To address these issues, an agricultural biogas slurry mixing agricultural machinery and its system has been designed and developed with the aim of enhancing the precision and safety of slurry application. The structure of the device has been designed, filter components have been selected, and improvements have been made to the structure of traditional connectors. Taking into account factors such as soil and humidity, an algorithm based on biogas slurry conductivity for slurry mixing decisions and the feedback control mechanism has been designed. After assembling the prototype, experiments were conducted, and the results showed that after processing by the system, compared to the calculated theoretical optimum, the concentration error of each component in the mixed fertilizer was controlled within 10%, and the conductivity fluctuation range was within 5%. This indicates that the overall ratio accuracy and stability of the biogas slurry mixing system are high. The biogas slurry mixing agricultural machinery and its system provide a novel intelligent equipment solution for the precise application of slurry, effectively enhancing the accuracy and safety of slurry application, reducing the use of chemical fertilizers during agricultural irrigation, and minimizing pollution to the environment and soil.

1. Introduction

In recent years, the surplus population in China has led to a further increase in demand for grain, poultry, and livestock products. It is estimated that by 2050, the global population will reach 9.7 billion [1]. Fertilization is an important means to enhance crop yield and quality, and improve soil nutrient levels. However, in the case of China, the annual fertilizer utilization rate was about 330 kg/hectare in 2016, significantly higher than the world average of 120 kg/hectare [2]. Excessive use of chemical fertilizers has negative impacts on the activities of soil microorganisms, reducing soil fertility and affecting crop yields. The large volume and high salt concentration of wastewater from poultry and livestock farming can lead to soil salinization and eutrophication of water bodies when directly discharged, posing a threat to agricultural production safety and exacerbating water scarcity issues [3,4]. Liquid manure, a product of the anaerobic fermentation of animal manure, has been found to contain abundant readily available fertilizer elements (N, P, K, etc.), amino acids (17 kinds), some B vitamins (such as vitamin B12), some plant hormones (such as auxins, gibberellins), and certain trace elements (calcium, copper, iron, zinc, etc.) [5,6]. Irrigating and returning fields with liquid manure can effectively supplement soil fertility and enhance soil microbial diversity. The presence of plant growth hormones like gibberellins in liquid manure can promote plant growth. Studies have shown that proper application of liquid manure can effectively mitigate nitrogen leaching, enhance microbial nitrate transformation, and alleviate environmental pressures caused by agricultural production by regulating the microbial community [7]. Therefore, the irrigation of liquid manure to some extent achieves the rational utilization of poultry and livestock manure, reducing the dependency of agricultural production on conventional inorganic fertilizers [8,9]. In practical applications, liquid manure can be used as a base or top dressing for conventional agricultural crops and can also be used in the preparation of nutrient solutions for soilless cultivation of crops. Based on the water–fertilizer characteristics of liquid manure, in the process of formulating liquid manure for field application, liquid manure can be regarded as a special type of liquid organic fertilizer. Therefore, current technologies related to fertilizer applicators, liquid fertilizer formulation, and application can serve as references for the research of liquid manure formulation devices.
In terms of fertilizer formulation, commonly used methods involve integrating devices such as pressure difference fertilization tanks, Venturi fertilizers, proportioning fertilization pumps with automatic control technology. Pressure difference fertilization tanks typically consist of fertilizer pipes, throttling valves, and connecting pipes. Fertilizer mixing is achieved through the pressure difference between tanks, but there is an issue with the low precision of fertilizer concentration control [10]. For example, Hu et al. derived a method for uniform fertilization flux control, proposed a numerical model for the mixed flow of water and fertilizer, and validated the improvement in fertilization uniformity through flux control, enhancing the performance of pressure difference fertilization tanks [11]. Venturi fertilizers are devices that use pressure differences to draw liquid fertilizer from fertilization tanks into the pipe network. However, these devices suffer from significant pressure loss and are only suitable for areas with small irrigation volumes [10]. Wu et al. proposed an optimization and control method for greenhouse fertilization systems, employing an improved multi-line mixed Venturi tube [12]. This design reduced overshooting in the fertilization control algorithm, effectively enhancing the fertilization performance of the Venturi fertilization device. Proportional fertilization pumps are more commonly used in integrated water–fertilizer technologies, but they face issues with a susceptibility to blockages. Wang et al. combined micro-spraying technology with proportional fertilization pumps, improving the uniformity of liquid fertilizer [13]. Similarly, Liu et al. integrated drip irrigation technology with proportional fertilization pumps, focusing on studying the blocking mechanism of drip irrigation systems and concluding that the main cause of blockages is phosphate fertilizer [14]. All of the aforementioned fertilization devices can be applied to liquid manure formulation devices. Current designs for fertilization devices primarily focus on mechanical structures and control systems. Existing fertilization machines can be categorized into handheld fertilization machines and large-scale fertilization devices. Handheld fertilization machines are suitable for economically important crops with smaller quantities, while large-scale fertilization devices are applied in extensive agricultural fields. Sumon et al. developed a handheld fertilization machine for basal fertilization, achieving more accurate and consistent fertilization results [15]. Chen et al. designed a variable-rate fertilization machine, improving the accuracy and uniformity of fertilization through a speed measurement unit and pulse-width modulation control system [16]. The variable-rate fertilizer applicator developed by Mirzakhaninafchi achieves precise control of fertilization by altering the rotational speed of the hydraulic motor to regulate the fertilizer application rate [17]. However, unlike traditional fertilizers, there is no standardized criterion for intelligent decision making regarding the dosage of each fertilizer component due to variations in the composition and content of liquid manure from different sources. Currently, the formulation of liquid manure for field application primarily relies on a combination of expert experience and automated machinery. This involves using accumulated experience from practical agricultural production to guide the formulation of liquid manure for field application. The decision results are then implemented by automated mixing devices to achieve automatic liquid manure formulation [18,19]. However, expert experience has limitations, such as a long accumulation period and limited applicability to specific regions, which does not align with the requirements of modern agriculture for large-scale, efficient development. With the demands of the livestock and farming industries, the trend towards unmanned and intelligent liquid manure formulation for field application is inevitable. Figure 1 shows some of the most common biogas slurry irrigation methods and equipment.
Addressing the above issues, this paper proposes the design of a precise liquid manure formulation device with the goal of enhancing the accuracy and safety of liquid manure application. The proposed structure includes water injection, liquid manure injection, supplementary fertilization, mixing, and dispensing structures. Key improvements have been made in the design of the traditional connector structure, with the introduction of a liquid manure formulation and mixing structure based on matching the volumes of the storage and formulation chambers. This enhances the anti-overflow performance of the precise liquid manure formulation device. Additionally, a proportional control algorithm for liquid manure formulation components has been designed based on the adjustable mechanism of the time ratio within the fertilization cycle. Combined with a monitoring feedback adjustment mechanism, this algorithm achieves precise transmission control of liquid manure formulation components and ensures the stability of fertilizer output.

2. Materials and Methods

2.1. Design of the Overall Structure

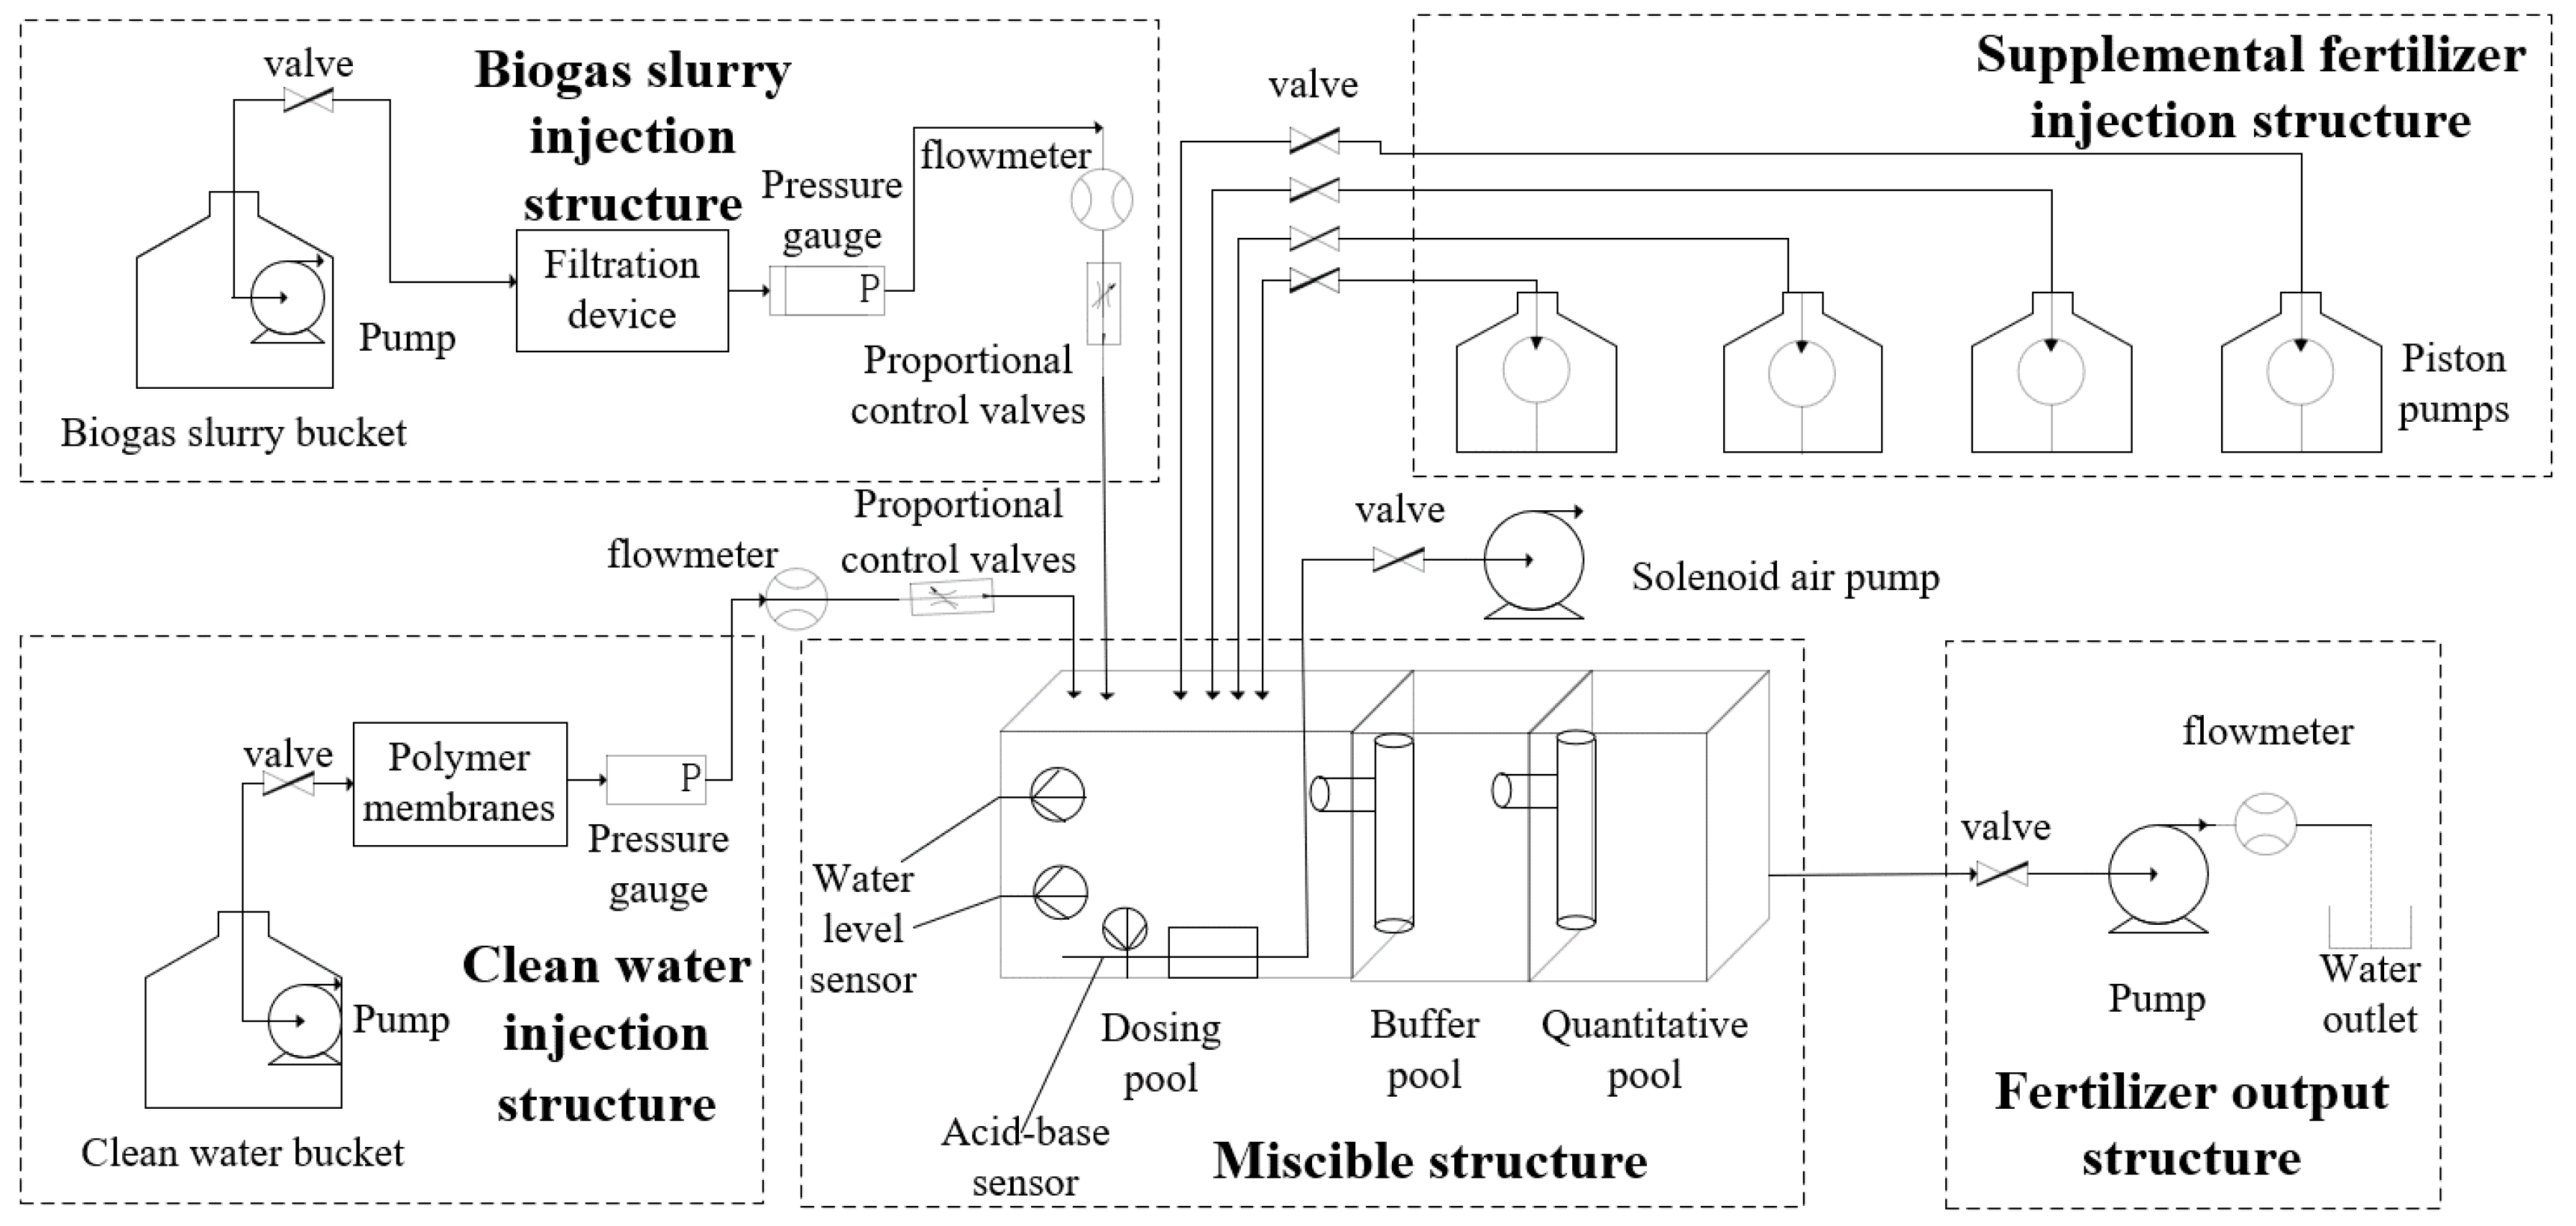
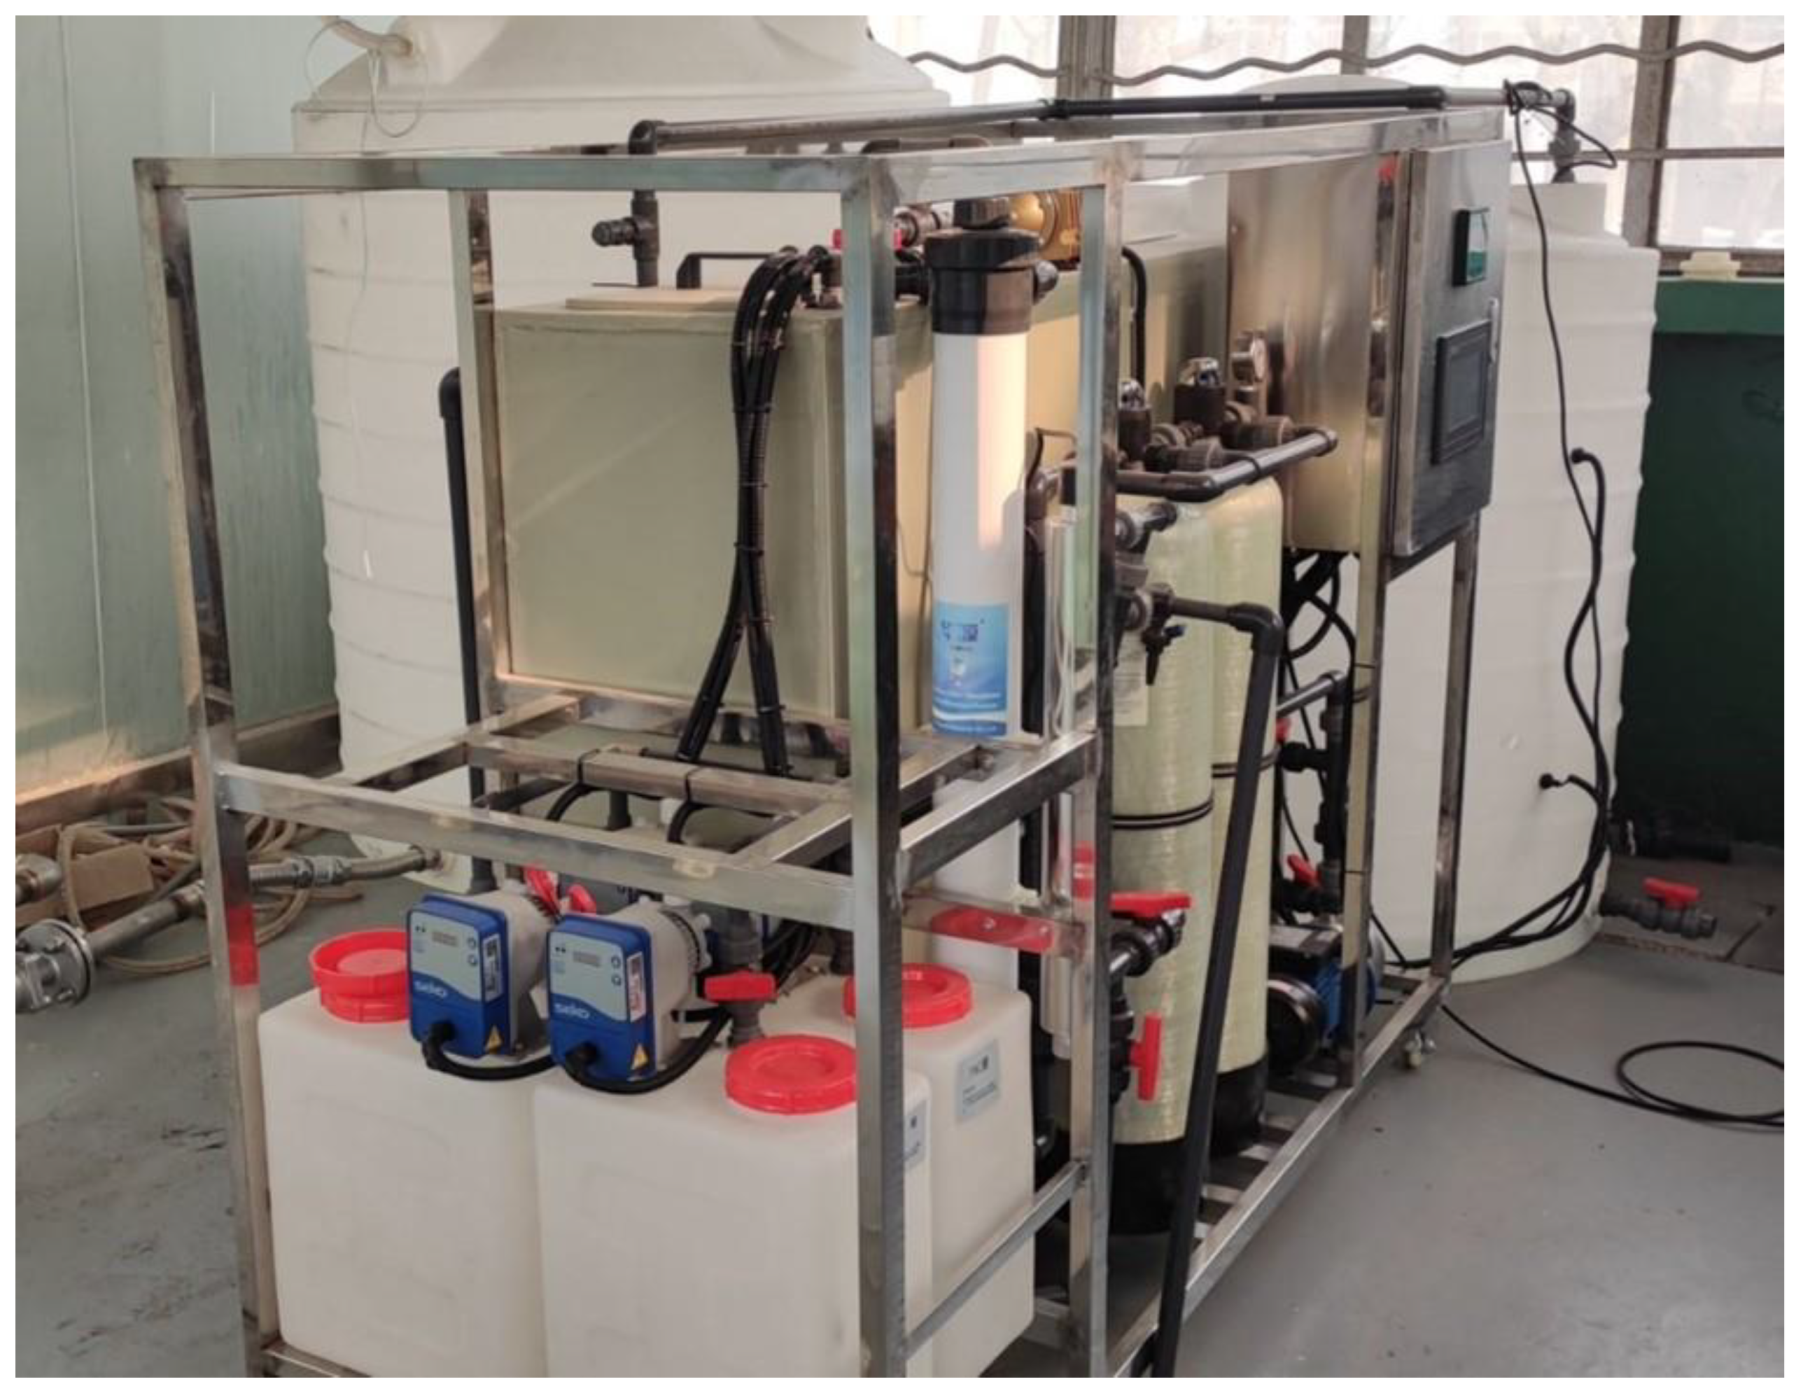
The designed structure of the precision biogas slurry mixing device is illustrated in Figure 2, comprising the main components of a clean water injection structure, biogas slurry injection structure, supplementary fertilizer injection structure, mixing structure, and fertilizer discharge structure. Considering the functional differences in the execution of actual mixing tasks by each structure, designs and selections were made for critical execution components such as filtering mechanisms, power components (different types of pumps used in the pipeline), and pipeline on–off control components (solenoid valves). The focus of the design and selection was primarily on the biogas slurry injection and supplementary fertilizer injection parts. Simultaneously, improvements were made to traditional connector structures, and a biogas slurry mixing and delayed transmission structure based on volume matching was designed to enhance the anti-overflow performance of the precision biogas slurry mixing device. The physical diagram of the system is shown in Figure 3.

2.2. Design of Mixing Structure

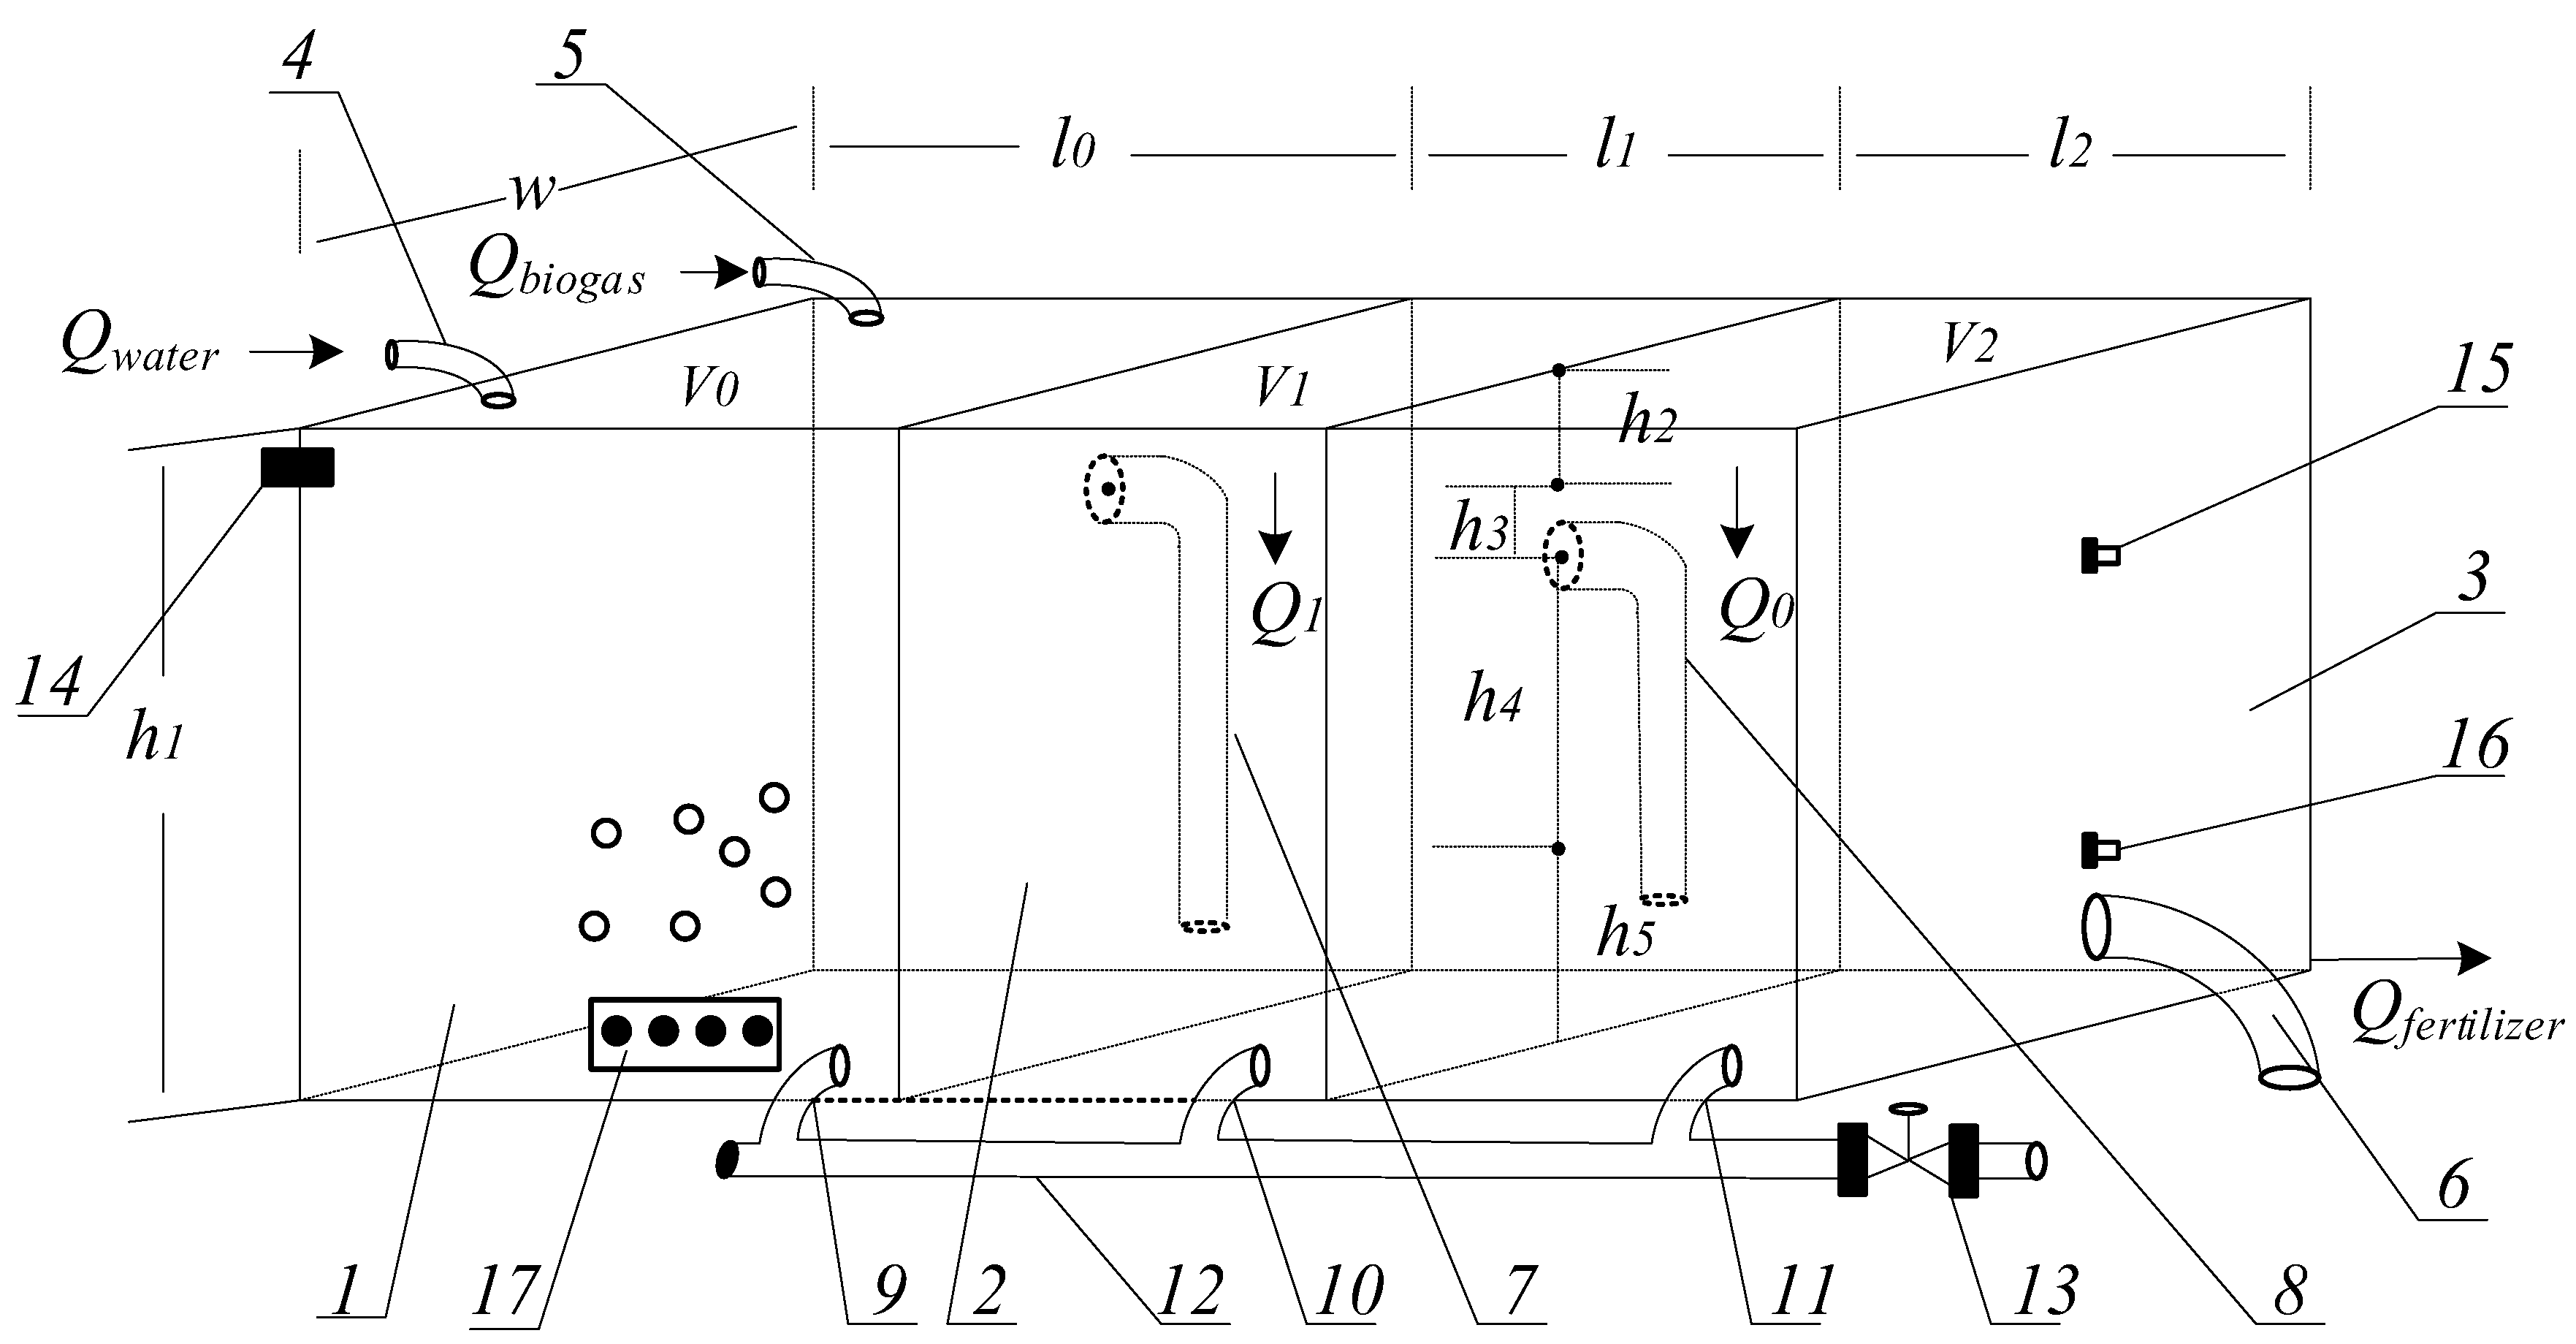
In this study, by altering the connection points of the connector, it is possible to create a liquid level difference in the mixing structure, buffer chamber, and fertilizer storage chamber by relying on atmospheric pressure. This occurs while reasonably controlling the input and output flow rates of the mixing structure. Consequently, the internal space of the mixing structure exhibits relative independence and delayed transmission characteristics. The specific design of the biogas slurry mixing structure is illustrated in Figure 2, consisting of three main parts: the mixing chamber responsible for completing the mixing of fertilizers, the buffer chamber for buffering the fertilizer, and the fertilizer storage chamber for storing and dispensing the fertilizer. By judiciously selecting the connection points of the primary connecting pipe and the secondary connecting pipe, and simultaneously initiating or stopping the discharge of fertilizer from the storage chamber at the appropriate times, a liquid level difference can be formed between the mixing chamber, buffer chamber, and storage chamber. This configuration achieves delayed fertilizer transmission between the chambers, facilitating an integrated process for biogas slurry mixing, buffering, and fertilizer output. The meanings of the labels in Figure 4 are as indicated in Table 1.
Since the supplementary fertilizer, as an adjuster for biogas slurry mixing, has a volume significantly smaller than that of biogas slurry and clean water, the structural calculations only consider the impact of the flow rates of input water, biogas slurry, and discharged fertilizer on the structural design. The specific calculation process is as follows:
  • From prior knowledge, it is known that the irrigation time required for the stable application of biogas slurry mixed fertilizer satisfies Equation (1):
t = V f e r t i l i z e r Q f e r t i l i z e r
where V f e r t i l i z e r is the volume of the required biogas slurry mixed fertilizer, m³, and Q f e r t i l i z e r is the flow rate at the outlet of the mixing structure, m³/s.
2.
After the fertilizer enters the buffer chamber from the mixing chamber, the time for the liquid level of the fertilizer in the buffer chamber to rise from the chamber bottom to the discharge outlet should be consistent with the fertilizer buffering time, satisfying Equation (2):
t 0 = Q 1 h 4 + h 5 W l 1
where W is the width of the mixing chamber, m; l 1 is the length of the buffer chamber, m; h 4 is the distance between the startup and shutdown liquid level monitoring sensors in the storage chamber, m; and h 5 is the distance from the shutdown liquid level monitoring sensor to the bottom of the storage chamber, m. h 4 + h 5 is the height from the bottom of the buffer chamber to the connection point of the second connecting pipe, m. Q 1 is the flow rate of fertilizer entering the buffer chamber from the mixing chamber, m³/s.
3.
Throughout the entire irrigation process, the fertilizer in the storage chamber satisfies the input–output balance, i.e., Equation (3):
V f e r t i l i z e r = Q 0 t + W l 2 h 4
where l 2 is the volume of the fertilizer storage chamber, m³, and Q 0 is the flow rate of fertilizer entering the storage chamber from the buffer chamber, m³/s.
4.
Within the irrigation time “t”, the entire device satisfies the fertilizer input–output balance condition. Assuming a mixing ratio cycle of “T”, with the biogas slurry input time t1 and water input time t2, the flow rates Q0 and Q1 at the outlet of the connecting structure satisfy Equation (4), and after simplification, Equation (5) is obtained:
Q 0 t = Q 1 t = Q b i o g a s t 1 + Q w a t e r t 2 V f e r t i l i z e r T Q f e r t i l i z e r
Q 0 = Q 1 = Q b i o g a s t 1 + Q w a t e r t 2 V f e r t i l i z e r T Q f e r t i l i z e r t = Q b i o g a s t 1 T + Q w a t e r t 2 T
5.
From Equations (3) and (4), h 4 can be calculated, and the result is given by Equation (6):
h 4 = Q f e r t i l i z e r T Q b i o g a s t 1 Q w a t e r t 2 V f e r t i l i z e r Q f e r t i l i z e r T W l 2
6.
Using Equations (2) and (5), h 5 can be calculated, and it satisfies Equation (7). Further simplification yields Equation (8):
h 5 = Q 1 t 0 W l 1 h 4
h 5 = Q b i o g a s t 1 + Q w a t e r t 2 t 0 T W l 2 l 1 V f e r t i l i z e r W l 1 l 2 + Q b i o g a s t 1 + Q w a t e r t 2 V f e r t i l i z e r Q f e r t i l i z e r T W l 2
7.
The values of h 2 (distance from the top of the mixing structure to the center of the primary connecting pipe, m) and h 3 (distance from the center of the primary connecting pipe to the center of the secondary connecting pipe, m) need to be determined based on the fertilizer storage volume in the mixing chamber or buffer chamber. When the first or second connecting structure is blocked, the system discharges all the fertilizer in the storage chamber to lower the liquid level of the fertilizer below the height of the shutdown liquid level sensor, causing the equipment to stop automatically. During this time, the minimum remaining volume required for fertilizer accumulation without overflow in the mixing or buffer chamber needs to be calculated. First, calculate the maximum time t m required for the equipment to discharge all the fertilizer between the startup and shutdown liquid level monitoring sensors in the storage chamber. This satisfies Equation (9):
t m = W l 2 h 4 Q f e r t i l i z e r
To ensure that the buffer chamber and storage chamber exactly meet the no-overflow requirement, h 3 should satisfy Equation (10):
Q 0 t m = W l 2 h 3
Combining Equations (4) and (5), the calculation result is given by Equation (11):
h 3 = V b i o g a s Q b i o g a s t 1 + Q w a t e r t 2 T Q b i o g a s t 1 + Q w a t e r t 2 T 2 W l 1
8.
Similarly, h 2 can be calculated to satisfy Equation (12):
Q 1 t m = W l 0 h 2
The calculation result is expressed in Equation (13):
h 2 = V b i o g a s Q b i o g a s t 1 + Q w a t e r t 2 T Q b i o g a s t 1 + Q w a t e r t 2 T 2 W l 0
where l 0 is the length of the mixing chamber, m.

2.3. Design of Control System

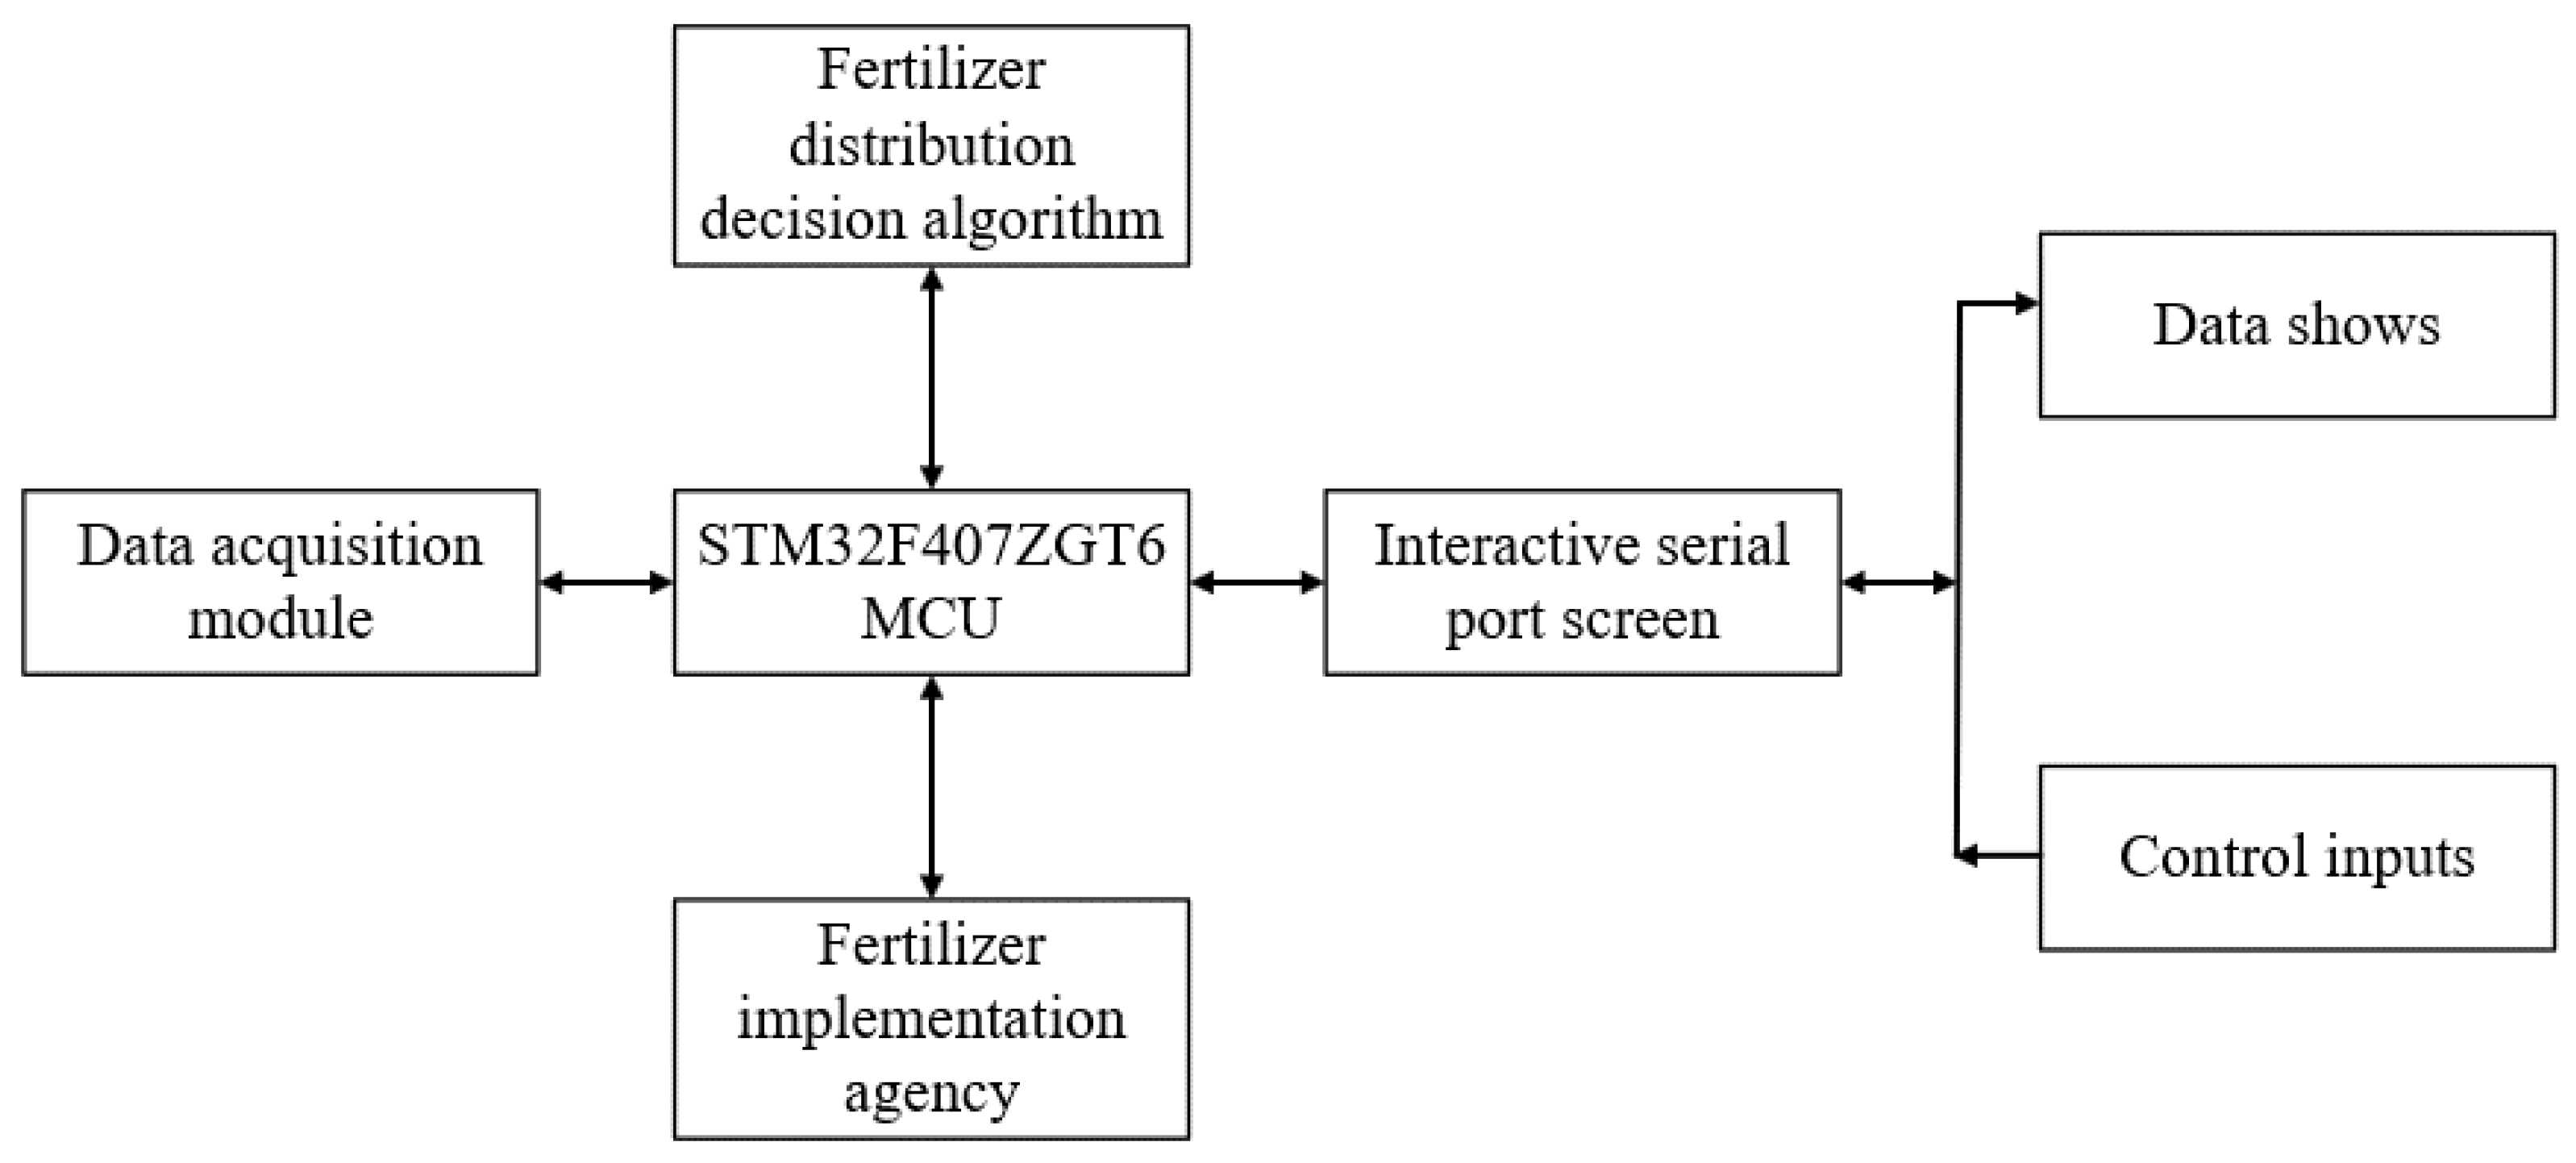
The system control software of the biogas slurry precision mixing device needs to accomplish several functions, including acquiring fundamental data for system ratio decisions, coordinating the operation of executive mechanisms, and facilitating human–machine interaction. Therefore, its top-level architecture is primarily divided into five major modules, as depicted in Figure 5. These modules include the STM32F407ZGT6 microcontroller driver program design, biogas slurry ratio decision algorithm design, data acquisition module program design, ratio execution mechanism program module design, and interactive touchscreen design.
The program execution flow occurs after system and device initialization; the microcontroller retrieves information about the components of the biogas slurry and field conditions through communication modules such as Zigbee and 4G gateway. It also captures control information input by users through the human–machine interface, providing the decision-making basis for the biogas slurry ratio decision algorithm. Once the fundamental data and control information are obtained, the microcontroller initiates the biogas slurry ratio decision algorithm. This algorithm calculates decisions for the components involved in fertilizer blending, including biogas slurry, clean water, supplementary fertilizer, and pH-adjusting agents. The decision results are then converted into control quantities that dictate the runtime of the corresponding pipelines for injecting each component.
During the injection process of the ratio components, the built-in liquid level monitoring sensor system in the biogas slurry precision mixing device is activated. It monitors the liquid level of the fertilizer inside the system. If an anomaly is detected in the liquid level, the microcontroller forcibly shuts down the system’s power. Subsequently, the system activates EC sensors and pH sensors to monitor parameters such as electrical conductivity and acidity/alkalinity of the configured fertilizer. The monitoring information is fed back to the control system’s ratio decision mechanism through a feedback mechanism. This allows for adjustments to the decision-making process regarding the ratio components. Once the fertilizer blending state stabilizes, the microcontroller control system initiates the fertilizer discharge mechanism, draining the blended fertilizer. The biogas slurry precision mixing device calculates the application amount of fertilizer based on the discharge time and outlet flow rate. When the system’s fertilizer injection time matches the irrigation time, the system shuts off the operating power for all structures, concluding the entire ratio process. Further details on the ratio decision algorithm and the feedback control mechanism based on EC monitoring of the fertilizer are provided below.

2.4. Design of Ratio Decision Algorithm Flow

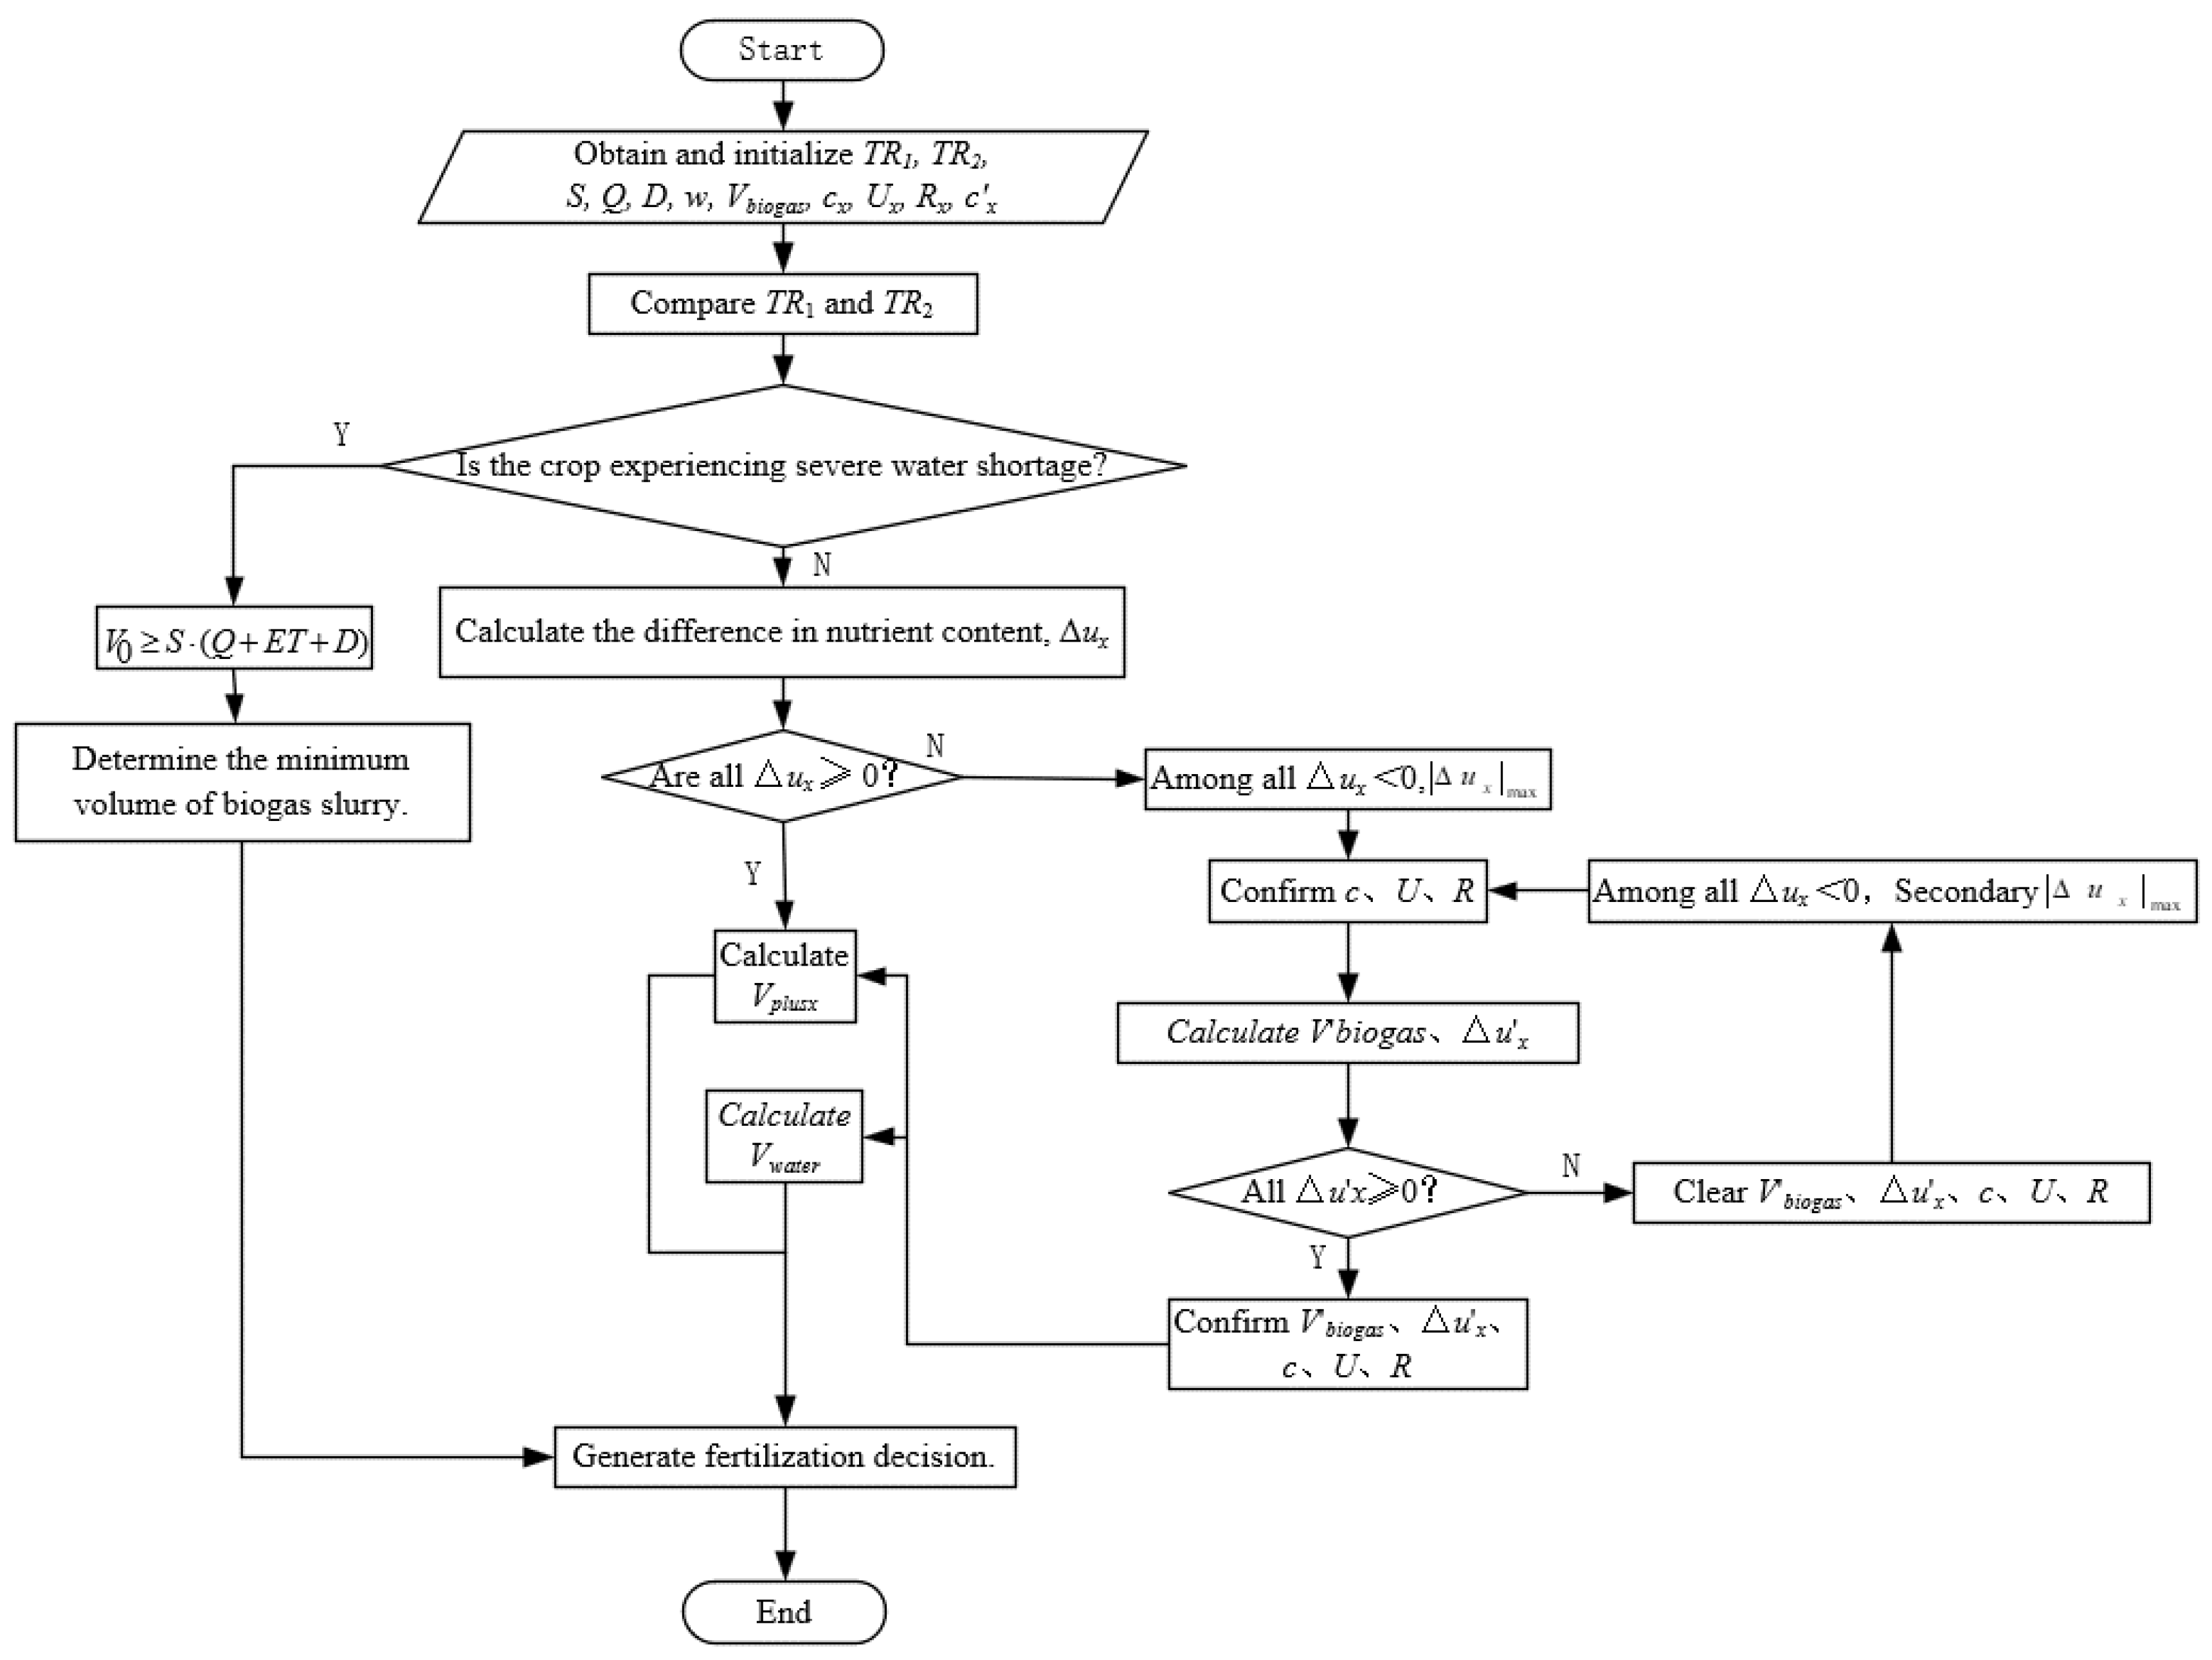
In regions characterized by high precipitation and soil moisture content, prioritizing nutrient requirements for irrigated crops can be advantageous. This approach does not solely rely on supplementing fertilizer when the nutrient content in the biogas slurry is below the required level. Instead, it prioritizes meeting the nutritional needs of crops, especially in areas with features such as high precipitation and soil moisture content. By using excess nutrient levels as a priority, the optimization algorithm systematically selects biogas slurry volumes. This approach takes into consideration the actual absorption and conversion of nutrients, aiming for precise and adequate nutrient levels. As a result, the biogas slurry is involved in proportioning the most, requiring minimal additional fertilization. This optimization achieves accurate decisions on the proportions of crucial components, such as clear water, biogas slurry, and standard N, P, K fertilizers, in the nutrient proportioning process.
The detailed execution process of the algorithm is as follows: Obtain the volume of biogas slurry, V b i o g a s , L; the concentration of each nutrient in the biogas slurry, c x , g/L; the nutrient requirements of the crop, U x , g; the actual absorption conversion rate of each nutrient by the crop, R x , %; and x represents the x-th nutrient among all nutrients, such as nitrogen, phosphorus, potassium, etc. To compare the nutrient content in the biogas slurry with the actual nutrient requirements of the crop, calculate the difference Δ u x in nutrient content in Equation (14):
Δ u x = U x c x V b i o g a s R x
a.
If the concentration of all nutrients is within the acceptable range, then no dilution of the biogas slurry is needed. Only additional supplementary fertilizer is required. Therefore, the fertilization volume is taken as V b i o g a s , L, and the concentration of each nutrient in the supplementary fertilizer is obtained, c x , g/L. According to V p l u s x = Δ u x c x , nutrient difference is calculated, and corresponding fertilizers V p l u s x are added to meet all nutrient requirements. If all Δ u x are positive or zero, it indicates that the biogas slurry does not need proportioning. In this case, corresponding fertilizers are added to meet all nutrient requirements when all nutrient concentrations in the biogas slurry are less than or equal to the actual nutrient requirements of the crop.
b.
If any nutrient Δ u x < 0, the reference volume m of the biogas slurry is calculated by V b i o g a s = U c R , according to the nutrient concentration C in all Δ u x , the nutrient requirement U of the crop nutrient, and the actual absorption and conversion rate of the crop nutrient R . Calculate the nutrient content difference Δ u x according to Δ u x = U x c x V b i o g a s R x . If the concentration of any nutrient is still outside the acceptable range, update the secondary parameters and repeat the calculation. Otherwise, determine V b i o g a s , c , U , R , Δ u x .
Obtain the concentration of each nutrient in the supplementary fertilizer, c x , g/L. According to Equation (15):
V p l u s x = Δ u x c x V 0 V w a t e r = U V 0 c R U V 0 = V b i o g a s + V p l u s x
Determine the volume of each nutrient V p l u s x and the volume of supplementary water V w a t e r . The prioritization is based on the excess concentration of each nutrient in the biogas slurry compared to the actual nutrient requirements of the crop. Filter the biogas slurry volume step by step until the concentration of all nutrients in the biogas slurry is less than or equal to the actual nutrient requirements of the crop. Fertilize to meet all nutrient requirements using the supplementary nutrient volumes and water volumes. The flowchart of the algorithm’s execution process is shown in Figure 6. The biogas slurry proportioning decision optimization algorithm can enhance the involvement of biogas slurry and accurately meet the actual nutrient requirements of crops, thereby achieving precise proportions of clear water, biogas slurry, and nutrients to meet the irrigation needs of farmland.

2.5. Design of Feedback Regulation Mechanism

Fertilizer concentration monitoring is a key factor in achieving the precision and stability of the biogas slurry precise mixing device. Research indicates a significant correlation between fertilizer solution electrical conductivity (EC) and fertilizer concentration [20,21,22]. As shown in Figure 7, this device incorporates a schematic diagram of a stability feedback regulation mechanism based on EC monitoring. The device utilizes the electrode method to detect and output the electrical conductivity of the fertilizer. The built-in EC transmitter of the electrode calculates the total salt concentration of the fertilizer based on the conversion relationship between electrical conductivity and total salt concentration. The calculated result is then fed back to the core control unit of the device. The controller uses this information to assess the fertilizer state and adjusts the unit mixing cycle T accordingly, ensuring the stability of the fertilizer concentration. The relationship between the concentrations of nitrogen (N), phosphorus (P), and potassium (K), and the conductivity (EC) of the solution can be summarized by formula. The basic relationship can be expressed as: EC = k·∑ci·λi.EC is the electrical conductivity of the solution. k is a constant that depends on the temperature of the solution and other system characteristics. ci is the concentration of the i-th ion. λi is the molar conductivity of the i-th ion, i.e., the ability of the ion to contribute to the conductivity. There is a correlation formula between the conductivity of the solution and the amount of nitrogen, phosphorus, and potassium elements in the solution. EC = k·(cNO₃·λNO₃ + cNH₄·λNH₄ + cH₂PO₄·λH₂PO₄ + cHPO₄·λHPO₄ + cK·λK). The conversion relationship between fertilizer solution electrical conductivity and total salt concentration is expressed by Equation (16):
c = 0.0043 x 3 0.0211 x 2 + 0.4711 x 0.3271

3. Results and Discussion

3.1. Comparative Tests of Filtration Performance of Biogas Slurry Impurities

The functional structures of the biogas slurry precision proportioning device are integrated and designed, and the parameter design of the whole machine during the operation of the device is shown in Table 2. In the design of the biogas slurry injection structure, a filtration mechanism was added to reduce insoluble solid substances and adsorb volatile odorous gases in the biogas slurry. Simultaneously, the filtered biogas slurry needed to retain soluble fertilizer components to the maximum extent. Therefore, the design of the filtration structure primarily considered its permeability to biogas slurry, the trapping effect on insoluble solid substances, and the adsorption of gases.
The biogas slurry used in the experiment was obtained from a livestock farm, which followed the national standards for biogas slurry [23]. The slurry underwent thorough anaerobic fermentation and harmless stabilization treatment, resulting in a concentrated biogas slurry with a total nutrient content (N + P2O5 + K2O) ≥ 8 g/L, organic matter content ≥ 18 g/L, and water-insoluble material ≤ 50 g/L. In this study, a secondary filtration structure was used to filter the injected biogas slurry. Different secondary filtration schemes were compared through experimental means. The impact of the filtration structure on the filtration performance of biogas slurry was analyzed by comparing parameters such as the time for 10 mL of biogas slurry to pass through the filtration structure (in seconds), the retention of solid substances by the filtration structure (in ppm), and the retention rate of soluble salts in the filtered liquid (%). The experimental data are recorded in Table 3, which indicate that the combination of quartz + granite, quartz + activated carbon, and granite + activated carbon in the filtration structure exhibited strong permeability to biogas slurry (filtration time for 10 mL liquid ≤ 35 s) and a high retention rate of soluble salts (soluble salt retention rate ≥ 70%). Therefore, these three schemes met the requirements of biogas slurry for filtration structures in terms of permeability and the retention of soluble salts.
However, the biogas slurry filtration structure also needed to adsorb volatile gases. Activated carbon, due to its specially treated surface with numerous tiny pores, has strong adsorption properties for substances like smoke [24,25]. Considering the current market-related technological designs, this study ultimately adopted a quartz + activated carbon secondary filtration structure for biogas slurry filtration.

3.2. Lab Tests of the Power Consumption of the System Operation

The energy consumption evaluation of the biogas slurry precision proportioning device was conducted for both continuous and intermittent operation modes. In the continuous operation mode, the device prototype ran continuously for a specified time (8 h/day), and the total power consumption was measured. In the intermittent operation mode, the total running time of the device was the same as in the continuous mode (8 h/day). The difference lay in the fact that the equipment was shut down and rested for 0.5 h after every 1 h of operation before starting the next run, until the total running time reached 8 h.
The power consumption measurement data of the biogas slurry precision proportioning device at different times and under different operation modes are recorded in Table 4. The study indicates that, whether in continuous or intermittent operation modes, the daily power consumption of the device running continuously for 6 days remained stable. The average daily power consumption was around 10.9 kW for the continuous operation mode and around 11.5 kW for the intermittent operation mode. It is observed that the measured power consumption in the continuous operation mode has a negligible difference from the theoretically designed daily power consumption of 10.8 kW. However, in the intermittent operation mode, the measured power consumption significantly exceeds the theoretically designed power consumption. This discrepancy is attributed to the fact that the theoretical design power consumption is based on the rated power consumption of the device’s executive components. In practical operation, the startup power consumption of these components is higher (approximately 6–8 times) than the rated power consumption. Therefore, in the intermittent operation mode, frequent starts of the device result in measured power consumption greater than the theoretically designed power consumption.

3.3. Field Test of the Accuracy of the Device System Proportioning

Taking the fertilization requirements for spring corn planting under the integrated farming model in Huai’an, Jiangsu, China, as an example, this device was used to proportion different concentrations of biogas slurry. The components and contents of the fertilizer were determined using standard elemental detection methods. Subsequently, an error analysis was conducted using the method of error analysis to analyze the consistency between the measured values and theoretical values.
In the experiment, the required amounts of N, P, and K were set at 11.48 kg, 5.72 kg, and 4.10 kg, respectively. For the configuration of standard fertilizer components, 20% urea (CH4N2O) liquid fertilizer was used for standard nitrogen fertilizer, liquid fertilizer with 15% effective phosphorus (P2O5) content for standard phosphorus fertilizer, and liquid fertilizer with 10% effective potassium (K2O) content for standard potassium fertilizer. The stability of biogas slurry proportioning was primarily measured by the stability of the component concentrations in the fertilized liquid output from the dispensing end. The experiment indirectly assessed the stability of the device’s biogas slurry proportioning by measuring the values of the fertilized liquid at the output end. To validate the accuracy of the device’s proportioning, the experimental characteristics of the biogas slurry needed to cover the differences in slurry composition. The performance of the device was tested through the following experimental groups.
  • When the nutrient content in the biogas slurry was relatively low, denoted as Group 1, with TN content of 4.89 g/L, TP content of 2.63 g/L, and TK content of 1.32 g/L.
  • When some nutrient contents in the biogas slurry were relatively high, denoted as Group 2, with TN content of 9.89 g/L, TP content of 6.63 g/L, and TK content of 7.32 g/L.
The proportions of biogas slurry components were determined using a spectrophotometer provided by Enfan Instrument (Hefei, China) for the detection of nitrogen, phosphorus, and potassium components. Different colorimetric reagents were used to colorize the N, P, and K components of the proportioned biogas slurry. After digestion and cooling to room temperature in a digestion instrument, the components of the proportioned biogas slurry were detected using a spectrophotometer. For electrical conductivity detection, a Jubway portable conductivity sensor was selected as the measuring instrument. For biogas slurry Group 1, where the slurry did not require dilution, the device displayed a total salt concentration output of 45.175 g/L. In this case, as the nutrient content in the slurry was relatively low, it did not reach the target concentration for nutrient application. Therefore, no dilution of the slurry was needed, with a water quantity of 0.000 m3/acre and a slurry usage of 4.000 m3/acre. For biogas slurry Group 2, which required some dilution, the total salt concentration output was 43.812 g/L. The device indicated a water quantity of 0.843 m3/acre and a slurry usage of 3.650 m3/acre. Additionally, the biogas slurry in both Group 1 and Group 2 exhibited relative stability during the fertilization process. Table 5 presents the recorded data of the biogas slurry composition parameters after proportioning for a one-acre fertilization area, comparing the empirical decision values with the actual measured values. The comparison indicates that compared to the calculated theoretical optimum, the proportioning errors for each component concentration were controlled within 10%, and the conductivity fluctuation range was controlled within 5%. This demonstrates the high overall accuracy and stability of the biogas slurry precise mixing device.

4. Conclusions

With the aim of improving the precision and safety of biogas slurry utilization in farmland, a decision-making mechanism for determining the proportions of biogas slurry components was constructed based on the differences in nutrient composition from various sources and the actual irrigation requirements. A biogas slurry precision proportioning device and its control system were designed based on this decision-making mechanism. The following conclusions were drawn:
Filtering structures, such as quartz + granite, quartz + activated carbon, and granite + activated carbon, exhibited strong permeability for biogas slurry and retained a high degree of soluble salts. Considering the need for adsorption of volatile gases, the final design adopted a dual-stage filter structure of quartz + activated carbon for biogas slurry filtration. It effectively reduces some insoluble solid substances in the biogas slurry, adsorbs the volatile odor gas in the biogas slurry, and retains the soluble fertilizer components to the greatest extent after filtration. Prototype test results showed that the power consumption of the precision proportioning device in continuous operation mode closely aligned with the theoretically designed power consumption. However, in the intermittent operation mode, the frequent starting and stopping of device components (e.g., pumps) led to a significant deviation between measured and theoretical power consumption. Using the precision proportioning device, tests were conducted with different concentrations of biogas slurry for spring corn fertilization in a combined farming system in Jiangsu. The results demonstrated that compared to the calculated theoretical optimum, the device achieved precision in proportioning, with concentration errors within 10% for each component of the biogas slurry and conductivity fluctuations controlled within 5%. This indicates high precision and stability in the overall proportioning accuracy of the biogas slurry precision proportioning device.
Overall, the agricultural biogas slurry precision proportioning device provides an innovative solution for intelligent biogas slurry application in farmland. It effectively enhances the accuracy of biogas slurry application, reduces fertilizer usage, and mitigates environmental risks associated with excessive biogas slurry application, contributing to increased crop yield.

Author Contributions

Conceptualization, Y.J.; methodology, Y.J.; software, Y.Z.; validation, Y.Z.; formal analysis, H.L. (Hao Li); investigation, H.L. (Hong Li); resources, H.L. (Hong Li); data curation, H.L. (Hao Li) and H.Y.; writing—original draft, Y.Z.; visualization, S.X.; supervision, S.X. All authors have read and agreed to the published version of the manuscript.

Funding

This work was supported by Jiangsu Province and the Education Ministry Co-Sponsored Synergistic Innovation Center of Modern Agricultural Equipment (XTCX2018), the National Key Research and Development Program of China (2023YFD1900804-01), the Key Research and Development Program of Jiangsu Province (No. BE2021340) and the Zhenjiang Key Research and Development Program (No. CN2022003).

Data Availability Statement

Data are contained within the article.

Conflicts of Interest

The authors declare that they have no known competing financial interests or personal relationships that could have appeared to influence the work reported in this paper.

References

  1. Prado, J.; Ribeiro, H.; Alvarenga, P.; Fangueiro, D. A step towards the production of manure-based fertilizers: Disclosing the effects of animal species and slurry treatment on their nutrients content and availability. J. Clean. Prod. 2022, 337, 130369. [Google Scholar] [CrossRef]
  2. Hu, J.; He, J.C.; Wang, Y.; Wu, Y.P.; Chen, C.; Ren, Z.Y.; Li, X.X.; Shi, S.J.; Du, Y.P.; He, P.X. Design and study on lightweight organic fertilizer distributor. Comput. Electron. Agric. 2020, 169, 105149. [Google Scholar] [CrossRef]
  3. Nhu, N.; Thi, H.N.; Lee, C.; Nuntavun, R. The Effects Bio-Fertilizer and Liquid Organic Fertilizer on the Growth of Vegetables in the Pot Experiment. Chiang Mai J. Sci. 2018, 45, 1257–1273. [Google Scholar]
  4. Xu, D.; Lu, Y.N.; Gong, S.H. Waterlogging and saline-alkali management for sustainable irrigated agriculture development. J. Mech. Eng. Drain. Irrig. 2019, 37, 63–72. [Google Scholar]
  5. Möller, K.; Müller, T. Effects of anaerobic digestion on digestate nutrient availability and crop growth: A review. Eng. Life Sci. 2012, 12, 242–257. [Google Scholar] [CrossRef]
  6. Ni, Z.Y.; Zhang, M.K. Chemical morphological composition and bioavailability evaluation of nitrogen, phosphorus and potassium in biogas slurry. Chin. J. Soil Sci. 2017, 48, 1114–1118. [Google Scholar]
  7. Sun, R.B.; Ding, J.K.; Li, H.Y.; Wang, X.G.; Li, W.Y.; Li, K.X.; Ye, X.X.; Sun, S.Y. Mitigating nitrate leaching in cropland by enhancing microbial nitrate transformation through the addition of liquid biogas slurry. Agric. Ecosyst. Environ. 2023, 345, 108324. [Google Scholar] [CrossRef]
  8. De, N.; Stefaan, S.; Steven, H.G. Carbon mineralization from composts and food industry wastes added to soil. Nutr. Cycl. Agroecosyst. 2023, 67, 13–20. [Google Scholar]
  9. Tang, Y.F.; Wen, G.L.; Li, P.P.; Dai, C.; Han, J.G. Effects of Biogas Slurry Application on Crop Production and Soil Properties in a Rice–Wheat Rotation on Coastal Reclaimed Farmland. Water Air Soil Pollut. 2019, 230, 51. [Google Scholar] [CrossRef]
  10. Li, H.; Tang, P.; Chen, C. Research status and development trend of integrated fertilization equipment for water and fertilizer in China. J. Mech. Eng. Drain. Irrig. 2021, 39, 200–209. [Google Scholar]
  11. Hu, X.Y.; Chen, X. Uniform fertilization method based on differential pressure tank with optimal fertilizer concentration and constant fertigation flux. Irrig. Sci. 2021, 39, 347–362. [Google Scholar] [CrossRef]
  12. Wu, Y.; Li, L.; Li, S.S.; Wang, H.K.; Zhang, M.; Sun, H.; Nikolaos, S.; Li, M.Z. Optimal control algorithm of fertigation system in greenhouse based on EC model. Int. J. Agric. Biol. Eng. 2019, 12, 118–125. [Google Scholar] [CrossRef]
  13. Wang, W.J.; Xu, R.; Wang, W.E. Study on the fertilization uniformity of water-fertilizer integrated micro-sprinkler belt. J. Water Resour. Water Eng. 2020, 31, 124–130. [Google Scholar]
  14. Liu, C.Y.; Wang, R.; Wang, W.E.; Hu, X.T.; Cheng, Y.L.; Liu, F.L. Effect of fertilizer solution concentrations on filter clogging in drip fertigation systems. Agric. Water Manag. 2021, 250, 106829. [Google Scholar] [CrossRef]
  15. Miah, M.D.; Sumon, R.M.D.; Mashiur, H.; Muhammad, A.; Hossain, M.D.A. Design and Performance Evaluation of NPK Briquette Applicator for Small-Scale Upland Crops. J. Biosyst. Eng. 2022, 47, 270–285. [Google Scholar] [CrossRef]
  16. Chen, C.X.; He, P.X.; Zhang, J.J.; Li, X.X.; Ren, Z.Y.; Zhao, J.; He, J.C. A fixed-amount and variable-rate fertilizer applicator based on pulse width modulation. Comput. Electron. Agric. 2018, 148, 330–336. [Google Scholar] [CrossRef]
  17. Mirzakhaninafchi, H.; Manjeet, S.; Vishal, B. Design and Development of a Variable Rate Applicator for Real-Time Application of Fertilizer. Sustainability 2021, 13, 8694. [Google Scholar] [CrossRef]
  18. Zhang, M.Q.; Hu, Y.Y.; Emako, M. The Cyclic Utilization of Biogas Slurry in Incomplete Information Society. In Proceedings of the International Joint Conference on Information, Media and Engineering (ICIME), Osaka, Japan, 12–14 December 2018; pp. 197–200. [Google Scholar]
  19. Zhu, Y.Y.; Huang, G.S.; Jiang, Y.J. Ways and suggestions for the resource utilization of livestock and poultry manure returning to the field. Zhejiang Agric. Sci. 2023, 64, 2083–2088. [Google Scholar]
  20. Han, H.Z.; Zhang, L.H.; Zhang, Y. Relationship between Nutrient Solution Salt Concentration and Conductivity in Soilless Cultivation in Northern Jiangsu. Tianjin Agric. Sci. 2016, 22, 28–32. [Google Scholar]
  21. Halder, J.; Kang, T.K.; Yabe, M.; Lee, M.G. Development of a quality certification and maturity classification method for liquid fertilizer by measuring the electrical conductivity (EC) of swine manure. J. Fac. Agric. Kyushu Univ. 2017, 62, 205–212. [Google Scholar] [CrossRef]
  22. Sunaryo, Y.; Purnomo, D.; Darini, M.; Cahyani, V. Nutrients content and quality of liquid fertilizer made from goat manure. J. Phys. 2018, 1022, 012053. [Google Scholar] [CrossRef]
  23. GB/T 40750-2021; National Technical Committee for Biogas Standardization (SAC/TC 515). Standardization Administration of China: Beijing, China, 2021.
  24. Wang, Y. Selection and Combination Study of Nitrogen and Phosphorus Adsorption Substrate in Biogas Slurry. Master’s Thesis, Southwest University, Chongqing, China, 2013. [Google Scholar]
  25. Bhatnagar, A.; Hogland, W.; Marques, M.; Sillanpää, M. An overview of the modification methods of activated carbon for its water treatment applications. Chem. Eng. J. 2013, 219, 499–511. [Google Scholar] [CrossRef]
Figure 1. Common biogas slurry irrigation methods.
Agronomy 14 01439 g001
Figure 2. Schematic diagram of the structural design of the biogas slurry proportioning device.
Agronomy 14 01439 g002
Figure 3. Physical diagram of the device system.
Agronomy 14 01439 g003
Figure 4. Design of structure for mixed dissolution-based fertilizer production.
Agronomy 14 01439 g004
Figure 5. Overall framework of control software for biogas slurry fertilizer dispensing device.
Agronomy 14 01439 g005
Figure 6. Flow chart of the decision algorithm for the proportion of fertilizer–liquid configuration components.
Agronomy 14 01439 g006
Figure 7. Schematic diagram of the feedback regulation mechanism of biogas slurry fertilizer distribution based on EC monitoring.
Agronomy 14 01439 g007
Table 1. The meaning of each symbol in Figure 2.
LabelMeaning
wMixing chamber width
l0Mixing chamber length
l1Buffering chamber length
l2Fertilizer storage chamber length
QbiogasFlow rate of biogas slurry into the proportioning chamber
QwaterFlow rate of clean water into the proportioning chamber
v0Mixing chamber volume
v1Buffering chamber volume
v2Fertilizer storage chamber volume
h1Mixing and dissolution structure height
h2Distance from the top of the mixing and dissolution structure to the center of the primary connecting pipe
h3Distance from the center of the primary connecting pipe to the center of the secondary connecting pipe
h4Distance consistent in numerical value with the level detection sensor in the storage chamber for starting and stopping liquid discharge
h5Distance consistent in numerical value with the level detection sensor in the storage chamber to the bottom of the storage chamber
Q0Flow rate of slurry from the buffering chamber to the storage chamber
Q1Flow rate of slurry from the proportioning chamber to the buffering chamber
QfertilizerFlow rate at the discharge port of the mixing and dissolution structure
1Mixing chamber
2Slow-release fertilizer chamber
3Fertilizer storage chamber
4Clean water inlet pipe
5Biogas slurry inlet pipe
6Fertilizer outlet pipe
7Primary connecting pipe
8Mixing chamber drain pipe
9Mixing chamber drain pipe
10Slow-release fertilizer chamber drain pipe
11Fertilizer storage chamber drain pipe
12Main drain pipe
13Drain value
14Mixing monitoring sensor
15Fertilizer injection start lever sensor
16Fertilizer injection stop level sensor
17Pneumatic stirrer
Table 2. Parameter design of the whole device.
ParameterSupply VoltageRated Power (kW)Clean Water Inlet Flow (m3/h)Biogas Slurry Inlet Flow (m3/h)Fertilizer Outlet Flow (m3/h)Rated Ratio Quantity (m3/h)Fertilizer Outlet Pressure (MPa)
Value2201.371.501.503.203.000.27
Table 3. Analysis of filtrate permeability performance of different filter media.
Filtration Media CombinationCharacteristics Analysis
10 mL Liquid Filtration Time (s)TDS (ppm)Soluble Salt Retention Rate
Quartz + Granite15.51806982.58
Quartz + Activated Carbon28.34752877.05
Quartz + Ceramic Sand54.82698971.54
Granite + Activated Carbon32.84835685.52
Granite + Ceramic Sand55.81687670.38
Ceramic Sand + Activated Carbon65.46611462.58
Table 4. Power consumption measurement of biogas slurry proportioning device in different working modes.
Working ModeMeasurement TimeAverage Power Consumption
D1D2D3D4D5D6
Continuous Mode (kW/day)10.9011.2010.5010.8010.5011.4010.90
Intermittent Mode (kW/day)11.3011.6011.3011.7011.4011.7011.50
Table 5. Data records of biogas slurry composition parameters after proportioning.
Parameter TypeParameter Record Analysis
Empirical ValueActual Measurement 1Error 1Actual Measurement 2Error 2
cN (g/L)8.218.371.95%7.913.65%
cP (g/L)4.634.824.12%4.721.94%
cK (g/L)3.413.677.6%3.554.11%
call (g/L)42.5345.176.21%3.813.01%
Ec (mS/cm)-15.627 ± 0.423-16.143 ± 0.147-
Disclaimer/Publisher’s Note: The statements, opinions and data contained in all publications are solely those of the individual author(s) and contributor(s) and not of MDPI and/or the editor(s). MDPI and/or the editor(s) disclaim responsibility for any injury to people or property resulting from any ideas, methods, instructions or products referred to in the content.