
The Identification of the Peanut Wild Relative Arachis stenosperma as a Source of Resistance to Stem Rot and Analyses of Genomic Regions Conferring Disease Resistance through QTL Mapping
 , , ,
, , ,
Abstract
:1. Introduction
2. Materials and Methods
2.1. Screening of Induced Allotetraploids for Peanut Stem Rot Resistance
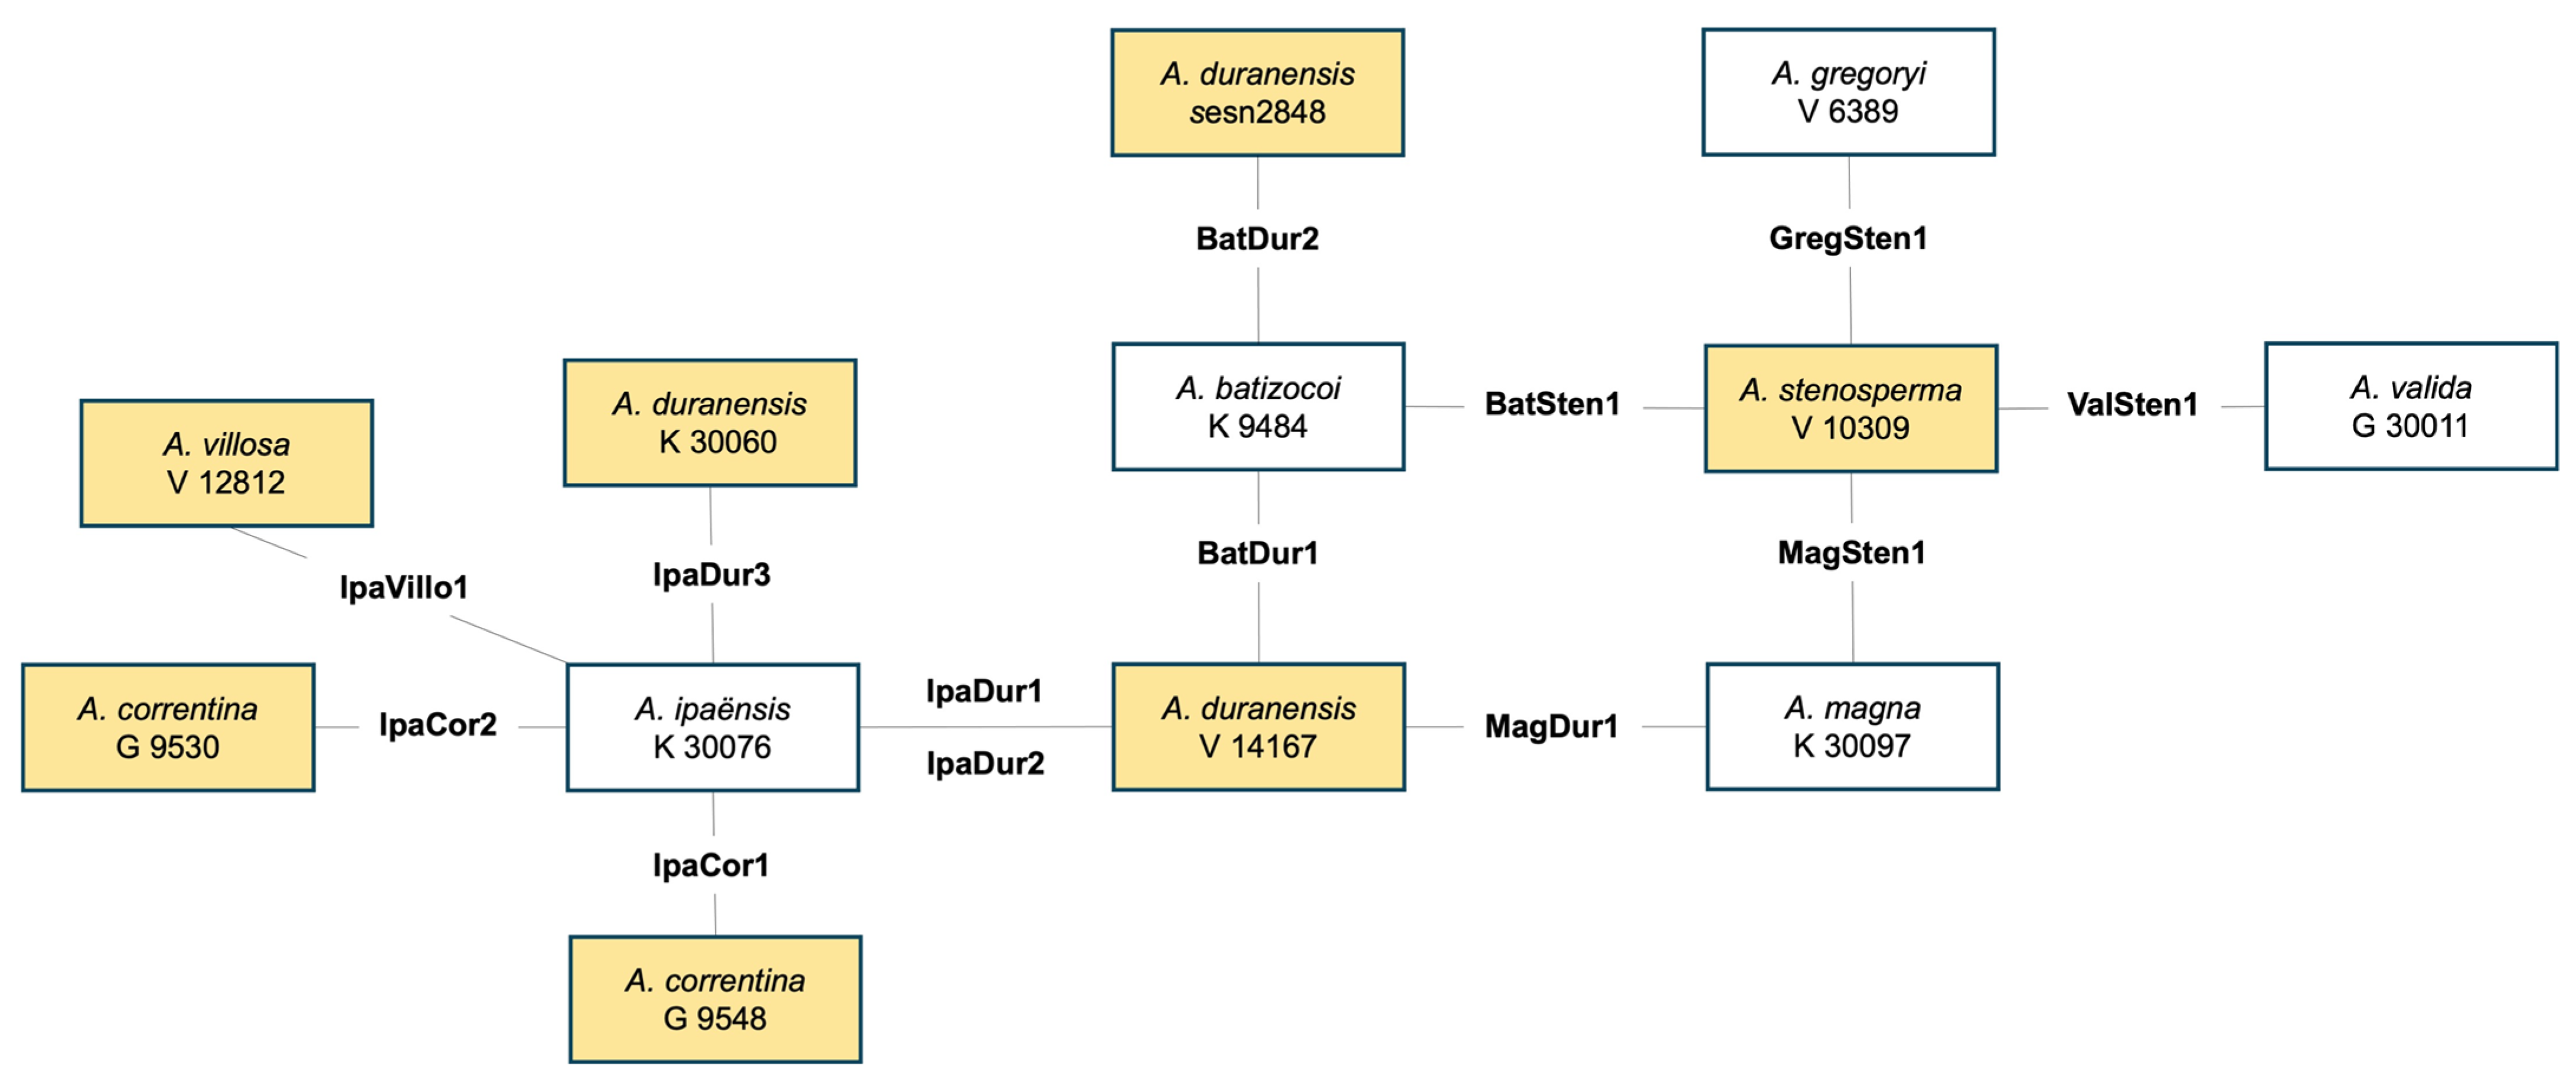
2.1.1. Genotypes Tested in Greenhouse Assay and Field Evaluations
2.1.2. Greenhouse Assay
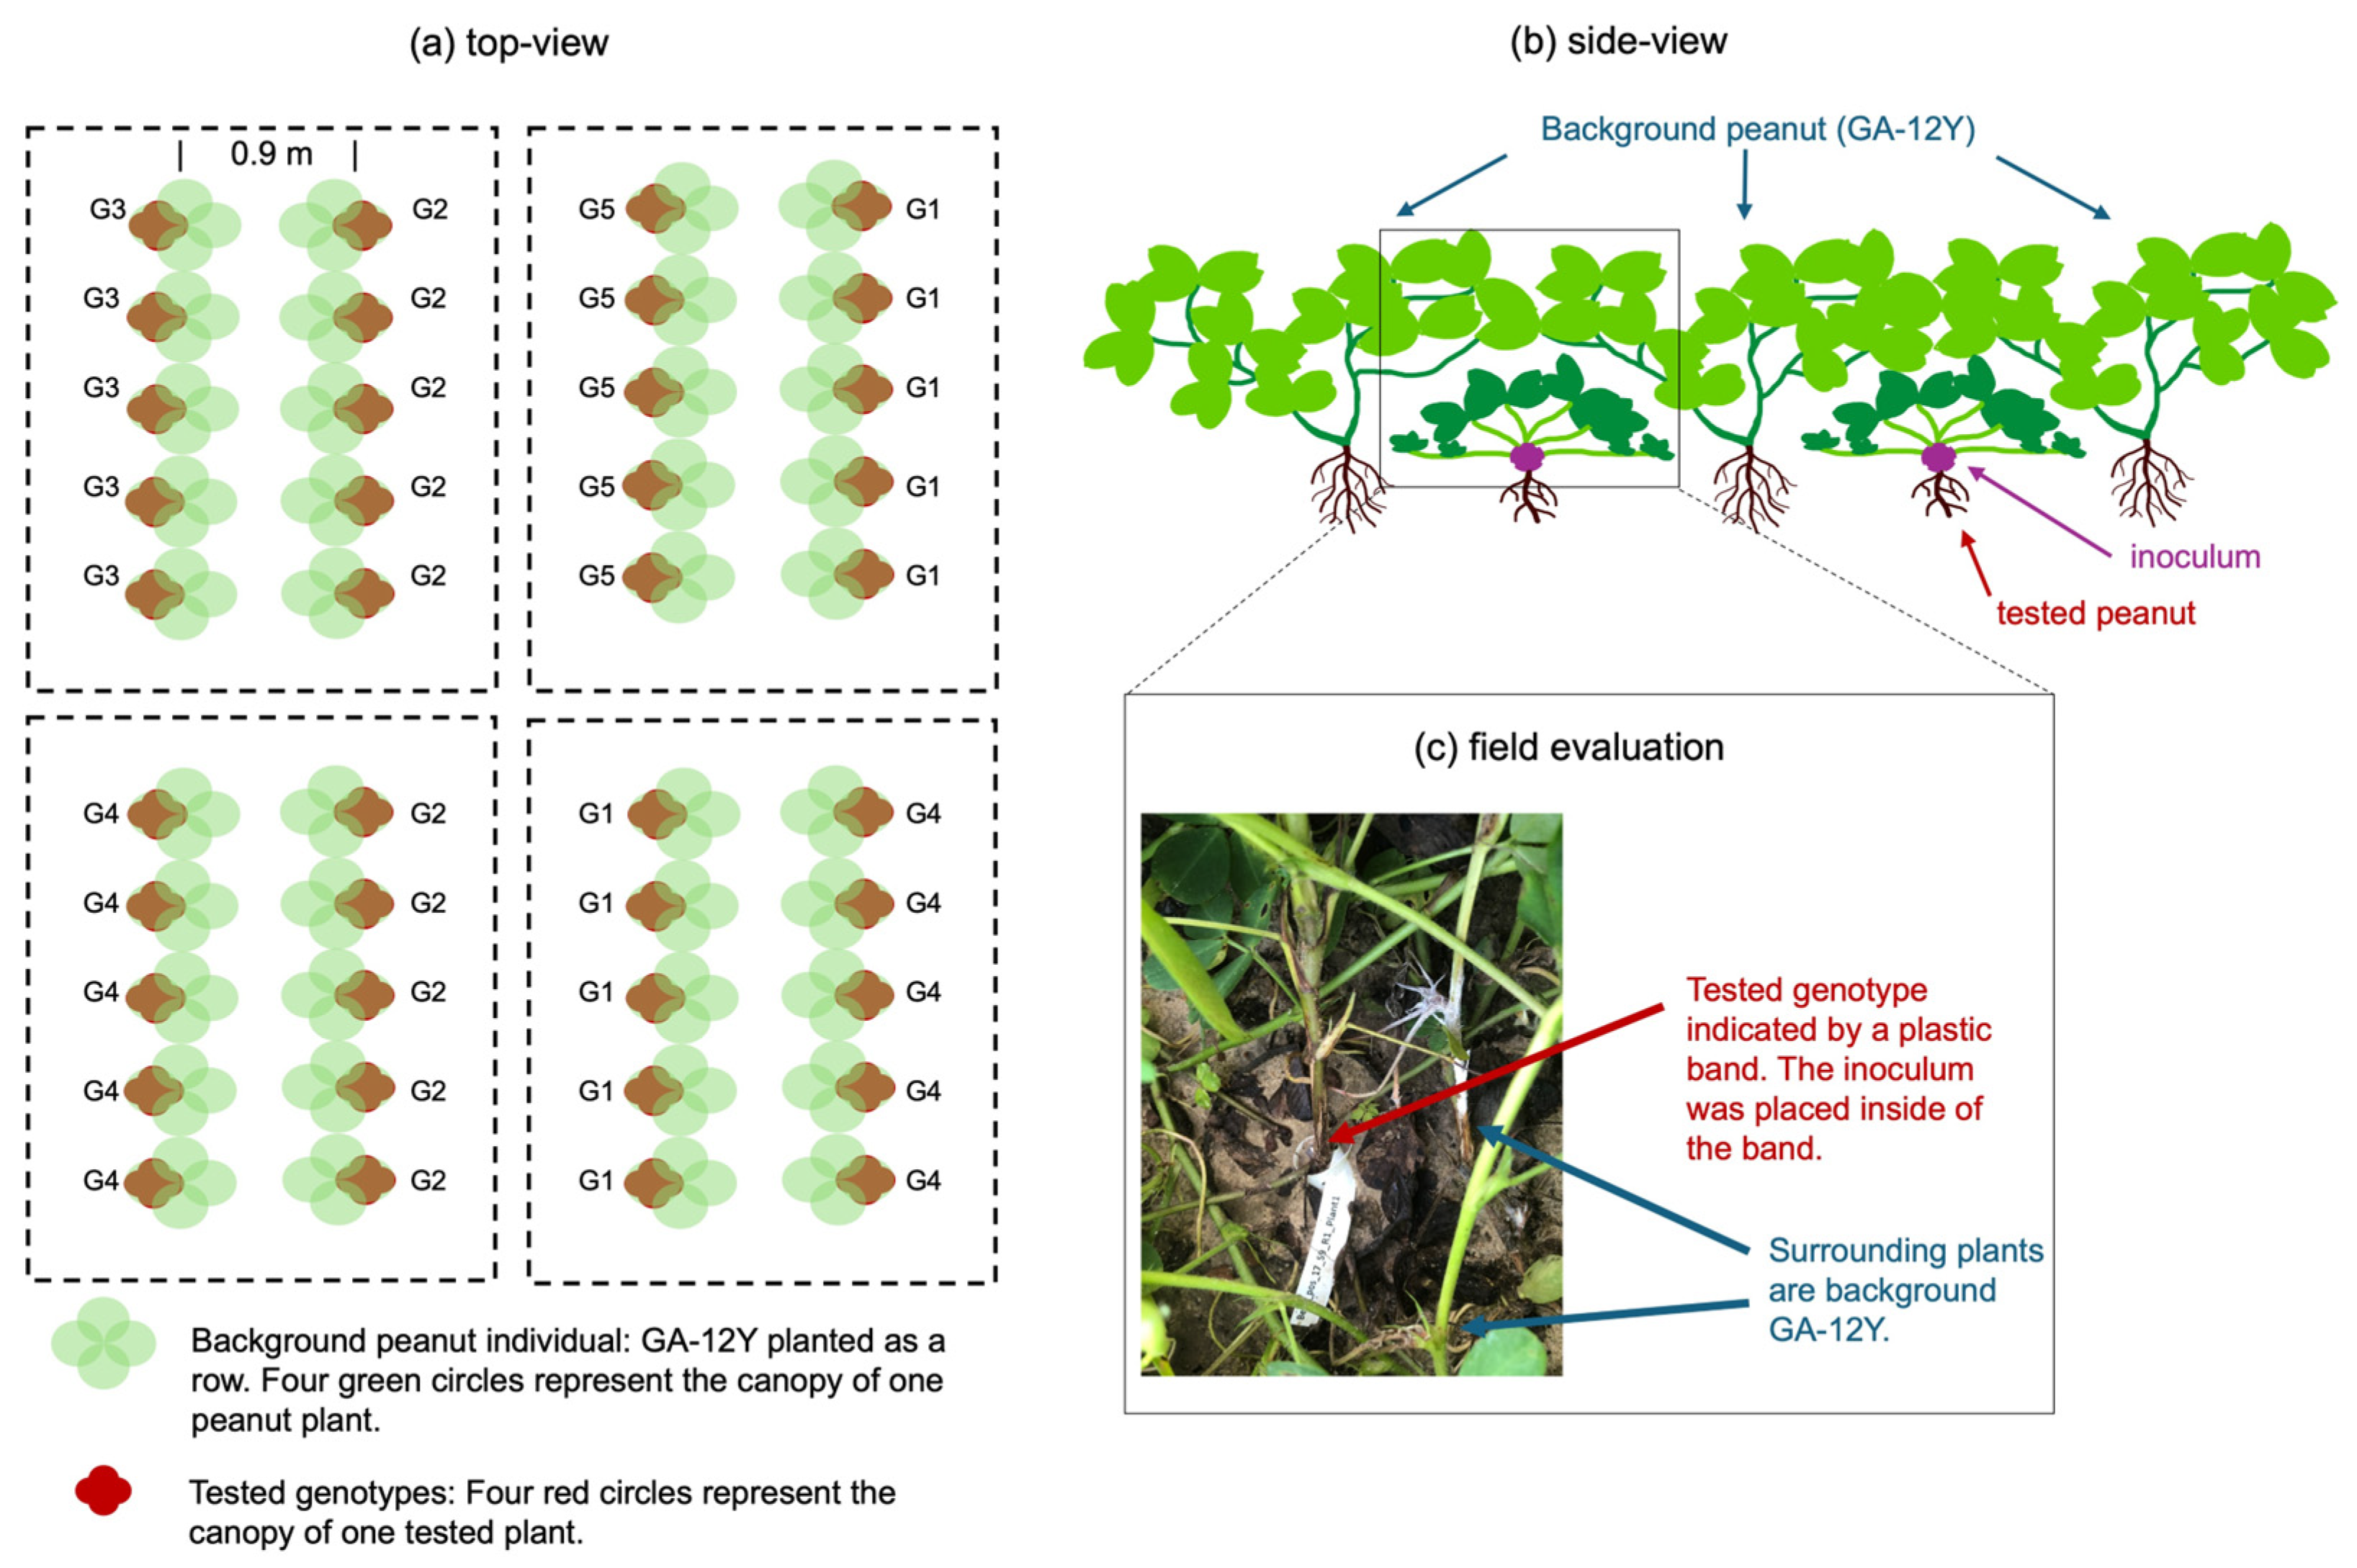
2.1.3. Field Evaluation
2.1.4. Statistical Analysis
2.2. QTLs Mapping of Stem Rot Resistance
2.2.1. Population Development
2.2.2. Plant Germination and Leaf Tissue Collection
2.2.3. Stem Rot Resistance Evaluation
2.2.4. SNP Genotyping, Analysis, and Data Filtering
2.2.5. Genetic Mapping and QTL Discovery
3. Results
3.1. Identification of Peanut Stem Rot Resistance in Induced Allotetraploids
3.1.1. Greenhouse Assay
3.1.2. Field Evaluation
3.2. Mapping QTLs Associated with Allotetraploid ValSten1 Conferring Stem Rot Resistance
3.2.1. Stem Rot Resistance Evaluation of F2s, Parents, and Controls
3.2.2. Genetic Mapping and the Genotyping Result of F2s
3.2.3. QTL Discovery
4. Discussion
5. Conclusions
Supplementary Materials
Author Contributions
Funding
Data Availability Statement
Acknowledgments
Conflicts of Interest
References
- Xu, Z.; Harrington, T.C.; Gleason, M.L.; Batzer, J.C. Phylogenetic placement of plant pathogenic Sclerotium species among teleomorph genera. Mycologia 2010, 102, 337–346. [Google Scholar] [CrossRef]
- Kemerait, R. Peanut. In 2017 Georgia Plant Disease Loss Estimates; Little, E., Ed.; 102-10: University of Georgia Extension Annual Publication; University of Georgia: Athens, GA, USA, 2017; p. 13. [Google Scholar]
- Kemerait, R. Peanut. In 2018 Georgia Plant Disease Loss Estimates; Little, E., Ed.; 102-11: University of Georgia Extension Annual Publication; University of Georgia: Athens, GA, USA, 2018; p. 13. [Google Scholar]
- Kemerait, R. Peanut. In 2019 Georgia Plant Disease Loss Estimates; Little, E., Ed.; 102-12: University of Georgia Extension Annual Publication; University of Georgia: Athens, GA, USA, 2019; p. 13. [Google Scholar]
- Kemerait, R. Peanut. In 2020 Georgia Plant Disease Loss Estimates; Little, E., Ed.; 102-13: University of Georgia Extension Annual Publication; University of Georgia: Athens, GA, USA, 2020; p. 13. [Google Scholar]
- Kemerait, R. Peanut. In 2021 Georgia Plant Disease Loss Estimates; Little, E., Ed.; 102-14: University of Georgia Extension Annual Publication; University of Georgia: Athens, GA, USA, 2021; p. 13. [Google Scholar]
- Gorbet, D.; Shokes, F. Registration of ‘C-99R’ peanut. Crop Sci. 2002, 42, 2207. [Google Scholar] [CrossRef]
- Branch, W. Registration of ‘Georgia-12Y’ peanut. J. Plant Regist. 2013, 7, 151–153. [Google Scholar] [CrossRef]
- Gorbet, D.W.; Tillman, B.L. Registration of ‘York’ peanut. J. Plant Regist. 2011, 5, 289–294. [Google Scholar] [CrossRef]
- Branch, W.; Brenneman, T. Registration of ‘Georgia-07W’ peanut. J. Plant Regist. 2008, 2, 88–91. [Google Scholar] [CrossRef]
- Gorbet, D.; Tillman, B. Registration of ‘Florida-07’ peanut. J. Plant Regist. 2009, 3, 14–18. [Google Scholar] [CrossRef]
- Branch, W.; Culbreath, A. Registration of ‘Georgia-10T’ peanut. J. Plant Regist. 2011, 5, 279–281. [Google Scholar] [CrossRef]
- Tillman, B.; Gorbet, D. Registration of ‘TUFRunner ‘511’’ peanut. J. Plant Regist. 2017, 11, 235–239. [Google Scholar] [CrossRef]
- Tillman, B.L. Registration of ‘TUFRunner ‘297’’ peanut. J. Plant Regist. 2018, 12, 31–34. [Google Scholar] [CrossRef]
- Beute, M.; Wynne, J.; Emery, D. Registration of NC 3033 Peanut Germplasm 1 (Reg. No. GP 9). Crop Sci. 1976, 16, 887. [Google Scholar] [CrossRef]
- Isleib, T.G.; Milla-Lewis, S.R.; Pattee, H.E.; Copeland, S.C.; Zuleta, M.; Shew, B.B.; Hollowell, J.E.; Sanders, T.H.; Dean, L.O.; Hendrix, K.W. Registration of ‘Bailey’ peanut. J. Plant Regist. 2011, 5, 27–39. [Google Scholar] [CrossRef]
- Krapovickas, A.; Gregory, W.C.; Williams, D.E.; Simpson, C.E. Taxonomy of the genus Arachis (Leguminosae). Bonplandia 2007, 16, 7–205. [Google Scholar] [CrossRef]
- Santana, S.H.; Valls, J.F. Arachis veigae (Fabaceae), the most dispersed wild species of the genus, and yet taxonomically overlooked. Bonplandia 2015, 24, 139–150. [Google Scholar] [CrossRef]
- Simpson, C.; Krapovickas, A.; Valls, J. History of Arachis including evidence of A. hypogaea L. progenitors. Peanut Sci. 2001, 28, 78–80. [Google Scholar] [CrossRef]
- Valls, J.F.; Simpson, C.E. New species of Arachis (leguminosae) from Brazil, Paraguay and Bolivia. Bonplandia 2005, 14, 35–63. [Google Scholar] [CrossRef]
- Valls, J.F.; Simpson, C.E. A new species of Arachis (Fabaceae) from Mato Grosso, Brazil, related to A. matiensis. Bonplandia 2017, 26, 143–149. [Google Scholar] [CrossRef]
- Seijo, G.J.; Atahuachi, M.; Simpson, C.E.; Krapovickas, A. Arachis inflata: A new B genome species of Arachis (Fabaceae). Bonplandia 2021, 30, 169–174. [Google Scholar] [CrossRef]
- Leal-Bertioli, S.C.; José, A.C.V.; Alves-Freitas, D.M.; Moretzsohn, M.C.; Guimarães, P.M.; Nielen, S.; Vidigal, B.S.; Pereira, R.W.; Pike, J.; Fávero, A.P. Identification of candidate genome regions controlling disease resistance in Arachis. BMC Plant Biol. 2009, 9, 112. [Google Scholar] [CrossRef]
- Zhou, X.; Xia, Y.; Liao, J.; Liu, K.; Li, Q.; Dong, Y.; Ren, X.; Chen, Y.; Huang, L.; Liao, B. Quantitative trait locus analysis of late leaf spot resistance and plant-type-related traits in cultivated peanut (Arachis hypogaea L.) under multi-environments. PLoS ONE 2016, 11, e0166873. [Google Scholar] [CrossRef]
- Kumar, D.; Kirti, P.B. Transcriptomic and proteomic analyses of resistant host responses in Arachis diogoi challenged with late leaf spot pathogen, Phaeoisariopsis personata. PLoS ONE 2015, 10, e0117559. [Google Scholar] [CrossRef] [PubMed]
- Bertioli, D.J.; Clevenger, J.; Godoy, I.J.; Stalker, H.; Wood, S.; Santos, J.F.; Ballén-Taborda, C.; Abernathy, B.; Azevedo, V.; Campbell, J. Legacy genetics of Arachis cardenasii in the peanut crop shows the profound benefits of international seed exchange. Proc. Natl. Acad. Sci. 2021, 118, e2104899118. [Google Scholar] [CrossRef]
- Levinson, C.M.; Antepenko, E.; Leal-Bertioli, S.; Chu, Y.; Culbreath, A.K.; Stalker, H.T.; Gao, D.; Ozias-Akins, P. Resistance to rust (Puccinia arachidis Speg.) identified in nascent allotetraploids cross-compatible with cultivated peanut (Arachis hypogaea L.). Peanut Sci. 2021, 48, 123–130. [Google Scholar] [CrossRef]
- Stalker, H. Utilizing Arachis cardenasii as a source of Cercospora leafspot resistance for peanut improvement. Euphytica 1984, 33, 529–538. [Google Scholar] [CrossRef]
- Nelson, S.; Starr, J.; Simpson, C. Expression of resistance to Meloidogyne arenaria in Arachis batizocoi and A. cardenasii. J. Nematol. 1990, 22, 423. [Google Scholar]
- Holbrook, C.C.; Stalker, T.H. Peanut Breeding and genetic resources. In Plant breeding reviews; John Wiley & Sons: Hoboken, NJ, USA, 2008; pp. 297–340. [Google Scholar]
- Stalker, H.T. Utilizing wild species for peanut improvement. Crop Sci. 2017, 57, 1102–1120. [Google Scholar] [CrossRef]
- Bertioli, D.J.; Seijo, G.; Freitas, F.O.; Valls, J.F.; Leal-Bertioli, S.C.; Moretzsohn, M.C. An overview of peanut and its wild relatives. Plant Genet. Resour. 2011, 9, 134–149. [Google Scholar] [CrossRef]
- Leal-Bertioli, S.C.; Santos, S.P.; Dantas, K.M.; Inglis, P.W.; Nielen, S.; Araujo, A.C.; Silva, J.P.; Cavalcante, U.; Guimaraes, P.M.; Brasileiro, A.C.M. Arachis batizocoi: A study of its relationship to cultivated peanut (A. hypogaea) and its potential for introgression of wild genes into the peanut crop using induced allotetraploids. Ann. Bot. 2015, 115, 237–249. [Google Scholar] [CrossRef]
- Chu, Y.; Stalker, H.T.; Marasigan, K.; Levinson, C.M.; Gao, D.; Bertioli, D.J.; Leal-Bertioli, S.C.; Holbrook, C.C.; Jackson, S.A.; Ozias-Akins, P. Registration of three peanut allotetraploid interspecific hybrids resistant to late leaf spot disease and tomato spotted wilt. J. Plant Regist. 2021, 15, 562–572. [Google Scholar] [CrossRef]
- Bertioli, D.; Gao, D.; Ballen-Taborda, C.; Chu, Y.; Ozias-Akins, P.; Jackson, S.; Holbrook, C.; Leal-Bertioli, S. Registration of GA-BatSten1 and GA-MagSten1, two induced allotetraploids derived from peanut wild relatives with superior resistance to leaf spots, rust, and root-knot nematode. J. Plant Regist. 2021, 15, 372–378. [Google Scholar] [CrossRef]
- Suassuna, T.d.M.F.; Suassuna, N.D.; Moretzsohn, M.d.C.; Bertioli, S.C.d.M.L.; Bertioli, D.J.; Medeiros, E.P.d. Yield, market quality, and leaf spots partial resistance of interspecific peanut progenies. Crop Breed. Appl. Biotechnol. 2015, 15, 175–180. [Google Scholar] [CrossRef]
- Isleib, T.; Rice, P.; Mozingo II, R.; Copeland, S. Registration of N96076L peanut germplasm line. Crop Sci. 2006, 46, 2329. [Google Scholar] [CrossRef]
- Gowda, M.; Motagi, B.; Naidu, G.; Diddimani, S.; Sheshagiri, R. GPBD 4: A Spanish bunch groundnut genotype resistant to rust and late leaf spot. Int. Arachis Newsl. 2002, 22, 29–32. [Google Scholar]
- Simpson, C.; Starr, J. Registration of ‘COAN’ Peanut. Crop Sci. 2001, 41, 918. [Google Scholar] [CrossRef]
- Simpson, C.; Starr, J.; Church, G.; Burow, M.; Paterson, A. Registration of ’NemaTAM’ peanut. Crop Sci. 2003, 43, 1561–1562. [Google Scholar] [CrossRef]
- Simpson, C.; Starr, J.; Baring, M.; Burow, M.; Cason, J.; Wilson, J. Registration of ‘Webb’ peanut. J. Plant Regist. 2013, 7, 265–268. [Google Scholar] [CrossRef]
- Holbrook, C.C.; Timper, P.; Culbreath, A.K.; Kvien, C.K. Registration of ‘Tifguard’ peanut. J. Plant Regist. 2008, 2, 92–94. [Google Scholar] [CrossRef]
- Holbrook, C.C.; Ozias-Akins, P.; Chu, Y.; Culbreath, A.K.; Kvien, C.K.; Brenneman, T.B. Registration of ‘TifNV-High O/L’ Peanut. J. Plant Regist. 2017, 11, 228–230. [Google Scholar] [CrossRef]
- Branch, W.; Brenneman, T. Registration of ‘Georgia-14N’ peanut. J. Plant Regist. 2015, 9, 159–161. [Google Scholar] [CrossRef]
- Branch, W.; Brenneman, T. Registration of ‘Georgia-17SP’ peanut. J. Plant Regist. 2018, 12, 300–303. [Google Scholar] [CrossRef]
- Burow, M.D.; Simpson, C.E.; Paterson, A.H.; Starr, J.L. Identification of peanut (Arachis hypogaea L.) RAPD markers diagnostic of root-knot nematode (Meloidogyne arenaria (Neal) Chitwood) resistance. Mol. Breed. 1996, 2, 369–379. [Google Scholar] [CrossRef]
- Choi, K.; Burow, M.; Church, G.; Burow, G.; Paterson, A.; Simpson, C.; Starr, J. Genetics and mechanism of resistance to Meloidogyne arenaria in peanut germplasm. J. Nematol. 1999, 31, 283. [Google Scholar] [PubMed]
- Leal-Bertioli, S.C.; Moretzsohn, M.C.; Roberts, P.A.; Ballén-Taborda, C.; Borba, T.C.; Valdisser, P.A.; Vianello, R.P.; Araújo, A.C.G.; Guimarães, P.M.; Bertioli, D.J. Genetic mapping of resistance to Meloidogyne arenaria in Arachis stenosperma: A new source of nematode resistance for peanut. G3 Genes Genomes Genet. 2016, 6, 377–390. [Google Scholar] [CrossRef] [PubMed]
- Guimaraes, P.M.; Guimaraes, L.A.; Morgante, C.V.; Silva, O.B., Jr.; Araujo, A.C.G.; Martins, A.C.; Saraiva, M.A.; Oliveira, T.N.; Togawa, R.C.; Leal-Bertioli, S.C. Root transcriptome analysis of wild peanut reveals candidate genes for nematode resistance. PLoS ONE 2015, 10, e0140937. [Google Scholar] [CrossRef] [PubMed]
- Bera, S.; Kamdar, J.; Kasundra, S.; Darvhankar, M.; Jasani, M.; Thirumalaisamy, P. An efficient phenotyping technique for wild Arachis species and groundnut breeding lines resistant to stem rot disease under field conditions. Indian Phytopathol. 2016, 69, 646–648. [Google Scholar]
- Bera, S.; Kamdar, J.; Kasundra, S.; Thirumalaisami, P. Identification of groundnut genotypes and wild species resistant to stem rot using an efficient field screening technique. Electron. J. Plant Breed. 2016, 7, 61–70. [Google Scholar] [CrossRef]
- Bennett, R.; Harting, A.; Simpson, C.; Tallury, S.; Pickering, A.; Wang, N.; Dunne, J. A note on a greenhouse evaluation of wild Arachis species for resistance to Athelia rolfsii. Peanut Sci. 2021, 48, 40–48. [Google Scholar] [CrossRef]
- Mauricio, R. Mapping quantitative trait loci in plants: Uses and caveats for evolutionary biology. Nat. Rev. Genet. 2001, 2, 370–381. [Google Scholar] [CrossRef]
- Kearsey, M.J.; Farquhar, A. QTL analysis in plants; where are we now? Heredity 1998, 80, 137–142. [Google Scholar] [CrossRef]
- Alonso-Blanco, C.; Koornneef, M.; van Ooijen, J.W. QTL analysis. In Arabidopsis Protocols; Humana Press: Totowa, NJ, USA, 2006; pp. 79–99. [Google Scholar]
- Huang, R.; Li, H.; Gao, C.; Yu, W.; Zhang, S. Advances in omics research on peanut response to biotic stresses. Front. Plant Sci. 2023, 14, 1101994. [Google Scholar] [CrossRef]
- Luo, Z.; Cui, R.; Chavarro, C.; Tseng, Y.-C.; Zhou, H.; Peng, Z.; Chu, Y.; Yang, X.; Lopez, Y.; Tillman, B. Mapping quantitative trait loci (QTLs) and estimating the epistasis controlling stem rot resistance in cultivated peanut (Arachis hypogaea). Theor. Appl. Genet. 2020, 133, 1201–1212. [Google Scholar] [CrossRef]
- Chu, Y.; Chee, P.; Culbreath, A.; Isleib, T.G.; Holbrook, C.C.; Ozias-Akins, P. Major QTLs for resistance to early and late leaf spot diseases are identified on chromosomes 3 and 5 in peanut (Arachis hypogaea). Front. Plant Sci. 2019, 10, 883. [Google Scholar] [CrossRef] [PubMed]
- Ballén-Taborda, C.; Chu, Y.; Ozias-Akins, P.; Timper, P.; Holbrook, C.C.; Jackson, S.A.; Bertioli, D.J.; Leal-Bertioli, S.C. A new source of root-knot nematode resistance from Arachis stenosperma incorporated into allotetraploid peanut (Arachis hypogaea). Sci. Rep. 2019, 9, 17702. [Google Scholar] [CrossRef] [PubMed]
- Leal-Bertioli, S.C.; Cavalcante, U.; Gouvea, E.G.; Ballén-Taborda, C.; Shirasawa, K.; Guimarães, P.M.; Jackson, S.A.; Bertioli, D.J.; Moretzsohn, M.C. Identification of QTLs for rust resistance in the peanut wild species Arachis magna and the development of KASP markers for marker-assisted selection. G3 Genes Genomes Genet. 2015, 5, 1403–1413. [Google Scholar] [CrossRef]
- Chu, Y.; Chee, P.; Isleib, T.G.; Holbrook, C.C.; Ozias-Akins, P. Major seed size QTL on chromosome A05 of peanut (Arachis hypogaea) is conserved in the US mini core germplasm collection. Mol. Breed. 2020, 40, 6. [Google Scholar] [CrossRef]
- Li, Y.; Li, L.; Zhang, X.; Zhang, K.; Ma, D.; Liu, J.; Wang, X.; Liu, F.; Wan, Y. QTL mapping and marker analysis of main stem height and the first lateral branch length in peanut (Arachis hypogaea L.). Euphytica 2017, 213, 57. [Google Scholar] [CrossRef]
- Fonceka, D.; Tossim, H.-A.; Rivallan, R.; Vignes, H.; Faye, I.; Ndoye, O.; Moretzsohn, M.C.; Bertioli, D.J.; Glaszmann, J.-C.; Courtois, B. Fostered and left behind alleles in peanut: Interspecific QTL mapping reveals footprints of domestication and useful natural variation for breeding. BMC Plant Biol. 2012, 12, 26. [Google Scholar] [CrossRef]
- Bera, S.; Kamdar, J.; Kasundra, S.; Ajay, B. A novel QTL governing resistance to stem rot disease caused by Sclerotium rolfsii in peanut. Australas. Plant Pathol. 2016, 45, 637–644. [Google Scholar] [CrossRef]
- Dodia, S.M.; Rathnakumar, A.; Mishra, G.P.; Radhakrishnan, T.; Binal, J.; Thirumalaisamy, P.; Narendra, K.; Sumitra, C.; Dobaria, J.; Abhay, K. Phenotyping and molecular marker analysis for stem-rot disease resistance using F2 mapping population in groundnut. Int. J. Trop. Agric. 2016, 34, 1135–1139. [Google Scholar]
- Pandey, M.K.; Agarwal, G.; Kale, S.M.; Clevenger, J.; Nayak, S.N.; Sriswathi, M.; Chitikineni, A.; Chavarro, C.; Chen, X.; Upadhyaya, H.D. Development and evaluation of a high density genotyping ‘Axiom_Arachis’ array with 58 K SNPs for accelerating genetics and breeding in groundnut. Sci. Rep. 2017, 7, 40577. [Google Scholar] [CrossRef]
- Essandoh, D.A.; Odong, T.; Okello, D.K.; Fonceka, D.; Nguepjop, J.; Sambou, A.; Ballén-Taborda, C.; Chavarro, C.; Bertioli, D.J.; Leal-Bertioli, S.C. Quantitative Trait Analysis Shows the Potential for Alleles from the Wild Species Arachis batizocoi and A. duranensis to Improve Groundnut Disease Resistance and Yield in East Africa. Agronomy 2022, 12, 2202. [Google Scholar] [CrossRef]
- Chavarro, C.; Chu, Y.; Holbrook, C.; Isleib, T.; Bertioli, D.; Hovav, R.; Butts, C.; Lamb, M.; Sorensen, R.; Jackson, S.A. Pod and seed trait QTL identification to assist breeding for peanut market preferences. G3: Genes Genomes Genet. 2020, 10, 2297–2315. [Google Scholar] [CrossRef] [PubMed]
- Clevenger, J.P.; Korani, W.; Ozias-Akins, P.; Jackson, S. Haplotype-based genotyping in polyploids. Front. Plant Sci. 2018, 9, 564. [Google Scholar] [CrossRef] [PubMed]
- Cui, R.; Clevenger, J.; Chu, Y.; Brenneman, T.; Isleib, T.G.; Holbrook, C.C.; Ozias-Akins, P. Quantitative trait loci sequencing–derived molecular markers for selection of stem rot resistance in peanut. Crop Sci. 2020, 60, 2008–2018. [Google Scholar] [CrossRef]
- Agmon, S.; Kunta, S.; Dafny Yelin, M.; Moy, J.; Ibdah, M.; Harel, A.; Rabinovitch, O.; Levy, Y.; Hovav, R. Mapping of stem rot resistance in peanut indicates significant effect for plant architecture locus. Crop Sci. 2022, 62, 2197–2211. [Google Scholar] [CrossRef]
- Leal-Bertioli, S.C.; Moretzsohn, M.C.; Santos, S.P.; Brasileiro, A.C.; Guimarães, P.M.; Bertioli, D.J.; Araujo, A.C.G. Phenotypic effects of allotetraploidization of wild Arachis and their implications for peanut domestication. Am. J. Bot. 2017, 104, 379–388. [Google Scholar] [CrossRef] [PubMed]
- Fávero, A.P.; Simpson, C.E.; Valls, J.F.; Vello, N.A. Study of the evolution of cultivated peanut through crossability studies among Arachis ipaensis, A. duranensis, and A. hypogaea. Crop Sci. 2006, 46, 1546–1552. [Google Scholar] [CrossRef]
- Gao, D.; Araujo, A.C.; Nascimento, E.F.; Chavarro, M.C.; Xia, H.; Jackson, S.A.; Bertioli, D.J.; Leal-Bertioli, S.C. ValSten: A new wild species derived allotetraploid for increasing genetic diversity of the peanut crop (Arachis hypogaea L.). Genet. Resour. Crop Evol. 2021, 68, 1471–1485. [Google Scholar] [CrossRef]
- Bertioli, D.J.; Jenkins, J.; Clevenger, J.; Dudchenko, O.; Gao, D.; Seijo, G.; Leal-Bertioli, S.C.; Ren, L.; Farmer, A.D.; Pandey, M.K. The genome sequence of segmental allotetraploid peanut Arachis hypogaea. Nat. Genet. 2019, 51, 877–884. [Google Scholar] [CrossRef] [PubMed]
- Tsai, Y.-C.; Brenneman, T.B.; Holbrook, C.C.; Chu, Y.; Ozias-Akins, P.; Bertioli, D.J.; Leal-Bertioli, S.C. Development of a Greenhouse Method to Evaluate the Peanut Resistance to Athelia rolfsii. PhytoFrontiers™ 2023, 3, 490–496. [Google Scholar] [CrossRef]
- Branch, W. Registration of ‘Georgia-09B’ peanut. J. Plant Regist. 2010, 4, 175–178. [Google Scholar] [CrossRef]
- Shokes, F.; Róźalski, K.; Gorbet, D.; Brenneman, T.; Berger, D. Techniques for inoculation of peanut with Sclerotium rolfsii in the greenhouse and field. Peanut Sci. 1996, 23, 124–128. [Google Scholar] [CrossRef]
- Shaner, G.; Finney, R. The effect of nitrogen fertilization on the expression of slow-mildewing resistance in Knox wheat. Phytopathology 1977, 67, 1051–1056. [Google Scholar] [CrossRef]
- Venables, W.N.; Smith, D.M.; Team, R.D.C. An introduction to R. Network Theory Limited Bristol: Bristol, UK, 2009. [Google Scholar]
- Kruskal, W.H.; Wallis, W.A. Use of ranks in one-criterion variance analysis. J. Am. Stat. Assoc. 1952, 47, 583–621. [Google Scholar] [CrossRef]
- Dunn, O.J. Multiple comparisons among means. J. Am. Stat. Assoc. 1961, 56, 52–64. [Google Scholar] [CrossRef]
- Holbrook, C.C.; Dong, W.; Timper, P.; Culbreath, A.K.; Kvien, C.K. Registration of peanut germplasm line TifGP-2, a nematode-susceptible sister line of ‘Tifguard’. J. Plant Regist. 2012, 6, 208–211. [Google Scholar] [CrossRef]
- Korani, W.; Clevenger, J.P.; Chu, Y.; Ozias-Akins, P. Machine learning as an effective method for identifying true single nucleotide polymorphisms in polyploid plants. Plant Genome 2019, 12, 180023. [Google Scholar] [CrossRef] [PubMed]
- Voorrips, R.E.; Gort, G.; Vosman, B. Genotype calling in tetraploid species from bi-allelic marker data using mixture models. BMC Bioinform. 2011, 12, 172. [Google Scholar] [CrossRef] [PubMed]
- Stam, P. Construction of integrated genetic linkage maps by means of a new computer package: Join Map. Plant J. 1993, 3, 739–744. [Google Scholar] [CrossRef]
- Kosambi, D.D. The estimation of map distances from recombination values. In Mathematics and Statistics; Springer: New Delhi, India, 2016; pp. 125–130. [Google Scholar]
- Van Ooijen, J.W. LOD significance thresholds for QTL analysis in experimental populations of diploid species. Heredity 1999, 83, 613–624. [Google Scholar] [CrossRef] [PubMed]
- Bertioli, D.J.; Cannon, S.B.; Froenicke, L.; Huang, G.; Farmer, A.D.; Cannon, E.K.; Liu, X.; Gao, D.; Clevenger, J.; Dash, S. The genome sequences of Arachis duranensis and Arachis ipaensis, the diploid ancestors of cultivated peanut. Nat. Genet. 2016, 48, 438–446. [Google Scholar] [CrossRef]
- Broman, K.W.; Sen, S. A Guide to QTL Mapping with R/qtl; Springer: New York, NY, USA, 2009; Volume 46. [Google Scholar]
- Voorrips, R. MapChart: Software for the graphical presentation of linkage maps and QTLs. J. Hered. 2002, 93, 77–78. [Google Scholar] [CrossRef] [PubMed]
- Ballén-Taborda, C.; Chu, Y.; Ozias-Akins, P.; Holbrook, C.C.; Timper, P.; Jackson, S.A.; Bertioli, D.J.; Leal-Bertioli, S.C. Development and genetic characterization of peanut advanced backcross lines that incorporate root-knot nematode resistance from Arachis stenosperma. Front. Plant Sci. 2022, 12, 785358. [Google Scholar] [CrossRef]
- Rodriguez-Kabana, R.; Backman, P.; Williams, J. Determination of yield losses to Sclerotium rolfsii in peanut fields. Plant Dis. Report. 1975, 59, 855–858. [Google Scholar]
- Shokes, F.; Weber, Z.; Gorbet, D.; Pudelko, H.; Taczanowski, M. Evaluation of peanut genotypes for resistance to Southern Stem rot using an agar disk technique. Peanut Sci. 1998, 25, 12–17. [Google Scholar] [CrossRef]
- Chen, Y.-J.; Pandey, S.; Catto, M.; Leal-Bertioli, S.; Abney, M.R.; Bag, S.; Hopkins, M.; Culbreath, A.; Srinivasan, R. Evaluation of wild peanut species and their allotetraploids for resistance against thrips and thrips-transmitted tomato spotted wilt orthotospovirus (TSWV). Pathogens 2023, 12, 1102. [Google Scholar] [CrossRef] [PubMed]
- Gonzales, M.; Kemerait, R., Jr.; Bertioli, D.; Leal-Bertioli, S. Strong resistance to early and late leaf spot in peanut-compatible wild-derived induced allotetraploids. Plant Dis. 2023, 107, 335–343. [Google Scholar] [CrossRef] [PubMed]
- Pande, S.; Rao, J.N. Resistance of wild Arachis species to late leaf spot and rust in greenhouse trials. Plant Dis. 2001, 85, 851–855. [Google Scholar] [CrossRef]
- Levinson, C.; Marasigan, K.; Chu, Y.; Stalker, H.; Holbrook, C.; Ni, X.; Williams, W.; Ozias-Akins, P. Resistance to fall armyworm (Lepidoptera: Noctuidae) feeding identified in nascent allotetraploids cross-compatible to cultivated peanut (Arachis hypogaea L.). Peanut Sci. 2020, 47, 123–134. [Google Scholar] [CrossRef]
- De Blas, F.J.; Bruno, C.I.; Arias, R.S.; Ballén-Taborda, C.; Mamani, E.; Oddino, C.; Rosso, M.; Costero, B.P.; Bressano, M.; Soave, J.H. Genetic mapping and QTL analysis for peanut smut resistance. BMC Plant Biol. 2021, 21, 312. [Google Scholar] [CrossRef]
- Dodia, S.M.; Joshi, B.; Gangurde, S.S.; Thirumalaisamy, P.P.; Mishra, G.P.; Narandrakumar, D.; Soni, P.; Rathnakumar, A.L.; Dobaria, J.R.; Sangh, C. Genotyping-by-sequencing based genetic mapping reveals large number of epistatic interactions for stem rot resistance in groundnut. Theor. Appl. Genet. 2019, 132, 1001–1016. [Google Scholar] [CrossRef]
- Mundt, C.C. Pyramiding for resistance durability: Theory and practice. Phytopathology 2018, 108, 792–802. [Google Scholar] [CrossRef]
- Koller, T.; Brunner, S.; Herren, G.; Hurni, S.; Keller, B. Pyramiding of transgenic Pm3 alleles in wheat results in improved powdery mildew resistance in the field. Theor. Appl. Genet. 2018, 131, 861–871. [Google Scholar] [CrossRef]
- Zhu, S.; Li, Y.; Vossen, J.H.; Visser, R.G.; Jacobsen, E. Functional stacking of three resistance genes against Phytophthora infestans in potato. Transgenic Res. 2012, 21, 89–99. [Google Scholar] [CrossRef]
- Souza, T.L.P.; Ragagnin, V.A.; Dessaune, S.N.; Sanglard, D.A.; Carneiro, J.E.S.; Moreira, M.A.; Barros, E.G. DNA marker-assisted selection to pyramid rust resistance genes in “carioca” seeded common bean lines. Euphytica 2014, 199, 303–316. [Google Scholar] [CrossRef]


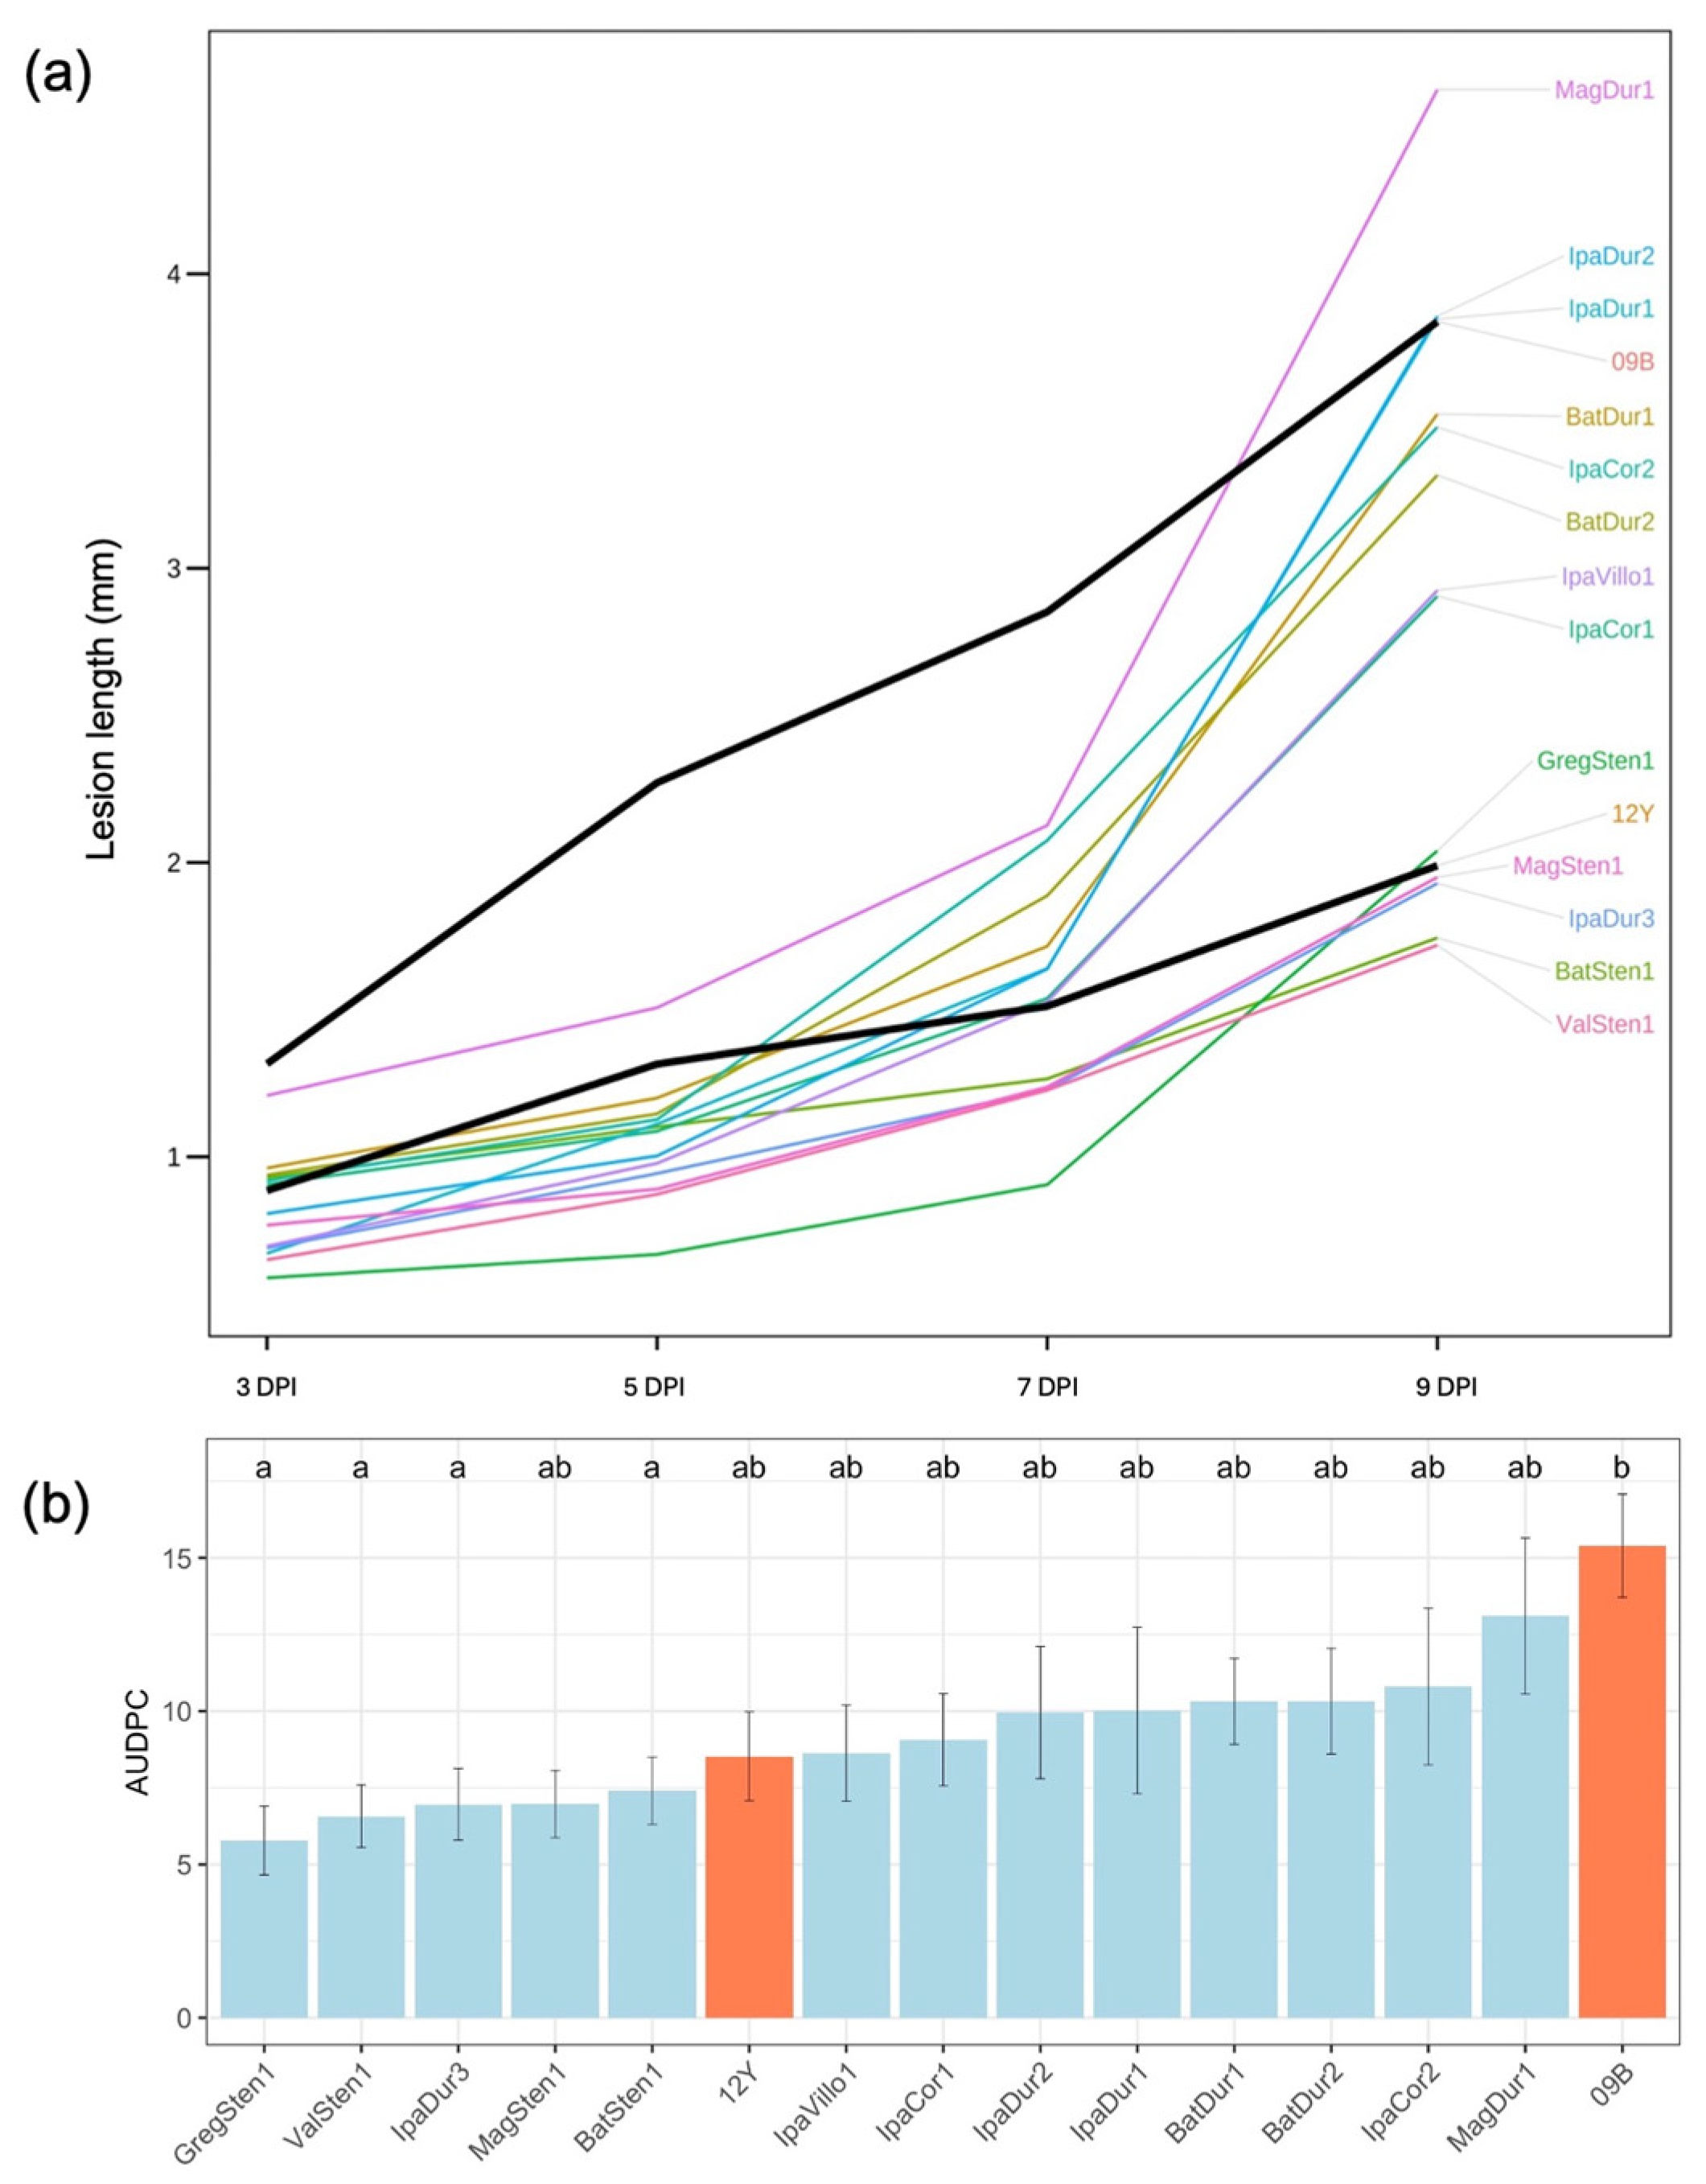
| Genotype | Genotype | Reference | 5 DPI a,b | 7 DPI | 9 DPI | AUDPC | ||||
|---|---|---|---|---|---|---|---|---|---|---|
| Abbreviation | Avg. c | Avg. | Avg. | Avg. | ||||||
| GregSten1 | [A. gregoryi V 6389 × A. stenosperma V 10309]4× | [72] | 0.67 d | a e | 0.91 | a | 2.04 | a | 5.78 | a |
| ValSten1 | [A. valida G 30011 × A. stenosperma V 10309]4× | [34,74] | 0.87 | a | 1.23 | a | 1.72 | ab | 6.57 | a |
| MagSten1 | [A. magna K 30097 × A. stenosperma V 10309]4× | [35] | 0.89 | a | 1.24 | ab | 1.95 | ab | 6.97 | ab |
| IpaDur3 | [A. ipaënsis K 30076 × A. duranensis K 30060]4× | [34] | 0.94 | a | 1.23 | a | 1.93 | ab | 6.96 | a |
| IpaVillo1 | [A. ipaënsis K 30076 × A. villosa V 12812]4× | [72] | 0.98 | a | 1.53 | ab | 2.92 | ab | 8.63 | ab |
| IpaDur2 | [A. ipaënsis K 30076 × A. duranensis V 14167]4× | [75] | 1.00 | a | 1.64 | ab | 3.86 | ab | 9.95 | ab |
| IpaCor1 | [A. ipaënsis K 30076 × A. correntina G 9548]4× | [72] | 1.09 | a | 1.54 | ab | 2.91 | ab | 9.06 | ab |
| BatSten1 | [A. batizocoi K 9484 × A. stenosperma V 10309]4× | [33] | 1.10 | a | 1.26 | a | 1.74 | a | 7.41 | a |
| IpaDur1 | [A. ipaënsis K 30076 × A. duranensis V 14167]4× | [73] | 1.11 | a | 1.64 | ab | 3.85 | ab | 10.02 | ab |
| IpaCor2 | [A. ipaënsis K 30076 × A. correntina G 9530]4× | [34] | 1.13 | ab | 2.08 | ab | 3.48 | ab | 10.80 | ab |
| BatDur2 | [A. batizocoi K 9484 × A. duranensis sesn 2848]4× | [33] | 1.15 | ab | 1.89 | ab | 3.32 | ab | 10.32 | ab |
| BatDur1 | [A. batizocoi K 9484 × A. duranensis V 14167]4× | [33] | 1.20 | ab | 1.72 | ab | 3.52 | ab | 10.32 | ab |
| GA-12Y f | A. hypogaea Georgia-12Y | [8] | 1.32 | ab | 1.51 | ab | 1.99 | ab | 8.53 | ab |
| MagDur1 | [A. magna K 30097 × A. duranensis V 14167]4× | NP | 1.51 | ab | 2.13 | ab | 4.63 | ab | 13.10 | ab |
| GA-09B f | A. hypogaea Georgia-09B | [77] | 2.27 | b | 2.85 | b | 3.84 | b | 15.40 | b |
| p-value of Kruskal-Wallis test | <0.001 * | <0.01 * | 0.023 * | <0.01 * | ||||||
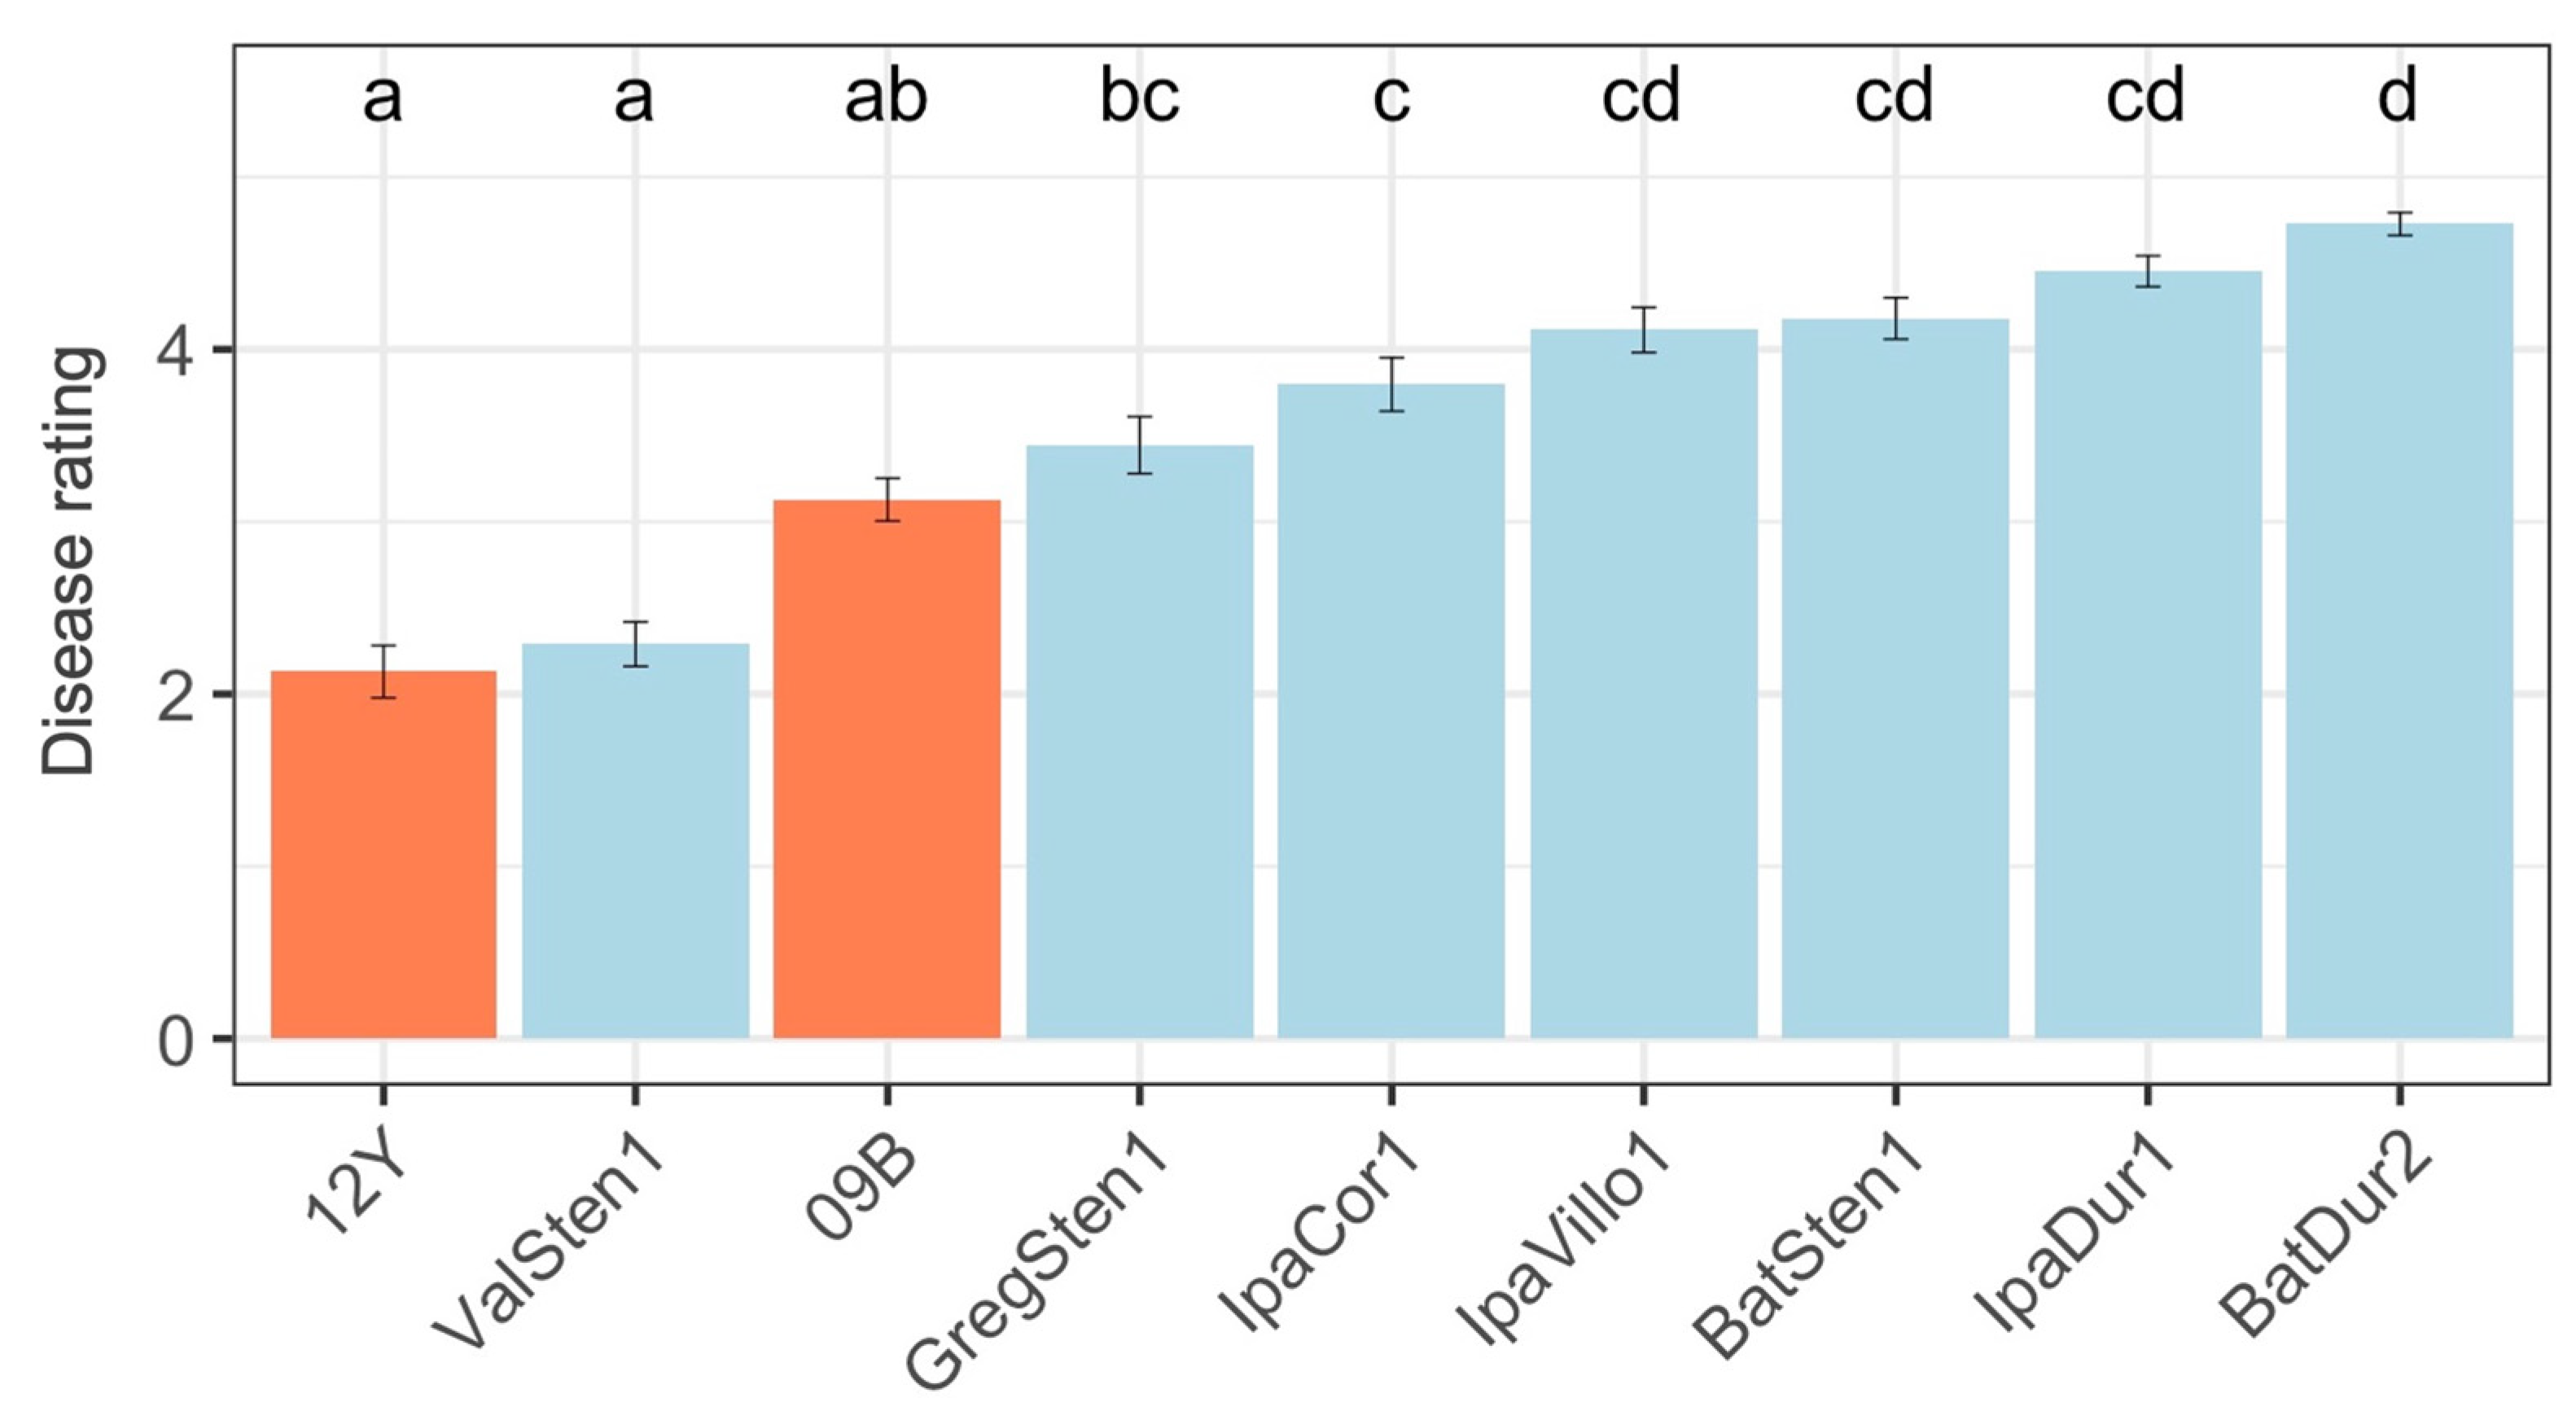
| Genotype | Genotype | 2019 End-of-Season Evaluation | 2020 Midseason Evaluation a | 2020 End-of-Season Evaluation | |||
|---|---|---|---|---|---|---|---|
| Abbreviation | Average | Average | Average | ||||
| ValSten1 | [A. valida G 30011 × A. stenosperma V 10309]4× | 2.28 | ab | 0.76 | a | 2.31 | a |
| GA-12Y b | A. hypogaea Georgia-12Y | 1.44 | b c | 1.23 | a | 2.84 | a |
| GA-09B b | A. hypogaea Georgia-09B | 3.28 | cd | 1.45 | ab | 2.97 | ab |
| GregSten1 | [A. gregoryi V 6389 × A. stenosperma V 10309]4× | 3.15 | c | 2.26 | bc | 3.79 | bc |
| MagSten1 d | [A. magna K 30097 × A. stenosperma V 10309]4× | 2.33 | bc | 3.64 | bc | ||
| IpaVillo1 | [A. ipaënsis K 30076 × A. villosa V 12812]4× | 3.88 | cd | 2.48 | cd | 4.42 | cd |
| IpaCor2 d | [A. ipaënsis K 30076 × A. correntina G 9530]4× | 2.44 | cd | 3.75 | cd | ||
| IpaCor1 | [A. ipaënsis K 3076 × A. correntina G 9548]4× | 3.42 | acd | 2.77 | cde | 4.00 | cde |
| MagDur1 d | [A. magna K 30097 × A. duranensis V 14167]4× | 2.92 | cde | 4.68 | cde | ||
| BatSten1 | [A. batizocoi K 9484 × A. stenosperma V 10309]4× | 3.76 | cd | 2.92 | cde | 4.50 | cde |
| BatDur2 | [A. batizocoi K 9484 × A. duranensis sesn 2848]4× | 4.32 | d | 3.08 | cde | 4.94 | cde |
| IpaDur3 d | [A. ipaënsis K 30076 × A. duranensis K 30060]4× | 3.26 | de | 4.86 | de | ||
| IpaDur1 | [A. ipaënsis K 30076 × A. duranensis V 14167]4× | 4.05 | cd | 3.45 | e | 4.84 | e |
| <0.001 * | <0.001 * | <0.001 * | |||||
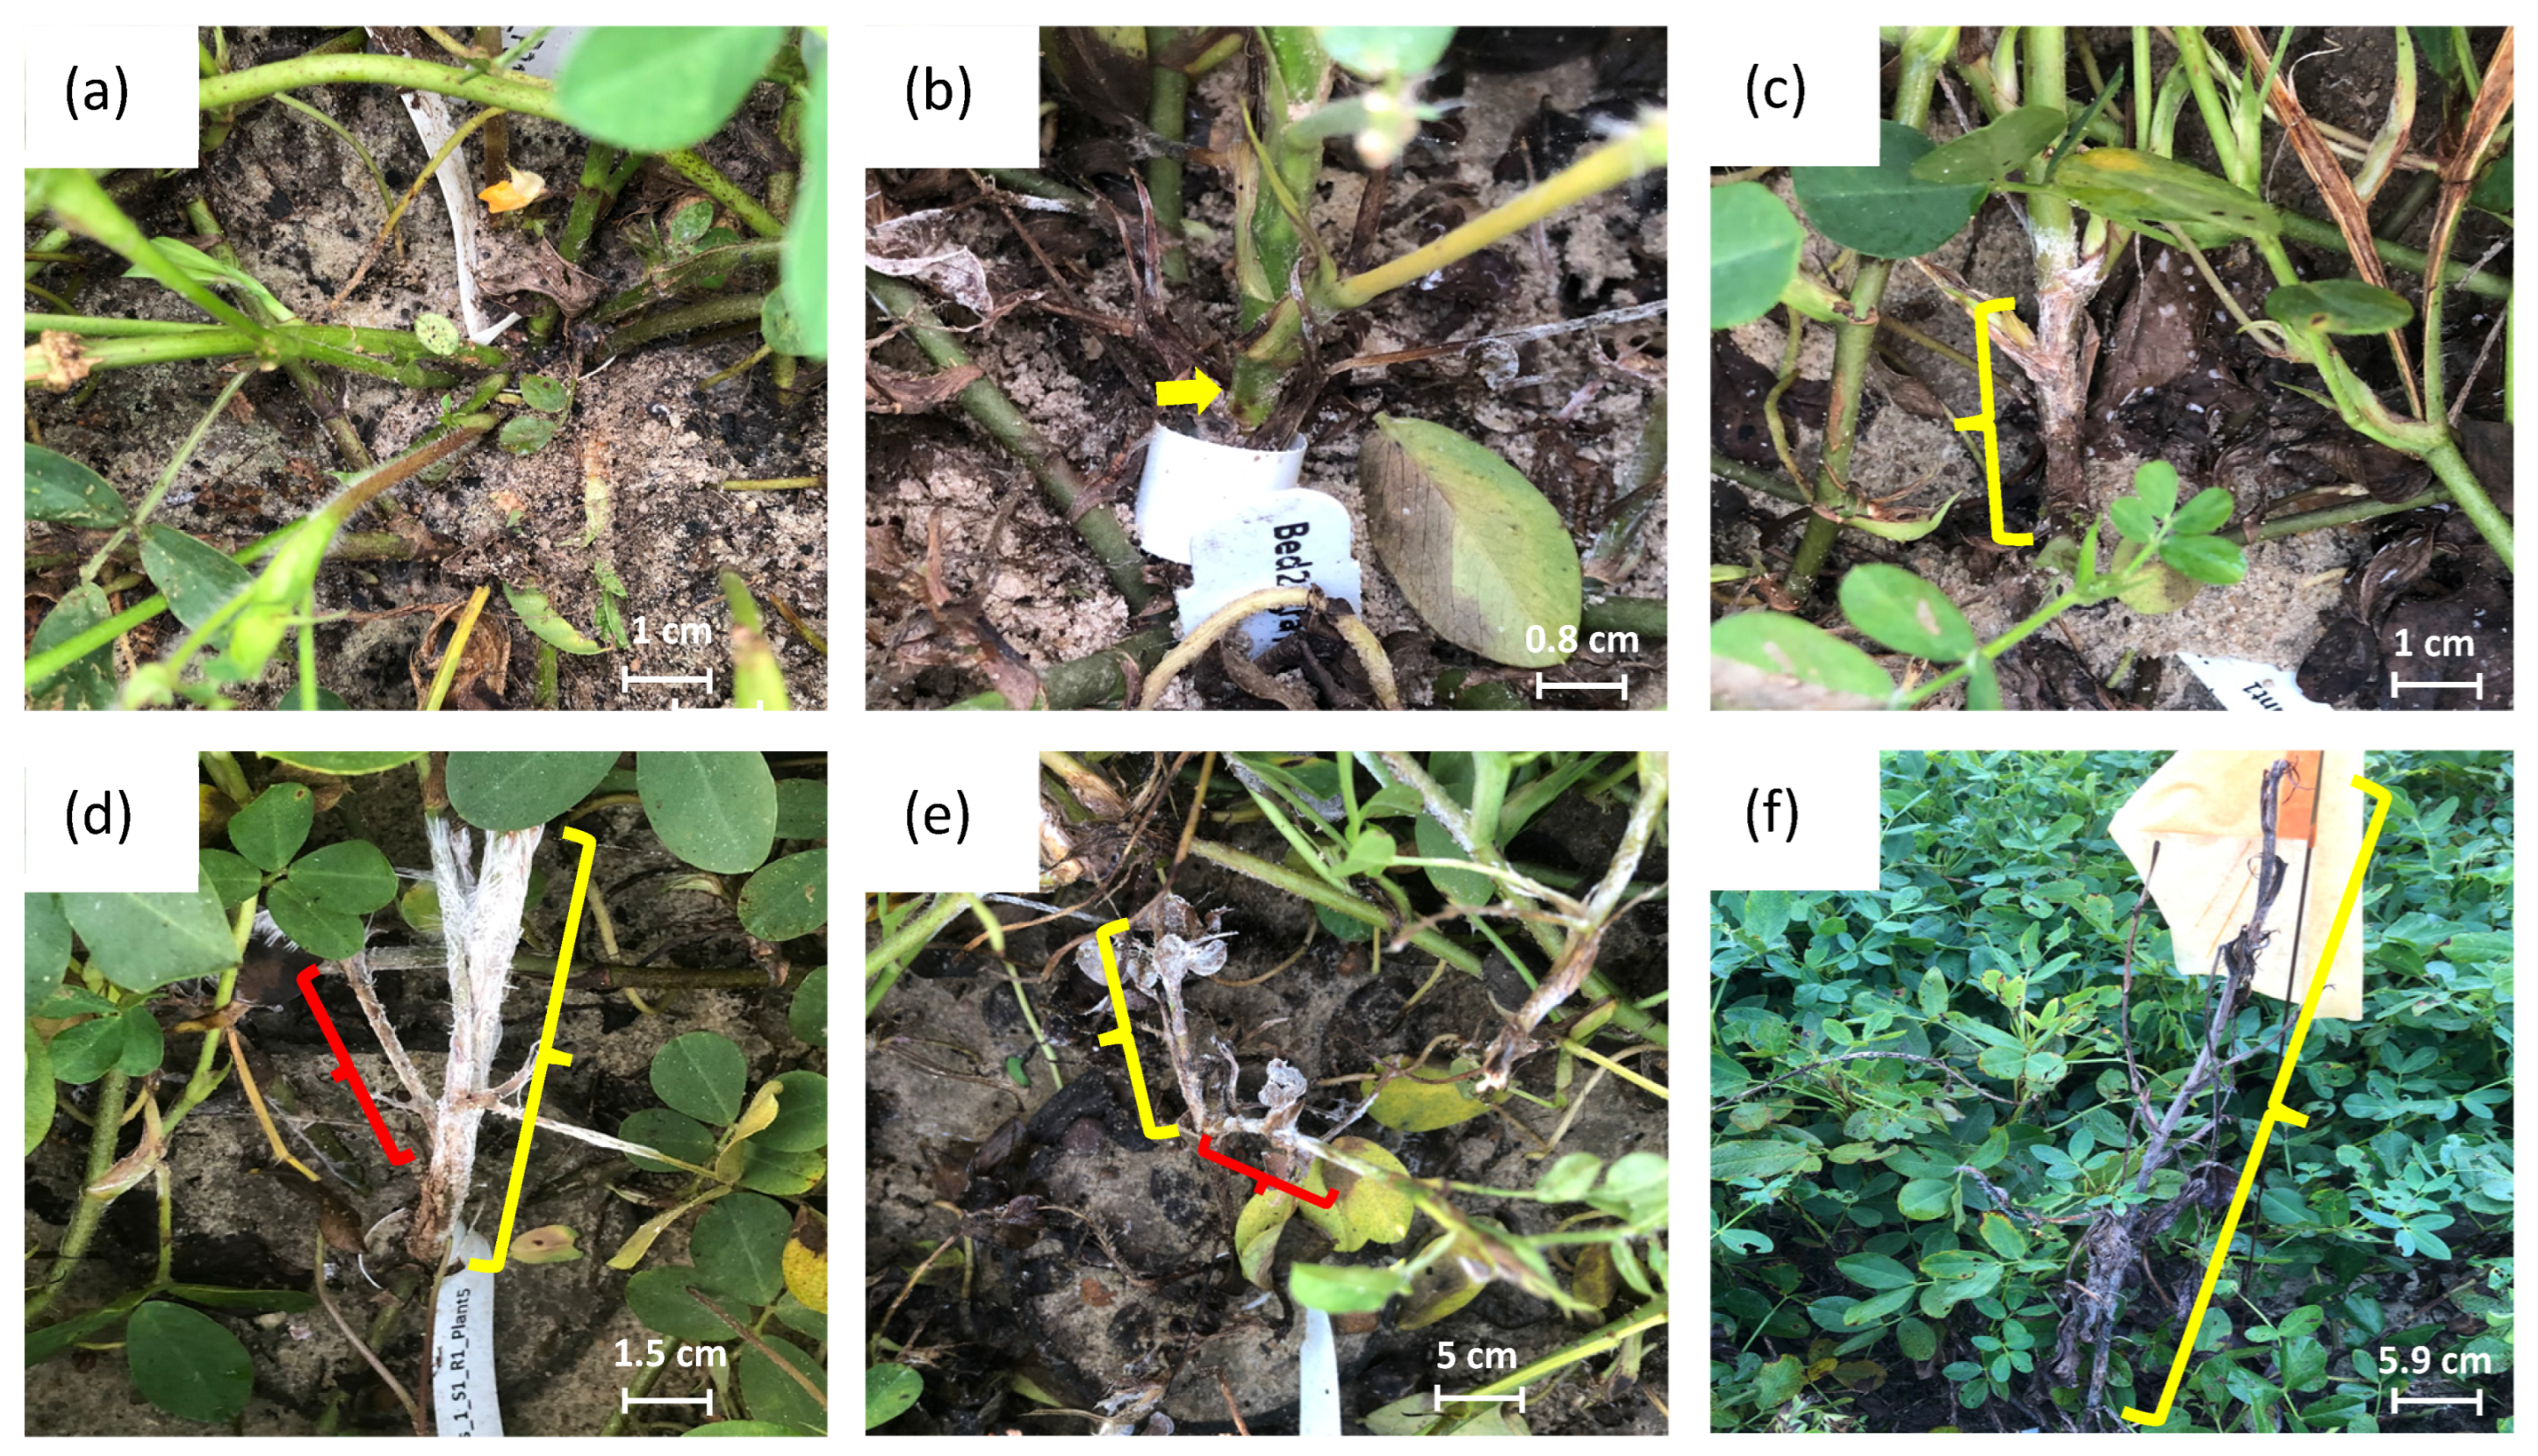
| Score | Description of Disease Development |
|---|---|
| 0 | No disease shown |
| 1 | A small lesion on the mainstem (<1 cm) |
| 2 | Larger lesions on the mainstem (1–4 cm), clean or small lesions on the laterals stem (<1 cm) |
| 3 | Larger lesions on the mainstem (>4 cm), more lesions on the lateral stem (1–4 cm) |
| 4 | Main stems dying, laterals largely affected (>4 cm) |
| 5 | Dead plant |
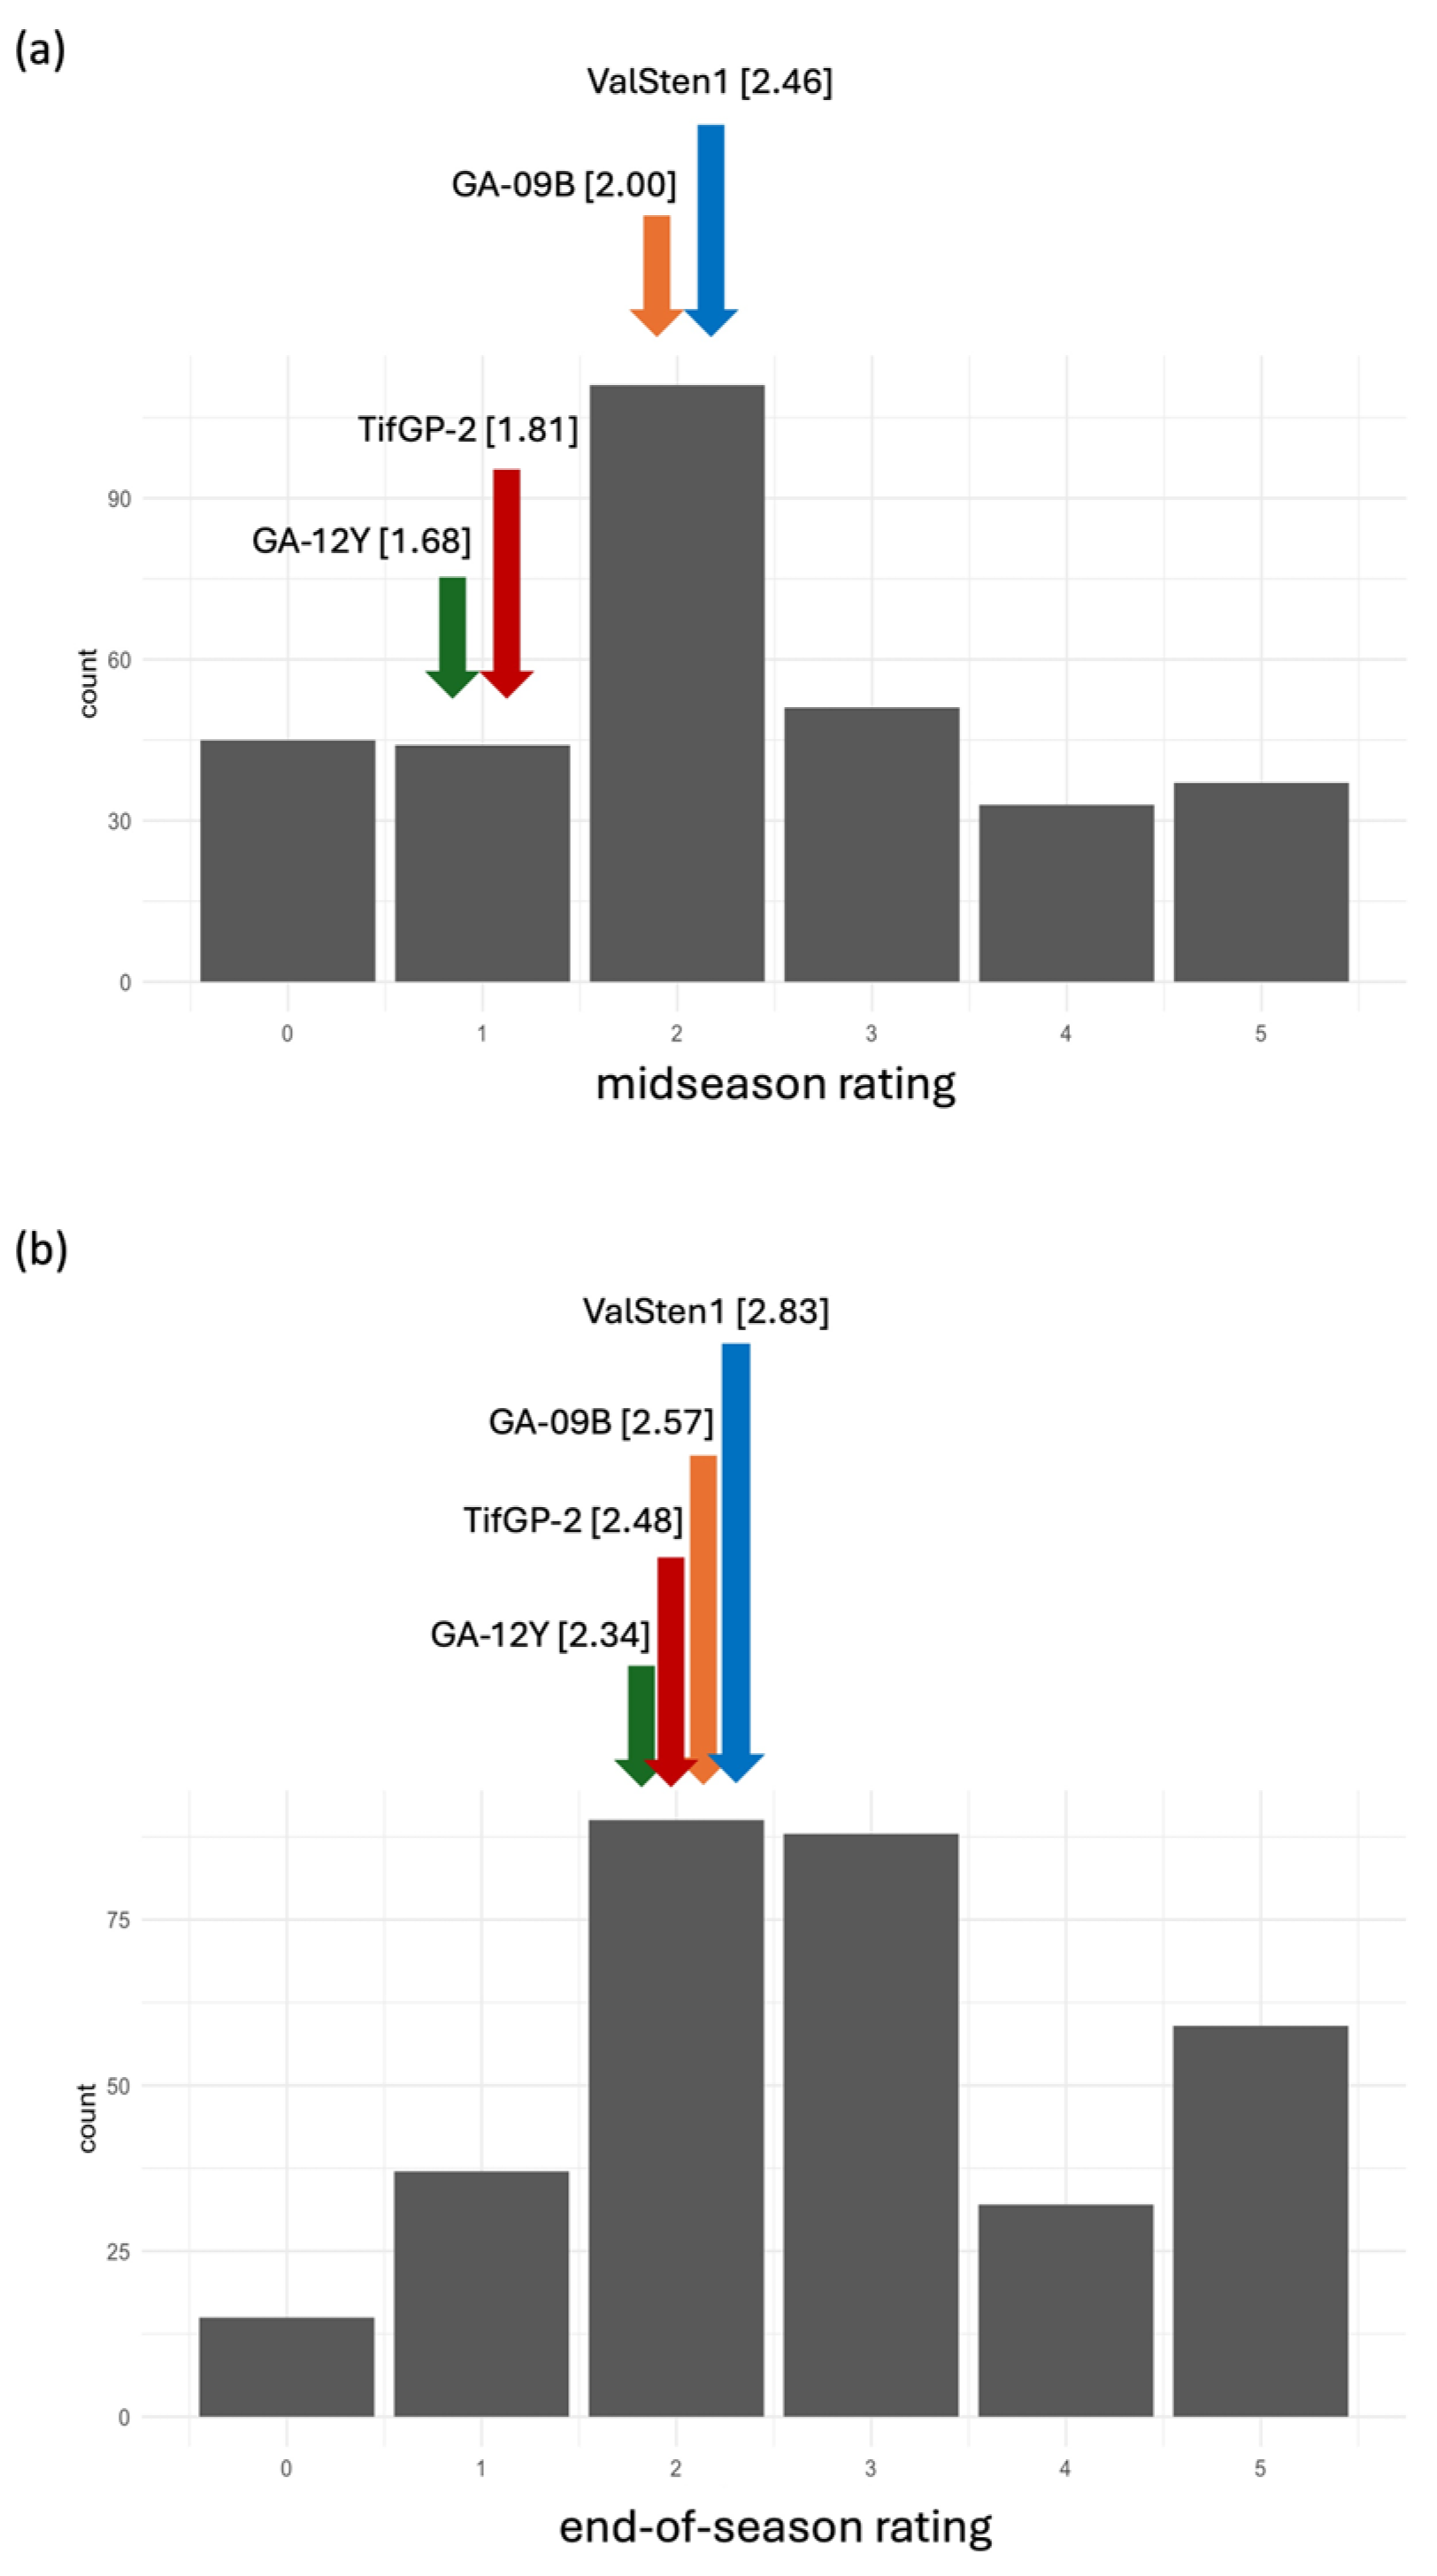
| Genotype | Evaluation | ||
|---|---|---|---|
| Midseason a | End of Season a | ||
| Average b | Average | ||
| GA-12Y c | 1.68 ± 1.07 | a | 2.34 ± 0.76 |
| TifGP-2 d | 1.81 ± 0.82 | ab | 2.48 ± 0.83 |
| GA-09B c | 2.00 ± 1.26 | ab | 2.57 ± 1.09 |
| ValSten1 d | 2.46 ± 0.82 | b | 2.83 ± 0.92 |
| F2 | 2.29 (data range 0–5) | 2.82 (data range 0–5) | |
| p-value of Kruskal–Wallis | 0.013 e | 0.328 e | |
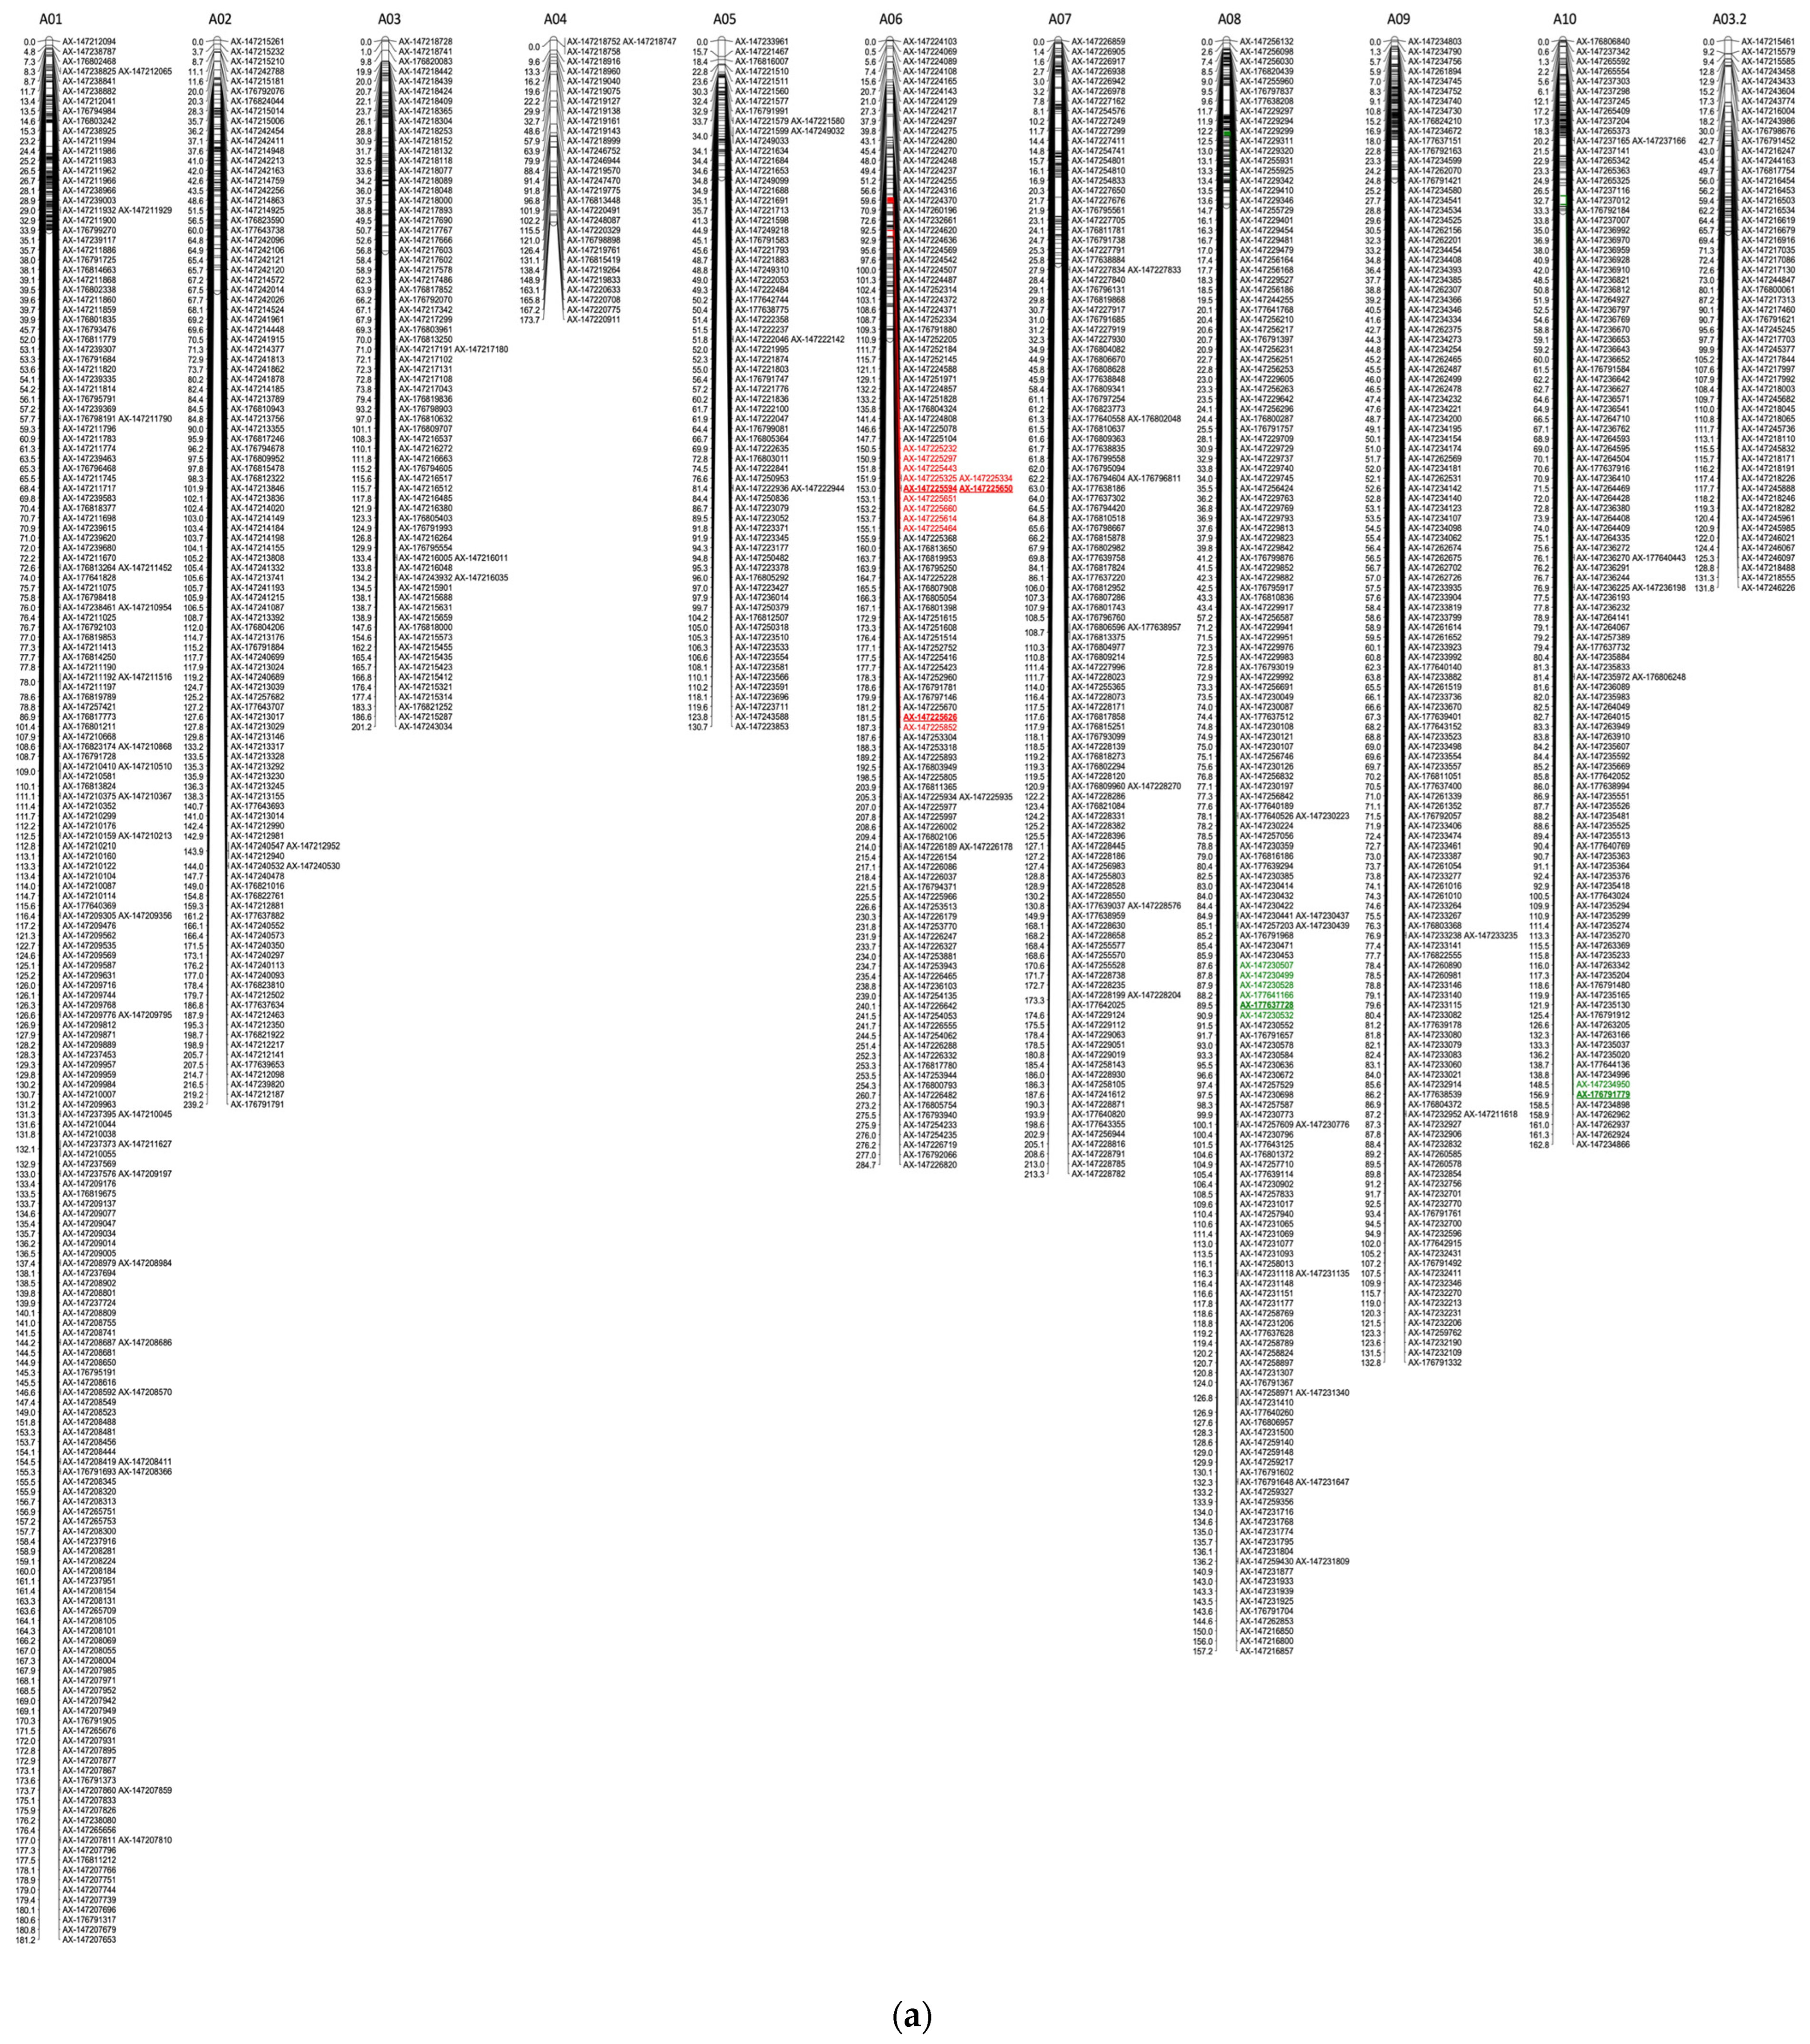
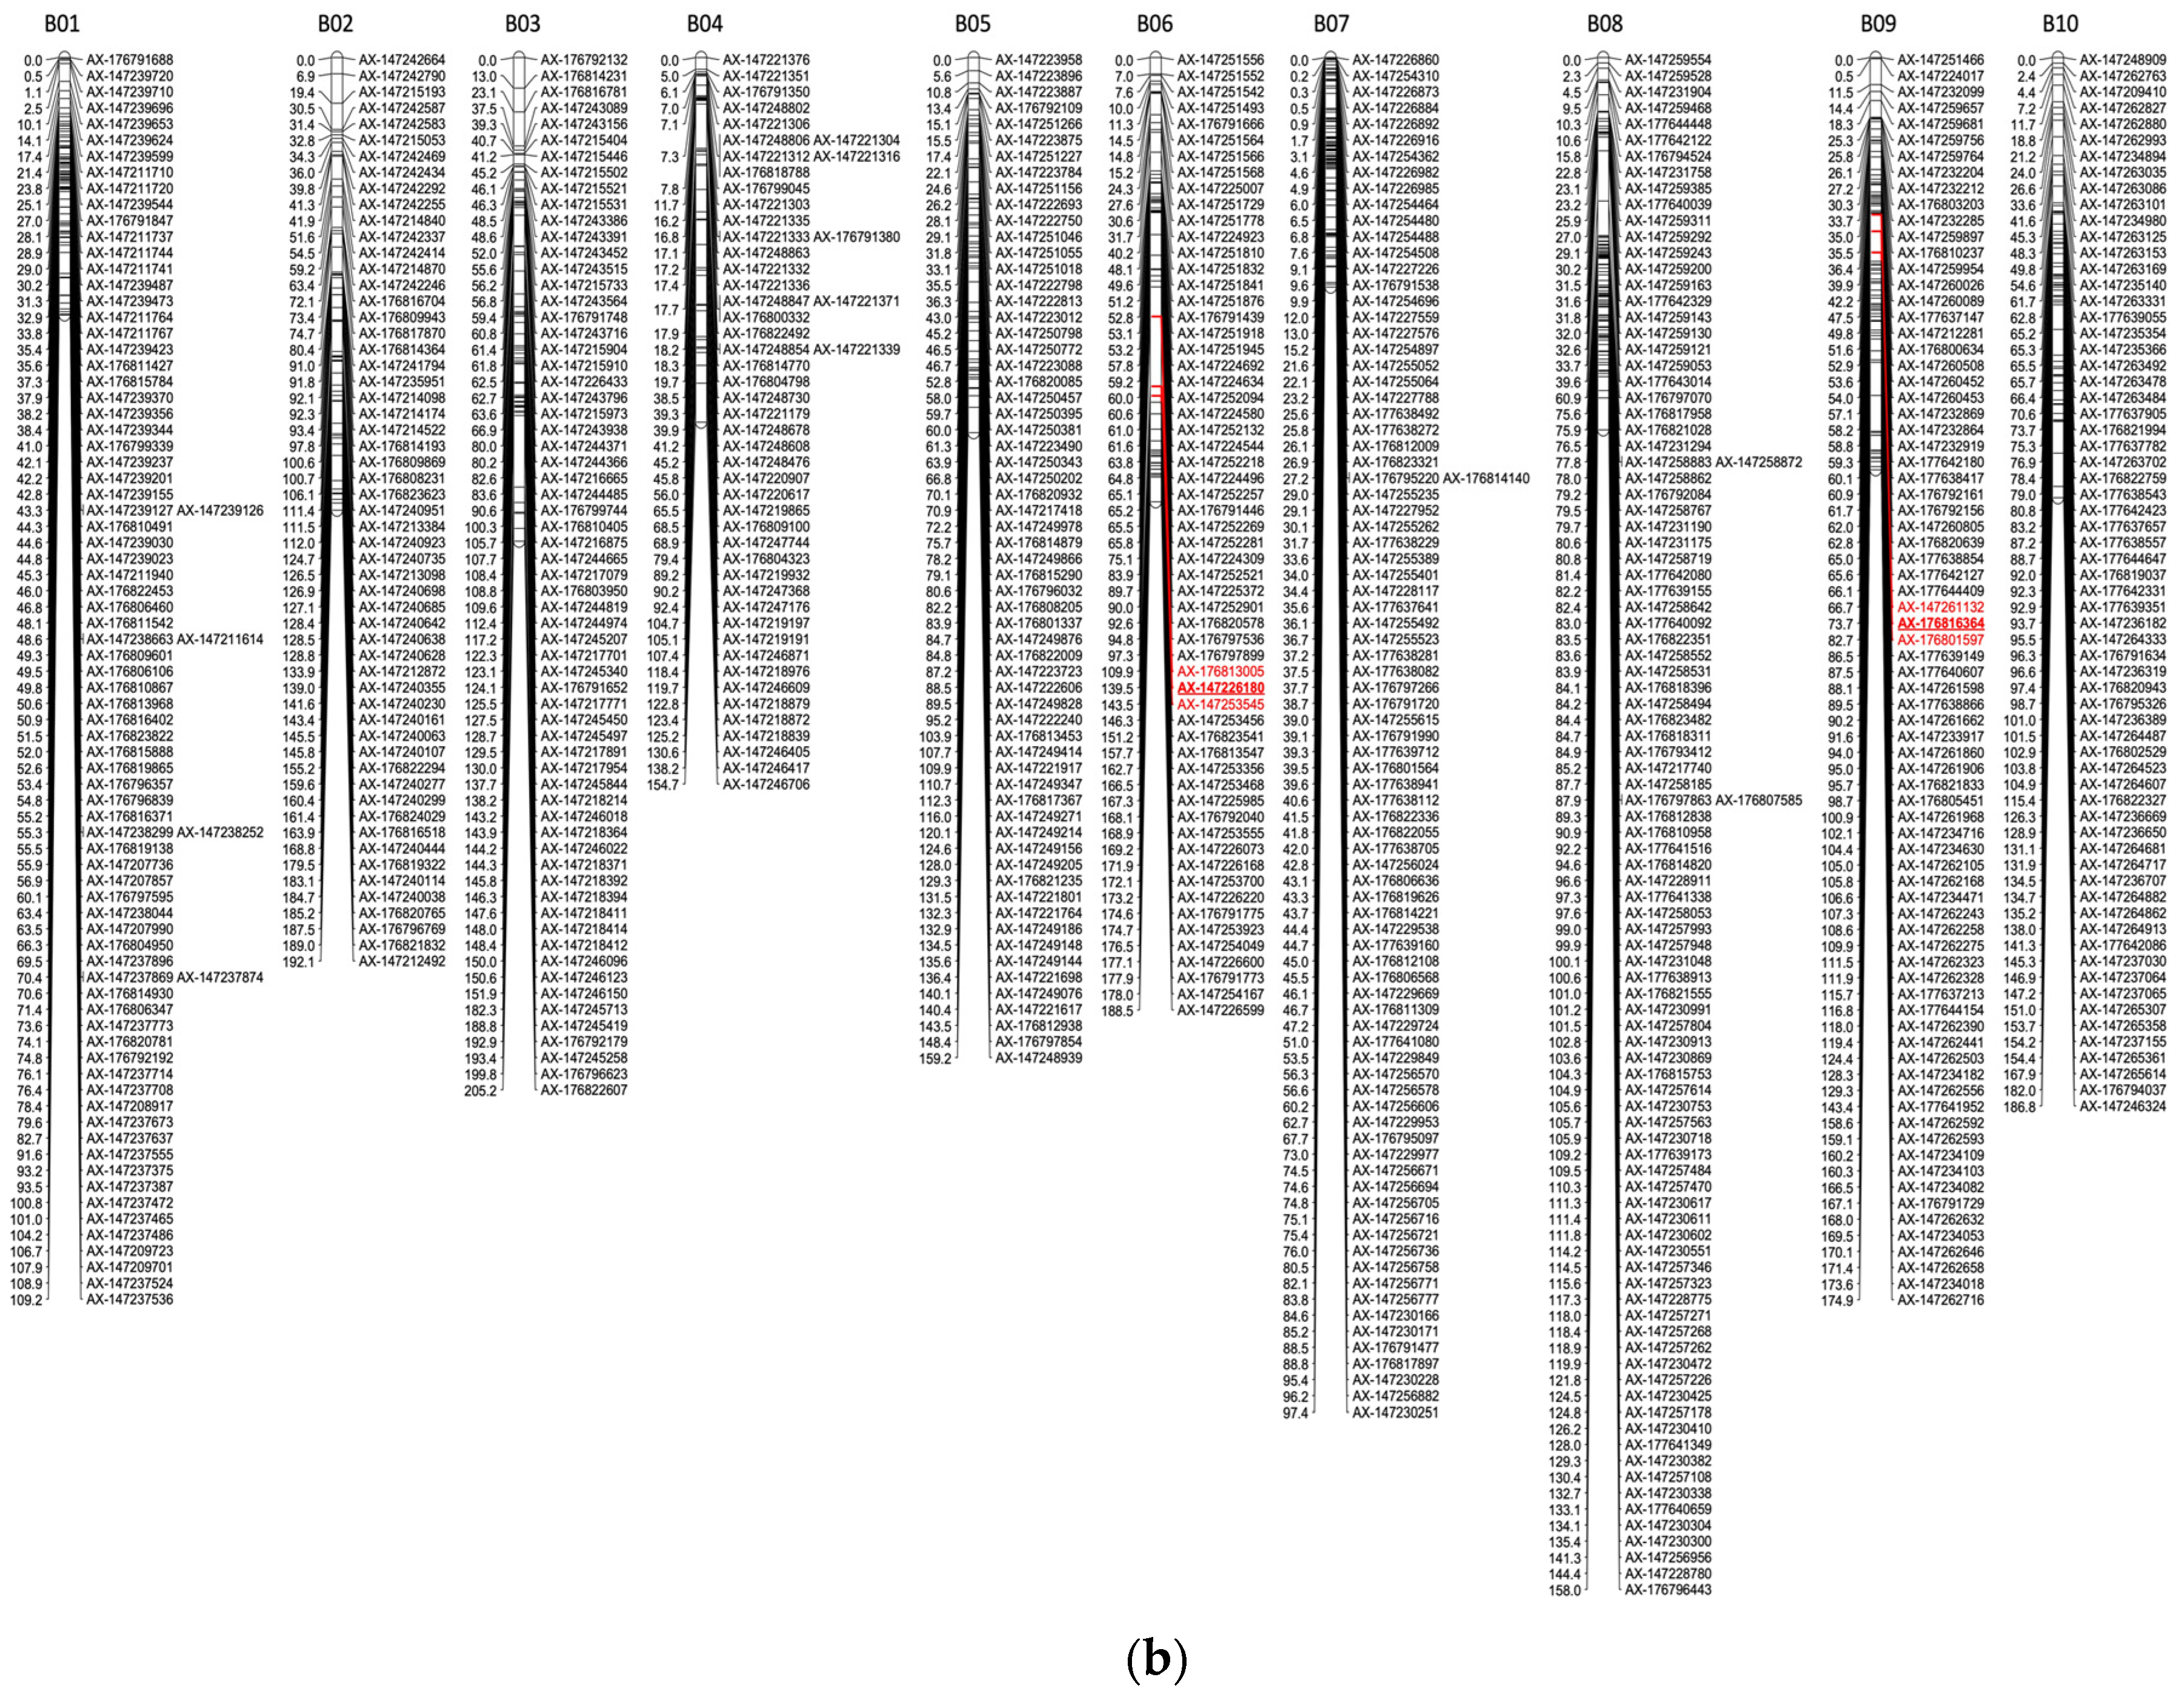
| LG a | No. of Mapped SNPs b | Map Length c | Average Distance c | Maximum Distance c |
|---|---|---|---|---|
| A01 | 214 | 181.25 | 0.85 | 14.46 |
| A02 | 110 | 239.23 | 2.17 | 20.02 |
| A03 | 73 | 201.25 | 2.76 | 14.69 |
| A04 | 30 | 173.73 | 5.79 | 15.97 |
| A05 | 74 | 130.70 | 1.77 | 15.74 |
| A06 | 118 | 284.70 | 2.41 | 19.83 |
| A07 | 122 | 213.28 | 1.75 | 19.97 |
| A08 | 171 | 157.17 | 0.92 | 14.03 |
| A09 | 136 | 132.75 | 0.98 | 7.90 |
| A10 | 116 | 162.76 | 1.40 | 9.69 |
| B01 | 82 | 109.20 | 1.33 | 8.91 |
| B02 | 57 | 192.06 | 3.37 | 12.70 |
| B03 | 65 | 205.21 | 3.16 | 30.40 |
| B04 | 51 | 154.71 | 3.03 | 18.83 |
| B05 | 63 | 159.16 | 2.53 | 10.76 |
| B06 | 60 | 188.52 | 3.14 | 29.58 |
| B07 | 86 | 97.42 | 1.13 | 6.58 |
| B08 | 98 | 158.05 | 1.61 | 21.33 |
| B09 | 78 | 174.89 | 2.24 | 15.16 |
| B10 | 66 | 186.78 | 2.83 | 14.10 |
| Subtotal | 1870 | 3502.82 | ||
| A03.2 | 56 | 353.45 | 6.31 | 20.40 |
| Total | 1926 | 3856.27 |
| QTL Name | LG a | Genetic Position b | Nearest Marker c (Position) | Physical Position of Nearest Markers d | LOD Interval e | LOD f | LOD Threshold g | PVE (%) h | % i | Effect on Disease Evaluation |
|---|---|---|---|---|---|---|---|---|---|---|
| qWm.A10.Mid * | A10 | 154 | AX-176791779 (156.87) | Aradu.A10 694,007 | 148.52–156.87 | 2.88 | 3.78 (1%), 2.86 (5%) | 0.02 | −8.60 | Lower disease @ midseason |
| qWm.A08.Final | A08 | 89.5 | AX-177637728 (89.49) | ambiguous | 87.60–90.92 | 2.60 | 4.2 (1%), 2.79 (5%) | 3.13 | −13.64 | Lower disease @ end of season |
| qWm.d.A06.Mid * | A06 | 153 | AX-147225650 (153.03) | Aradu.A06 82,779,126 | 150.51–155.08 | 3.16 | 3.55 (1%), 2.96 (5%) | 4.38 | 33.14 | Higher disease @ midseason |
| qWm.d.A06.Final * | A06 | 182 | AX-147225626 (181.53) | Aradu.A06 81,148,227 | 181.53–187.31 | 3.25 | 3.48 (1%), 2.88 (5%) | 4.70 | 26.69 | Higher disease @ end of season |
| qWm.d.B06.Final | B06 | 140 | AX-147226180 (139.53) | ambiguous | 109.95–143.48 | 2.37 | 3.46 (1%), 2.70 (5%) | 2.96 | 11.15 | |
| qWm.d.B09.Final | B09 | 73.7 | AX-176816364 (73.72) | ambiguous | 66.71–82.71 | 2.49 | 3.36 (1%), 2.7 (5%) | 3.50 | 22.16 |
Disclaimer/Publisher’s Note: The statements, opinions and data contained in all publications are solely those of the individual author(s) and contributor(s) and not of MDPI and/or the editor(s). MDPI and/or the editor(s) disclaim responsibility for any injury to people or property resulting from any ideas, methods, instructions or products referred to in the content. |
© 2024 by the authors. Licensee MDPI, Basel, Switzerland. This article is an open access article distributed under the terms and conditions of the Creative Commons Attribution (CC BY) license (https://creativecommons.org/licenses/by/4.0/).
Share and Cite
Tsai, Y.-C.; Brenneman, T.B.; Gao, D.; Chu, Y.; Lamon, S.; Bertioli, D.J.; Leal-Bertioli, S.C.M. The Identification of the Peanut Wild Relative Arachis stenosperma as a Source of Resistance to Stem Rot and Analyses of Genomic Regions Conferring Disease Resistance through QTL Mapping. Agronomy 2024, 14, 1442. https://doi.org/10.3390/agronomy14071442
Tsai Y-C, Brenneman TB, Gao D, Chu Y, Lamon S, Bertioli DJ, Leal-Bertioli SCM. The Identification of the Peanut Wild Relative Arachis stenosperma as a Source of Resistance to Stem Rot and Analyses of Genomic Regions Conferring Disease Resistance through QTL Mapping. Agronomy. 2024; 14(7):1442. https://doi.org/10.3390/agronomy14071442
Chicago/Turabian StyleTsai, Yun-Ching, Timothy B. Brenneman, Dongying Gao, Ye Chu, Samuele Lamon, David J. Bertioli, and Soraya C. M. Leal-Bertioli. 2024. "The Identification of the Peanut Wild Relative Arachis stenosperma as a Source of Resistance to Stem Rot and Analyses of Genomic Regions Conferring Disease Resistance through QTL Mapping" Agronomy 14, no. 7: 1442. https://doi.org/10.3390/agronomy14071442
APA StyleTsai, Y.-C., Brenneman, T. B., Gao, D., Chu, Y., Lamon, S., Bertioli, D. J., & Leal-Bertioli, S. C. M. (2024). The Identification of the Peanut Wild Relative Arachis stenosperma as a Source of Resistance to Stem Rot and Analyses of Genomic Regions Conferring Disease Resistance through QTL Mapping. Agronomy, 14(7), 1442. https://doi.org/10.3390/agronomy14071442