Article

Algorithm for Corn Crop Row Recognition during Different Growth Stages Based on ST-YOLOv8s Network

1
College of Electrical Information Engineering, Zhengzhou University of Light Industry, Zhengzhou 450002, China
2
College of Mechanical and Electronic Engineering, Northwest A&F University, Yangling 712100, China
3
School of Automation, Hangzhou Dianzi University, Hangzhou 310000, China
4
College of Artificial Intelligence, Nanjing Agricultural University, Nanjing 211800, China
*
Author to whom correspondence should be addressed.
Agronomy 2024, 14(7), 1466; https://doi.org/10.3390/agronomy14071466 (registering DOI)
Submission received: 30 May 2024 / Revised: 2 July 2024 / Accepted: 5 July 2024 / Published: 6 July 2024
(This article belongs to the Special Issue AI, Sensors and Robotics for Smart Agriculture—2nd Edition)

Abstract

:
Corn crop row recognition during different growth stages is a major difficulty faced by the current development of visual navigation technology for agricultural robots. In order to solve this problem, an algorithm for recognizing corn crop rows during different growth stages is presented based on the ST-YOLOv8s network. Firstly, a dataset of corn crop rows during different growth stages, including the seedling stage and mid-growth stage, is constructed in this paper; secondly, an improved YOLOv8s network, in which the backbone network is replaced by the swin transformer (ST), is proposed in this paper for detecting corn crop row segments; after that, an improved supergreen method is introduced in this paper, and the segmentation of crop rows and background within the detection frame is achieved utilizing the enhanced method; finally, the corn crop row lines are identified using the proposed local–global detection method, which detects the local crop rows first, and then detects the global crop rows. The corn crop row segment detection experiments show that the mean average precision (MAP) of the ST-YOLOv8s network during different growth stages increases by 7.34%, 11.92%, and 4.03% on average compared to the MAP of YOLOv5s, YOLOv7, and YOLOv8s networks, respectively, indicating that the ST-YOLOv8s network has a better crop row segment detection effect compared to the comparison networks. Corn crop row line detection experiments show that the accuracy of the local–global detection method proposed in this paper is improved by 17.38%, 10.47%, and 5.99%, respectively, compared with the accuracy of the comparison method; the average angle error is reduced by 3.78°, 1.61°, and 0.7°, respectively, compared with the average angle error of the comparison method; and the average fitting time is reduced by 5.30 ms, 18 ms, and 33.77 ms, respectively, compared with the average fitting time of the comparison method, indicating that the local–global detection method has a better crop row line detection effect compared to the comparison method. In summary, the corn crop row recognition algorithm proposed in this paper can well accomplish the task of corn crop row recognition during different growth stages and contribute to the development of crop row detection technology.

1. Introduction

Precision agriculture is an advanced concept in the field of modern agriculture, which makes agricultural production more refined and efficient with the help of high-tech means to realize the efficient use of resources and sustainable development of agriculture. In this process, agricultural robots play a pivotal role. Equipped with a variety of sensors and advanced algorithms, these intelligent robots can efficiently complete a variety of farmland operations, such as seeding, weeding, medication, fertilizer application, and harvesting [1]. Agricultural robots require precise guidance when working on farmland, and in this regard, the main technologies currently relied upon include the global navigation satellite system (GNSS), light detection and ranging (LiDAR), and computer vision. GNSS can provide agricultural robots with precise positional information to assist in localization and navigation. Table 1 summarizes the advantages and disadvantages of the three agricultural navigation methods, GNSS, LiDAR, and computer vision. In the selection of agricultural navigation technologies, GNSS provides robust support for agricultural operations with its high-precision positioning capabilities. However, it has limitations, such as signal interference under certain weather conditions or when obstructed by backgrounds, which can affect positioning accuracy. Additionally, high-precision receivers tend to have relatively high costs. LiDAR technology, on the other hand, exhibits unique advantages in complex terrain and obstacle detection through its non-contact high-precision measurement. Nonetheless, when faced with severe weather conditions, its ranging and imaging quality can be significantly impacted. In contrast, the advantages of computer vision technology in agricultural navigation are becoming increasingly apparent. It combines advanced image processing and recognition algorithms to analyze farmland images in real time, accurately monitoring crop growth, pest and disease situations, and soil conditions. Furthermore, computer vision technology possesses high flexibility and scalability, enabling integration with various devices such as drones and smart agricultural machinery for comprehensive and multi-angle agricultural monitoring [2,3,4].
With the advancement of deep learning, its rapid image processing capabilities, high accuracy, and robustness have gradually replaced traditional machine learning algorithms. Among these, object detection models such as the two-stage R-CNN model and the single-stage YOLO model [5,6], as well as semantic segmentation models like the UNet model [7], are widely utilized in the agricultural sector. This lays the foundation for deep learning-based visual navigation methods, fulfilling the needs of agricultural production. Secondly, because of their more efficient processing speed, deep learning models can process large amounts of image data quickly on high-performance computing devices. This enables deep learning-based visual navigation methods to realize real-time navigation and operations to meet the needs of agricultural production. Finally, they have a wider range of applications, because deep learning models can process various types of image data, including color images, grayscale images, and multispectral images. This allows deep learning-based visual navigation methods to be applied to various types of agricultural equipment, including tractors, harvesters, and plant protection machines. Deep learning technology has been developing rapidly in recent years, and it has also been widely used in the field of computer vision, while also promoting the rapid development of agricultural robot navigation technology.
Researchers at home and abroad have conducted a large amount of research in the field of agricultural robot navigation based on deep learning, and some of the research results are shown in Table 2. In order to extract the navigation lines in different field scenes, Yu et al. [8] compared several semantic segmentation networks, and finally chose the ENet network, which has higher speed and accuracy, to segment the field roads, and at the same time, utilized the improved polygon fitting method to extract the navigation lines. Although the accuracy of the extracted navigation lines was high, the datasets of the above studies were collected in experimental greenhouses, and have not been verified for their effectiveness in a real and complex farmland environment. In order to overcome the influence of rice plant morphological differences on rice row detection, Li et al. [9] firstly segmented the rice stalks using a transformer-based semantic segmentation network, secondly used the triangulation method to locate the anchors of the rice crop rows, then used the improved clustering algorithm to cluster the anchors of the rice crop rows, and finally detected the rice crop row lines by using the least squares method. In order to detect the boundary lines of farmland in different environments, He et al. [10] used a combination of an improved UNet network and improved multi-boundary line detection algorithm to detect the boundary lines of farmland areas. In order to detect curved rice crop rows, Liu et al. [11] finally chose to use single-stage network MobileNet-SSD to detect rice plants through comparative experiments, used the midpoint of the detection frame to locate the feature points of rice crop rows, and finally used the least squares method to detect rice crop rows. In order to detect corn seedlings in different growth stages and in complex farmland environments, Quan et al. [12] finally chose to replace the backbone network of the two-stage target detection network Faster-RCNN with VGG19 through comparative experiments, so as to realize the accurate identification of corn seedlings. In order to be able to detect corn crop rows in real time, Yang et al. [13] first used YOLOv5 network to detect the corn crop row segments, after grayscaling and binarization of the crop rows in the detection frame, next used FAST corner point detection technique to locate the crop row feature points, and finally used least squares method to detect the corn crop row lines. In order to accurately recognize crops and weeds, Jiang et al. [14] combined the proposed graph convolutional network with ResNet-101 network, thus realizing the accurate recognition of crops and weeds. In order to detect corn crop rows in complex farmland environments, Diao et al. [15] combined the spatial pyramid pooling structure ASPP with the UNet network for more accurate segmentation of crop rows and backgrounds; the improved vertical projection method was then used to locate the crop row feature points, and finally the least squares method was used to detect corn crop row lines. Zhang et al. [16] first used the improved YOLOv3 network to detect rice crop row segments, then clustered and grayscaled the detection frames, used the SUSAN corner detection algorithm to locate the crop row feature points, and finally used the least squares method to detect the rice crop rows. Yang et al. [17] first used the modified UNet network to segment the crop rows, then used the left and right edge centerline method to locate the feature points of the crop rows and performed a clustering operation on the feature points, and finally used the least squares method to detect the crop row lines. In order to detect crop rows in complex farmland environments, Hu et al. [18] first detected crop row segments using the improved YOLOv4 network, then performed clustering operations on the detection frames and localized the crop row feature points using the mean value method, and finally detected the crop row lines using the least squares method. Bah et al. [19] first segmented the crop rows using the improved SegNet network, and then detected the crop row lines using the Hough transform. In order to reduce the impact of a complex paddy field environment on rice crop row detection, Wang et al. [20] first used the improved YOLOv5 network to detect rice crop row segments, and then used the improved centerline recognition algorithm to detect rice crop rows. Although all of the above deep learning-based navigation line recognition algorithms for agricultural robots can better recognize crop row lines, the experimental conditions of the algorithms are relatively homogeneous, and their effectiveness in detecting crop rows at different growth stages has not been verified.
In order to solve the above problems, an algorithm for recognizing corn crop rows during different growth stages is proposed in this paper, based on the ST-YOLOv8s network. Firstly, a dataset of corn crop rows during different growth stages is constructed in this paper; secondly, the improved YOLOv8s network is utilized to detect the corn crop row segments: then the crop rows and the backgrounds in the detection frame are segmented using the improved supergreen method; and finally, the corn crop row lines are detected using the proposed local–global detection method.

2. Materials and Methods

The main steps of the proposed algorithm in this paper are shown in Figure 1. Firstly, the dataset of corn crop rows during different growth stages is constructed; secondly, corn crop row segments are detected using the improved YOLOv8s network; after that, crop rows and backgrounds in the detection frame are segmented using the improved supergreen method; finally, corn crop rows are identified using the proposed local–global detection method, which detects the local crop rows first, and then detects the global crop rows.

2.1. Dataset Construction

With the rapid development of deep learning in computer vision, a variety of datasets for the field of image processing have been published on the Internet, including PASCAL VOC, MS-COCO, and ImageNet. However, these current public datasets do not contain the type of corn crop rows, so it was necessary to construct a corn crop row dataset in this study [21,22,23]. For this study, using the Canon EOS 2000D digital camera and iPhone 15 as examples, images were captured in Henan Province, resulting in a total of 10,000 original images being collected. In research based on corn plant leaf development stages, V0, V1 … Vn are commonly used to precisely distinguish the growth stages of corn. In our dataset, the images collected cover the seedling stage from V4 (when the fourth true leaf is fully expanded) to V6 (when the sixth true leaf is fully expanded), as well as the mid-growth stage from V8 (when the eighth true leaf is fully expanded) to V12 (when the twelfth true leaf is fully expanded). The specific number of corn images collected during different growth stages is shown in Table 3.
The quality of labeled images directly affects the training results of the network, and in the training process of the network, high-quality labels tend to result in more accurate models [24,25]. The preprocessed images of corn crop rows were labeled using the labeling tool labelimg. Because it is not easy to label a single corn plant in corn crop rows, in this study, the corn crop row segments were chosen as the labeling object. During model training, if the number of datasets is small, it will cause the overfitting phenomenon, which seriously affects the accuracy of model training [26,27,28]. In order to solve the above problem, this study first divided the dataset into a training set, validation set, and test set according to the ratio of 4:1:1, and before the model training, this study adopted the operations of panning, rotating, mirroring, and cropping to enhance the data of the training set. In order to demonstrate the diversity and completeness of the dataset, rows of corn crops at different growth stages were selected in the test set, covering the corn seedling stage and the mid-growth stage, as shown in Figure 2.

2.2. Model Construction

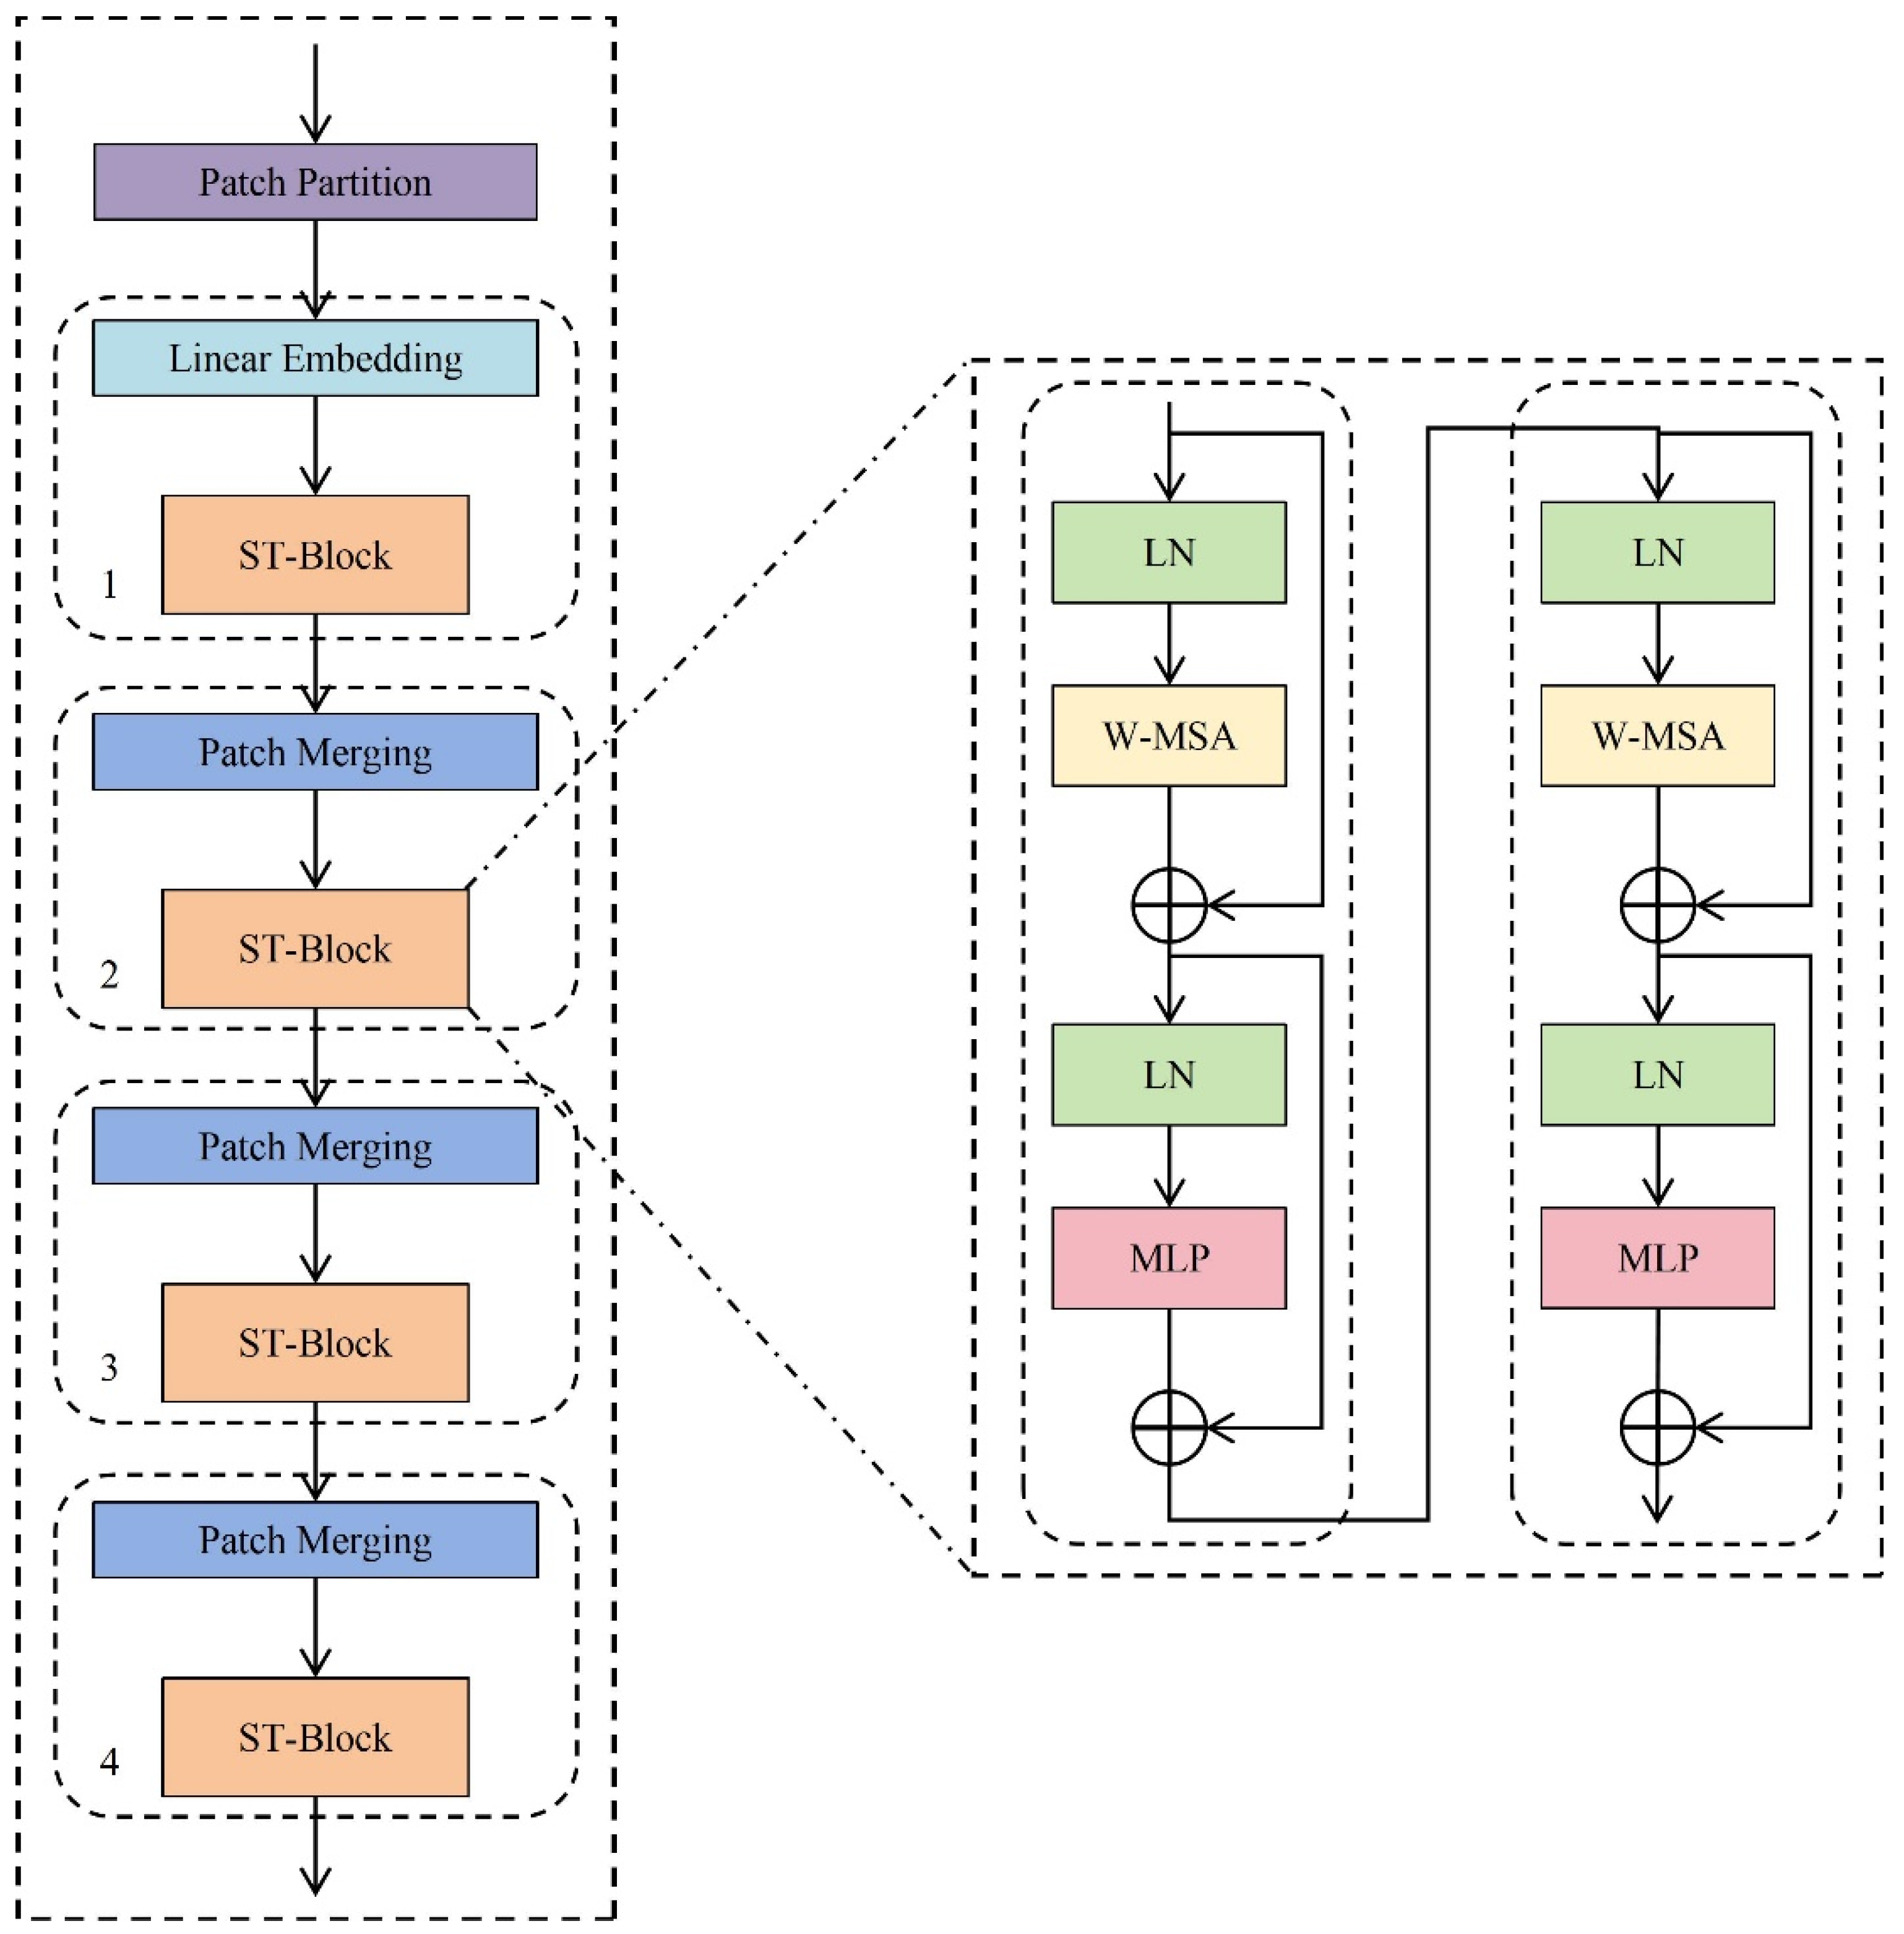
2.2.1. Swin Transformer Model Construction

Liu et al. [29] proposed the swin transformer (ST) network in 2021, which outperforms most of the current backbone networks such as the date-efficient image transformer (DeiT) [30], vision transformer (ViT) [31], and efficientNet [32], and has replaced the classical CNN network as a generalized backbone in the field of computer vision at this stage. The structure of the ST network is shown in Figure 3, and the whole network adopts a layered design, containing four layers in total. Except for the first layer, the layers first reduce the resolution of the input feature maps through the Patch Merging layer, and at the same time perform the downsampling operation, expanding the sensory field layer-by-layer, as in CNN networks, in order to obtain the global information. The ST-Block layer is mainly composed of layernorm (LN), window multi-head self-attention (W-MSA), shifted window multi-head self-attention (SW-MSA), and multilayer perceptron (MLP). All traditional transformer networks use the global attention mechanism, which gives the network a high computational complexity, whereas the ST network uses window-based attention mechanisms (W-MSA and SW-MSA), which reduces the computational complexity of the network by restricting the computation of attention to each window.

2.2.2. ST-YOLOv8s Model Construction

Redmon et al. [33] proposed the first generation of the You Only Look Once (YOLO) model in 2015. Since then, researchers in this field have been updating and iterating the YOLO model, and the YOLO series of models has become more and more powerful. The commonly used YOLO networks are YOLOv5, YOLOv7, and YOLOv8. The YOLOv8 network is very similar to the YOLOv5 network in that it provides different scale models such as n, s, m, l, and x. The main difference is the number of feature extraction modules and the number of convolutional kernels included at specific locations in the network to meet the needs of different scenarios. YOLOv8, as the most dominant target detection network, has a better performance compared to the YOLOv5 and YOLOv7 networks. The YOLOv8s network is the target of this paper.
The structure of the YOLOv8s network is mainly divided into 3 parts, i.e., the backbone, neck, and head. Each of these three modules plays a different role: the backbone module mainly performs feature extraction on the input image, the neck module mainly performs feature fusion on the extracted features, and the head module mainly detects the fused features and outputs the final detection results.
In this study, the original backbone module of the YOLOv8s network was replaced with the ST network used to detect corn crop row segments more efficiently and accurately, and at the same time, the improved YOLOv8s network was named ST-YOLOv8s. The structure of the ST-YOLOv8s network is shown in Figure 4.

2.3. Improved Supergreen Method

The supergreen method is a commonly used image preprocessing method. In order to effectively separate the crop rows from the background in the detection frame, this paper improves the traditional supergreen method, which is improved as shown in Equation (1), where G(x,y) is the gray value at pixel point (x,y), and R, G, and B are the three color components at pixel point (x,y).
G ( x , y ) = 1.9 G R B G > R   o r   G > B 0 e l s e
The segmentation process and results are depicted in Figure 5. Initially, the image area within the detection frame is segmented, and subsequently, an improved supergreen method is employed to separate the crop rows from the background. Upon comparing the results with those processed by the original supergreen method, it is readily apparent that the improved supergreen method has significantly enhanced the discrimination between the corn crop rows and their surrounding environment, thereby ensuring the accuracy and clarity of the segmentation outcomes.

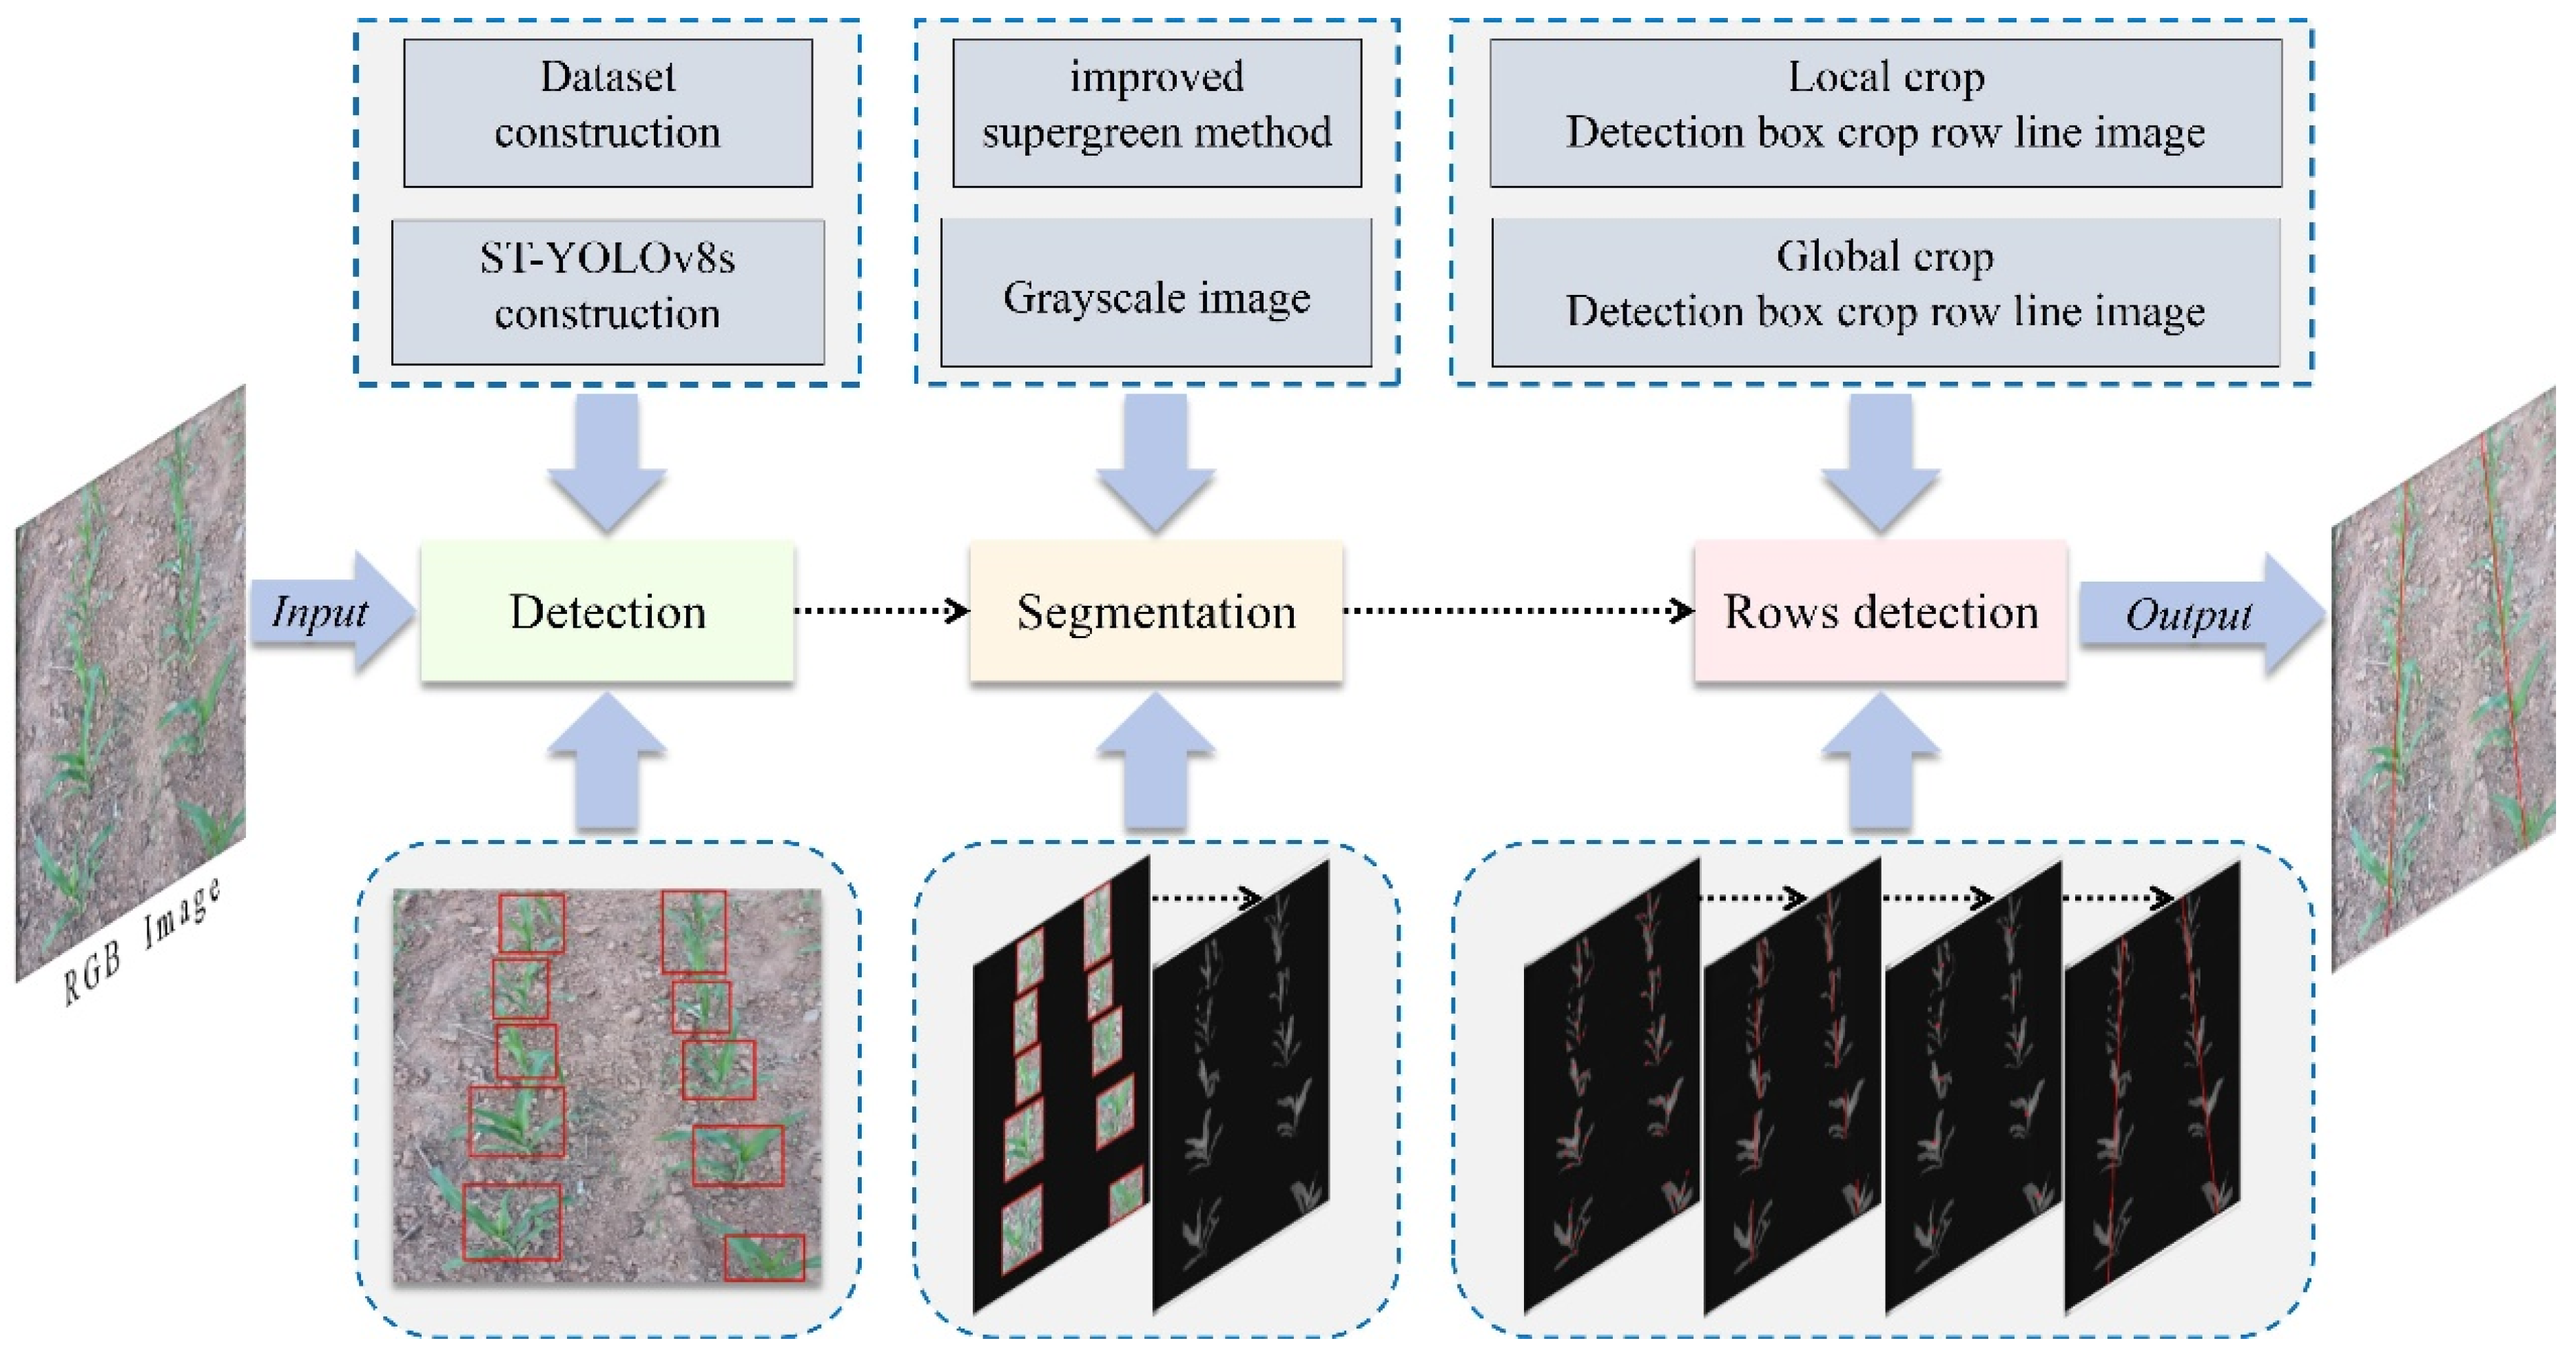
2.4. Local–Global Detection Method

In order to detect the corn crop rows during different growth stages, a new crop row detection algorithm (the local–global detection method) is proposed in this paper, as shown in Figure 6. The algorithm first detects local crop rows, and then detects global crop rows. The red dots and lines indicate the algorithmic processing.
Local crop line detection refers to the detection of crop lines in the detection frame, while global crop line detection refers to the detection of the entire crop line. The steps of the local global detection method are as follows:
(a)
Firstly, on the basis of the crop row segmentation results, the left and right edge centerline method is used to locate the local crop row feature points; the coordinates of the feature points of the local crop rows are (xk,yk), and xk is defined as shown in Equation (2), where, xi, xj are the horizontal coordinates of the intersection point of the centerline of each horizontal strip and the edge of the crop row. The intersection point is determined by the change in the gray value; when the centerline crosses the edge of the crop row, the gray value will change from 0 to 1.9G-R-B or from 1.9G-R-B to 0, and at this time the edge point is the intersection point. yk represents the vertical coordinates of the intersection point of the centerline of each horizontal strip and the edge of the crop row.
x k = x i + x j 2
(b)
Secondly, the local crop row centerline is fitted using the least squares method.
(c)
After that, this paper uses the local crop row line detection results to locate the global crop row feature point. The global crop row feature point coordinates are (xg,yg), where xg, yg are defined as shown in Equations (3) and (4), respectively, xe, xf are the horizontal coordinates of the endpoints of the local crop row line, and ye, yf are the vertical coordinates of the endpoints of the local crop row line.
x g = x e + x f 2
y g = y e + y f 2
(d)
Finally, the global crop row centerline is fitted using the least squares method.

3. Results and Discussion

3.1. Experimental Platform

The experimental platform for this study is shown in Table 4, and included a 64-bit Windows 10 operating system, an Intel(R) Xeon(R) CPU E5-2678 v3 @ 2.50 GHz processor, and an NVIDIA GeForce RTX 3080 Ti graphics card. The programming platform was PyCharm 2021.3, the programming language was Python 3.8, the deep learning framework was Pytorch 1.10, and CUDA was used to accelerate this experiment. Meanwhile, the models all used uniform hyperparameters in the training phase, in which the optimizer was stochastic gradient descent (SGD), the initial learning rate was 0.01, the weight decay was 0.0005, and the number of training rounds was 300 epochs.

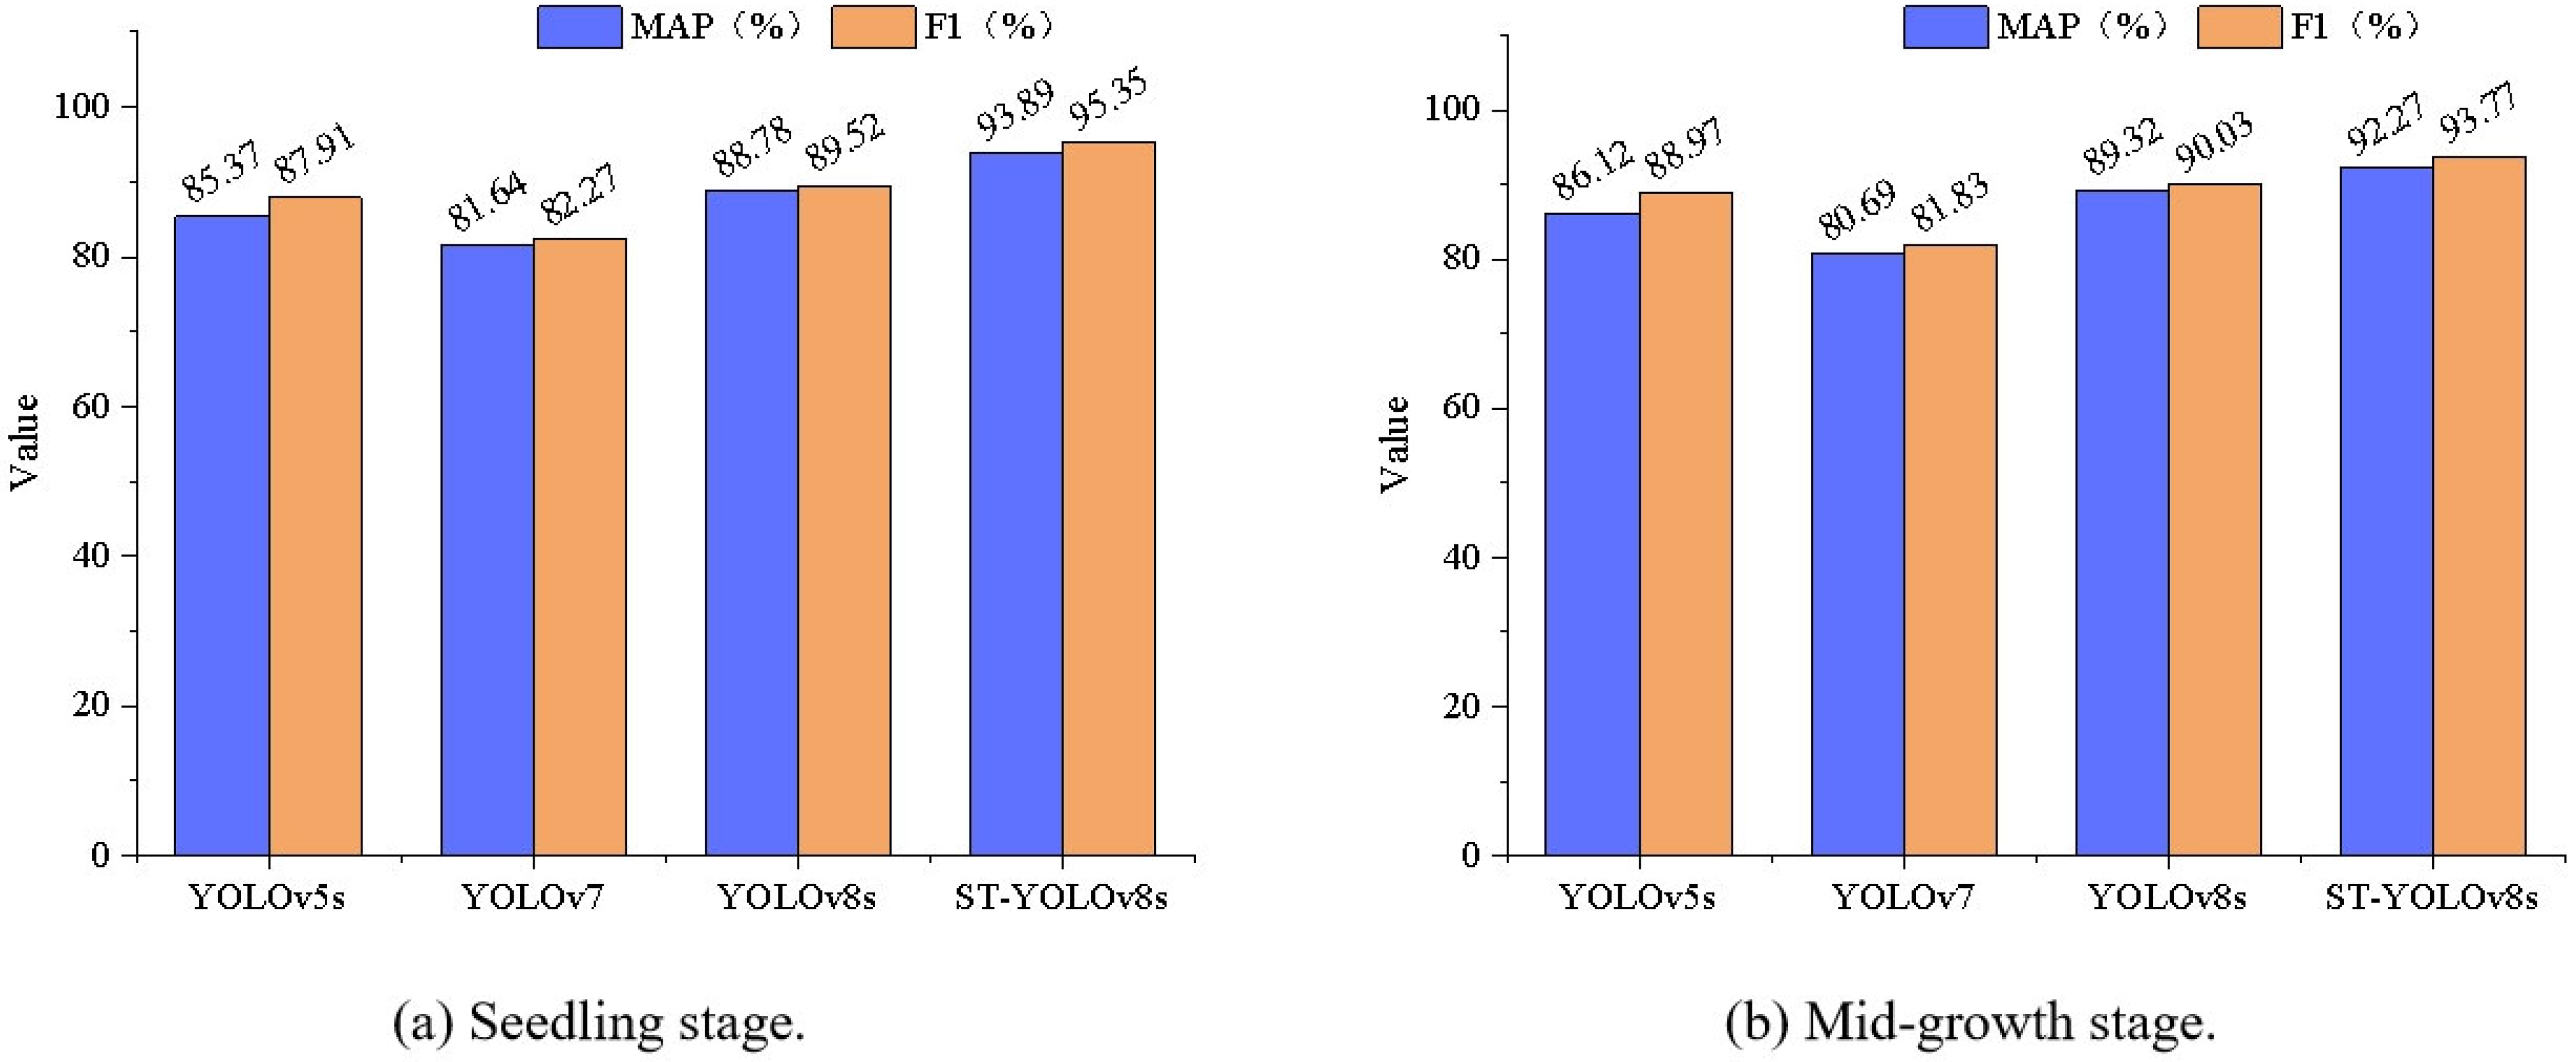
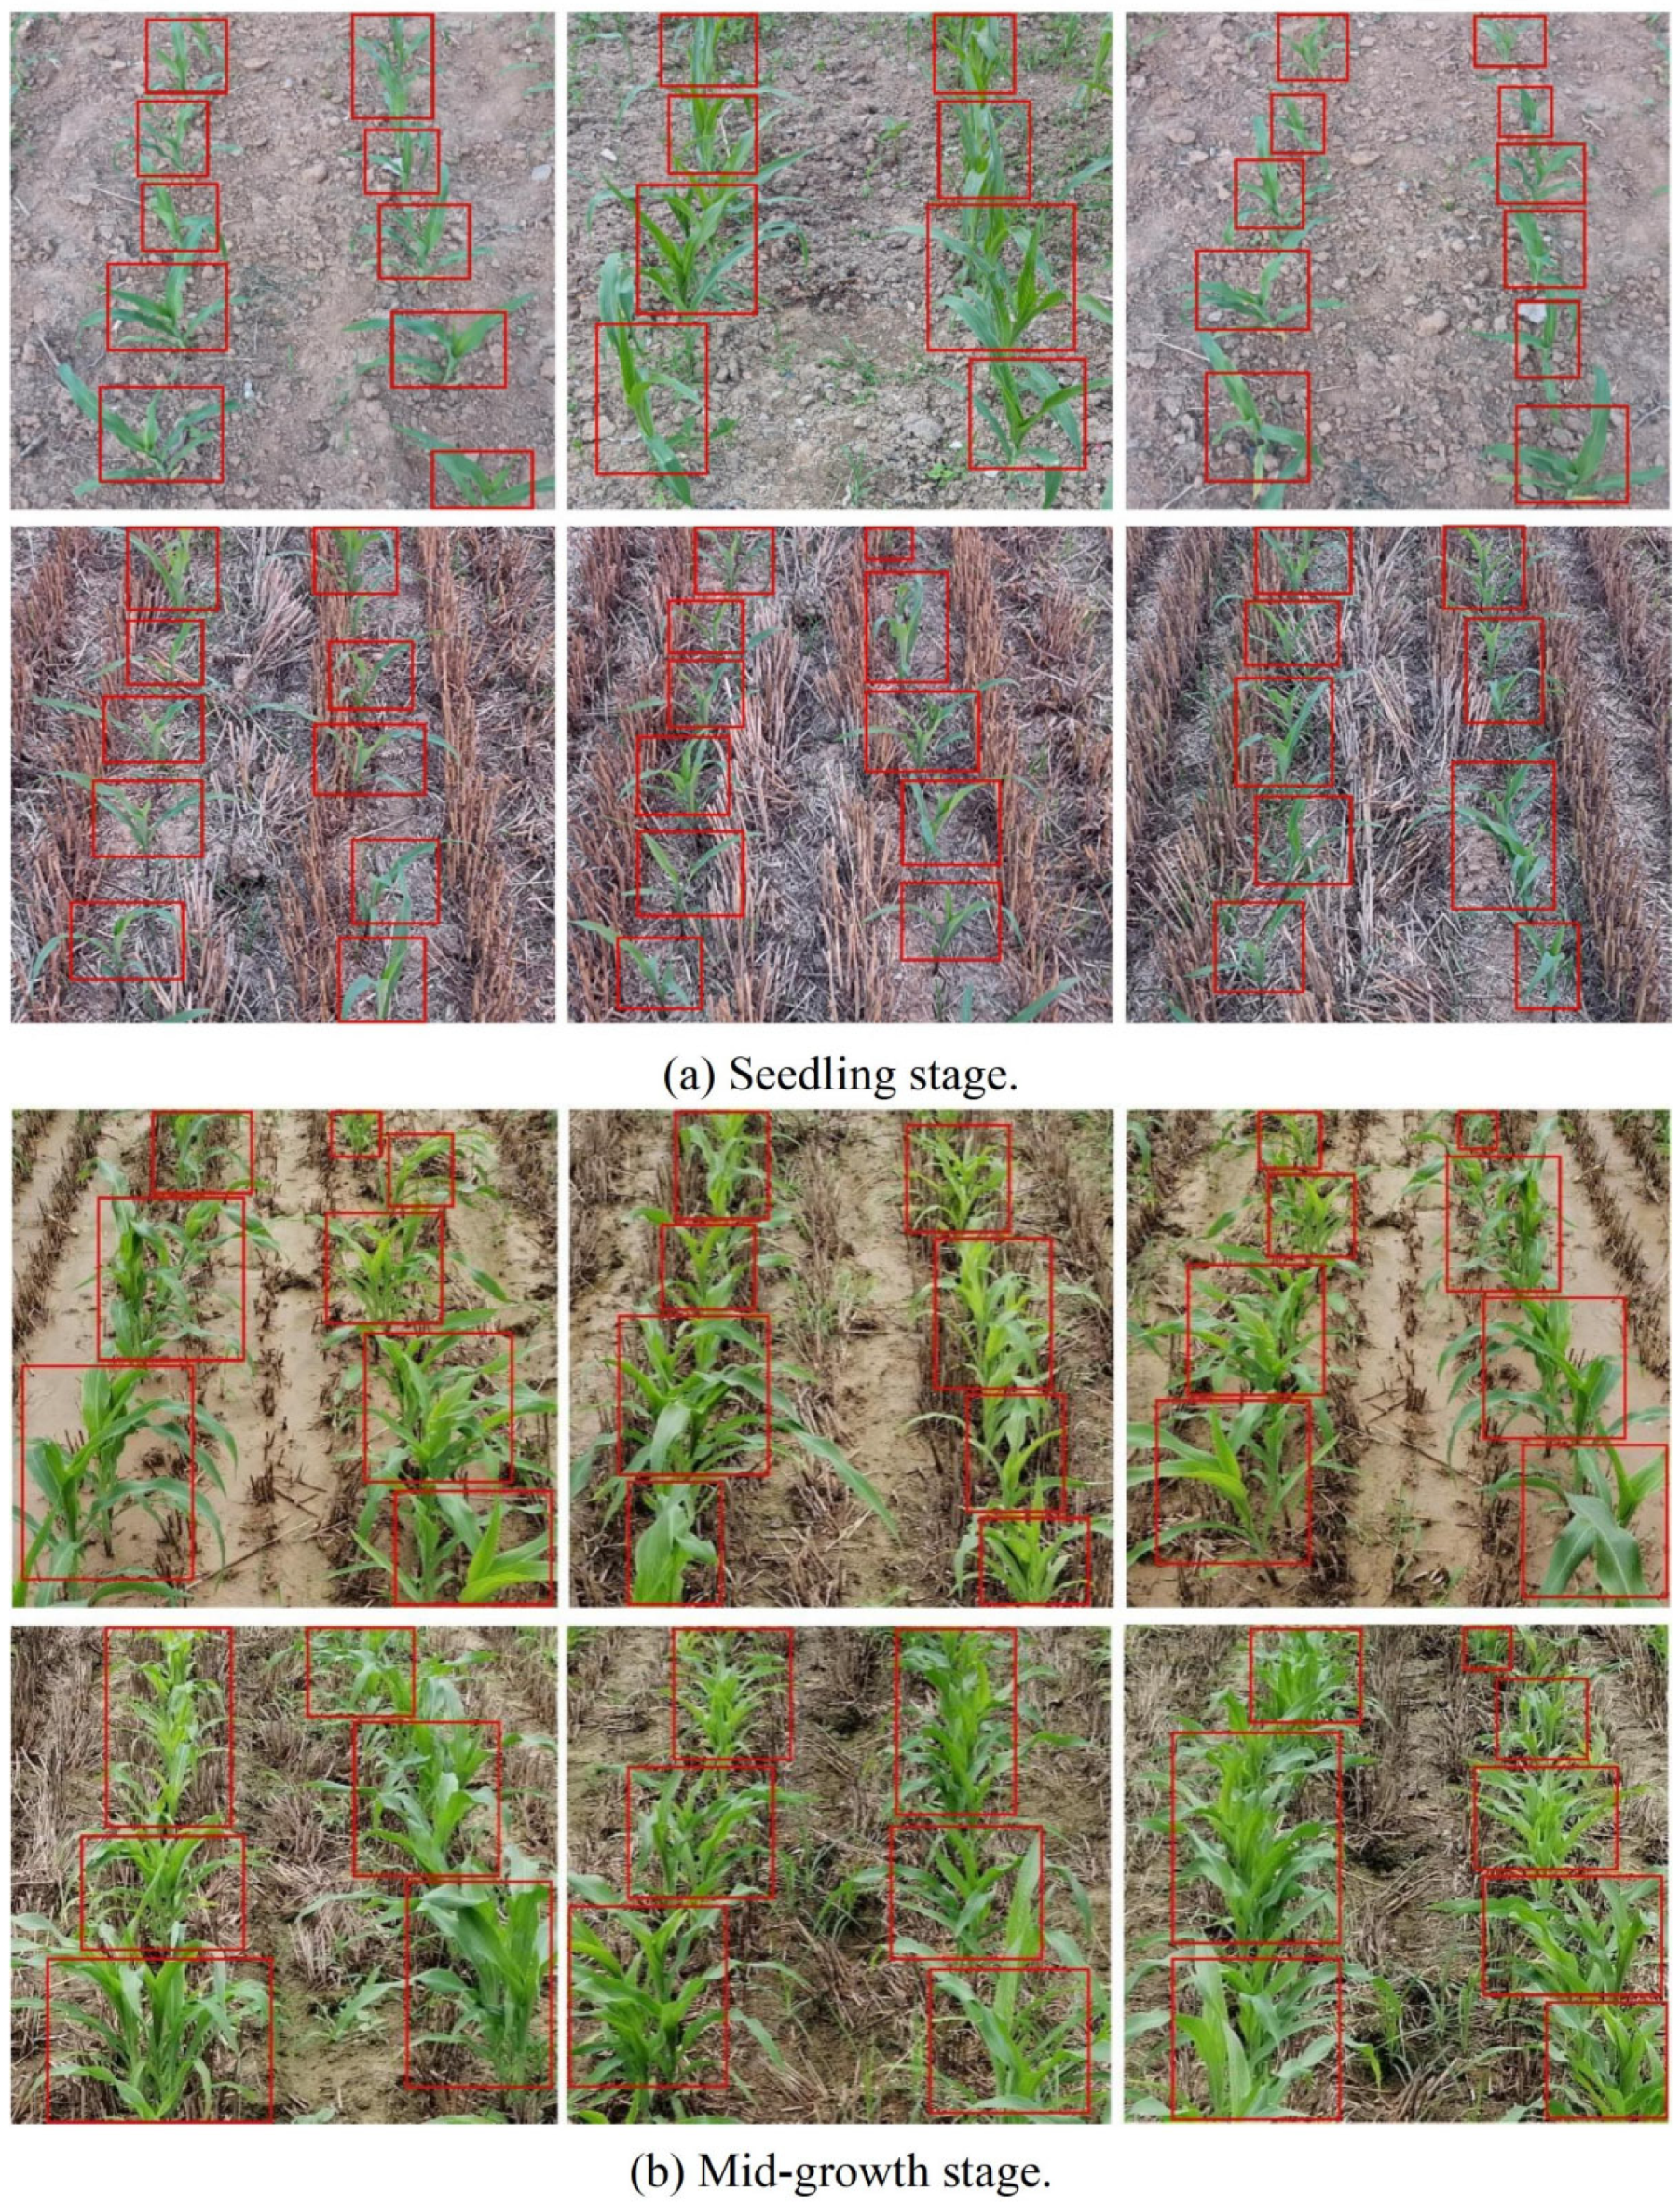
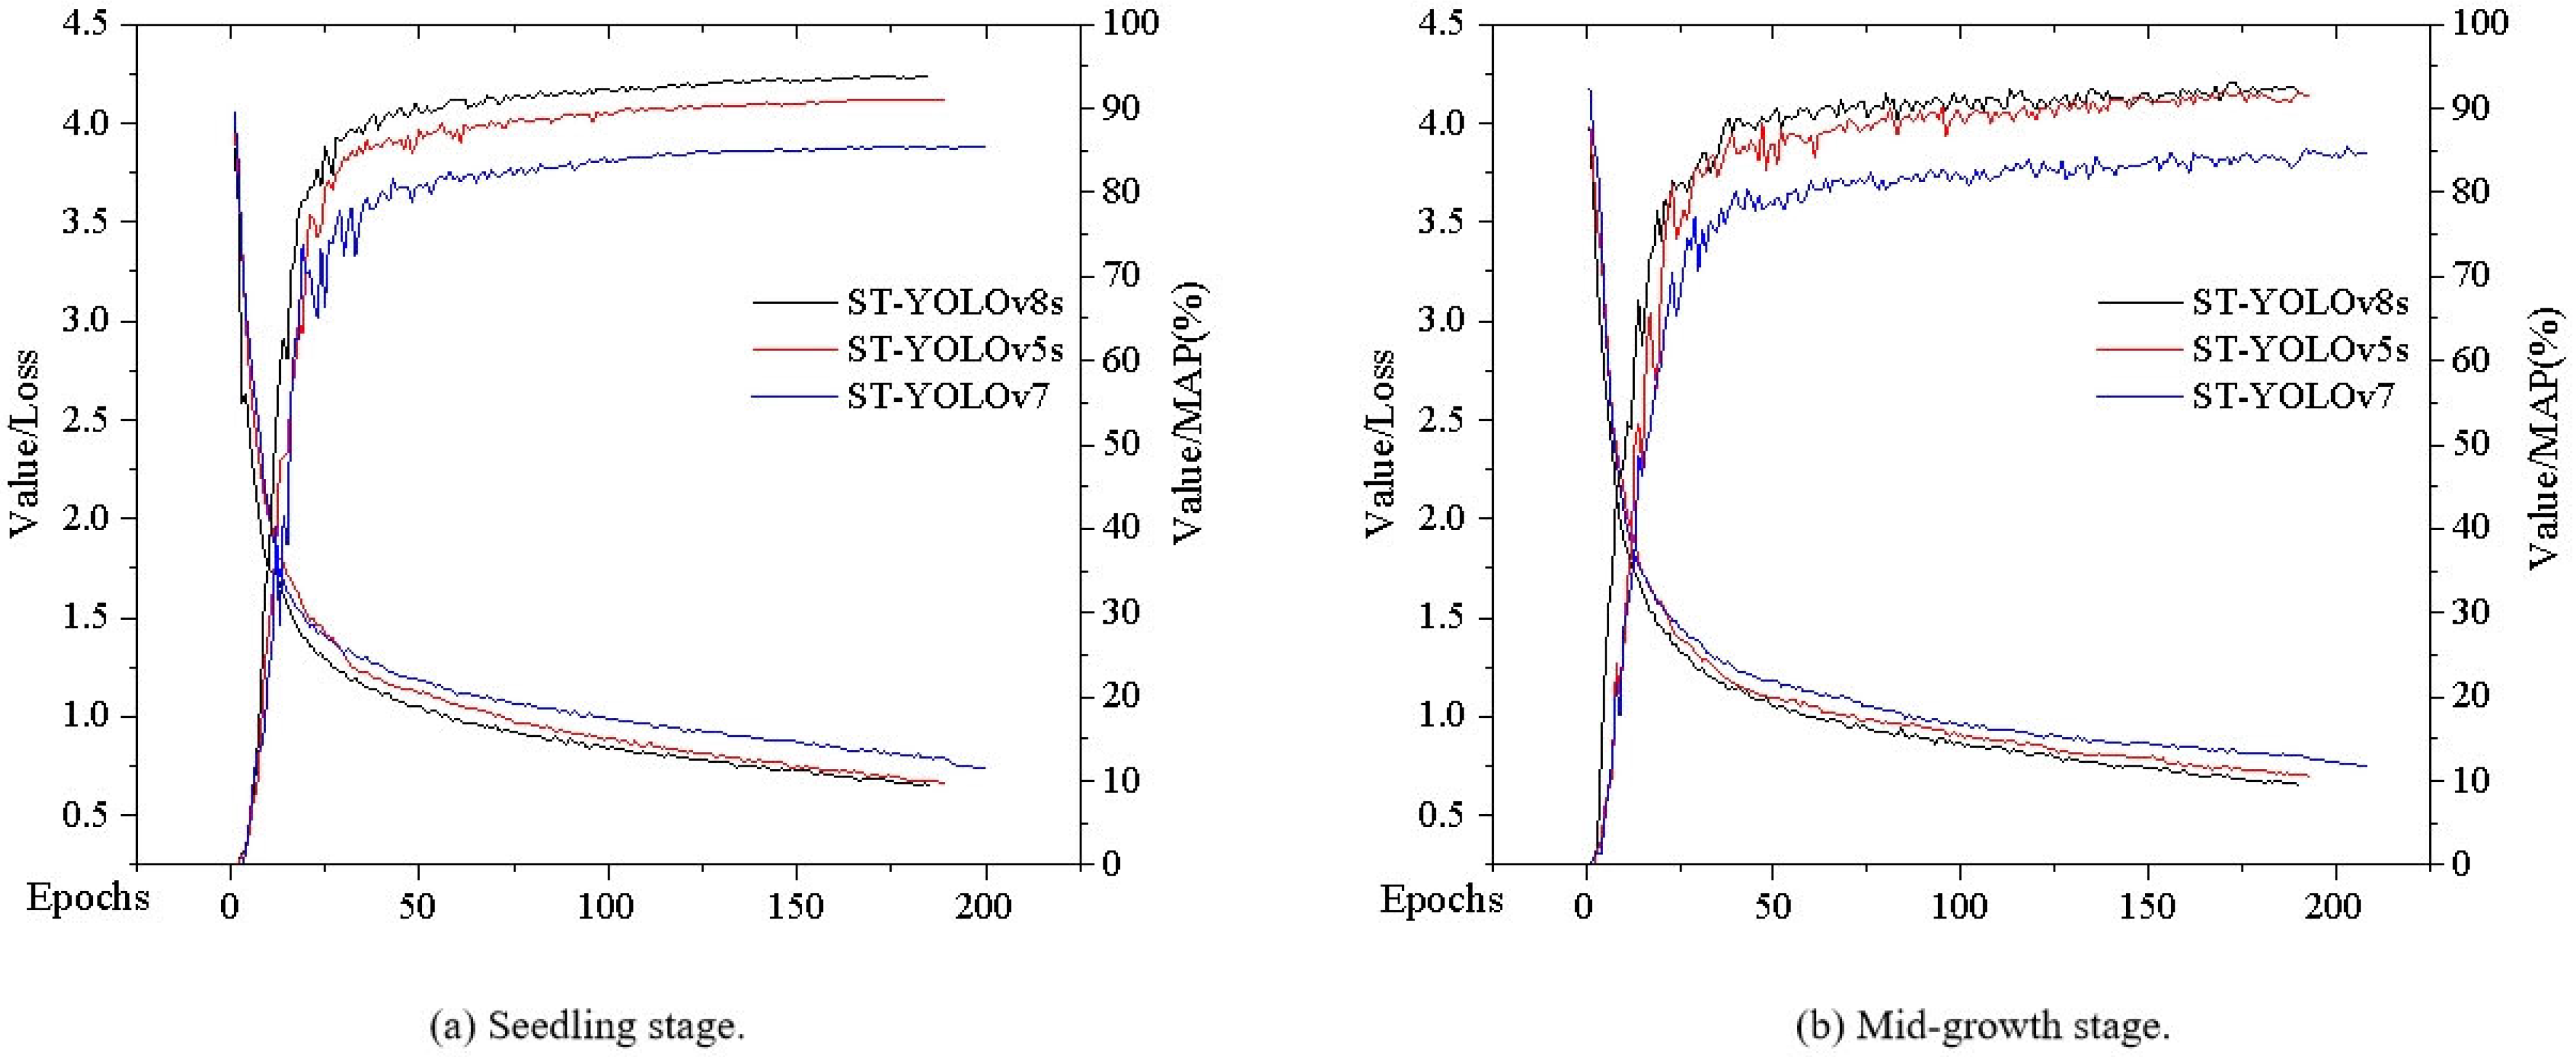
3.2. Crop Row Segment Detection Experiment

In evaluating the performance of object detection networks, mean average precision (MAP) and F1 score were selected as key evaluation metrics. The calculation processes of MAP and F1 score are presented in Formulas (5) and (6), respectively. Here, I represents the category index and n stands for the total number of categories. Precision (P) reflects the proportion of true positives among the samples predicted as positive by the model, and its calculation is shown in Formula (7). Recall (R) reflects the proportion of all true positives that are correctly predicted by the model, and its calculation is demonstrated in Formula (8). Specifically, TP (true positive) indicates the number of samples that are predicted as positive and have actual positive labels. FP (false positive) refers to the number of samples that are wrongly predicted as positive but are actually negative, which is known as a false alarm. FN (false negative), conversely, represents the number of actual positive samples that the model fails to detect, which is referred to as a missed detection. Therefore, comparing the MAP and F1 score serves as a robust means to evaluate the performance of a model, where higher values of MAP and F1 score indicate superior performance.
M A P = 1 n i = 1 n A P i   ,   A P = 0 1 P ( R ) d R
F 1 = 2 P R P + R × 100 %
P = T P T P + F P × 100 %
R = T P T P + F N × 100 %
The YOLOv5s, YOLOv7, YOLOv8s, and ST-YOLOv8s networks were used to detect the corn crop row segments during the seedling stage. The test results were also evaluated and the results of the above four networks for the corn seedling stage are shown in Figure 7.
From the data in Figure 7a, it can be seen that the ST-YOLOv8s network has the best detection accuracy for corn crop row segments during the corn seedling stage, with a MAP value of 93.89%. The MAP of the ST-YOLOv8s network increased by 8.52%, 12.25%, and 5.11% compared to the MAP of YOLOv5s, YOLOv7, and YOLOv8s networks, respectively. As can be seen from the data in Figure 7b, the ST-YOLOv8s network had the best detection accuracy for corn crop row segments in the mid-growth stage, with a MAP value of 92.27%. The MAP of the ST-YOLOv8s network increased by 6.15%, 11.58%, and 2.95% compared to the MAP of YOLOv5s, YOLOv7, and YOLOv8s networks, respectively. In summary, the ST-YOLOv8s network maintained the highest detection accuracy relative to the comparison network at both seedling and mid-growth stages of corn, and the MAP of the ST-YOLOv8s network increased by an average of 7.34%, 11.92%, and 4.03% at different growth stages compared to that of the YOLOv5s, YOLOv7, and YOLOv8s networks, respectively. Figure 8 demonstrates the exceptional performance of the ST-YOLOv8s network in detecting corn crop rows at different growth stages. Whether during the seedling stage or the mid-growth phase, the ST-YOLOv8s network is able to detect accurately.
In order to further verify the effectiveness of ST-YOLOv8s network for detecting corn crop row segments at different growth stages, in this study, the backbone of both the YOLOv5s and YOLOv7 networks was replaced with the ST network, and at the same time, the improved networks were named as the ST-YOLOv5s network and ST-YOLOv7 network, respectively. The corn crop row segment detection accuracy of the ST-YOLOv5s network, ST-YOLOv7 network, and ST-YOLOv8s network in different growth stages is shown in Table 5.
From the data in Table 5, it can be seen that the ST-YOLOv8s network performs best in both the seedling stage and the mid-growth stage of corn. The MAP of the ST-YOLOv8s network in the seedling stage of corn is 93.89%, which is an increase of 2.76% and 8.53% compared to the MAP of the ST-YOLOv5s network and the ST-YOLOv7 network, respectively. Meanwhile, the MAP of the ST-YOLOv8s network in the mid-growth stage of corn was 92.27%, which was enhanced by 0.49% and 7.5% compared to the MAP of the ST-YOLOv5s network and the ST-YOLOv7 network, respectively.
To comprehensively showcase the performance of the ST-YOLOv8s network during the training process, comparative experiments were designed against the ST-YOLOv5s and ST-YOLOv7 networks, utilizing the Train/box_loss curve and MAP curve as evaluation metrics. The training effectiveness of these three networks in object detection tasks targeting early-stage and mid-stage corn is illustrated in Figure 9. Notably, the loss curve experiences a steep decline within the initial 50 training epochs, subsequently stabilizing, demonstrating the robust learning capabilities of these networks. Concurrently, the MAP curve also rises rapidly during this training period, gradually converging to a higher level. By contrasting the evolutionary trajectories of these three curves, it is evident that the ST-YOLOv8s network consistently surpasses both the ST-YOLOv5s and ST-YOLOv7 networks throughout the entire training process. This provides further validation of its efficiency and accuracy in the task of identifying corn crop rows.

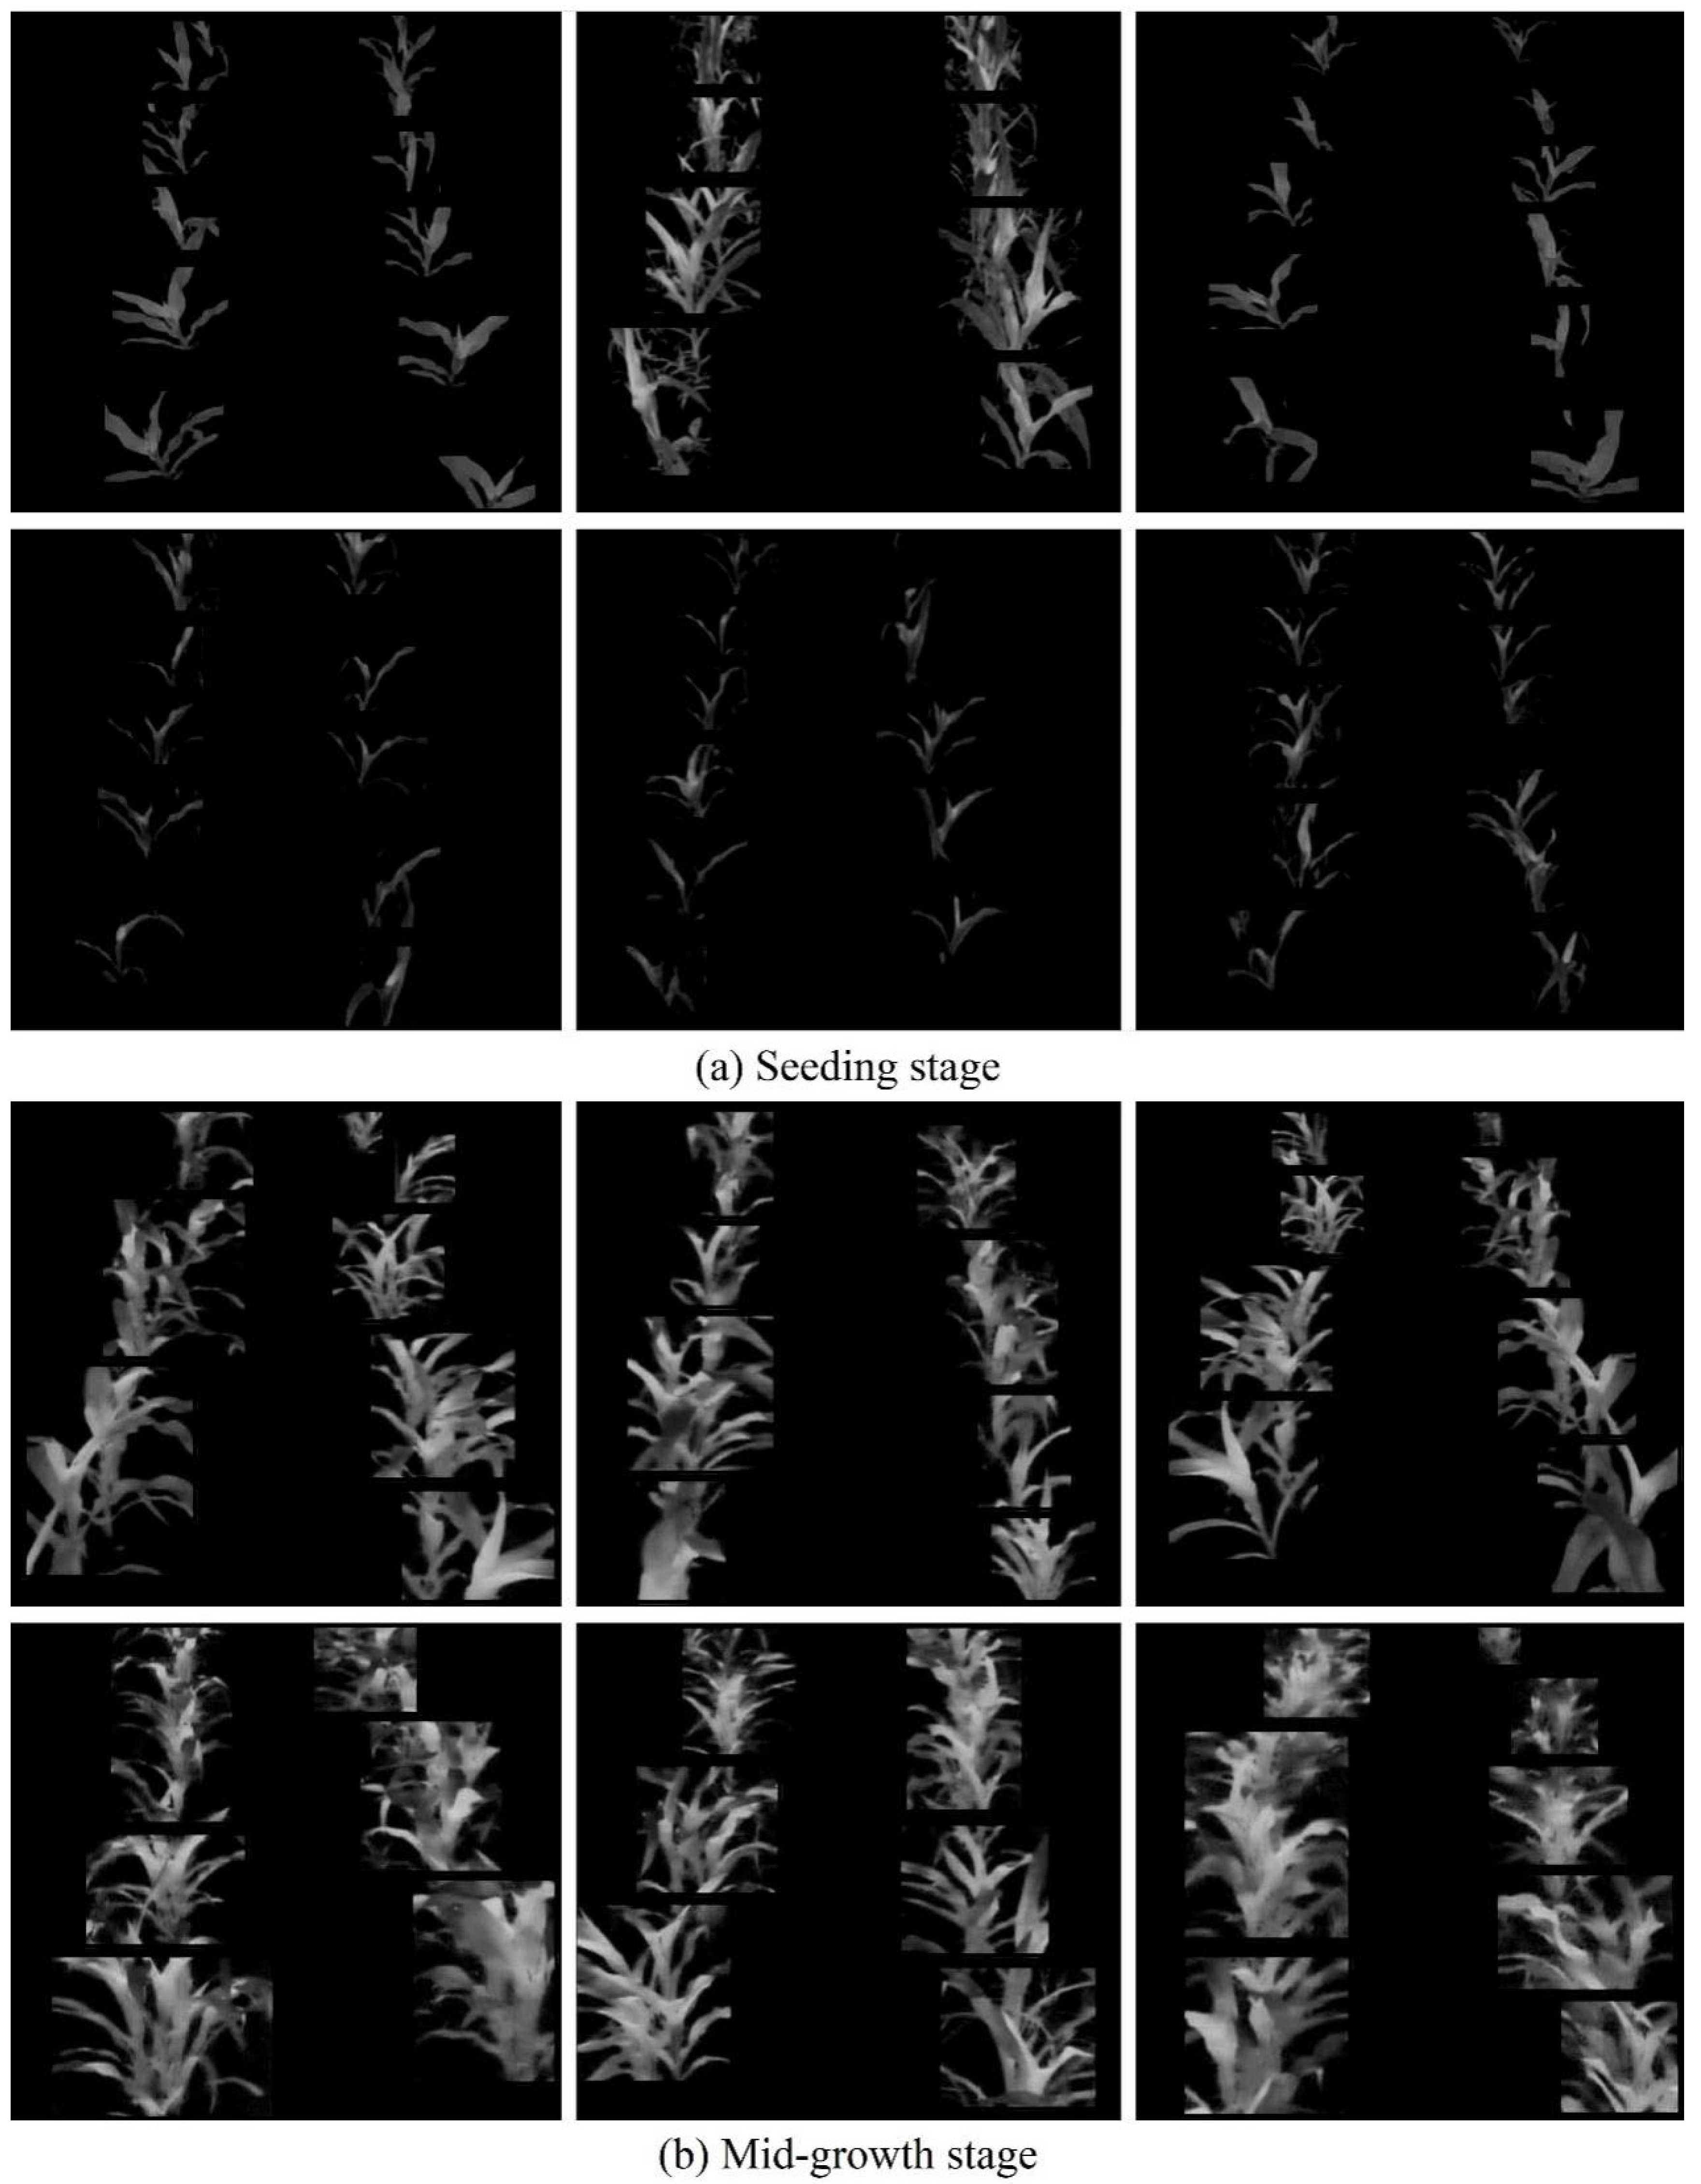
3.3. Crop Row Segment Segmentation Experiment

After detecting the corn crop row segments using the ST-YOLOv8s network, this paper used the improved supergreen method to segment the corn crop rows and background in the detection frame, and the results of the segmentation of corn crop row segments during different growth stages are shown in Figure 10. From the figure, it can be seen that the improved supergreen method can effectively segment the corn crop rows and the background, which ensures the accuracy of the segmentation of corn crop row segments.

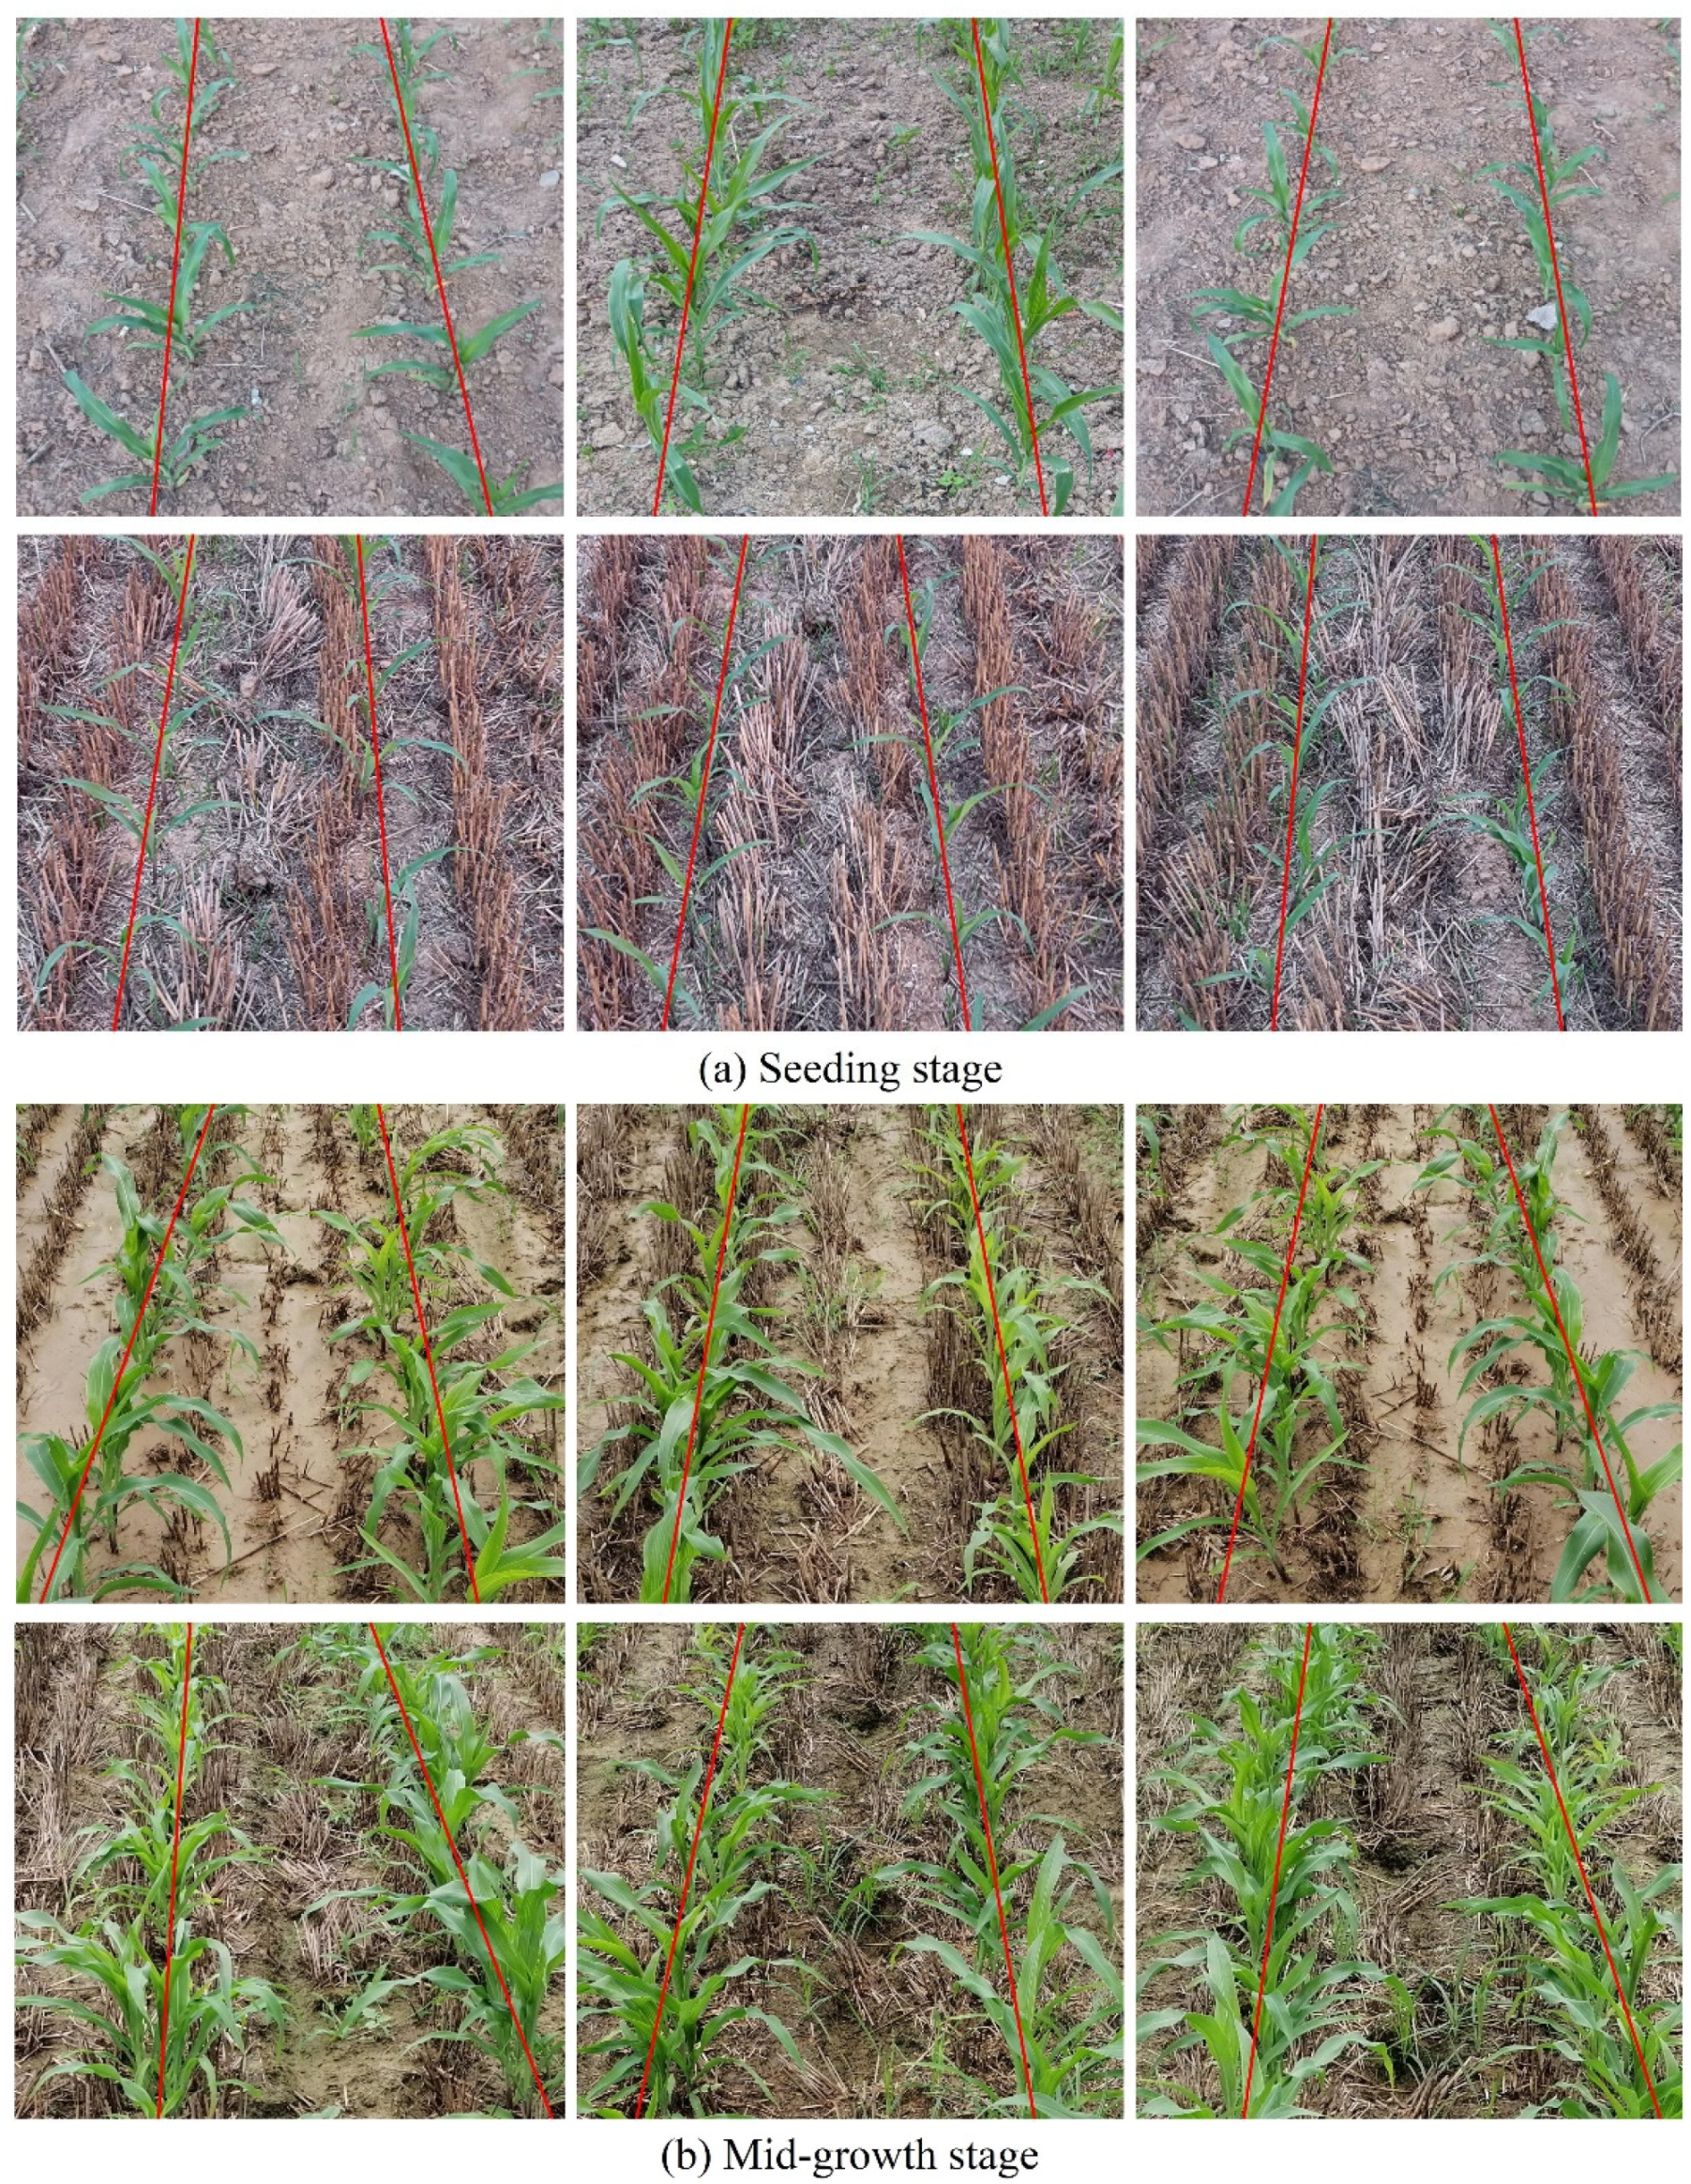
3.4. Crop Row Line Detection Experiment

In order to verify the effectiveness of the local–global detection method proposed in this paper, the crop row line detection results of the local–global detection method during different growth stages were compared with the crop row line detection results of the three comparison methods, which were the detection frame midpoint method combined with the least squares method, the FAST corner point detection method combined with the least squares method, and the SUSAN corner point detection method combined with the least squares method. The detection results of the above four methods were evaluated, and the evaluation results are shown in Table 6, where W is the accuracy, N is the average angle error, T is the average fitting time. W, N and T are defined as shown in Equations (9)–(11), respectively, where Na is the angle error of the corn crop row line, b is the number of corn crop row strips with Na less than 5°, A is the total number of corn crop rows, M is the total number of images, Tm is the fitting time of the centerline of the mth corn crop row image, W is the accuracy rate, N is the average angle error, and T is the average fitting time.
W = b A
N = 1 A a = 1 A N a
T = 1 M m = 1 M T m
From the data in the above table, it can be seen that the accuracy of the local–global detection method proposed in this paper is improved by 17.38%, 10.47%, and 5.99%, respectively, compared to the accuracy of the comparison methods. The average angle error decreases by 3.78°, 1.61°, and 0.7° compared to the average angle error of the comparison methods, respectively. The average fitting time decreased by 5.30 ms, 18 ms, and 33.77 ms, respectively, compared with the average fitting time of the comparison methods. It is shown that the local–global detection method proposed in this paper not only improves the accuracy of crop row line recognition, but also reduces the time of crop row line fitting. The crop row detection results of the local–global detection method during different growth stages are shown in Figure 11. The red line in the figure indicates the corn crop row.

4. Conclusions

Corn crop row detection technology has always been a key link in the visual navigation of agricultural robots. An algorithm for recognizing corn crop rows during different growth stages, based on the ST-YOLOv8s network, is proposed in this paper. Firstly, a dataset of corn crop rows during different growth stages was constructed in this study, in which the different growth stages include the corn seedling stage and the mid-growth stage of corn. Secondly, an improved YOLOv8s network was used, which detects corn crop row segments by having its backbone network replaced with an ST network. The experimental results of crop row segment detection showed that the MAP of the ST-YOLOv8s network increased by 7.34%, 11.92%, and 4.03% on average compared with that of YOLOv5s, YOLOv7, and YOLOv8s networks, respectively, at different growth stages, which indicated that the ST-YOLOv8s network had a better effect of detecting crop row segments compared with the comparison networks. Then, this study utilized the improved supergreen method to segment the crop rows and background in the detection frame. Finally, the local–global detection method, which first detects the local crop row line and then the global crop row line, was proposed in this study. The experimental results of crop row line detection show that the accuracy of the local–global detection method proposed in this paper is improved by 17.38%, 10.47%, and 5.99%, respectively, compared with the accuracy of the comparison methods. The average angle error decreased by 3.78°, 1.61°, and 0.7° compared to the average angle error of the comparison methods, respectively. The average fitting time decreased by 5.30 ms, 18 ms, and 33.77 ms, respectively, compared with the average fitting time of the comparison methods, indicating that the local–global detection method has a better crop row line detection effect compared with the comparison methods. In summary, the corn crop row recognition algorithm proposed in this paper is able to detect the corn crop rows during different growth stages well.
In the future, we are committed to continuously expanding the diversity of datasets, especially focusing on complex and specific scenarios such as occlusion, suboptimal alignment, single-row crops, curved crop rows, and broken rows. We will conduct in-depth research on these challenges to find effective solutions. Meanwhile, we plan to integrate crop row detection algorithms into visual navigation systems and precision pesticide control systems, particularly in modern agricultural equipment such as agricultural robots and plant protection drones.

Author Contributions

Project Management, Z.D. and B.Z.; Research Design, Z.D. and D.Z.; Data Collection, S.M., J.Z. and S.Z.; Chart Creation, S.M. and P.G.; Data Analysis, J.Z. and Z.H.; Manuscript Writing, S.M. and P.G.; Manuscript Revision, Z.D.; Manuscript Review, B.Z.; Literature Retrieval, D.Z. and S.Z. All authors have read and agreed to the published version of the manuscript.

Funding

This research was supported by the Department of Science and Technology of Henan Province (Grant No. 202102110125), National Natural Science Foundation of China (Grant No. 62003312), and the Department of Science and Technology of Henan Province (Grant No. 202102210363). The authors would like to thank the editor and reviewers for their valuable input, time, and suggestions to improve the quality of the manuscript.

Data Availability Statement

The data presented in this study are available on request from the corresponding author (the data are not publicly available due to privacy or ethical restrictions).

Conflicts of Interest

The authors declare no conflict of interest.

References

  1. Diao, Z.H.; Yan, J.N.; He, Z.D.; Zhao, S.N.; Guo, P.L. Corn seedling recognition algorithm based on hyperspectral image and lightweight-3D-CNN. Comput. Electron. Agric. 2022, 201, 107343. [Google Scholar] [CrossRef]
  2. Bai, Y.H.; Zhang, B.H.; Xu, N.M.; Zhou, J.; Shi, J.Y.; Diao, Z.H. Vision-based navigation and guidance for agricultural autonomous vehicles and robots: A review. Comput. Electron. Agric. 2023, 205, 107584. [Google Scholar] [CrossRef]
  3. Wang, T.H.; Chen, B.; Zhang, Z.Q.; Li, H.; Zhang, M. Applications of machine vision in agricultural robot navigation: A review. Comput. Electron. Agric. 2022, 198, 107085. [Google Scholar] [CrossRef]
  4. Li, Y.; Guo, Z.Q.; Shuang, F.; Zhang, M.; Li, X. H Key technologies of machine vision for weeding robots: A review and benchmark. Comput. Electron. Agric. 2022, 196, 106880. [Google Scholar] [CrossRef]
  5. Solimani, F.; Cardellicchio, A.; Dimauro, G.; Petrozza, A.; Summerer, S.; Cellini, F.; Renò, V. Optimizing tomato plant phenotyping detection: Boosting YOLOv8 architecture to tackle data complexity. Comput. Electron. Agric. 2024, 218, 108728. [Google Scholar] [CrossRef]
  6. Xiao, B.J.; Nguyen, M.; Yan, W.Q. Fruit ripeness identification using YOLOv8 model. Multimed. Tools Appl. 2024, 83, 28039–28056. [Google Scholar] [CrossRef]
  7. Liu, S.C.; Huang, Z.; Xu, Z.H.; Zhao, F.J.; Xiong, D.L.; Peng, S.B.; Huang, J.L. High-throughput measurement method for rice seedling based on improved UNet model. Comput. Electron. Agric. 2024, 219, 108770. [Google Scholar] [CrossRef]
  8. Yu, J.Y.; Zhang, J.Y.; Shu, A.J.; Chen, Y.J.; Chen, J.N.; Yang, Y.J.; Tang, W.; Zhang, Y.C. Study of convolutional neural network-based semantic segmentation methods on edge intelligence devices for field agricultural robot navigation line extraction. Comput. Electron. Agric. 2023, 209, 107811. [Google Scholar] [CrossRef]
  9. Li, D.F.; Li, B.L.; Long, S.F.; Feng, H.Q.; Xi, T.; Kang, S.; Wang, J. Rice seedling row detection based on morphological anchor points of rice stems. Biosyst. Eng. 2023, 226, 71–85. [Google Scholar] [CrossRef]
  10. He, Y.; Zhang, X.Y.; Zhang, Z.Q.; Fang, H. Automated detection of boundary line in paddy field using MobileV2-UNet and RANSAC. Comput. Electron. Agric. 2022, 194, 106697. [Google Scholar] [CrossRef]
  11. Liu, F.C.; Yang, Y.; Zeng, Y.M.; Liu, Z.Y. Bending diagnosis of rice seedling lines and guidance line extraction of automatic weeding equipment in paddy field. Mech. Syst. Signal Process. 2020, 142, 106791. [Google Scholar] [CrossRef]
  12. Quan, L.Z.; Feng, H.Q.; Lv, Y.J.; Wang, Q.; Zhang, C.B.; Liu, J.G.; Yuan, Z.Y. Maize seedling detection under different growth stages and complex field environments based on an improved Faster R–CNN. Biosyst. Eng. 2019, 184, 1–23. [Google Scholar] [CrossRef]
  13. Yang, Y.; Zhou, Y.; Yue, X.; Zhang, G.; Wen, X.; Ma, B.; Xu, L.Y.; Chen, L.Q. Real-time detection of crop rows in maize fields based on autonomous extraction of ROI. Expert Syst. Appl. 2023, 213, 118826. [Google Scholar] [CrossRef]
  14. Jiang, H.H.; Zhang, C.Y.; Qiao, Y.L.; Zhang, Z.; Zhang, W.J.; Song, C.Q. CNN feature based graph convolutional network for weed and crop recognition in smart farming. Comput. Electron. Agric. 2020, 174, 105450. [Google Scholar] [CrossRef]
  15. Diao, Z.H.; Guo, P.L.; Zhang, B.H.; Zhang, D.Y.; Yan, J.N.; He, Z.D.; Zhao, S.N.; Zhao, C.J. Maize crop row recognition algorithm based on improved UNet network. Comput. Electron. Agric. 2023, 210, 107940. [Google Scholar] [CrossRef]
  16. Zhang, Q.; Wang, J.H.; Li, B. Extraction method for centerlines of rice seedings based on YOLOv3 target detection. Trans. CSAM 2020, 51, 34–43. [Google Scholar] [CrossRef]
  17. Yang, R.B.; Zhai, Y.M.; Zhang, J.; Zhang, H.; Tian, G.B.; Zhang, J.; Huang, P.C.; Li, L. Potato visual navigation line detection based on deep learning and feature midpoint adaptation. Agriculture 2022, 12, 1363. [Google Scholar] [CrossRef]
  18. Hu, Y.; Huang, H. Extraction method for centerlines of crop row based on improved lightweight yolov4. In Proceedings of the 2021 6th International Symposium on Computer and Information Processing Technology (ISCIPT), Changsha, China, 11–13 June 2021; pp. 127–132. [Google Scholar] [CrossRef]
  19. Bah, M.D.; Hafiane, A.; Canals, R. CRowNet: Deep network for crop row detection in UAV images. IEEE Access 2019, 8, 5189–5200. [Google Scholar] [CrossRef]
  20. Wang, S.S.; Yu, S.S.; Zhang, W.Y.; Wang, X.S.; Li, J. The seedling line extraction of automatic weeding machinery in paddy field. Comput. Electron. Agric. 2023, 205, 107648. [Google Scholar] [CrossRef]
  21. Everingham, M.; Gool, L.V.; Williams, C.K.; Winn, J.; Zisserman, A. The pascal visual object classes (voc) challenge. Int. J. Comput. Vis. 2010, 88, 303–338. [Google Scholar] [CrossRef]
  22. Zhu, Y.J.; Li, S.S.; Du, W.S.; Du, Y.P.; Liu, P.; Li, X. Identification of table grapes in the natural environment based on an improved Yolov5 and localization of picking points. Precis. Agric. 2023, 24, 1333–1354. [Google Scholar] [CrossRef]
  23. Diao, Z.H.; Guo, P.L.; Zhang, B.K.; Yan, J.N.; He, Z.D.; Zhao, S.N.; Zhao, C.J.; Zhang, J.C. Spatial-spectral attention-enhanced Res-3D-OctConv for corn and weed identification utilizing hyperspectral imaging and deep learning. Comput. Electron. Agric. 2023, 212, 108092. [Google Scholar] [CrossRef]
  24. Gallo, I.; Rehman, A.U.; Dehkordi, R.H.; Landro, N.; Grassa, R.L.; Boschetti, M. Deep object detection of crop weeds: Performance of YOLOv7 on a real case dataset from UAV images. Remote Sens. 2023, 15, 539. [Google Scholar] [CrossRef]
  25. Lee, S.H.; Chan, C.S.; Wilkin, P.; Remagnino, P. Deep-plant: Plant identification with convolutional neural networks. In Proceedings of the 2015 IEEE International Conference on Image Processing (ICIP), Quebec City, QC, Canada, 27–30 September 2015; pp. 452–456. [Google Scholar] [CrossRef]
  26. Wang, S.S.; Zhang, W.Y.; Wang, X.S.; Yu, S.S. Recognition of rice seedling rows based on row vector grid classification. Comput. Electron. Agric. 2021, 190, 106454. [Google Scholar] [CrossRef]
  27. Liu, G.X.; Nouaze, J.C.; Touko Mbouembe, P.L.; Kim, J.H. YOLO-tomato: A robust algorithm for tomato detection based on YOLOv3. Sensors 2020, 20, 2145. [Google Scholar] [CrossRef] [PubMed]
  28. Diao, Z.H.; Guo, P.L.; Zhang, B.H.; Zhang, D.Y.; Yan, J.N.; He, Z.D.; Zhao, S.N.; Zhao, C.J.; Zhang, J.C. Navigation line extraction algorithm for corn spraying robot based on improved YOLOv8s network. Comput. Electron. Agric. 2023, 212, 108049. [Google Scholar] [CrossRef]
  29. Liu, Z.; Lin, Y.T.; Cao, Y.; Hu, H.; Wei, Y.X.; Zhang, Z.; Lin, S.; Guo, B.N. Swin transformer: Hierarchical vision transformer using shifted windows. In Proceedings of the IEEE/CVF International Conference on Computer Vision, Montreal, QC, Canada, 10–17 October 2021; pp. 10012–10022. [Google Scholar] [CrossRef]
  30. Touvron, H.; Cord, M.; Douze, M.; Massa, F.; Sablayrolles, A.; Jégou, H. Training data-efficient image transformers & distillation through attention. In Proceedings of the International Conference on Machine Learning, PMLR, Virtual Event, 18–24 July 2021; pp. 10347–10357. [Google Scholar] [CrossRef]
  31. Dosovitskiy, A.; Beyer, L.; Kolesnikov, A.; Weissenborn, D.; Zhai, X.; Unterthiner, T.; Dehghani, M.; Minderer, M.; Heigold, G.; Gelly, S.; et al. An image is worth 16x16 words: Transformers for image recognition at scale. arXiv 2020, arXiv:2010.11929. [Google Scholar] [CrossRef]
  32. Tan, M.X.; Le, Q. Efficientnet: Rethinking model scaling for convolutional neural networks. In Proceedings of the International Conference on Machine Learning, PMLR, Long Beach, CA, USA, 9–15 June 2019; pp. 6105–6114. [Google Scholar] [CrossRef]
  33. Redmon, J.; Divvala, S.; Girshick, R.; Farhadi, A. You only look once: Unified, real-time object detection. In Proceedings of the IEEE Conference on Computer Vision and Pattern Recognition, Las Vegas, NV, USA, 27–30 June 2016; pp. 779–788. [Google Scholar]
Figure 1. The main steps of the proposed algorithm.
Agronomy 14 01466 g001
Figure 2. Corn crop rows at different growth stages.
Agronomy 14 01466 g002
Figure 3. Swin transformer structure.
Agronomy 14 01466 g003
Figure 4. ST-YOLOv8s structure.
Agronomy 14 01466 g004
Figure 5. Segmentation results of crop row segment.
Agronomy 14 01466 g005
Figure 6. Local–global crop row detection results.
Agronomy 14 01466 g006
Figure 7. Network evaluation results during different growth stages of corn.
Agronomy 14 01466 g007
Figure 8. Crop row segment detection results during different growth stages of corn (ST-YOLOv8s).
Agronomy 14 01466 g008
Figure 9. The results of training curves for various improved networks.
Agronomy 14 01466 g009
Figure 10. Segmentation results of crop row segments at different growth stages.
Agronomy 14 01466 g010
Figure 11. Crop row detection result at different growth stages.
Agronomy 14 01466 g011
Table 1. Comparison of different navigation methods.
MethodAdvantageDisadvantage
GNSSGlobal coverage and high accuracyPoor stability and signal susceptibility to environmental influences
LiDARHighly accurate and unaffected by the environmentHigher cost and complexity of operation
Computer visionGood autonomy and real timeSensitivity to environmental factors
Table 2. Relevant research results [8,9,10,11,12,13,14,15,16,17,18,19,20].
TargetMethodAccuracyAuthor
-ENet84.94%Yu et al. (2023)
RiceTransformer92.93%Li et al. (2023)
RiceUNet + MobileNet V290.8%He et al. (2022)
RiceSSD + MobileNet92.8%Liu et al. (2020)
CornFaster-RCNN + VGG1997.71%Quan et al. (2019)
CornYOLOv597.8%Yang et al. (2023)
-GCN + ResNet-10197.5%Jiang et al. (2020)
CornUNet + ASPP90.18%Diao et al. (2023)
RiceYOLOv391.47%Zhang et al. (2020)
PotatoUNet + VGG1697.29%Yang et al. (2022)
-YOLOv4 + MobileNet V393.6%Hu et al. (2021)
-SegNet93.58%Bah et al. (2019)
RiceYOLOv5 + PFocal Loss-Wang et al. (2023)
Table 3. Number of corn crop row images at different growth stages.
CategoryNumber
Seedling stage5328
Mid-growth stage4672
Table 4. Experimental platform.
NameRelated Configuration
Operating systemWindows 10 (64 bit)
CPUIntel(R) Xeon(R) CPU E5-2678 v3 @ 2.50 GHz
GPUNVIDIA GeForce RTX 3080 Ti
Software and environmentPyCharm 2021.3, Python 3.8, Pytorch 1.10
Table 5. Comparison of detection accuracy of different improved networks.
Growth StageNetworkMAP
ST-YOLOv5s91.13%
Seedling stageST-YOLOv785.36%
ST-YOLOv8s93.89%
ST-YOLOv5s91.78%
Mid-growth stageST-YOLOv784.77%
ST-YOLOv8s92.27%
Table 6. Evaluation of crop row line detection results.
Evaluation MetricsDetection Frame Midpoint + Least Squares MethodFAST Corner Point Detection + Least Squares MethodSUSAN Corner Point Detection + Least Squares MethodThis Paper
Accuracy W79.41%86.32%90.80%96.79%
Average angle error N4.36°2.19°1.28°0.58°
Average fitting time T52.30 ms65.00 ms80.77 ms47.00 ms
Disclaimer/Publisher’s Note: The statements, opinions and data contained in all publications are solely those of the individual author(s) and contributor(s) and not of MDPI and/or the editor(s). MDPI and/or the editor(s) disclaim responsibility for any injury to people or property resulting from any ideas, methods, instructions or products referred to in the content.

