Abstract
Irrigation efficiency is important for the environment and the economy. SIMDualKc has been effectively used to calculate evaporation and transpiration separately in vineyards for different irrigation strategies, but not to analyze the impact of irrigation frequency. This study was conducted for the in-field adjustment of the soil wetted fraction (wf) with a time domain reflectometry (TDR) sensor as a function of different irrigation frequency treatments (T03, T07, and T15 with irrigation every 3, 7, and 15 days, respectively). Evaporation and transpiration values were estimated separately with the SIMDualKc model for different irrigation frequencies with the adjusted wf, comparing them with vineyard field measurements and analyzing the effect of different irrigation frequencies on vineyard yield. The wf in T15 was higher than that in T07, which in turn was higher than that in T03. SIMDualKc indicates the most unfavorable treatment to be the T07, with higher evaporation and lower transpiration than T15 and T03, while T15 had higher evaporation and lower transpiration than T03. Although stomatic conductance also indicates the most unfavorable case to be T07, no clear differences were found between T03 and T15. No statistically significant differences were obtained in yield. The results indicate that the differences observed between irrigation frequencies are not reflected in yield but do show up in water use efficiency.
1. Introduction
One of the main challenges facing viticulture today is water scarcity [1]. Vineyard cultivation in arid and semi-arid areas is limited by water availability and water use efficiency is important for the proper development of crops [2,3]. The effect of different irrigation strategies on vine cultivation has been demonstrated, especially with respect to controlled deficit irrigation [4,5,6,7,8,9,10,11]. Crop forcing techniques and irrigation strategies are important and have been studied in vineyards [12]. However, water use efficiency can be affected by different factors which need to be considered in detail.
One of the most important factors when scheduling irrigation is its frequency. Due to differences in soil moisture caused by different irrigation frequencies, some studies have shown positive crop responses under high-frequency drip irrigation [13]. However, another study has shown that the greater the amount of irrigation applied, the greater the efficiency when the frequency of irrigation is reduced, raising doubts about the use of high-frequency irrigation in semi-arid areas [14]. Other studies have shown better results with lower irrigation frequencies in terms of sap flow measured transpiration [15]. Another study analyzed irrigation frequency in vineyards based on water potential and canopy temperature. Clear differences were found between irrigated vines, which showed less stress, and non-irrigated vines, which showed more stress, but not between different frequencies, with less stressed plants only in some cases also having lower irrigation frequencies [16]. In a different study, greater plant stress was associated with higher irrigation frequency when a particular amount of water was applied. However, when larger amounts were applied no differences were observed between different frequencies, showing that the influence of irrigation frequency may also depend on the total amount of water applied [17]. In addition, in an analysis of irrigation frequency in vineyards, it was concluded that yield and efficiency depend on the variety, location, and year [18]. Given this variability, using a reliable technique and field measurements, it is important to study the effect of irrigation frequency in a semi-arid area in which the grapevine is a crop of great importance.
Soil behaves as a water store into and out of which water flows. While irrigation and precipitation provide water for the root zone, some water may be lost through surface runoff and deep percolation eventually recharges the permeability layer. Water can be transported to the surface by capillary action or transferred horizontally from inside to outside the root zone in the case of steep slopes. Importantly, some irrigation and precipitation water can be lost through direct evaporation from the soil or transpiration of the crop, the sum of which is known as crop evapotranspiration (ETc). It is important to pay attention to the water needs of each crop and to know its ETc. The ETc is the result of multiplying the reference evapotranspiration (ETo) by a crop coefficient (Kc) that may depend on different crop-specific factors. To observe irrigation efficiency, it is possible to use the dual crop coefficient technique, in which evaporation and transpiration can be obtained separately. Evaporation is the result of multiplying the ETo by an evaporation coefficient (Ke), while transpiration is the result of multiplying the ETo by a basal crop coefficient (Kcb) [19]. Different Kcb values have been obtained according to different physical factors of the vine plant [20]. With this dual crop coefficient approach, it can be seen that the ETc is partly lost through evaporation from the soil and partly through transpiration of the plant [19].
This partitioning of the dual crop coefficient can be studied with simulation models such as SIMDualKc [21,22]. This model allows the separate calculation of evaporation and transpiration. It is important to increase the transpiration of the crop in relation to total water use. For this purpose, simulation models like SIMDualKc can be considered appropriate [23]. Plant measurements, such as stomatal conductance, can also be used to assess stomatal behavior, which is related to water availability in the crop [24].
Evaporation and transpiration have been studied with SIMDualKc considering different irrigation agronomic strategies and taking into account factors such as the amount of irrigation, the presence of vegetation cover, and crop height in the vineyard. However, in these studies, water balances were carried out without studying different irrigation frequencies [23,25,26,27,28].
Other techniques employed in analyses of evaporation and transpiration include the use of eddy covariance, microlysimeters, and sap flow sensors [29]; the WaLIS model [30], satellite imagery and vegetation indices [31]; and sap flow sensors, minilysimeters, neutron probes, and a time domain reflectometry (TDR) sensor [32]. However, in these studies, no consideration was given to the effect of differences between irrigation frequencies.
While some studies have evaluated the frequency of irrigation in vineyards, they have not used SIMDualKc to analyze the effect on evaporation and transpiration separately. The studies that have been conducted on the impact of irrigation frequency have been performed based on sap flow measurements [15], water potential and leaf temperature [16], weighing lysimeters [14], water potential, the leaf area index (LAI), and yield [17] or quality parameters [18]. That is, there are no known studies in which the effect of the frequency of irrigation in vineyards on evaporation and transpiration has been analyzed with SIMDualKc, which is a novel contribution of the present study. In addition, it is considered important to adjust the requirements of the developed model with field measurements.
One of the variants that can be affected by differences in irrigation frequency is the soil wetted fraction (wf). The wf is the surface of soil moistened by irrigation or rainfall. It takes a value between 0 and 1, with 1 meaning that the soil surface is completely wet and 0 meaning it is completely dry. The analysis of the wf produced by irrigation is very important because it can affect the evaporation and transpiration of the crop and the efficient use of water. Factors such as direct solar radiation, air temperature, atmospheric humidity, and wind speed influence soil water evaporation. The depth of the soil layer that is subject to drying through evaporation is between 0.1 and 0.15 m. If the wf is high, it can cause there to be more exposed soil area to be evaporated and, therefore, water may be lost without being used. In addition, the water content of the soil and its ability to conduct the water to the roots can determine the rate of crop transpiration [19].
When the irrigation frequency is low, more water needs to be applied in each irrigation event to maintain the total overall amount of water applied, and therefore there must be variations in the wf [33]. However, if we select drip irrigation in SIMDualKc, a wf of 0.4 is automatically incorporated in the model as it is the default wf in the start-up of the model [21,22]. Therefore, if irrigation type, amount, and frequency are varied, this wf should also vary, and this may affect crop evaporation and transpiration. Consequently, it is considered important to study the wf value of the zone itself based on the soil and climatic characteristics. In this way, it is possible to enter the exact value observed in the field using the TDR sensor technique, which has been shown to be valid for measuring the water status in porous media such as soil [34,35]. This allows us to obtain a more realistic value of the evaporation and transpiration obtained from the different irrigation frequencies with SIMDualKc. As far as the authors of the present study are aware, this type of adjustment has not been made or studied in the literature. In addition, it is considered important to compare these results with field measurements that indicate crop development and yield.
The objectives of this study are as follows: (i) in-field adjustment of the wf with a TDR sensor in a vineyard according to different irrigation frequencies; (ii) separate estimation of evaporation and transpiration with the SIMDualKc model using different irrigation frequencies and adjusted wf values, comparing them with field measurements of the vineyard; and (iii) analysis of the effect of different irrigation frequencies on vineyard yield.
2. Materials and Methods
2.1. Description of the Trial
The experiment took place during the 2022 growing seasons in a 1.2-hectare experimental vineyard at Finca La Orden, Centre for Scientific and Technological Research of Extremadura (CICYTEX), in southwestern Spain. The vineyard, consisting of cv. Red Grenache (Vitis vinifera L.) grafted on 420A rootstock, was characterized by a semi-arid climate. The vines, aged 5 years, were trained as Royat bilateral cordons in a vertical trellis system. Winter pruning reduced each vine to eight spurs and 2 buds (16 buds per vine), while early spring adjustments maintained 16 shoots per vine. Row and vine spacing were set at 3.0 m and 1.4 m, respectively, and orientation was N-S. Surface drip irrigation was used, with an arrangement of raised rubber bands held in place by a wire. Each dripper was 0.7 m apart and had a flow rate of 4 L/h, with two drippers per vine.
Three treatments were selected to evaluate the effect of different irrigation frequencies: T07, the control treatment, comprised the application of 30% of ETo from pea size to harvest with an irrigation frequency every seven days. ETo was calculated on the basis of the measurements of a meteorological station close (distance less than 1 km) to the test plot, following the Penman–Monteith method. T03 and T15 had the same irrigation volume as T07, but with an irrigation frequency every three days and fifteen days, respectively.
Table 1 shows the irrigations established in the different treatments from the onset of irrigation with the fruit at pea size until the time of harvest.

Table 1.
Number of irrigation days, average irrigation per day (mm), and total pre-harvest irrigation (mm) in each irrigation treatment in the vineyard.
Each treatment was repeated in four randomized blocks so that the effect of soil texture on the wf of soil could be analyzed. Table 2 shows the soil textures of each block in the first 0.30, 0.60, and 0.90 m, analyzed through the realization of a pit and a subsequent texture analysis in the laboratory.
Table 2.
Soil texture at different depths (0.30, 0.60, and 0.90 m).
2.2. Measurements of the Soil Wetted Fraction (wf)
A template was used (Figure 1) to obtain the soil wetted fraction data for each treatment (T3, T07, and T15). The template comprised a piece of cardboard lined with plastic to prevent it from deteriorating due to humidity. This 1.5 m long and 0.7 m wide cardboard template, with a surface area of 1.05 m2, contained 33 holes, spaced horizontally at a distance of 0.35 m and vertically at a distance of 0.15 m. All distances refer to the center of the holes.
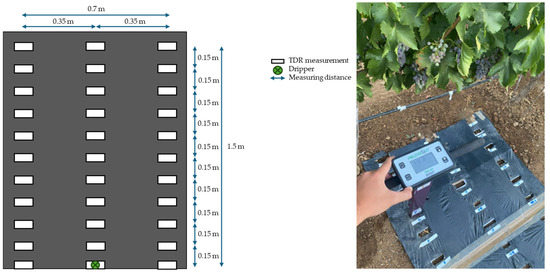
Figure 1.
Template dimensions (m) used to measure the wetted fraction (wf) of soil with a dripper with a FieldScout time domain reflectometry (TDR) 350 sensor (Spectrum Technologies, Inc., Aurora, IL, USA) ready to measure in the field.
The template was placed on either side of the dripper, with the longest part towards the space between rows of plants (Figure 1), so that 1.05 m2 was obtained from one side of the dripper and then another 1.05 m2 from the other side of the dripper. In this way, the percentage of wf of half of the planting frame (2.1 m2) could be extrapolated to the total planting frame because there were two drippers between two plants in the same row.
A FieldScout TDR 350 sensor (Spectrum Technologies, Inc., Aurora, IL, USA) was used to collect moisture data from each borehole (Figure 1). This sensor works by emitting electromagnetic pulses through the soil and measuring the time they take to return. This time is proportional to the dielectric constant of the air–water–soil medium, which varies with humidity. The measurement depth of the sensor was 4.8 inches (0.12 m), as this is the depth of the soil susceptible to drying through evaporation [19].
The TDR sensor data were taken on 27 July and 10 August 2022, corresponding with two irrigation events when the three irrigation frequencies coincided. The measurements were made with drippers located next to the vine plants, distributed in three groups according to the irrigation intervals: 4 drippers for T03, 4 drippers for T07, and 4 drippers for T15. The measurements were repeated in each block to consider the variability in the soil texture.
All data obtained with the TDR sensor were processed to determine the wf value for each treatment. For this purpose, an area was considered to be wet if it had a hole with a moisture content greater than 16.5%. For example, if all 66 holes were found to have a moisture content greater than 16.5%, then the soil wf percentage would be 100%. The average wf value per block and treatment was obtained, as well as the wetted area per dripper and plantation frame, in m2. The wf value obtained in each treatment was then manually entered into the SIMDualKc model interface to adjust the drip-irrigated soil wf value with a real value observed in the field.
2.3. Estimation of Evaporation and Transpiration
The tool used to calculate evaporation and transpiration was the SIMDualKc (Lisbon, Portugal) simulation model, which allows ETc to be calculated dually by separating Ke and Kcb [21,22]. To start the estimation in the simulation model, the following soil, climate, crop, and irrigation data were entered:
- Soil: The total available water (TAW) (mm/m) was introduced directly in SIMDualKc according to the values established by FAO56 [19] depending on the textures of the three layers (0–0.30 m, 0.30–0.60 m, 0.60–0.90 m) (Table 2). Total evaporable water (TEW) (mm/m) and readily evaporable water (REW) (mm/m) were also introduced in SIMDualKc according to the values established by FAO56 [19] as a function of soil texture at the 0.10 m depth. The absence of vegetation cover between rows on the plot was indicated.
- Climate: The precipitation (mm), ETo calculated according to the Penman–Monteith method (mm), minimum daily relative humidity (mm), average daily wind speed (m/s), latitude (m), altitude (m), and anemometer height (m) of a nearby meteorological station (distance less than 1 km) were entered.
- Crop: To evaluate crop development, the growth stages according to FAO56 were determined through weekly phenological monitoring. The depth of the root (m) was measured in the pit made to determine the characteristics of the soil, as well as the height of the plant (m), employing a telescopic measuring rod. The p-fraction value was taken from the reference value set by FAO56 for the cultivation of vines and their varieties for wine production. To adjust the fraction of crop cover in the model, the LAI value was measured four times during the growing season with an LAI-2200 plant canopy analyzer (LI-COR Inc., Lincoln, NE, USA) on two vines per experimental plot (eight vines per treatment), in accordance with [36]. To evaluate the Kcb, the stomatal sensitivity function (Fr) value was used with an adjustment relative to stomatal control applied as a function of water stress measured by the leaf water potential at solar noon with a Scholander-type pressure chamber (Soil Moisture Corp., Model 3500, Santa Barbara, CA, USA).
- Irrigation: Through the programming option chosen by the user, three irrigation schedules were established throughout the campaign in which the same volume of water, corresponding to 30% of the ETo, was applied but distributed in different frequencies (T03, T07, and T15). That is, the volume of water applied in each irrigation and the time between irrigations varied between the different irrigation schedules. However, overall, the total amount of water applied was the same (Table 1). This SIMDualKc simulation model establishes by default that if the irrigation is by drip, the wf of the irrigation is 0.4 (40%). However, in this study, as this depended on each irrigation treatment, the actual value observed in the field for T03, T07, and T15 was introduced.
In addition to the analysis with the SIMDualKc model, plant measurements were also analyzed. In this case, stomatal conductance was determined using a Decagon SC-1 leaf porometer (Decagon Devices, Inc., Pullman, WA, USA) on 4 leaves per elemental plot (16 leaves per irrigation treatment) to subsequently obtain a mean value per day measured at 11:00 a.m. Measurements were taken on 16 days during the campaign, at times before and after irrigation days.
2.4. Yield Evaluation
The yield was evaluated in each treatment (T03, T07, T15) on 10 vines per elemental plot (40 vines per treatment). All the bunches of each vine were separately weighed with a digital electronic scale, and the value obtained in kilograms per vine (kg/vine) was subsequently extrapolated to tons per hectare (t/ha). Manual harvesting took place on 29 August, with the last irrigation event on 24 August.
3. Results and Discussion
3.1. Wetted Fraction (wf) of the Soil from the Different Treatments with the TDR Sensor
The TDR-measured wf results in each treatment are shown in Table 3. The values correspond to the upper 0.12 m as this is the soil depth susceptible to drying through evaporation [19].
Table 3.
Wetted fraction (wf) of soil from each treatment on two different dates (as a decimal), average wf of the two dates (as a decimal), average wf per treatment (as a decimal), wetted area per dripper (m2), and wetted planting frame area measured by two drippers (m2).
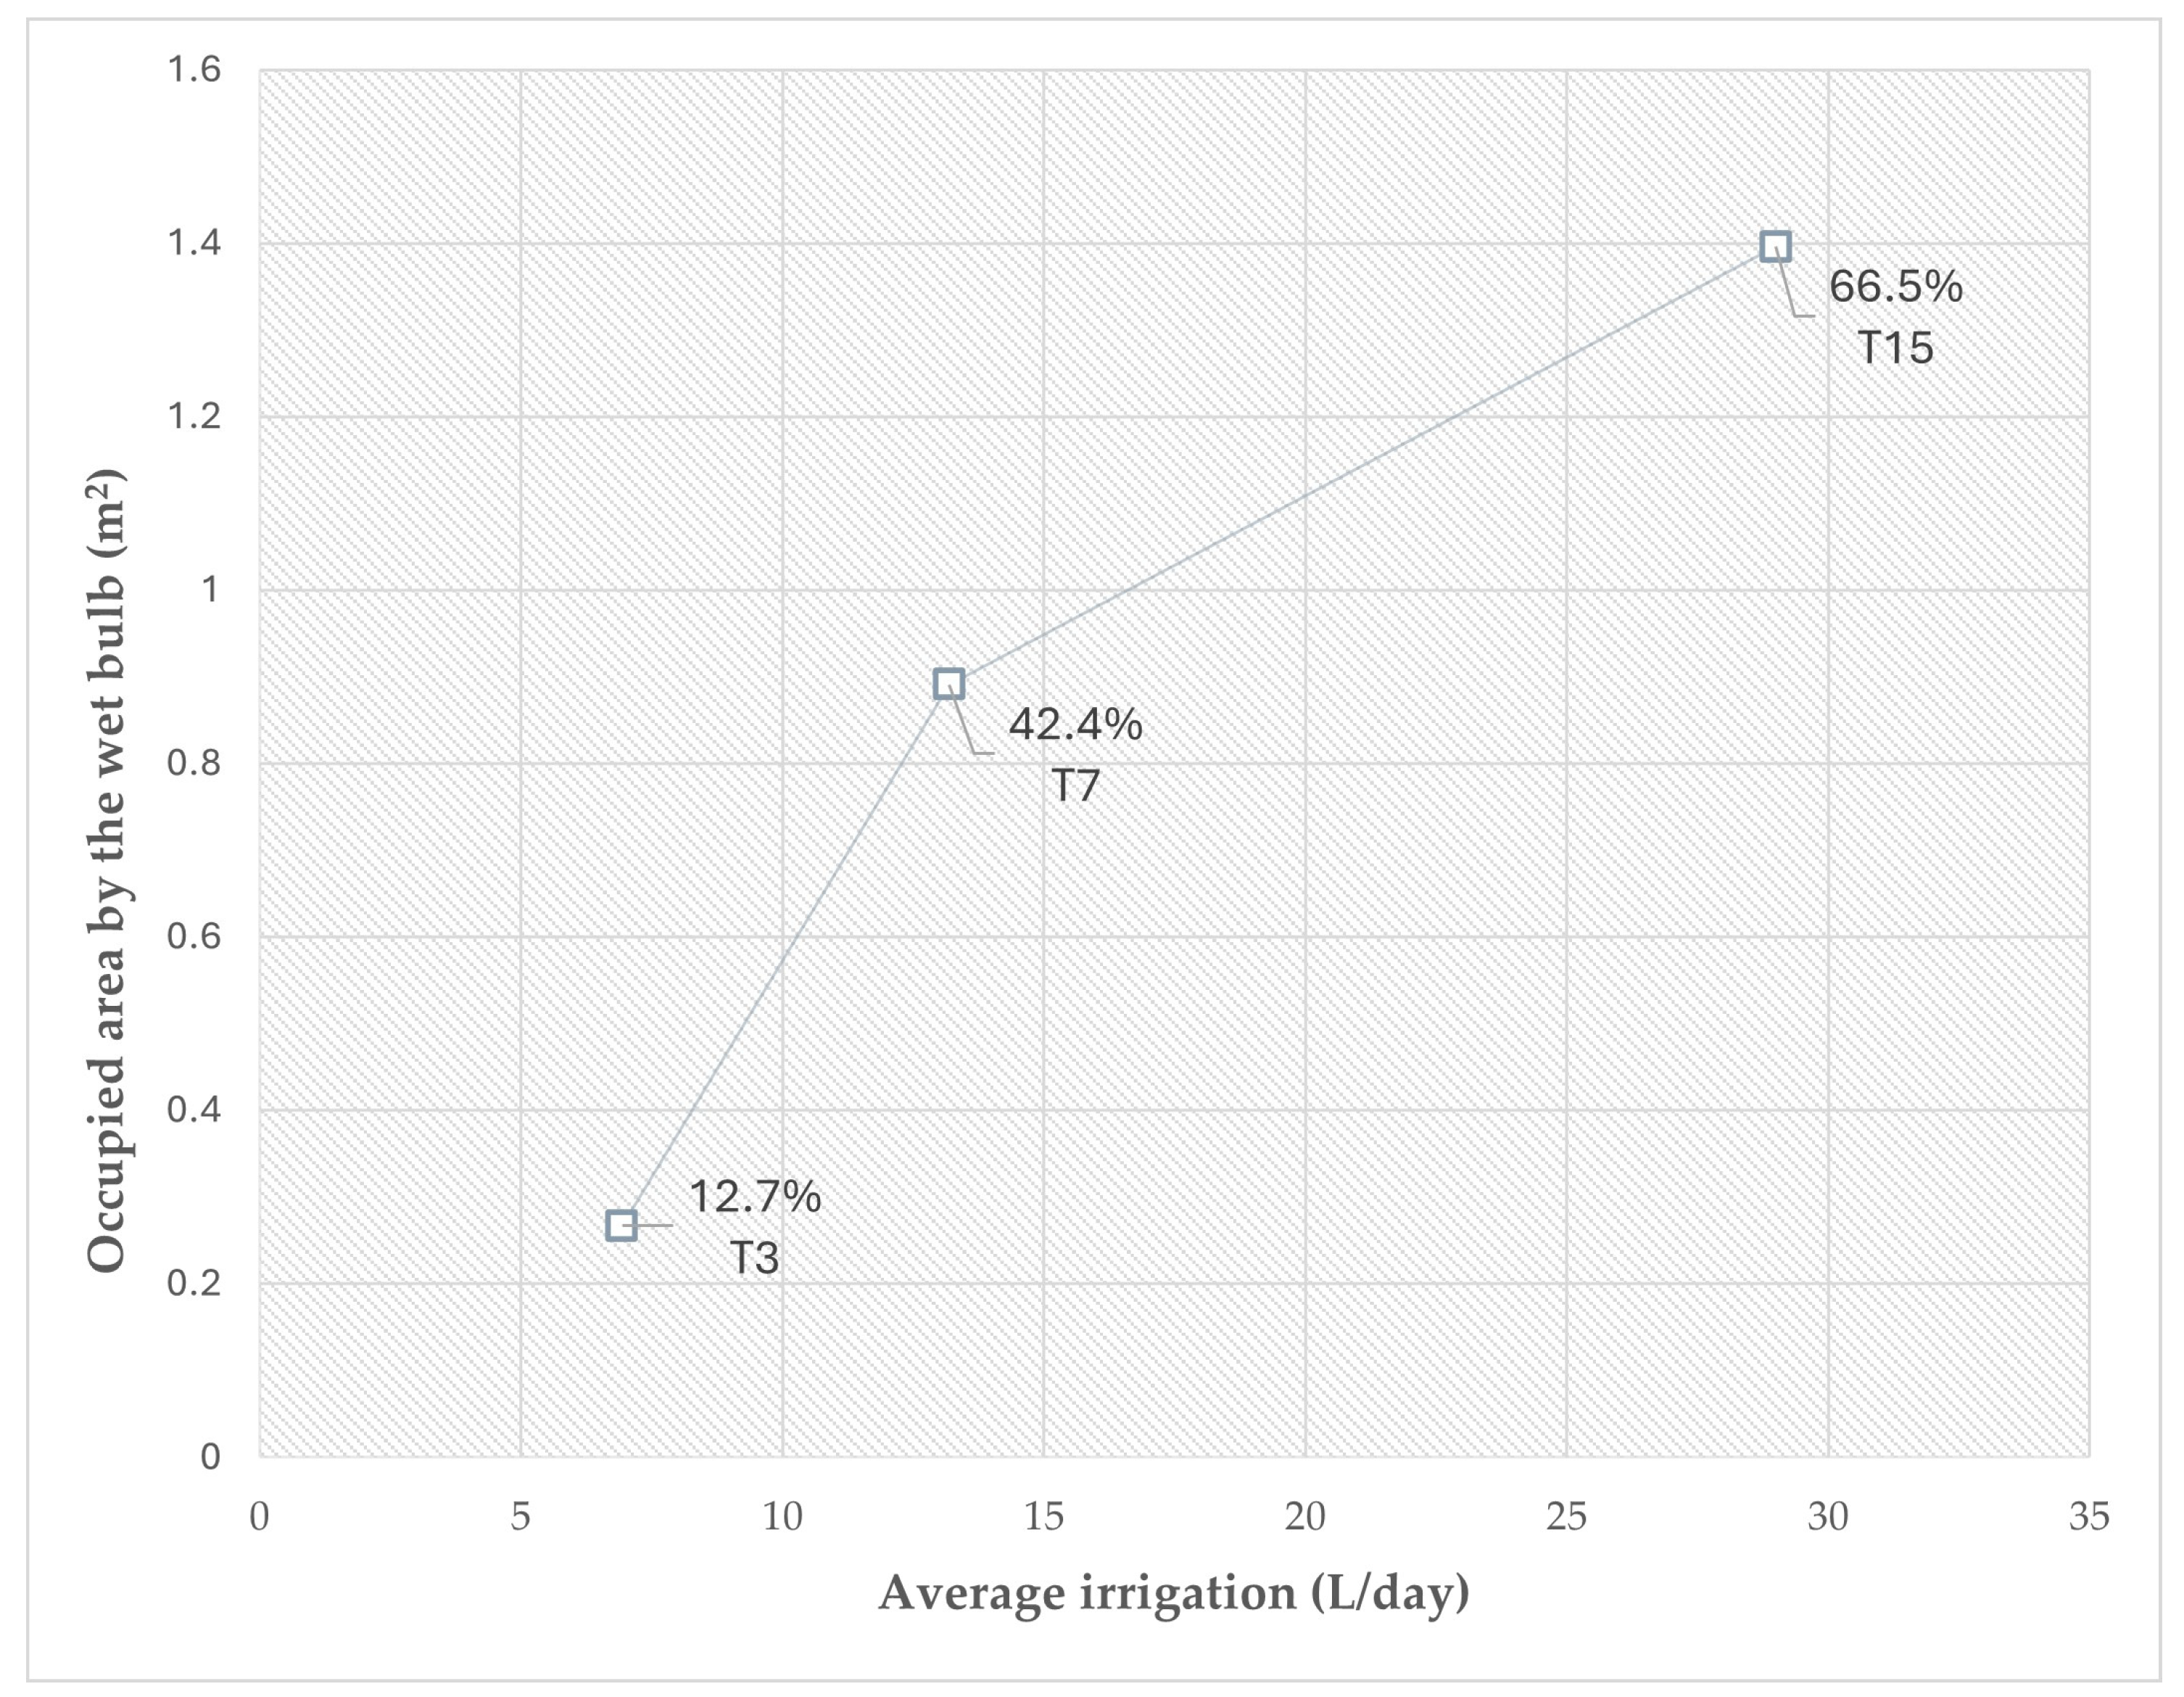
As can be seen in Table 3, the T15 values are higher than the T7 values, and these in turn are higher than the T3 values. This concurs with the results of other studies in that the greater the amount of irrigation applied, the greater the horizontal distribution of water in the soil [33,37,38]. The amount of water applied each irrigation day is higher in T15 than in T7, and in T7 it is higher than in T3 (Figure 2).
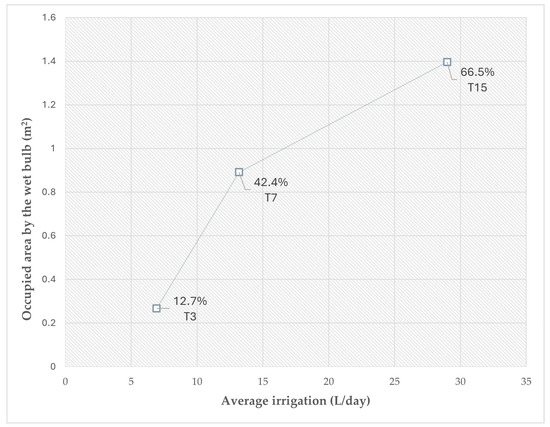
Figure 2.
Wet bulb occupancy (m2 and %) as a function of average irrigation (L/day).
In this way, it can be seen that, in this case in the SIMDualKc simulation model, 0.127 can be used for the T03 irrigation, 0.424 for the T07, and 0.665 for the T15, as the default wf setting is 0.4 when drip irrigation is selected [22].
In each treatment, taking into account the surface soil fraction, the sandy clay loam textures generally had similar but slightly higher wf values than the sandy loam textures. This can be attributed to finer particles retaining water more horizontally on the surface than coarser ones, as has been shown in other studies [33].
The analysis with a TDR sensor shows a real and adjusted field value, with higher wf values as the amount of water applied in each irrigation event increases and the frequency of application falls. It is therefore a reliable technique for this measurement of water in a porous medium such as soil, coinciding with the effectiveness of the TDR-based technique shown in other studies [34,35].
3.2. Estimation of Evaporation and Transpiration of Each Treatment with the SIMDualKc Model
Table 4 shows the evaporation and transpiration values obtained with the SIMDualKc model after introducing the wf observed in the field for each irrigation frequency (Table 3).
Table 4.
Evapotranspiration (ET) (mm), transpiration (mm), evaporation (mm), and evaporation/ET (%) for each irrigation frequency (T03, T07, T15).
As can be seen in Table 4, no significant differences in ET were found between irrigation frequencies. However, it is interesting to see how irrigation frequency affects evaporation and transpiration with the wf observed in the field.
Firstly, evaporation is discussed, as this involves a loss of water that is not used. The results obtained (Table 4) are all within the range of values reported in other vineyard-based studies (from 8% to 60% of the ET), with the variation depending on different conditions [23,26,27,29,30,32]. The results of the present study show that T07, with an evaporation % of ET of 44.248%, had a higher value than the T15 treatment (38.627%), with the lowest irrigation frequency (T15), and the T03 treatment (30.703%), with the highest irrigation frequency.
This means that, in the case of this research, the least favorable case in terms of evaporation was the T07 treatment, and that less water was lost either by watering less frequently every three days (T03) or by watering more frequently and with a larger amount (T15). In a different study, it was found that applying three times more water in each irrigation event reduced the percentage of evaporation by 7% [14]. In the present research, this difference is similar to that between T07 and T15, with the application of approximately twice as much water in the T15 treatment resulting in a 5.621% reduction compared to the T07 treatment. However, the T03 result is contradictory, with lower evaporation than the other treatments. In another study, similar results were also found, obtaining better yields with shorter irrigation intervals, without waterlogging, allowing the water to be available for the roots [13]. According to other research, this may depend on the characteristics of each plot, with the specific interactions between vineyard practices and the efficiency obtained being difficult to predict [39]. This makes it important to analyze evaporation and transpiration separately, considering local characteristics.
Values similar to those obtained in this research have been found for high irrigation frequencies, with 29–31% [25,26] and 8–17% evaporation [27] reported when using daily drip irrigation with inter-row vegetation cover. In terms of evaporation values with less frequent irrigation, evaporation values of 52–59% were found with monthly gravity irrigation and of 49% with four and five seasonal gravity irrigations, both with plant cover between rows [32]. Evaporation of 40–45% was found with drip irrigation with the presence of vegetation cover in a study in which the frequency was not clearly specified but which considered the amount of annual irrigation and the amount of water applied per irrigation event, with many such events carried out in the campaign [23]. Evaporation values of 20–60% have also been found in rainfed research [29,30].
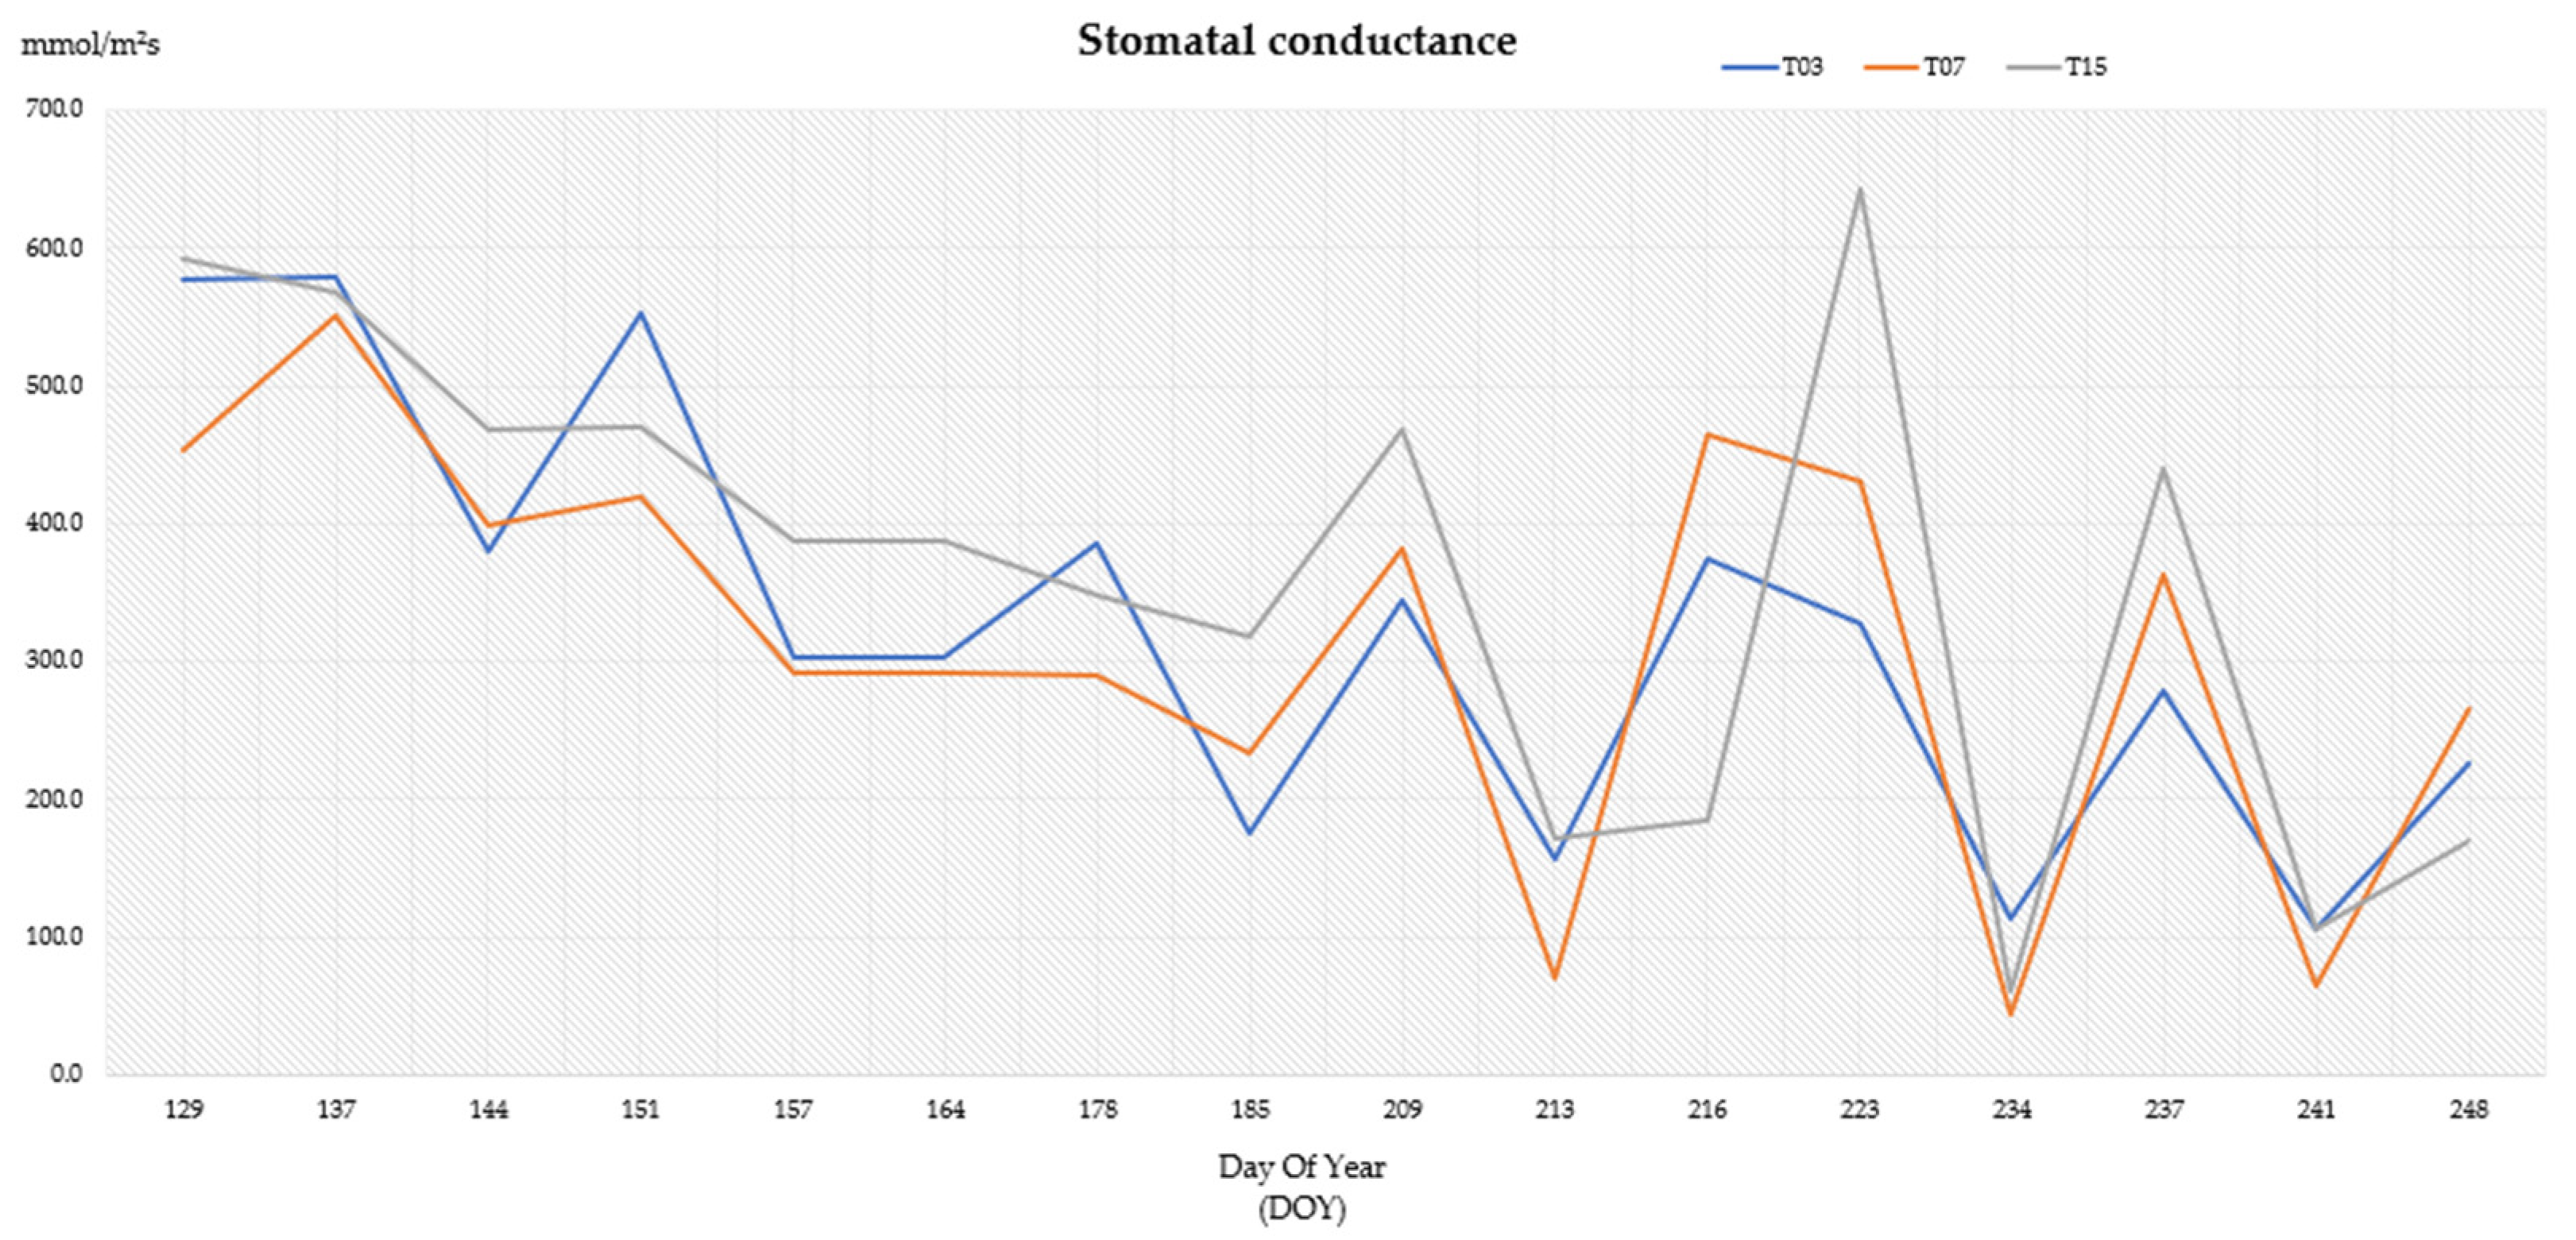
As for the effect of frequency on transpiration, the same trend was obtained as for evaporation, with T07 having the lowest transpiration in comparison with T15 and T03 and the latter having the highest value. To compare these results with plant measurements, Figure 3 shows the stomatal conductance values in plants from different irrigation frequencies.
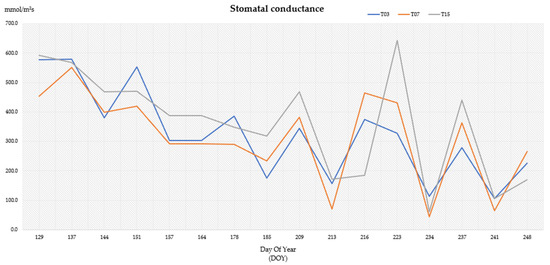
Figure 3.
Stomatal conductance (mmol/m2s) according to the day of the year (DOY) in plants of different irrigation frequency treatments (T03, T07, and T15).
As can be seen in Figure 3, the results of stomatal conductance coincide with the transpiration values shown in Table 4 in that T07 is the most negative case, with 87.5% of the conductance measurements lower than in T03 or T15 and 56.25% of the measurements lower than in T03 and T15. However, there is no clear trend between the T03 and T15 values, with one or the other higher depending on the day of measurement.
As vineyards are crops that can be found in different areas, transpiration values can differ between locations due to differences in varieties, age, training, irrigation, soil cover, and crop management, as shown in vineyard reviews [20]. This means that the results of each study may differ due to a variety of factors.
According to one study using sap flow measurements, transpiration values increased with lower irrigation frequency [15]. In another study, on the same plot of the Finca la Orden as used in the present study and in the same year of study, the effect of irrigation frequency on canopy temperature and water potential was evaluated, also with irrigation every 3, 7, and 15 days. Differences were found between irrigated and non-irrigated vines, but there was no significant trend between irrigation frequencies [16].
One study considered the difference between the irrigation frequencies of vines irrigated every 2 and every 4 days, obtaining more stressed grapevine plants in terms of water potential with irrigation every 2 days compared to every 4 days based on an ETo of 0.2. However, when based on an ETo of 0.4, no differences were seen between irrigation frequencies in terms of plant stress measured with water potential [17].
Other parameters were evaluated in a study considering irrigation frequencies every day (T01), every 3 days (T03), every 7 days (T07), and every 15 days (T15), with differences found between the results for the different years, locations, and varieties [18]. For example, there were no significant differences in pH between irrigation frequencies of the different varieties, although for the red Grenache variety, the one considered in the present study, there was a non-significant increase in pH of 0.12 in T07 compared to T15. In terms of total soluble solids, there were only significant differences between irrigation frequencies in Tempranillo, with lower values found in T03 compared to T07 and T15 in only one year of the study. In Grenache, there was a non-significant difference between T07 and the rest of the treatments, but without a defined trend. As for total acidity, significant differences were found between T15 and T03 in the Tempranillo variety in one year, and in Grenache there was a slight non-significant difference between T15 and T03. Regarding tartaric acid, a positive significant difference was observed in the Mencía variety between T03 over T07 and in Grenache a non-significant difference was observed between T15 and T7 in one year. Regarding malic acid, there were no significant differences between irrigation frequencies in the different varieties, although in Grenache there was a non-significant difference between T07 and T15 in one year. In terms of potassium concentration, no significant differences were found between irrigation frequencies, although in Grenache a non-significant difference was found between T15 and T7 in one year. As for total polyphenols, there were no significant differences between frequencies in the different varieties, although in Grenache there was a non-significant difference between T15 and T07 in one of the years. This study concluded that the frequency of irrigation seems to have a reduced impact that can vary moderately depending on the variety and in some cases on the year [18].
The effect of irrigation frequency may be affected by many factors that are difficult to predict, but it is considered important to present the results in the case of the present local conditions.
3.3. Analysis of the Yield of Each Treatment
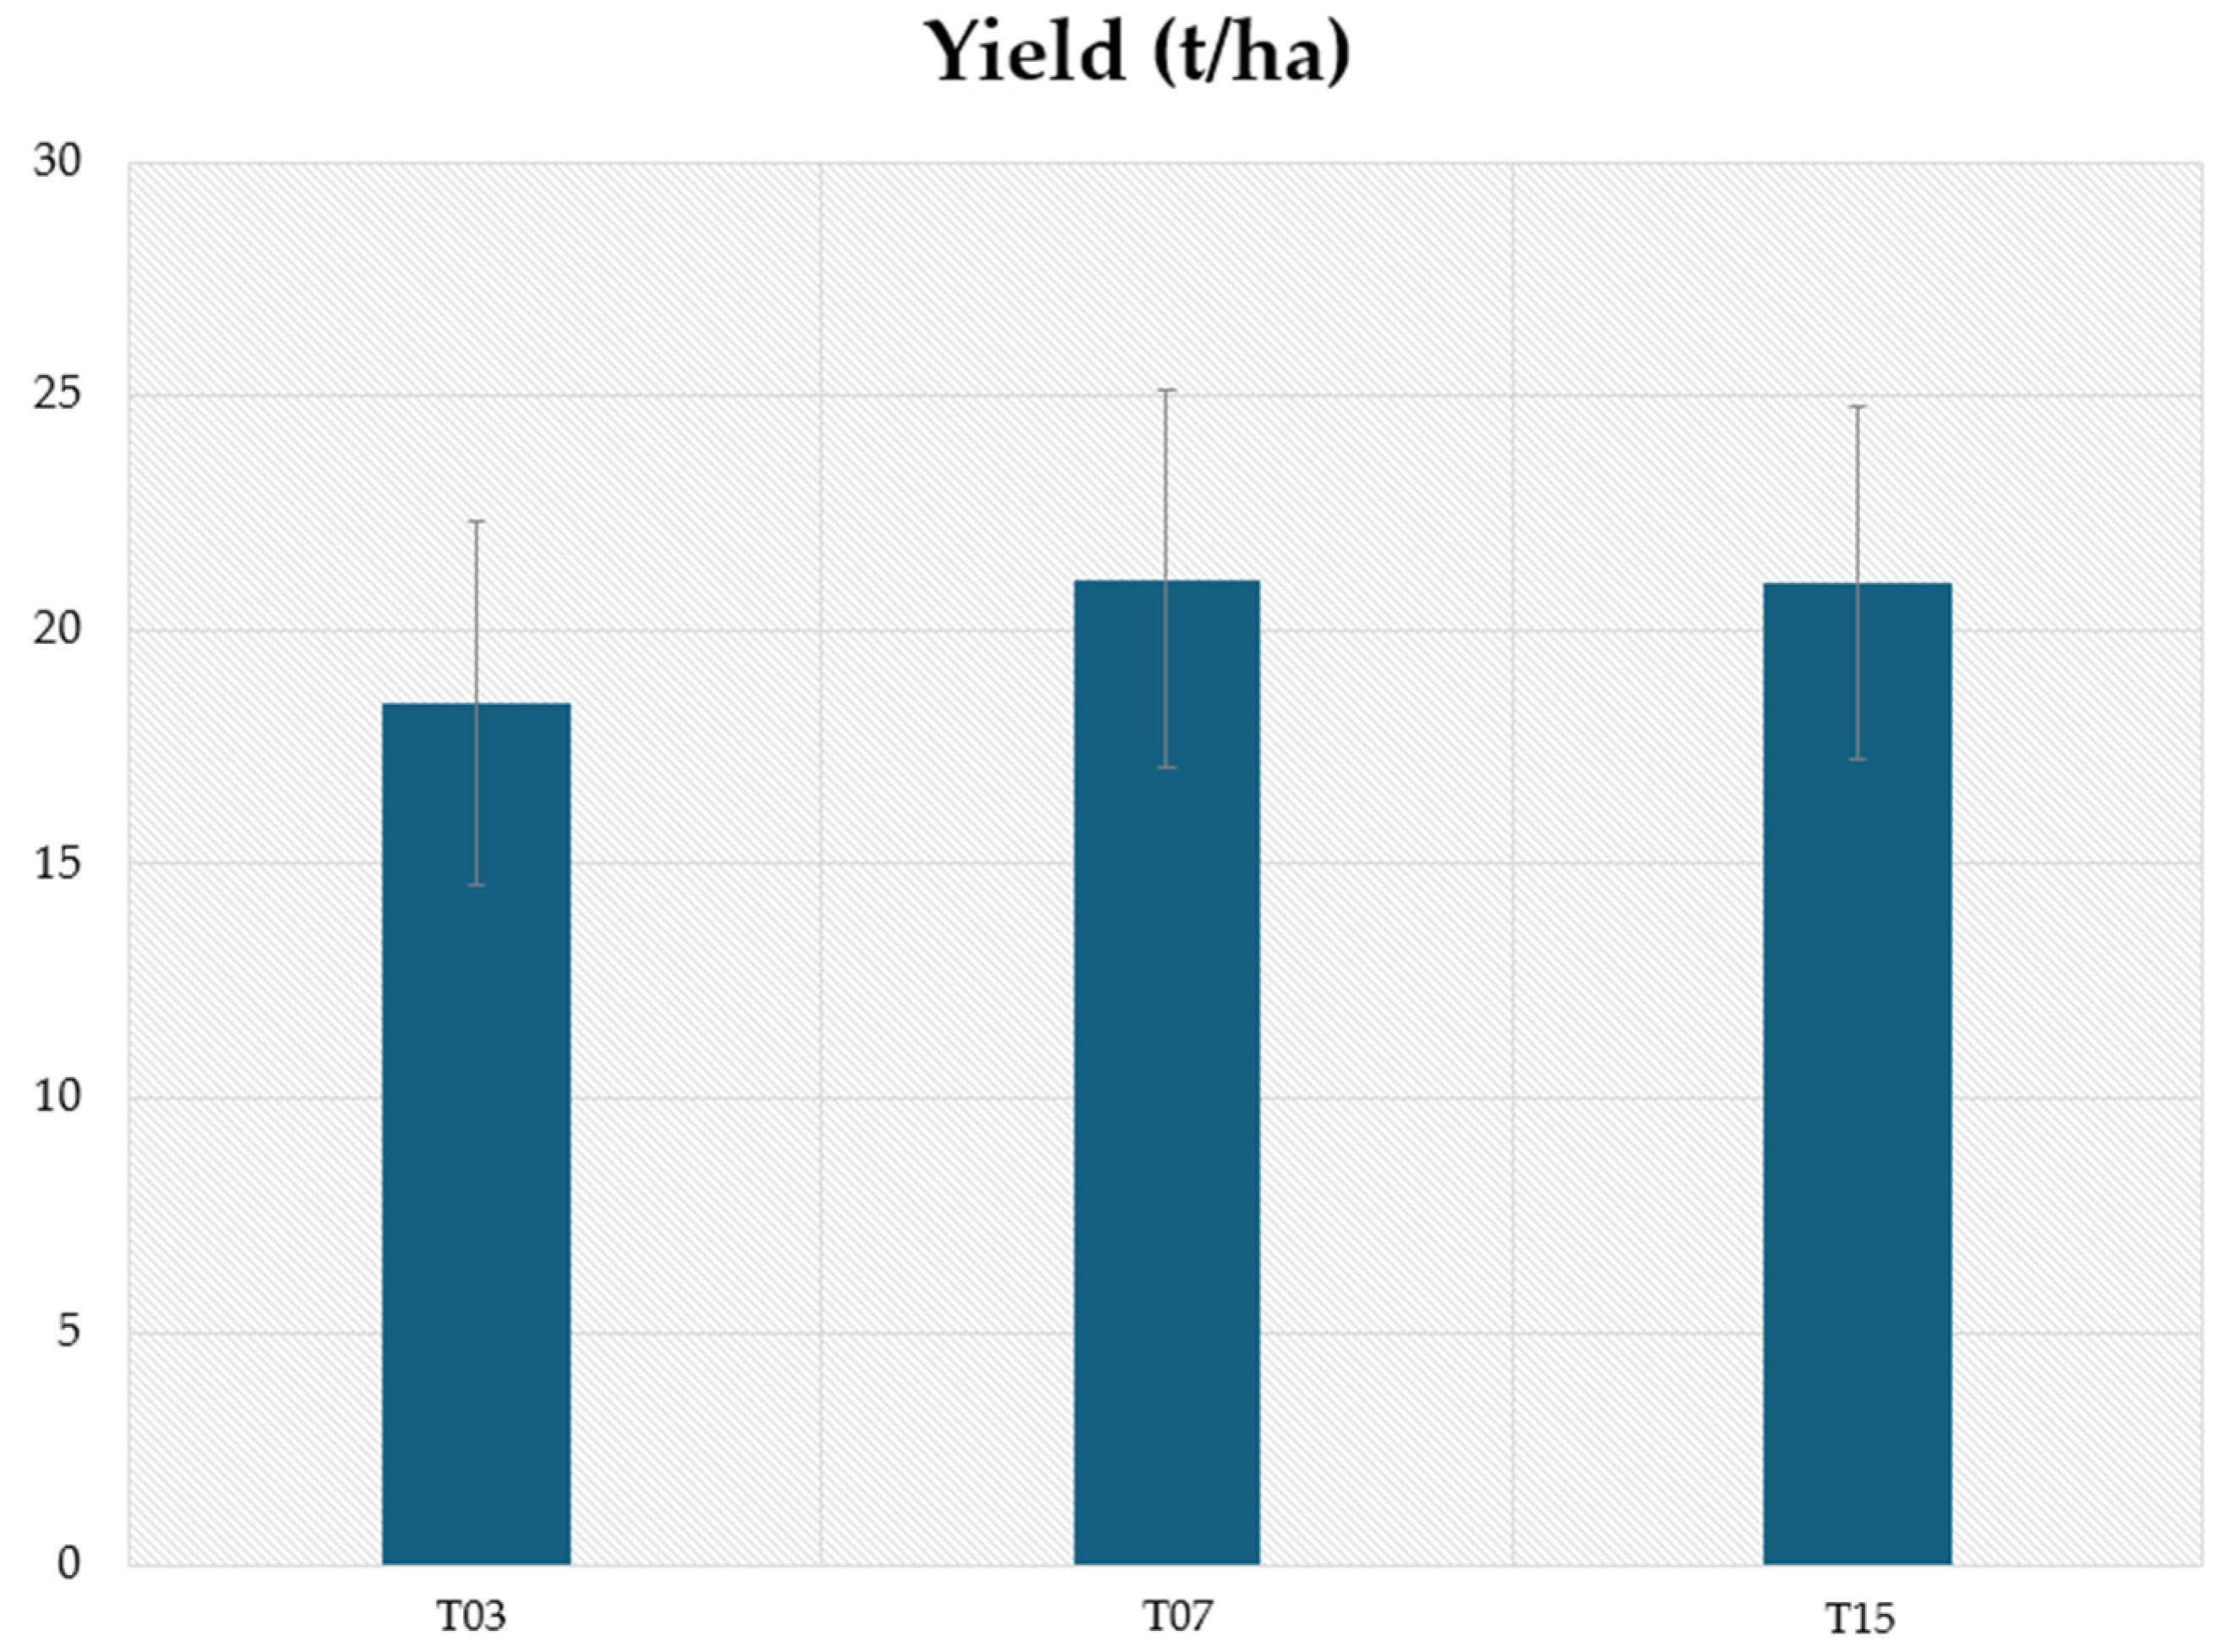
As for the yield analysis of each treatment, the data obtained are shown in Figure 4.

Figure 4.
Yield (t/ha) of irrigation treatment every 3 days (T03), every 7 days (T7), and every 15 days (T15).
As can be seen in Figure 4, there are no significant differences in yield between irrigation frequency treatments. Therefore, in the case of this research, irrigation frequency did not affect the yield obtained. The average values of the T07 and T15 treatments are slightly higher than the T03 treatment, but the difference is not significant. Thus, the differences between the evaporation and transpiration values shown in Table 4 and the stomatal conductance measurements in Figure 3 are not reflected in terms of production. Although T07 had higher evaporation and lower transpiration values, it did not have a lower yield. Likewise, the two other treatments (T03 and T15) had higher transpiration and lower evaporation values but did not obtain higher yields.
In another study in which the yield was analyzed according to irrigation frequency, no significant differences in yield were found between the majority of the tested varieties. Although a significantly lower yield was found for the Syrah variety in the T07 compared to the T03 treatment, in the rest of the varieties the differences were small and non-significant and varied according to variety, location, and year [18].
In other research, higher yields were obtained in two years when irrigation frequency was four days compared to two days when applying an ETo of 0.20. However, when an ETo of 0.40 was applied no significant differences were found between irrigation frequencies, suggesting that the effect of irrigation frequency is small [17].
In another study carried out on the tomato crop, better yields were obtained when applying a specific amount of water with shorter irrigation frequencies, as long as there was no waterlogging. The authors recommended shorter irrigation frequencies when water is available in less-than-optimal amounts [13].
In summary, the impact of irrigation frequency on soil wf in the present study was found to be significant, with higher wf values corresponding to higher amounts of applied water and to lower irrigation frequencies. This result concurs with those of the different studies cited above. Evaporation values as a percentage of ETc were found to be within the range reported in other studies. In addition, the T07 irrigation treatment was the least favorable compared to T15 and T03.
The difference between T07 and T15 coincides with some previous studies in vineyards cited above, in which more efficient results were obtained with lower frequencies. In this research, a positive efficiency was also obtained with T03, which could be due to the fact that small intervals without causing waterlogging can also make water efficiently available for the roots, as seen in previously cited studies. However, the differences between irrigation frequencies did not lead to significant changes in yield. This may be because one of the factors that can greatly affect yield is the amount of irrigation applied. It may be the case in the present study that in all the treatments the amount of water was greater than the crop needed, with the yield being similar despite each treatment losing different amounts of water to evaporation. This implies the need to evaluate the requirements of each crop in each local area.
The interaction between climatic factors, soil, varieties, crops, types of irrigation in terms of frequency and quantity, and agronomic strategies makes it difficult to predict or compare results. Nevertheless, such information can be considered important, inviting further research in this line and highlighting the importance of knowing irrigation efficiency results for different crops and in different areas.
4. Conclusions
The use of the TDR sensor allowed an in-field adjustment of the wf for the different tested irrigation frequencies, with higher wf values obtained with higher amounts of applied water in each irrigation event and lower irrigation frequencies. When irrigation was applied every 15 days, wf was higher (0.665) than when applied every 7 days (0.424) and every 3 days (0.127).
The SIMDualKc model allowed the calculation of evaporation and transpiration using the real wf measured in the field. The evaporation values obtained are within the range found in other studies. With the lowest irrigation frequency (T15 treatment), an evaporation value (expressed as a percentage of evapotranspiration) of 38.627% was obtained, which was lower than the 44.248% in the T07 treatment but higher than the 30.703% in the T03 treatment. As for transpiration, the plants with the lowest transpiration values were also irrigated every 7 days, followed by those irrigated every 15 days and those irrigated every 3 days. These transpiration results obtained with the SIMDualKc model concur with the data taken on plant stomatal conductance, with T07 values in this case generally lower than T03 and T15 values, but without clear differences between T03 and T15, depending on the day of measurement. These results are useful when considering the agronomic and soil characteristics contemplated in the present research. However, the widely varying results reported in other studies show that evaporation and transpiration can be affected by many factors, making them difficult to predict.
However, the differences described above are not reflected in the yield results for which no significant differences were found between the different irrigation frequencies. This may be due to all three irrigation frequency treatments providing sufficient total amounts of water for the crop. This may be attributed to the fact that the amount of irrigation influences crop yield, whereas the frequency of irrigation has not been demonstrated to affect yield, as indicated by some previous research. The combination of climatic factors, soils, crops, types of irrigation in terms of frequency and quantity, and agronomic strategies makes it difficult to predict results. Nonetheless, continuing with this line of research is important to determine more precisely how irrigation frequency affects vineyard yields and water use efficiency, in this way taking care of the environment, the economy, and therefore society. In this research, the SIMDualKc simulation model with wet fraction measured with a TDR sensor has been useful in finding differences in evaporation and transpiration between irrigation frequencies. However, these differences did not subsequently manifest themselves in yield. Further research with TDR sensors and SIMDualKc is encouraged to see the effect of irrigation frequency in other areas and ensure that water is always available to the crop as needed.
Author Contributions
Conceptualization, G.E.-S., C.C., D.U. and F.J.M.; methodology, G.E.-S., C.C. and D.U.; software, G.E.-S.; validation, C.C. and D.U.; formal analysis, G.E.-S.; investigation, G.E.-S., C.C., D.U. and F.J.M.; resources, D.U.; data curation, G.E.-S. and C.C.; writing—original draft preparation G.E.-S.; writing—review and editing C.C., G.E.-S., D.U. and F.J.M.; visualization, G.E.-S., C.C., D.U. and F.J.M.; supervision, C.C., D.U. and F.J.M.; project administration, G.E.-S., C.C. and D.U.; funding acquisition, G.E.-S., C.C. and D.U. All authors have read and agreed to the published version of the manuscript.
Funding
This research was funded by Project PID2019-105039RR-C41/MCIN/AEI /10.13039/501100011033 and the AGROS 2022 project, subsidized by the Regional Government of Extremadura co-financed by the ERDF, and the Ministry of Universities of Spain for University Professorship Training (FPU20/07314).
Data Availability Statement
The original contributions presented in the study are included in the article; further inquiries can be directed to the corresponding author.
Conflicts of Interest
The authors declare no conflicts of interest.
References
- Mirás-Avalos, J.; Araujo, E. Optimization of Vineyard Water Management: Challenges, Strategies, and Perspectives. Water 2021, 13, 746. [Google Scholar] [CrossRef]
- Medrano, H.; Tomás, M.; Martorell, S.; Escalona, J.-M.; Pou, A.; Fuentes, S.; Flexas, J.; Bota, J. Improving Water Use Efficiency of Vineyards in Semi-Arid Regions. A Review. Agron. Sustain. Dev. 2015, 35, 499–517. [Google Scholar] [CrossRef]
- Van Leeuwen, C.; Roby, J.; De Rességuier, L. Soil-Related Terroir Factors: A Review. OENO One 2018, 52, 173–188. [Google Scholar] [CrossRef]
- Romero, P.; Navarro, J.M.; Ordaz, P.B. Towards a Sustainable Viticulture: The Combination of Deficit Irrigation Strategies and Agroecological Practices in Mediterranean Vineyards. A Review and Update. Agric. Water Manag. 2022, 259, 107216. [Google Scholar] [CrossRef]
- Mancha, L.A.; Uriarte, D.; Valdés, E.; Moreno, D.; Prieto, M.d.H. Effects of Regulated Deficit Irrigation and Early Cluster Thinning on Production and Quality Parameters in a Vineyard Cv. Tempranillo under Semi-Arid Conditions in Southwestern Spain. Agronomy 2020, 11, 34. [Google Scholar] [CrossRef]
- Bouzas-Cid, Y.; Falqué, E.; Orriols, I.; Mirás-Avalos, J.M. Effects of Irrigation over Three Years on the Amino Acid Composition of Treixadura (Vitis vinifera L.) Musts and Wines, and on the Aromatic Composition and Sensory Profiles of Its Wines. Food Chem. 2018, 240, 707–716. [Google Scholar] [CrossRef] [PubMed]
- Balint, G.; Reynolds, A.G. Irrigation Level and Time of Imposition Impact Vine Physiology, Yield Components, Fruit Composition and Wine Quality of Ontario Chardonnay. Sci. Hortic. 2017, 214, 252–272. [Google Scholar] [CrossRef]
- Romero, P.; García García, J.; Fernández-Fernández, J.I.; Muñoz, R.G.; del Amor Saavedra, F.; Martínez-Cutillas, A. Improving Berry and Wine Quality Attributes and Vineyard Economic Efficiency by Long-Term Deficit Irrigation Practices under Semiarid Conditions. Sci. Hortic. 2016, 203, 69–85. [Google Scholar] [CrossRef]
- Intrigliolo, D.S.; Pérez, D.; Risco, D.; Yeves, A.; Castel, J.R. Yield Components and Grape Composition Responses to Seasonal Water Deficits in Tempranillo Grapevines. Irrig. Sci. 2012, 30, 339–349. [Google Scholar] [CrossRef]
- Ferreira, M.I.; Silvestre, J.; Conceição, N.; Malheiro, A.C. Crop and Stress Coefficients in Rainfed and Deficit Irrigation Vineyards Using Sap Flow Techniques. Irrig. Sci. 2012, 30, 433–447. [Google Scholar] [CrossRef]
- Santesteban, L.G.; Miranda, C.; Royo, J.B. Regulated Deficit Irrigation Effects on Growth, Yield, Grape Quality and Individual Anthocyanin Composition in Vitis vinifera L. Cv. ‘Tempranillo’. Agric. Water Manag. 2011, 98, 1171–1179. [Google Scholar] [CrossRef]
- Lavado, N.; Prieto, M.H.; Mancha, L.A.; Moreno, D.; Valdés, M.E.; Uriarte, D. Combined Effect of Crop Forcing and Reduced Irrigation as Techniques to Delay the Ripening and Improve the Quality of Cv. Tempranillo (Vitis vinifera L.) Berries in Semi-Arid Climate Conditions. Agric. Water Manag. 2023, 288, 108469. [Google Scholar] [CrossRef]
- Freeman, B.M.; Blackwell, J.; Garzoli, K. V Irrigation Frequency and Total Water Application with Trickle and Furrow Systems. Agric. Water Manag. 1976, 1, 21–31. [Google Scholar] [CrossRef]
- Montoro, A.; Mañas, F.; López-Urrea, R. Transpiration and Evaporation of Grapevine, Two Components Related to Irrigation Strategy. Agric. Water Manag. 2016, 177, 193–200. [Google Scholar] [CrossRef]
- Scholasch, T. Improving Winegrowing with Sap Flow Driven Irrigation—A 10-Year Review. Acta Hortic. 2018, 1222, 155–168. [Google Scholar] [CrossRef]
- Esteban-Sanchez, G.; Campillo, C.; Uriarte, D.; Moral, F.J. Technical Feasibility Analysis of Advanced Monitoring with a Thermal Camera on an Unmanned Aerial Vehicle and Pressure Chamber for Water Status in Vineyards. Horticulturae 2024, 10, 305. [Google Scholar] [CrossRef]
- Sebastián, B.; Baeza, P.; Santesteban, L.G.; Sánchez de Iguel, P.; De La Fuente, M.; Lissarrague, J.R. Response of Grapevine Cv. Syrah to Irrigation Frequency and Water Distribution Pattern in a Clay Soil. Agric. Water Manag. 2015, 148, 269–279. [Google Scholar] [CrossRef]
- Yuste, J.; Montoro, A.; Cancela, J.J.; Martínez-Porro, D.; Mancha, L.A.; Moreno, D.; Torija, I.; Rodríguez-Febereiro, M.; Vilanova, M.; Uriarte, D. Irrigation Frequency in Red Varieties: Impact on Grape Production and Composition, during a Biennial Period, in 4 Regions of Spain. BIO Web Conf. 2023, 68, 01004. [Google Scholar] [CrossRef]
- Allen, R.G.; Pereira, L.S.; Raes, D. Crop Evapotranspiration-Guidelines for Computing Crop Water Requirements-FAO Irrigation and Drainage Paper 56. FAO 1998, 300, D05109. [Google Scholar]
- Rallo, G.; Paço, T.A.; Paredes, P.; Puig-Sirera, À.; Massai, R.; Provenzano, G.; Pereira, L.S. Updated Single and Dual Crop Coefficients for Tree and Vine Fruit Crops. Agric. Water Manag. 2021, 250, 106645. [Google Scholar] [CrossRef]
- Rosa, R.D.; Paredes, P.; Rodrigues, G.C.; Alves, I.; Fernando, R.M.; Pereira, L.S.; Allen, R.G. Implementing the Dual Crop Coefficient Approach in Interactive Software. 1. Background and Computational Strategy. Agric. Water Manag. 2012, 103, 8–24. [Google Scholar] [CrossRef]
- Rosa, R.D.; Paredes, P.; Rodrigues, G.C.; Fernando, R.M.; Alves, I.; Pereira, L.S.; Allen, R.G. Implementing the Dual Crop Coefficient Approach in Interactive Software: 2 Model Testing. Agric. Water Manag. 2012, 103, 62–77. [Google Scholar] [CrossRef]
- Darouich, H.; Ramos, T.B.; Pereira, L.S.; Rabino, D.; Bagagiolo, G.; Capello, G.; Simionesei, L.; Cavallo, E.; Biddoccu, M. Water Use and Soil Water Balance of Mediterranean Vineyards under Rainfed and Drip Irrigation Management: Evapotranspiration Partition and Soil Management Modelling for Resource Conservation. Water 2022, 14, 554. [Google Scholar] [CrossRef]
- Gowdy, M.; Pieri, P.; Suter, B.; Marguerit, E.; Destrac-Irvine, A.; Gambetta, G.; van Leeuwen, C. Estimating Bulk Stomatal Conductance in Grapevine Canopies. Front. Plant Sci. 2022, 13, 839378. [Google Scholar] [CrossRef] [PubMed]
- Cancela, J.J.; Fandiño, M.; Rey, B.J.; Rosa, R.; Pereira, L.S. Estimating Transpiration and Soil Evaporation of Vineyards from the Fraction of Ground Cover and Crop Height -Application to “Albariño” Vineyards of Galicia. Acta Hortic. 2012, 931, 227–234. [Google Scholar] [CrossRef]
- Cancela, J.J.; Fandino, M.; Rey, B.J.; Martinez, E.M. Automatic Irrigation System Based on Dual Crop Coefficient, Soil and Plant Water Status for Vitis vinifera (Cv Godello and Cv Mencia). Agric. Water Manag. 2015, 151, 52–63. [Google Scholar] [CrossRef]
- Fandiño, M.; Cancela, J.J.; Rey, B.J.; Martínez, E.M.; Rosa, R.G.; Pereira, L.S. Using the Dual-Kc Approach to Model Evapotranspiration of Albariño Vineyards (Vitis vinifera L. Cv. Albariño) with Consideration of Active Ground Cover. Agric. Water Manag. 2012, 112, 75–87. [Google Scholar] [CrossRef]
- Silva, S.P.; Isabel Valin, M.; Mendes, S.; Araujo-Paredes, C.; Cancela, J.J. Dual Crop Coefficient Approach in Vitis vinifera L. Cv. Loureiro. Agronomy 2021, 11, 2062. [Google Scholar] [CrossRef]
- Zhao, P.; Kang, S.; Li, S.; Ding, R.; Tong, L.; Du, T. Seasonal Variations in Vineyard ET Partitioning and Dual Crop Coefficients Correlate with Canopy Development and Surface Soil Moisture. Agric. Water Manag. 2018, 197, 19–33. [Google Scholar] [CrossRef]
- Celette, F.; Ripoche, A.; Gary, C. WaLIS—A Simple Model to Simulate Water Partitioning in a Crop Association: The Example of an Intercropped Vineyard. Agric. Water Manag. 2010, 97, 1749–1759. [Google Scholar] [CrossRef]
- Campos, I.; Neale, C.M.U.; Calera, A.; Balbontín, C.; González-Piqueras, J. Assessing Satellite-Based Basal Crop Coefficients for Irrigated Grapes (Vitis vinifera L.). Agric. Water Manag. 2010, 98, 45–54. [Google Scholar] [CrossRef]
- Yunusa, I.A.M.; Walker, R.R.; Guy, J.R. Partitioning of Seasonal Evapotranspiration from a Commercial Furrow-Irrigated Sultana Vineyard. Irrig. Sci. 1997, 18, 45–54. [Google Scholar] [CrossRef]
- Bajpai, A.; Kaushal, A. Soil Moisture Distribution under Trickle Irrigation: A Review. Water Supply 2020, 20, 761–772. [Google Scholar] [CrossRef]
- He, H.; Aogu, K.; Li, M.; Xu, J.; Sheng, W.; Jones, S.B.; González-Teruel, J.D.; Robinson, D.A.; Horton, R.; Bristow, K.; et al. A Review of Time Domain Reflectometry (TDR) Applications in Porous Media. Adv. Agron. 2021, 168, 83–155. [Google Scholar] [CrossRef]
- He, H.; Zou, W.; Jones, S.B.; Robinson, D.A.; Horton, R.; Dyck, M.; Filipović, V.; Noborio, K.; Bristow, K.; Gong, Y.; et al. Critical Review of the Models Used to Determine Soil Water Content Using TDR-Measured Apparent Permittivity. Adv. Agron. 2023, 182, 169–219. [Google Scholar] [CrossRef]
- Uriarte, D.; Intrigliolo, D.S.; Mancha, L.A.; Picón-Toro, J.; Valdes, E.; Prieto, M.H. Interactive Effects of Irrigation and Crop Level on Tempranillo Vines in a Semiarid Climate. Am. J. Enol. Vitic. 2015, 66, 101–111. [Google Scholar] [CrossRef]
- Zhang, R.; Cheng, Z.; Zhang, J.; Ji, X. Sandy Loam Soil Wetting Patterns of Drip Irrigation: A Comparison of Point and Line Sources. Procedia Eng. 2012, 28, 506–511. [Google Scholar] [CrossRef]
- Singh, D.K.; Rajput, T.B.S.; Singh, D.K.; Sikarwar, H.S.; Sahoo, R.N.; Ahmad, T. Simulation of Soil Wetting Pattern with Subsurface Drip Irrigation from Line Source. Agric. Water Manag. 2006, 83, 130–134. [Google Scholar] [CrossRef]
- Scholasch, T.; Rienth, M. Review of Water Deficit Mediated Changes in Vine and Berry Physiology; Consequences for the Optimization of Irrigation Strategies. OENO One 2019, 53, 423–444. [Google Scholar] [CrossRef]

Disclaimer/Publisher’s Note: The statements, opinions and data contained in all publications are solely those of the individual author(s) and contributor(s) and not of MDPI and/or the editor(s). MDPI and/or the editor(s) disclaim responsibility for any injury to people or property resulting from any ideas, methods, instructions or products referred to in the content. |
© 2024 by the authors. Licensee MDPI, Basel, Switzerland. This article is an open access article distributed under the terms and conditions of the Creative Commons Attribution (CC BY) license (https://creativecommons.org/licenses/by/4.0/).