Article

Novel QTL Hotspots for Barley Flowering Time, Plant Architecture, and Grain Yield

by
Yuliya Genievskaya
1,
Vladimir Chudinov
2,
Saule Abugalieva
1,3 and
Yerlan Turuspekov
1,3,*
1
Laboratory of Molecular Genetics, Institute of Plant Biology and Biotechnology, Almaty 050040, Kazakhstan
2
Breeding Department, Karabalyk Agricultural Experimental Station, Nauchnoe 110908, Kazakhstan
3
Faculty of Biology and Biotechnology, Al-Farabi Kazakh National University, Almaty 050040, Kazakhstan
*
Author to whom correspondence should be addressed.
Agronomy 2024, 14(7), 1478; https://doi.org/10.3390/agronomy14071478
Submission received: 21 June 2024 / Revised: 3 July 2024 / Accepted: 5 July 2024 / Published: 8 July 2024

Abstract

:
Barley (Hordeum vulgare L.) is one of the oldest cultivated grains and remains a significant crop globally. Barley breeders focus on developing high-yield cultivars resistant to biotic and abiotic stresses. Barley’s flowering time, regulated genetically and by environmental stimuli, significantly impacts all of its agronomic traits, including the grain yield and plant architecture. This study aimed to detect the quantitative trait loci (QTLs) affecting these traits in 273 two-row spring barley accessions from the USA, Kazakhstan, Europe, and the Middle East across two regions of Kazakhstan, evaluating their impact on grain yield. Genotypic data were obtained from 26,529 segregating single-nucleotide polymorphisms (SNPs), and field trial data for 273 accessions, which were obtained for six traits (heading time, maturity time, vegetation period, plant height, peduncle length, and grain yield) in two regions of Kazakhstan over three growth years. As a result of a genome-wide association study (GWAS), 95 QTLs were identified for 6 agronomic traits, including 58 QTLs linked with candidate genes and/or QTLs. The remaining 37 QTLs were putatively novel, with 13 of them forming 3 QTL hotspots on chromosomes 1H (5 QTLs in the interval of 13.4–41.4 Mbp), 3H (4 QTLs in 608.6–624.9 Mbp), and 6H (4 QTLs in 553.8–572.8 Mbp). These hotspots were pleiotropic, and targeting these regions would allow breeders to enhance multiple yield-associated traits.

1. Introduction

Barley (Hordeum vulgare L.) is one of the oldest cultivated grains in the world, with a history dating back thousands of years. As a cultural crop, barley originated in the Fertile Crescent, and it was one of the first domesticated cereal grains [1,2]. Barley became a staple food source for many early civilizations, including Mesopotamia, Egypt, Greece, Rome, and China [2]. It provides essential carbohydrates, protein, and fiber [3]. Its drought tolerance makes it adaptable to various climates, further solidifying its importance. Modern barley is a significant agricultural crop cultivated in many countries worldwide. According to the FAO, global barley production is stable, with around 155 million tons per year during the period of 2020–2022 (www.fao.org/faostat/, accessed on 29 May 2024). In Kazakhstan, barley is the second largest cereal crop after wheat, with an annual production volume of about 1.5 million tons (https://stat.gov.kz/en/, accessed on 29 May 2024). It is primarily grown as a feed grain for livestock, particularly for poultry, swine, and dairy cattle. Barley grain’s high nutritional value and digestibility make it a popular choice for animal feed (about 70% of the global barley production), the production of malt, and the human diet (5–10%) [3].
A top priority for barley breeders is developing new cultivars that combine high yield with resistance to biotic and abiotic stresses and desired grain quality characteristics. It is important to focus on major adaptation and plant architecture traits to achieve this goal. One of these key traits is flowering time, which is crucial for plant life cycle completion, consequently impacting all other traits, including grain yield [4]. Flowering time primarily affects whole vegetation and two important agronomic traits of barley—the heading time and the period from heading to full grain ripening [5]. Flowering initiation marks the transition from vegetative growth to the reproductive stage, primarily led by environmental stimuli, such as the day length (photoperiod), prolonged exposure to cold temperatures (vernalization), and earliness per se (influencing the time of flowering regardless of environmental effects) [4,6]. In barley, the photoperiod activates Ppd-H1 (HvPRR37), a PSEUDO-RESPONSE REGULATOR 7 (PRR7) gene located on chromosome 2H [7], which then, through the mediation of CONSTANS (CO), promotes the expression of the floral inducer Vrn-H3 (HvFT1, chromosome 7H) [8]. Conversely, Vrn-H2 (HvZCCTa-c, chromosome 1H), a zinc-finger CONSTANS, CO-like, and TOC1 zinc finger-CCT domain protein (ZCCT1), acts as a suppressor of Vrn-H3 (HvFT1) [9]. Vrn-H2 (HvZCCTa-c), in turn, is inhibited by Vrn-H1 (HvBM5A, chromosome 5H), an APETALA1 family MADS-box transcription factor [10], which is upregulated during vernalization. Consequently, Vrn-H3 (HvFT1) inhibition is lifted after vernalization, leading to flowering induction. This vernalization requirement distinguishes winter barley from spring barley. Spring barley lacks the Vrn-H2 (HvZCCTa-c) gene. The major one among the earliness per se genes is eam6/eps2 (HvCEN, chromosome 2H). Due to its independence from environmental cues, the allelic variants of HvCEN have enabled barley to adapt to new conditions by regulating its flowering time [11].
Despite the characterization and cloning of several crucial regulatory genes related to flowering time in cereals over the past two decades [5,12,13], our understanding of the genetic makeup of flowering time regulation in temperate cereals remains limited. According to the literature, many studies have been conducted to detect the quantitative trait loci (QTLs) associated with flowering time in barley using a genome-wide association study (GWAS) approach. For example, Alqudah and coauthors [14] identified QTLs for heading time using photoperiod-sensitive barley accessions and accessions with reduced photoperiod sensitivity. The study used the first barley nested association mapping (NAM) population and suggested that the flowering time in barley is primarily determined by large-effect QTLs and epistatic interactions [15]. Another GWAS uncovered significant associations with the heading date on chromosome 2H and yield on chromosome 5H in the Mediterranean region [16]. A large-scale study of an Australian barley collection detected 113 genes associated with the flowering time in barley with gene–phenotype association analysis [17]. Finally, the usage of spring barley MAGIC DH lines resulted in 18 QTLs for the flowering time and 2420 epistatic interactions [18]. A previously unknown flowering-delaying QTL allele was located on chromosome 1H [18]. Still, since the effect of flowering genes depends on the environment, the use of new genetic material in new environments may lead to the discovery of new QTLs for the flowering time.
Despite its high significance in the plant life cycle, flowering also affects plant architecture traits—the height and peduncle lengths, which play important roles in plant adaptation, such as resistance stem lodging [19], drought resistance [20], and grain yield [21]. However, the plant height in cereals is mainly controlled by members of the Rht gene family [22], which regulate gibberellin biosynthesis and signal transduction [23]. In addition, more than 30 dwarfing and semi-dwarfing genes and loci have been identified for barley, including breviaristatum (ari), brachytic (brh), dense spike (dsp), erectoides (ert), semi-dwarf (sdw), slender1 (sln1), slender dwarf (sld), and semibrachytic (uzu) [24]. Unfortunately, not all of them are used in breeding due to their negative pleiotropic effect [25]. However, many articles have reported GWAS results and new QTLs associated with barley plant architecture traits [26,27,28,29]. Barley grain yield is a complex trait influenced by both genetic [22,30] and environmental factors [31,32]. Genetic factors include the abovementioned flowering time and plant architecture traits. For example, the genes Ppd-H1 and HvCEN were reported to be related to grain size and grain weight performance [33], and the Rht gene showed a pleiotropic effect, causing an increased number of grains per spike [34].
The aim of this study was to detect QTLs underlying the natural variation in barley flowering-associated traits and plant architecture traits and to investigate their effect on grain yield under field conditions in northern and south-eastern Kazakhstan, the two key regions for barley growth in the country. For this purpose, 273 two-row spring barley accessions with different geographical origins were studied in 2020, 2021, and 2022 in two regions of Kazakhstan to gather data on the flowering traits, plant architecture traits, and grain yield.

2. Materials and Methods

2.1. Germplasm Material and Phenotypic Assessment

The 273 studied two-row spring barley accessions originated from the USA (n = 142), Kazakhstan (n = 86), European countries (n = 31), Africa (n = 9), and Middle Eastern countries (n = 5) (Table S1). The seed material of the barley from the USA was selected from the barley Coordinated Agricultural Project (CAP) [35] and provided by Dr. Thomas Blake. Part of the germplasm material from Kazakhstan was obtained from six breeding organizations [36,37]. The seeds of the barley accessions of European, African, and Middle Eastern origin were provided by the National Bioresource Project of Japan [38]. Previously, this germplasm material was used in a GWAS for the grain quality traits [39] and powdery mildew resistance [38] of barley in Kazakhstan. The current experiment was carried out in two geographical points: the field of the Karabalyk Agricultural Experimental Station (KAES, Nauchnoe village, northern Kazakhstan, 53°51′07″ N and 62°06′12″ E), and the field of the Kazakh Research Institute of Agriculture and Plant Growing (KRIAPG, Almalybak village, south-eastern Kazakhstan, 43°14′03″ N and 76°42′00″ E) in 2020, 2021, and 2022. The KAES and KRIAPG are the two leading regional barley breeding institutions in the country, and they have extensive experience in field research. The field design followed a randomized block design (RBD), with two rows of plots and two replications. Each plot was 1 m2 and planted with 100 barley seeds. The amount of precipitation and the average temperature per plant growth stage for three years were recorded at both experimental fields.
Six traits were evaluated, including the heading time (HT, days), heading–maturity time (HMT, days), vegetation period (VP, days), plant height (PH, cm), peduncle length (PL, cm), and grain yield per m2 (YM2, g/m2). In each experimental plot, the HT was the number of days from seedling emergence to the heading of 50% of plants in a plot, the HMT was the number of days from the heading to the seed ripening stage of 50% of the plot, and the VP was the number of days from the seedling emergence to the seed ripening stage of 50% of a plot (HT+HMT). The PH, PL, and YM2 were measured using standard protocols of field experiments [40].

2.2. Statistical Analysis of Phenotyping Data

The phenotypic data were analyzed using the R version 4.4.0 statistical environment (www.R-project.org, accessed on 12 April 2024) and RStudio version 2024.04.0-735 software (www.rstudio.com, accessed on 12 April 2024), including descriptive statistics, boxplot construction (package ggplot2 [41]), Pearson correlation (package corrplot [42]), and ANOVA. The Pearson correlation coefficients (r) were categorized into four groups according to their strength: r < 0.25—weak, 0.25 ≤ r < 0.50—moderate, 0.50 ≤ r < 0.75—strong, and r ≥ 0.75—very strong. The H2 was calculated for each trait and defined as the ratio of total genetic variance to total phenotypic variance: H2 = VG/VP.

2.3. SNP Genotyping, Population Structure Analysis, and LD Decay

Genomic DNA was extracted from the individual 5-day seedling of each barley accession using a modified CTAB protocol [43]. Then, it was purified, quantified, and sent to the TraitGenetics company (TraitGenetics GmbH, Gatersleben, Germany) for SNP genotyping. A total of 273 accessions of spring barley were genotyped using a 50k Illumina Infinium iSelect genotyping array [44].
Five methods were used for the analysis of the population structure in the studied barley germplasm collection: the Bayesian clustering approach with Markov Chain Monte Carlo (MCMC) estimation and admixture-based clustering, neighbor-joining (NJ) clustering, principal component analysis (PCA), kinship analysis, and principal coordinate analysis (PCoA). STRUCTURE 2.3.4 [45] was used for Bayesian clustering with admixture. The population size K value ranged from 1 to 10, with 3 iterations, a burn-in period of 100,000, and 100,000 MCMC replications. Web-based program Clumpak [46] was used to determine the optimal K value in the studied barley collection based on the Delta-K values. TASSEL version 5.0 [47] was used for the neighbor-joining (NJ) clustering with the visualization in iTOL version 6 [48]. A heatmap of the kinship matrix was estimated using the GAPIT v3 package for R. R packages amap (www.CRAN.R-project.org/package=amap, accessed on 18 April 2024), base (www.CRAN.R-project.org/package=base, accessed on 18 April 2024), stats (www.CRAN.R-project.org/package=stats, accessed on 18 April 2024), and ggplot2 were used for the PCA and PCoA and to plot the results.
Estimation of the LD for each chromosome and for the whole genome in the 273 spring barley germplasms was performed in TASSEL 5.0, and it was estimated and visualized at r2 = 0.1 using the R packages genetics (www.CRAN.R-project.org/package=genetics, accessed on 20 April 2024) and stats.

2.4. Genome-Wide Association Analyses

The GWAS approach was used to perform phenotype–genotype association analysis of the 6 phenotypic traits in the spring barley germplasm collection. The GWAS was conducted using the Hapmap datafile of SNPs and the observed phenotypic traits. The GAPIT v3 package for R with a multiple-locus mixed linear model (MLMM) [49] was used to determine the marker–trait associations (MTAs) using the incorporated PCA.total = 3 and kinship matrices. The GWAS were performed separately for the 2020, 2021, and 2022 data from KAES and KRIAPG. The Bonferroni correction threshold (p < 3.77 × 10⁻⁶) and FDR-adjusted p-values using the H&B method (p < 0.05) should be used as the standard cutoff in GWAS analysis. Due to the linkage imbalance among markers, these threshold lines often produce false negative results [50]. Thus, the p-value’s threshold was adjusted to 1.00 × 10⁻³ in order to consider all possible associations. The rMVP package [51] for R was used to construct quantile–quantile (Q-Q) and Manhattan plots.

2.5. Candidate Gene/QTL Identification

SNPs that were associated with the same trait, positioned within the LD block, and meeting the threshold of p < 1.00 × 10⁻³ were merged into one QTL with the lowest p-value among the linked SNPs. The positions of putative candidate genes associated with barley flowering time [17], plant height [25], and some physiological processes [52] and QTLs [17,53,54,55] were compared with the newly identified QTLs and positioned on the map.
MapChart version 2.32 software [56] was used to construct a physical barley map, including the newly identified QTLs and genes associated with barley flowering time, plant height, and some physiological processes.

3. Results

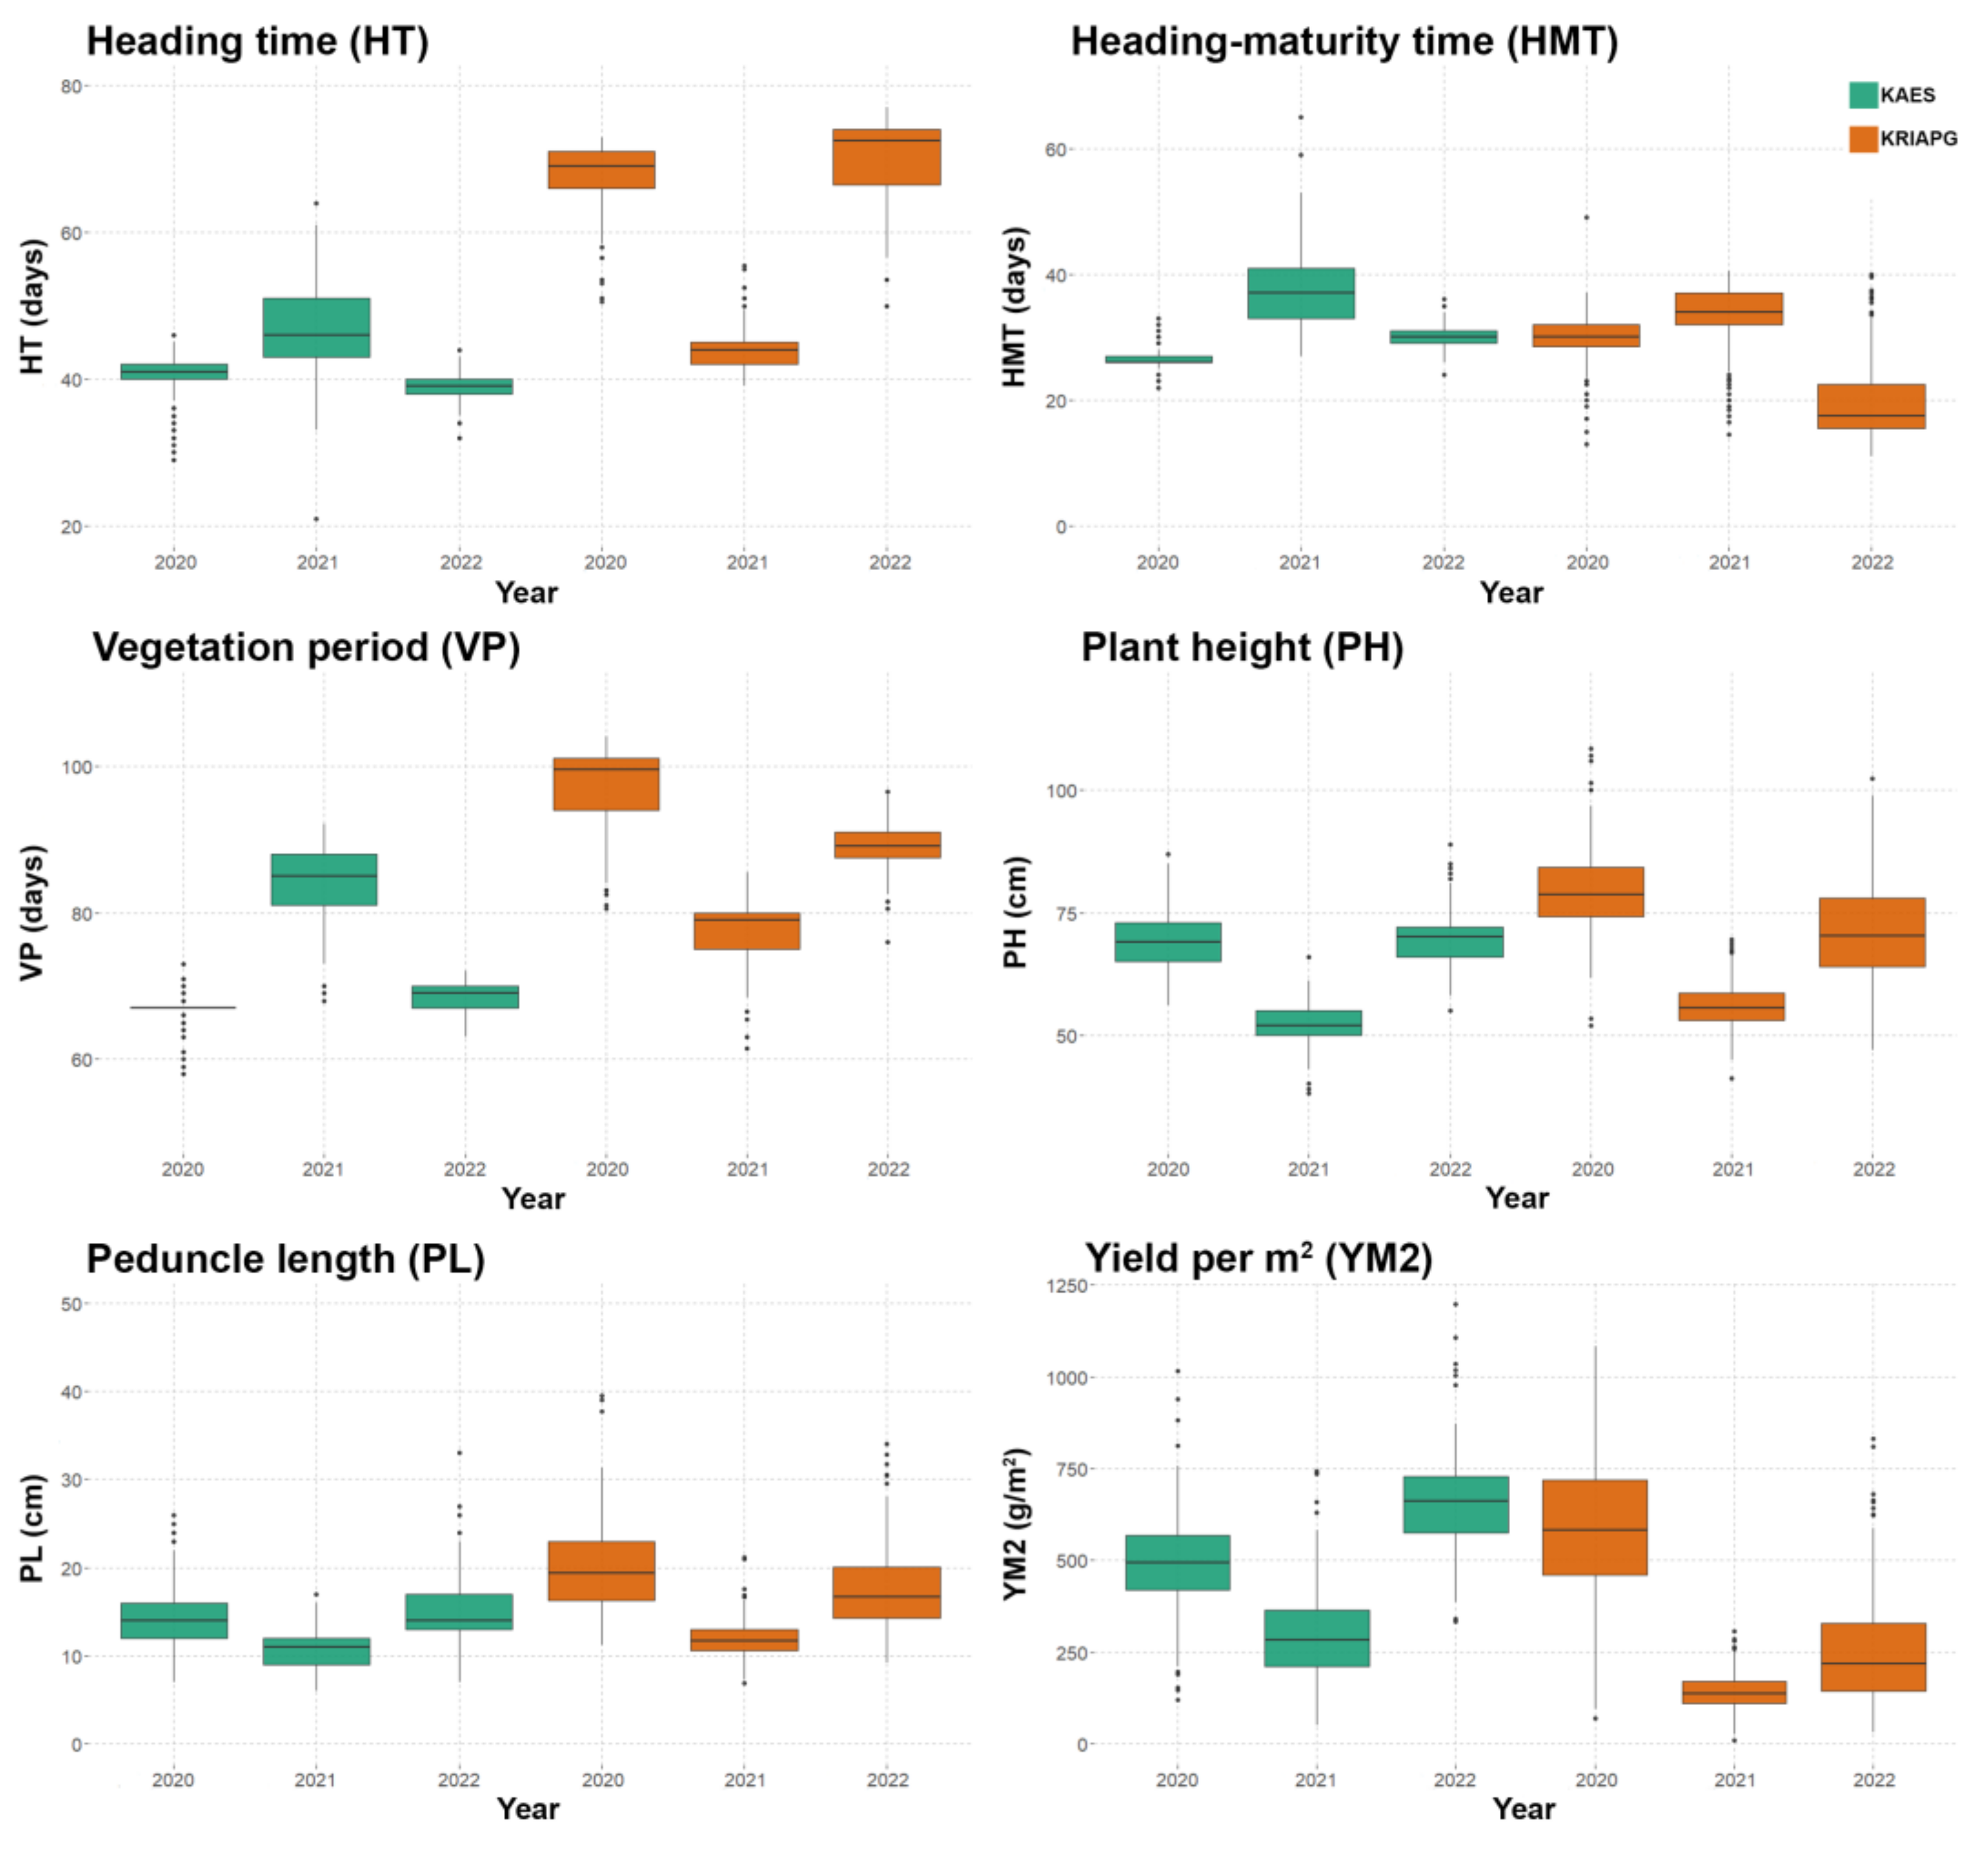
3.1. Phenotypic Traits Evaluation

A total of 273 two-row spring barley accessions were evaluated under the field conditions of two breeding institutions over three years (Figure 1). At KAES, over three years of experiments, the highest temperature and the smallest amount of precipitation were recorded in 2021, while in 2020 and 2022, these parameters varied from growth stage to growth stage (Figure 1A). At KRIAPG, 2021 also had the highest temperature and the least precipitation compared to 2020 and 2022 (Figure 1B).
Six traits related to plant adaptation, plant architecture, and yield were assessed at KEAS and KRIAPG. The germplasm collection displayed all the phenotypic variations of these six traits (Figure 2, Table S2). The HT at KAES varied from 21 to 64 days during the three years of experiments, with a mean value of 41.9 ± 5.5 days; at KRIAPG, the HT ranged from 39 to 77 days, with a mean value of 60.2 ± 12.6 days (Table S2). The CV of HT per year ranged from 5.3% (KAES 2022) to 13.2% (KAES 2021). The HMT demonstrated ranges of 22–65 days (mean = 31.3 ± 5.5 days) at KAES and 11–49 days (mean = 27.6 ± 7.6 days) at KRIAPG over three years, with the CV ranging from 5.4% (KAES 2020) to 31.4% (KRIAPG 2022) (Table S2). Over the three years, the VP at KAES ranged from 58 to 92 days (mean = 73.2 ± 8.5 days). Similarly, at KRIAPG, the VP varied between 61.5 and 104 days (mean = 87.8 ± 9.4 days). The CV of the VP ranged from 3.1 (KAES 2022) to 6.5 (KRIAPG 2021) (Table S2). Regarding the plant architecture traits, at KAES, the PH varied between 38.0 and 89.0 cm, with a mean value of 63.7 ± 9.6 cm. At KRIAPG, this trait ranged from 41.2 to 108.5 cm (mean = 68.8 ± 12.5 cm). The PH’s CV demonstrated a range from 7.4% (KAES 2022) and 13.7% (KRIAPG 2022) (Table S2). The PL at KAES ranged from 6.0 to 33.0 cm over the three years, averaging 13.3 ± 3.7 cm. At KRIAPG, the PL varied between 6.9 and 39.5 cm, with a mean of 16.6 ± 5.3 cm. The CV values of PL varied from 17.2% (Supplementary Table S2). Finally, the grain yield (YM2) was between 49.0 and 1197.0 g/m2 at KAES and between 8.8 and 1082 g/m2 at KRIAPG; mean YM2s values of 481.1 ± 193.1 g/m2 and 326.7 ± 238.9 g/m2, respectively, were recorded over the three years. The CV of YM2 was between 19.9% (KAES 2022) and 60.0% (KRIAPG 2022) (Table S2). These results indicate that a few agronomic traits of barley were stable across regions and years, but most had sufficient variability for the GWAS.
Statistical analysis using ANOVA indicated a strong dependence between the region of cultivation and all studied traits (the p-values ranged from 2.11 × 10⁻²¹ to 2.12 × 10⁻¹³) (Table 1). However, the broad-sense heritability (H2) values varied from 4.4% for VP to 31.1% for PL, indicating the presence of the genotype’s impact on the manifestation of the six studied traits.
Average correlation coefficients (r) over three years among six studied traits at KEAS and KRIAPG are shown in Figure 3. At KAES, the HT showed a strong negative correlation with HMT, a moderate negative correlation with the PL, and a very strong positive correlation with the VP. The VP was also moderately negatively correlated with the PL and weakly positively correlated with the YM2. The PH also showed a moderate positive correlation with the YM2 and a strong positive correlation with the PL. At KRIAPG, all studied traits demonstrated correlations with each other, except for the VP and YM2 (Figure 3). At this site, the HT showed a strong negative correlation with the PH and PL, a moderate negative correlation with the HMT and YM2, and a very strong positive correlation with the VP. The HMT demonstrated weak positive correlations with the VP, PH, and PL, and a moderate positive correlation with the YM2. Moderate and strong positive correlations were observed between the VP and PH and between the VP and PL. The PH showed a very strong positive correlation with the PL and a moderate positive correlation with the YM. The PL was also moderately positively correlated with the YM2. Thus, stable positive correlations were observed between the HT and VP, the PH and PL, and the PH and YM2 (Figure 3). Stable negative correlations were found between the HT and HMT, the HT and PL, and the VP and PL (Figure 3).

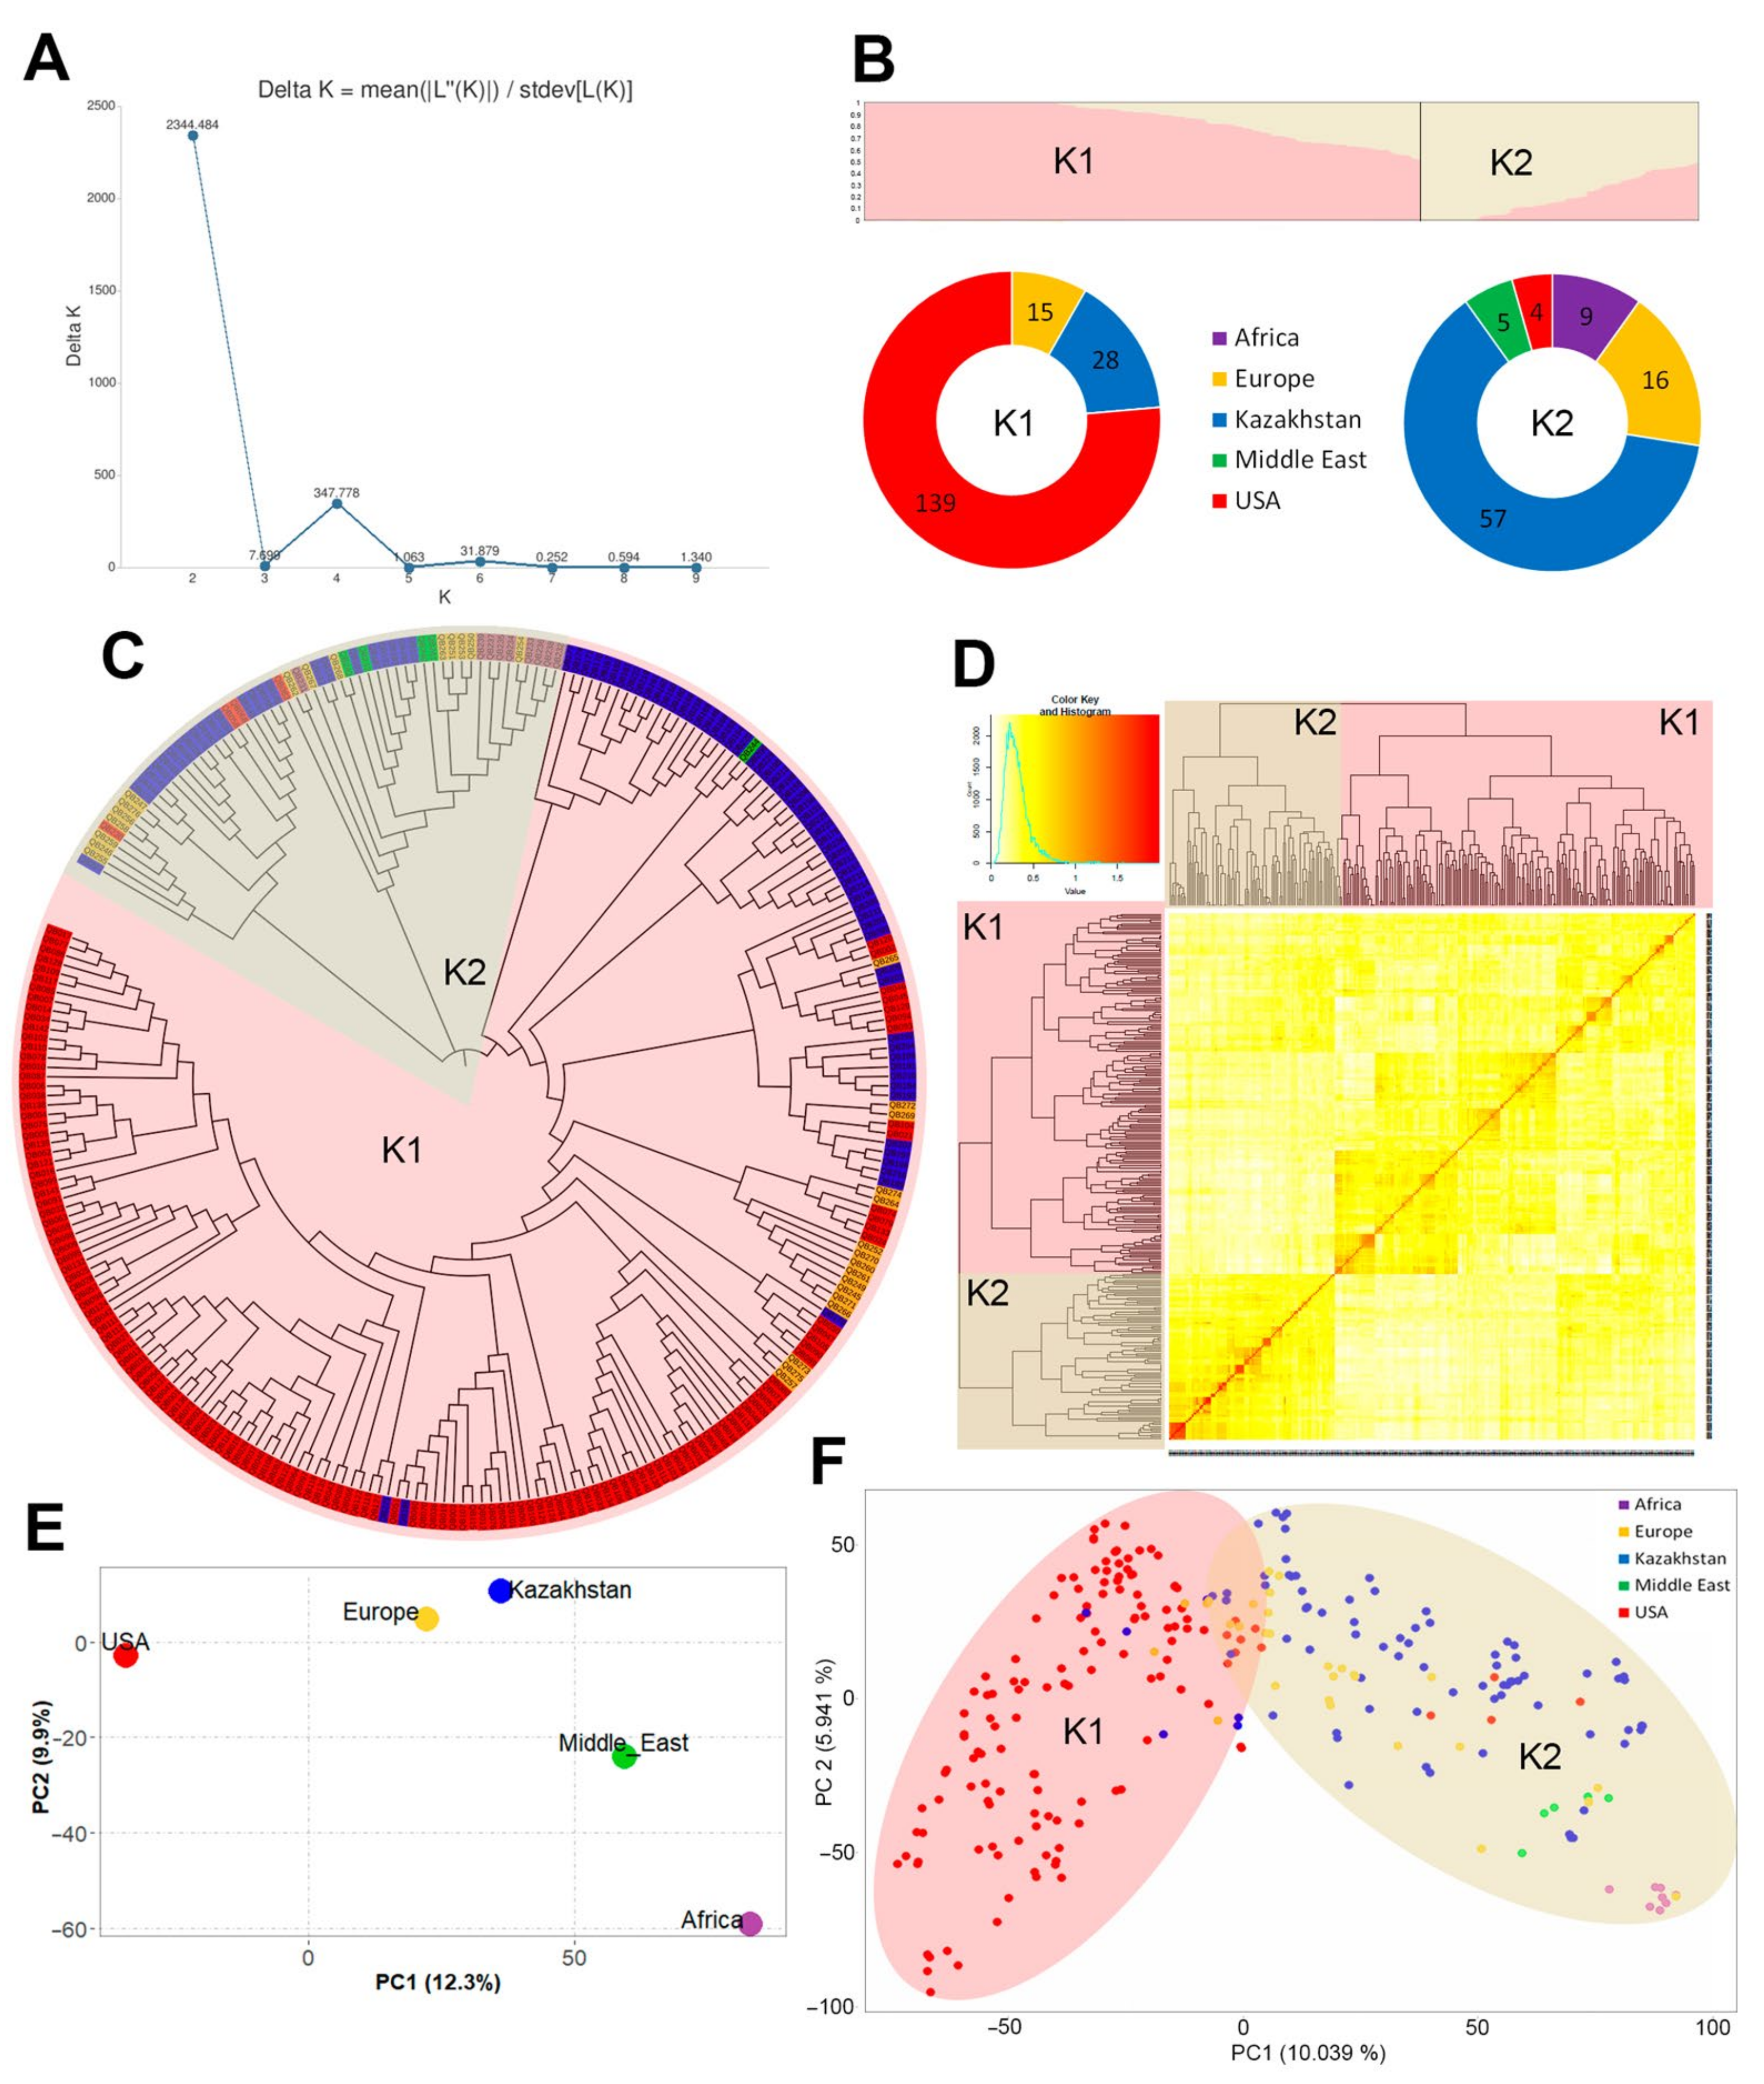
3.2. Genotyping and Population Structure of Studied Barley Germplasm Collection

SNP genotyping with 50k Illumina Infinium iSelect genotyping arrays resulted in 44,040 markers. A total of 26,529 high-quality SNPs were obtained for the subsequent analysis after filtering by missing data ≤ 0.2 and minor allele frequency (MAF) ≥ 0.1. All markers were evenly distributed throughout the seven chromosomes, with 1445 SNPs with unknown positions (Figure 4).
The total genome size based on the SNP genotyping results was about 4.54 Gb (Figure 4). The largest number of polymorphic SNPs and the smallest average spacing (147.9 Kb) was found for chromosome 5H, while chromosome 4H demonstrated the smallest number of SNPs, with the largest average spacing of 240.1 Kb. High-quality polymorphic SNPs were used for the subsequent population structure analysis and GWAS.
Five methods were used to determine the population structure and evolutionary relationships among the 273 two-row spring barley accessions of different geographical origins: Bayesian clustering with MCMC, NJ, kinship, PCoA, and PCA (Figure 5).
As shown in Figure 5A,B, according to the Bayesian clustering, there were two clusters (K1 and K2), and the K1 comprised 66.7% of all accessions, most of which came from the USA. In addition to barley cultivars and lines from the USA, the K1 also included half of the European and about one-third of Kazakhstan’s accessions (Figure 5B). The K2 comprised the remaining two-thirds of the germplasm from Kazakhstan, half of the European ones, and all African and Middle Eastern barleys (Figure 5B). The clustering of all individuals in each population was relatively strong. Two major clusters were found according to the NJ tree (Figure 5C), kinship (Figure 5D), and PCA (Figure 5F). However, according to the NJ tree and kinship, the combinations of individuals in clusters differed from the STRUCTURE results. The K1 included the same 139 USA and 16 European accessions as it did in STRUCTURE’s K1, but also 70.5% of Kazakhstan’s barley germplasm and 1 accession from the Middle East (Figure 5C). The K2 was smaller than STRUCTURE’s K2 and included the remaining USA, Kazakh, European, and Middle Eastern germplasm in both the NJ tree and the kinship heatmaps (Figure 5C,D). The marker-based kinship revealed that almost all of the kinship coefficients were below 0.5, with the peak at 0.25, indicating that most accessions had weak genetic relationships with each other, except for K2, where the kinship coefficients were above 0.5 (Figure 5D). The first two principal components on the PCA plot explain 10.0% and 5.9% of the total variance (Figure 5F). These principal components show the presence of the same two clusters but with a relatively continuous distribution, where two clusters smoothly transitioned into each other along PC1 (Figure 5F). The PCoA’s components explain 12.3% and 9.9% of the total genetic variance and suggested the genetic closeness of the European and Kazakh barley germplasm, as well as the relatively large genetic distance between the USA and African accessions in the current collection (Figure 5E).

3.3. Genome-Wide Association Analysis

The estimated r2 values for all pairs of linked SNP loci were used to assess the extent of LD decay in the current study. As expected, the r2 value decreased as the physical distance between markers increased (Figure S1). The minimal genome-wise distance between linked SNPs at r2 = 1 was 2,148,968 bp. The chromosome-wise LD distances were as follows: 1H—1,758,991 bp, 2H—1,858,567 bp, 3H—2,576,719 bp, 4H—2,144,236 bp, 5H—1,227,282 bp, 6H—10,973,587 bp, and 7H—3,436,352 bp (Figure S1), resulting in more accurate QTL formation based on an LD block.
Using an MLMM model with correction based on kinship as the K-matrix and PCA.total = 3 as the Q-matrix, a GWAS was performed for the six agronomic traits separately for KAES and KRIAPG and each of the three years. The false-positive rate of the GWAS was controlled according to the Q-Q plots, which show that the expected value was roughly equal to the observed value (red line) after controlling for Q and K (Table S3). A total of 177 significant MTAs with p < 1× 10⁻³ were detected for KRIAPG 2020, 140 MTAs were found for KRIAPG 2021, and 317 MTAs were identified for KRIAPG 2022 (Table S4). For KAES, 137 MTAs were detected for 2020, 151 MTAs for 2021, and 112 MTAs for 2022 (Table S4). SNPs associated with the same trait and linked to each other were merged into one QTL, with the p-value and the effect of the most significant SNP. The year and experimental field were considered individual environments. A total of 95 significant QTLs were identified for 6 traits on all 7 chromosomes in all environments, including 23 QTLs in 1 environment, 43 QTLs in 2 environments, 22 QTLs in 3 environments, 5 QTLs in 4 environments, and 2 QTLs for 5 environments (Table S4). All 95 QTLs, along with known genes associated with barley flowering time, plant height, and some physiological processes, were positioned on a physical map (Figure 6 and Figure 7). QTLs significant in 2–3 environments were considered stable ones, and QTLs significant in 4–5 environments were considered highly stable. The distribution of QTLs by traits was as follows: HT—18 QTLs, HMT—21 QTLs, VP—22 QTLs, PH—8 QTLs, PL—14 QTLs, and YM2—12 QTLs (Figure 6 and Figure 7, Table S4).
Out of a total of 18 QTLs for the HT, the most significant (p < 1× 10⁻⁵) were QTL_HT_04 (chromosome 2H) and QTL_HT_16 (chromosome 6H) (Table S4). Among the QTLs for the HMT, the highest significance (p < 1× 10⁻⁴) was observed for QTL_HMT_02, QTL_HMT_03 (both on chromosome 1H), QTL_HMT_08, QTL_HMT_10 (both on chromosome 3H), and QTL_HMT_19, QTL_HMT_21 (both on chromosome 7H). The most significant QTLs (p < 1 × 10⁻⁴) for the VP were found on chromosomes 1H (QTL_VP_04), 2H (QTL_VP_05 and QTL_VP_06), 3H (QTL_VP_09), and 7H (QTL_VP_21). For the PH, the most significant (p < 1 × 10⁻⁴) were QTL_PH_05 (chromosome 5H) and QTL_PH_07 (chromosome 6H). The most significant QTLs for the PL with p = 1.45 × 10⁻¹⁰ was identified on chromosome 1H (QTL_PL_02). Finally, among the QTLs for the YM2, QTL_YM2_07, with the highest significance (p = 3.10 × 10⁻¹⁰), was detected on chromosome 3H.

3.4. Candidate Gene Identification

To assess the putative candidate genes and/or QTLs, the physical positions of 95 newly identified QTLs were compared using the LD values per chromosome with the physical positions of the genes and QTLs associated with flowering time, plant architecture, and yield of barley found in the literature and databases (Table S5). As a result, for 58 QTLs, we identified candidate genes and/or QTLs, 40 of which were associated with flowering genes. Among them, for 22 QTLs, we found both candidate genes and QTLs, confirming the accuracy of the current research. The remaining 37 QTLs were positioned in genomic regions not linked to any barley gene and/or QTL found in the literature (Table 2). These QTLs could be considered novel.
Among the potentially novel QTLs identified in the current study, the largest numbers were found on chromosomes 1H and 3H (eight QTLs on each). The most significant (p < 1.00 × 10⁻⁴) novel QTLs were identified for HT, HMT, VP, PL, and YM2.

3.5. Novel QTL Hotspots

The three or more potentially novel QTLs found to be co-localized at the same region of the chromosome and associated with different traits were considered QTL hotspots. The analysis of the QTLs identified three genomic regions as QTL hotspots, wherein several QTLs related to flowering time, plant architecture, and grain yield were found to be co-localized (Table 3).
The QTL hotspot qHv_FT_1H was found in the interval from 13,354,477 to 41,441,321 bp of chromosome 1H and included five QTLs associated with HT, HMT, VP, and YM2 (Table 3). According to Ensembl Plants [57], this interval in the barley genome contains 885 protein-coding genes. The second QTL hotspot qHv_FT_3H included four QTLs for HT, HMT, VP, and PH and occupied the interval from 608,636,481 to 624,910,313 bp on chromosome 3H, with 308 protein-coding genes. The third hotspot that was identified in the current study was qHv_FT_6H. Four QTLs of this hotspot were associated with the HT, VP, PH, and YM2 co-localized on chromosome 6H between 553,764,030 and 572,790,688 bp. The genome region of qHv_FT_6H contained 461 protein-coding genes.

4. Discussion

4.1. Performance of the Studied Barley Collection under Different Environmental Conditions

This study evaluated 273 two-row spring barley accessions under field conditions at two breeding institutions with different climatic conditions over three years. The environmental data indicate that 2021 experienced lower precipitation at both KAES and KRIAPG, while 2020 and 2022 showed weather patterns that were close to the climate norm for these regions (Figure 1). This variation in environmental conditions across the years provided a robust framework for assessing the stability and adaptability of barley traits under different stress conditions.
The drought and heat stresses of 2021 resulted in higher HT, HMT, and VP values at KAES (north) and higher HMT but lower HT and VP values at KRIAPG (south-east) (Figure 2, Table S2). At the same time, the high temperature and lower precipitation at the early stages of barley development (from seedling emergence to heading) in 2021 decreased the PH, PL, and YM2 at both breeding institutions. Thus, high temperature and drought had an effect on all six traits of barley studied. The different effects of stress on the HT, HMT, and VP in 2021 between KAES and KRIAPG are explained by the temperature effect during the tillering–booting stage. According to the literature, an increase in temperature from 10 °C to 19 °C during the early inflorescence development stages accelerates reproductive development in wheat, whereas temperatures > 20 °C delay terminal spikelet initiation [58]. Similarly, in 2021, during the tillering–booting stage at KAES, the temperature was 25.5 °C (compared to 17.7 °C in 2020 and 20.5 °C in 2022) (Figure 1), resulting in later heading and ripening of the studied barley accessions. At the same time, at KRIAPG, during the tillering–booting stage, the temperature in the 3 years was between 17.8 °C and 20.6 °C (Figure 1). This resulted in faster reproductive development and lower HT and VP values at KRIAPG in 2021 (Figure 2, Table S2). The heat and drought stresses in 2021 decreased the PH and PL, and these results are consistent with studies on barley heat tolerance [59,60]. Regarding the grain yield, Hemming et al. [61] and Ejaz and von Korff [62] reported that high-temperature stress inhibited inflorescence and spikelet development during the early reproductive stages of barley, resulting in reduced floret number, while the exposure of wheat and barley to high temperatures during anthesis led to an irreversible yield reduction due to floret infertility [63,64].
Generally, flowering time is a key developmental stage of cereals’ adaptation to the environment [65]. Therefore, environmental fluctuations at this stage may significantly alter phenotypic performances and grain yield. In our study, longer HT caused the shortening of the HMT and decreases in PH, PL, and YM2 in the south-east (Figure 3B), while in the north, an increase in HT impacted the shortening of the HMT and PL (Figure 3A). At the same time, ANOVA revealed a high impact of the environment on all studied traits, which led to low H2 values, except for PL (Table 1). A large environmental effect was observed mostly because of the different latitudes, soil conditions, climate, and duration of daylight hours between KAES and KRIAPG. The differences in the latitude, soil conditions, and climate patterns between KAES and KRIAPG are major factors for the observed large environmental effects. Still, the phenotypic data obtained for the six environments demonstrate a distribution close to normal (Figure 2), suggesting that the registered phenotypic ranges are suitable for the GWAS (Table S2).

4.2. Population Structure

Population stratification analysis is a mandatory step in GWAS because the strong clusterization of accessions in a population may cause false-positive associations. To avoid this and assess genetic relationships among barley accessions, we comprehensively analyzed the population structure using Bayesian clustering with MCMC, NJ tree construction, kinship analysis, PCoA, and PCA (Figure 5). Previous studies on barley populations have suggested that seasoning type, spike morphology, and geographical origin are preliminary factors affecting the search for MTAs in diverse barley collections [66,67]. However, in the current study, we used only two-row spring barley accessions, eliminating the effects of the first two factors. As a result, geographical origin mostly determined the population structure in the studied barley collection. The largest Delta-K value was found for K = 2, suggesting the presence of two major clusters: K1—the majority of USA’s accessions, half of European, and one-third of Kazakhstan’s barley, and K2—two-thirds of accessions from Kazakhstan, half of all European and all African and Middle Eastern germplasms, and five accessions from the USA (Figure 5A). Two clusters were observed in the NJ tree, kinship tree, and PCA plot as well (Figure 5C,D,F). However, the PCA showed an almost continuous distribution without distinct clusters. PC1 and PC2 explained 10.039% and 5.941% of the total genetic variance, respectively (Figure 5F), indicating that the barley accessions formed a poorly structured population [68]. Similar results were reported earlier for a barley collection genotyped with 1648 SNPs [39]. This collection also included accessions from the USA, Kazakhstan, Europe, and Africa and was divided into two clusters with an admixture between them. Thus, increasing the number of markers from 1648 SNPs to 26,529 SNPs confirms the previous results of the population structure for the current collection.
Another study on the population structure of the world barley collection, including samples from Kazakhstan, suggested the genetic closeness of Kazakhstan’s barley to European, African, and Western Asian material [69]. We also used barley accessions from these regions and obtained similar PCoA results (Figure 5E). Here, according to coordinate 1 (12.3%), the largest genetic distance was found between barleys from the USA and Africa, while accessions from Kazakhstan were very close to European ones, which is explained by a common breeding history of Kazakhstan and the ex-USSR countries of Eastern Europe [70].

4.3. Comparison of Current QTLs with Barley Genes and QTLs from Previous Reports

In this study, based on six agronomic traits collected in six environments and the SNP information of 273 barley genotypes, a GWAS was carried out to identify the genomic regions significantly associated with the target traits. Among them, the key determinant of barley plant development was flowering time. Therefore, the physical positions of 121 genes of flowering time [17], plant height [25], and some physiological processes [52] of barley were compared to the locations of 95 QTLs identified in the current study. In total, the positions of 58 QTLs matched or were close to candidate genes and/or QTLs (Table S5). For 40 of them, the candidate genes were flowering time genes. Among the most important ones, the position of Ppd-H1 (HvPRR37, chromosome 2H) matched with QTL_YM2_03; Ppd-H2 (HvFT3, chromosome 1H) matched with the QTLs QTL_HMT_04 and QTL_VP_04; HvPRR95 (chromosome 5H) matched with QTL_HT_14 and QTL_HMT_13. The gene Vrn-H1 (HvBM5A, chromosome 5H) was very close to QTL_PH_05, QTL_PL_11, and QTL_YM2_08; Vrn-H3 (HvFT1, chromosome 7H) was associated with QTL_HT_18. The other important candidate flowering genes, members of the CO family, were found for QTLs QTL_HT_18, QTL_HMT_19 (both HvCO8, chromosome 7H), and QTL_HMT_16 (HvCO2, HvCO11, both on chromosome 6H). The gene HvZCCTc (chromosome 1H), suppressing heading in barley plants not exposed to vernalization [71], matched with QTL_PL_01. The position of QTL_HMT_14 was similar to the position of HvMADS75 (chromosome 5H), a member of the MADS-box gene family, which plays a role in the regulation of flowering time, inflorescence architecture, floral organ identity, and seed development in barley [72]. Finally, the gene HvCEN (chromosome 2H) was found as a candidate gene for QTL_PL_04.
Besides flowering time genes, several QTLs were associated with candidate genes controlling other physiological processes. One of them was Dhn9 (chromosome 5H), a gene coding for proteins that accumulate in response to dehydration and osmotic stress [73]. It matched with QTL_HT_15, QTL_PH_05, and QTL_PL_11 (Table S5). The other gene, DREB1, positioned near QTLs QTL_HMT_07 and QTL_VP_09 on chromosome 3H, was reported to be associated with plant development, stress tolerance, and yield in wheat and barley [74]. Finally, the WAXY gene (chromosome 7H) encoding granule-bound starch synthase I (GBSSI), responsible for amylose synthesis in barley grain [75], was close to QTL_YM2_11, associated with yield (Table S5).
Thus, identifying known genes in the GWAS, including key flowering time genes, supports the accuracy and validity of the current GWAS results. At the same time, newly identified QTLs for flowering time traits, plant architecture, and grain yield require more detailed investigation, including validation using other barley material, such as fine mapping and functional studies, to discover the molecular mechanisms underlying the studied traits.

4.4. Putative QTL Hotspots Associated with Variations in the Agronomic Traits of Barley

QTL hotspots are key genomic regions densely packed with QTLs influencing multiple traits, providing valuable insights into the genetic architecture of complex traits and offering significant potential for breeding and genetic improvement programs [76]. Previously, in barley, QTL hotspots were identified for grain brightness and black point traits on chromosomes 4H and 7H [77], with 11 QTL hotspots for root and shoot architecture [28], for malting quality [78], and other important agronomic traits. However, there are no QTL hotspots described in the literature for flowering time traits in barley genome regions 1H:13,354,477–41,441,321, 3H:608,636,481–624,910,313, and 6H:553,764,030–572,790,688 (Table S5). Yield-associated QTL QTL_YM2_01 of the hotspot qHv_FT_1H was highly stable, and it was identified in five environments; its allele G increased the YM2 by 26.29 g/m2 on average (Table S4). This hotspot also included QTLs for flowering time traits (HT, HMT, and VP), and, most likely, this increase in grain yield was associated with a shorter HT and longer HMT (Figure 3B). The second QTL hotspot, qHv_FT_3H, included QTLs for flowering time traits (HT, HMT, VP) and PH (Table 3), and all of these traits were correlated to each other (Figure 3B). In this case, allele G of QTL_PH_03 increased the PH by 2.44 cm on average (Table S4), and a higher PH of barley is usually associated with a higher YM2 in drought conditions [79]. The third QTL hotspot, qHv_FT_6H, included QTLs for the YM2, PH, HT, and VP (Table S4).
Thus, three novel QTL hotspots identified in the current study suggest their pleiotropic effect for multiple traits, including flowering time, plant height, and grain yield. These regions may contain key regulatory genes, transcription factors, or other elements that play crucial roles in development, metabolism, or response to environmental stimuli. Although these newly identified QTL hotspots require more detailed research, by focusing on these regions, breeders can simultaneously improve multiple traits using marker-assisted selection (MAS), backcrossing with a donor parent containing a favorable flowering time and/or plant height QTL allele, or by pyramiding favorable QTL alleles.

5. Conclusions

This study evaluated 273 two-row spring barley accessions under field conditions at two breeding institutions with varying climates over three years. High temperature and drought in 2021 impacted traits like plant height, peduncle length, and grain yield, with notable variations in heading time and maturity time. Despite environmental influences, this study provided robust data for a GWAS, demonstrating significant genetic variation suitable for analysis. A detailed population structure analysis of 273 barley accessions revealed two main clusters, generally based on their geographical origin. A total of 95 significant QTLs were identified for six traits in all environments, including 72 QTLs in two or more environments. Among them, 58 QTLs were found to be linked to candidate genes and/or QTLs from the literature, while the remaining 37 were presumably novel ones. Three novel QTL hotspots on chromosomes 1H, 3H, and 6H for multiple agronomic traits were identified, suggesting potential for improving barley breeding programs.

Supplementary Materials

The following supporting information can be downloaded at: https://www.mdpi.com/article/10.3390/agronomy14071478/s1, Table S1: List of barley accessions used in the study. Table S2: Descriptive statistics of 6 phenotypic traits assessed in 273 two-row spring barley germplasm collection in two experimental fields over three years. Table S3: Q-Q and Manhattan plots. Table S4: The list of all significant MTAs and the list of QTLs identified in the study. Table S5: Candidate genes and QTLs. Figure S1: Chromosome-wide linkage disequilibrium (LD) decay estimated for 26,529 SNPs of 273 barley genotypes.

Author Contributions

Conceptualization, Y.T. and S.A.; methodology, Y.T. and V.C.; software, Y.G.; validation, Y.G. and V.C.; formal analysis, Y.G. and V.C.; investigation, Y.G. and V.C.; resources, S.A.; data curation, Y.G. and S.A.; writing—original draft preparation, Y.G., V.C., S.A. and Y.T.; writing—review and editing, Y.G., Y.T. and S.A.; visualization, Y.G.; supervision, S.A.; project administration, Y.T. and Y.G.; funding acquisition, Y.T. All authors have read and agreed to the published version of the manuscript.

Funding

The research was funded by the Committee of Science of the Ministry of Science and Higher Education of the Republic of Kazakhstan (Program No BR18574149).

Data Availability Statement

The original contributions presented in the study are included in the article and Supplementary Materials, further inquiries can be directed to the corresponding author.

Conflicts of Interest

The authors declare no conflicts of interest.

References

  1. Sakuma, S.; Salomon, B.; Komatsuda, T. The domestication syndrome genes responsible for the major changes in plant form in the Triticeae crops. Plant Cell Physiol. 2011, 52, 738–749. [Google Scholar] [CrossRef] [PubMed]
  2. Zohary, D.; Hopf, M.; Weiss, E. Domestication of Plants in the Old World: The Origin and Spread of Domesticated Plants in Southwest Asia, Europe, and the Mediterranean Basin, 4th ed.; Oxford University Press: Oxford, UK, 2012; pp. 1–12. [Google Scholar]
  3. Langridge, P. Economic and Academic Importance of Barley. In The Barley Genome. Compendium of Plant Genomes; Stein, N., Muehlbauer, G.J., Eds.; Springer International Publishing: Cham, Switzerland, 2018; pp. 1–10. [Google Scholar]
  4. Cockram, J.; Jones, H.; Leigh, F.J.; O’Sullivan, D.; Powell, W.; Laurie, D.A.; Greenland, A.J. Control of flowering time in temperate cereals: Genes, domestication, and sustainable productivity. J. Exp. Bot. 2007, 58, 1231–1244. [Google Scholar] [CrossRef] [PubMed]
  5. Fernández-Calleja, M.; Casas, A.M.; Igartua, E. Major flowering time genes of barley: Allelic diversity, effects, and comparison with wheat. Theor. Appl. Genet. 2021, 134, 1867–1897. [Google Scholar] [CrossRef] [PubMed]
  6. Andres, F.; Coupland, G. The genetic basis of flowering responses to seasonal cues. Nat. Rev. Genet. 2012, 13, 627–639. [Google Scholar] [CrossRef]
  7. Turner, A.; Beales, J.; Faure, S.; Dunford, R.P.; Laurie, D.A. The pseudo-response regulator Ppd-H1 provides adaptation to photoperiod in barley. Science 2005, 310, 1031–1034. [Google Scholar] [CrossRef] [PubMed]
  8. Yan, L.; Fu, D.; Li, C.; Blechl, A.; Tranquilli, G.; Bonafede, M.; Sanchez, A.; Valarik, M.; Yasuda, S.; Dubcovsky, J. The wheat and barley vernalization gene VRN3 is an orthologue of FT. Proc. Natl. Acad. Sci. USA 2006, 103, 19581–19586. [Google Scholar] [CrossRef] [PubMed]
  9. Yan, L.; Loukoianov, A.; Blechl, A.; Tranquilli, G.; Ramakrishna, W.; SanMiguel, P.; Bennetzen, J.L.; Echenique, V.; Dubcovsky, J. The wheat VRN2 gene is a flowering repressor down-regulated by vernalization. Science 2004, 303, 1640–1644. [Google Scholar] [CrossRef]
  10. Yan, L.; Loukoianov, A.; Tranquilli, G.; Helguera, M.; Fahima, T.; Dubcovsky, J. Positional cloning of the wheat vernalization gene VRN1. Proc. Natl. Acad. Sci. USA 2003, 100, 6263–6268. [Google Scholar] [CrossRef] [PubMed]
  11. Comadran, J.; Kilian, B.; Russell, J.; Ramsay, L.; Stein, N.; Ganal, M.; Shaw, P.; Bayer, M.; Thomas, W.; Marshall, D.; et al. Natural variation in a homolog of Antirrhinum CENTRORADIALIS contributed to spring growth habit and environmental adaptation in cultivated barley. Nat. Genet. 2012, 44, 1388–1392. [Google Scholar] [CrossRef]
  12. Hyles, J.; Bloomfield, M.T.; Hunt, J.R.; Trethowan, R.M.; Trevaskis, B. Phenology and related traits for wheat adaptation. Heredity 2020, 125, 417–430. [Google Scholar] [CrossRef]
  13. Guo, T.; Mu, Q.; Wang, J.; Vanous, A.E.; Onogi, A.; Iwata, H.; Li, X.; Yu, J. Dynamic effects of interacting genes underlying rice flowering-time phenotypic plasticity and global adaptation. Genome Res. 2020, 30, 673–683. [Google Scholar] [CrossRef] [PubMed]
  14. Alqudah, A.M.; Sharma, R.; Pasam, R.K.; Graner, A.; Kilian, B.; Schnurbusch, T. Genetic Dissection of Photoperiod Response Based on GWAS of PreAnthesis Phase Duration in Spring Barley. PLoS ONE 2014, 9, e113120. [Google Scholar] [CrossRef]
  15. Maurer, A.; Draba, V.; Jiang, Y.; Schnaithmann, F.; Sharma, R.; Schumann, E.; Kilian, B.; Reif, J.C.; Pillen, K. Modelling the genetic architecture of flowering time control in barley through nested association mapping. BMC Genom. 2015, 16, 290. [Google Scholar] [CrossRef] [PubMed]
  16. Tavakol, E.; Elbadry, N.; Tondelli, A.; Cattivelli, L.; Rossini, L. Genetic dissection of heading date and yield under Mediterranean dry climate in barley (Hordeum vulgare L.). Euphytica 2016, 212, 343–353. [Google Scholar] [CrossRef]
  17. He, T.; Hill, C.B.; Angessa, T.T.; Zhang, X.-Q.; Chen, K.; Moody, D.; Telfer, P.; Westcott, S.; Li, C. Gene-set association and epistatic analyses reveal complex gene interaction networks affecting flowering time in a worldwide barley collection. J. Exp. Bot. 2019, 70, 5603–5616. [Google Scholar] [CrossRef] [PubMed]
  18. Afsharyan, N.P.; Sannemann, W.; Léon, J.; Ballvora, A. Effect of epistasis and environment on flowering time in barley reveals a novel flowering-delaying QTL allele. J. Exp. Bot. 2020, 71, 893–906. [Google Scholar] [CrossRef] [PubMed]
  19. Yao, J.; Ma, H.; Zhang, P.; Ren, L.; Yang, X.; Yao, G.; Zhang, P.; Zhou, M. Inheritance of stem strength and its correlations with culm morphological traits in wheat (Triticum aestivum L.). Can. J. Plant Sci. 2011, 91, 1065–1070. [Google Scholar] [CrossRef]
  20. Firoozabadi, Z.D.; Nikkhah, H.R.; Foruzesh, P. Study of relationship between morpho-physiological traits and grain yield under terminal drought stress conditions in barley genotypes. Cereal Res. Commun. 2023, 51, 207–216. [Google Scholar] [CrossRef]
  21. Zahn, S.; Schmutzer, T.; Pillen, K.; Maurer, A. Genomic Dissection of Peduncle Morphology in Barley through Nested Association Mapping. Plants 2021, 10, 10. [Google Scholar] [CrossRef]
  22. Nadolska-Orczyk, A.; Rajchel, I.K.; Orczyk, W.; Gasparis, S. Major genes determining yield-related traits in wheat and barley. Theor. Appl. Genet. 2017, 130, 1081–1098. [Google Scholar] [CrossRef]
  23. Wang, Y.; Zhao, J.; Lu, W.; Deng, D. Gibberellin in plant height control: Old player, new story. Plant Cell Rep. 2017, 36, 391–398. [Google Scholar] [CrossRef]
  24. Dockter, C.; Hansson, M. Improving barley culm robustness for secured crop yield in a changing climate. J. Exp. Bot. 2015, 66, 3499–3509. [Google Scholar] [CrossRef] [PubMed]
  25. Kuczynska, A.; Surma, M.; Adamski, T.; Mikolajczak, K.; Krystkowiak, K.; Ogrodowicz, P. Effects of the semi-dwarfing sdw1/denso gene in barley. J. Appl. Genet. 2013, 54, 381–390. [Google Scholar] [CrossRef] [PubMed]
  26. Alqudah, A.M.; Koppolu, R.; Wolde, G.M.; Graner, A.; Schnurbusch, T. The genetic architecture of barley plant stature. Front. Genet. 2016, 7, 203302. [Google Scholar] [CrossRef] [PubMed]
  27. Jabbari, M.; Fakheri, B.A.; Aghnoum, R.; Mahdi Nezhad, N.; Ataei, R. GWAS analysis in spring barley (Hordeum vulgare L.) for morphological traits exposed to drought. PLoS ONE 2018, 13, e0204952. [Google Scholar] [CrossRef] [PubMed]
  28. Abdel-Ghani, A.H.; Sharma, R.; Wabila, C.; Dhanagond, S.; Owais, S.J.; Duwayri, M.A.; Al-Dalain, S.A.; Klukas, C.; Chen, D.; Lübberstedt, T.; et al. Genome-wide association mapping in a diverse spring barley collection reveals the presence of QTL hotspots and candidate genes for root and shoot architecture traits at seedling stage. BMC Plant Biol. 2019, 19, 216. [Google Scholar] [CrossRef]
  29. Bai, Y.; Zhao, X.; Yao, X.; Yao, Y.; An, L.; Li, X.; Wang, Y.; Gao, X.; Jia, Y.; Guan, L.; et al. Genome wide association study of plant height and tiller number in hulless barley. PLoS ONE 2021, 16, e0260723. [Google Scholar] [CrossRef]
  30. Xu, X.; Sharma, R.; Tondelli, A.; Russell, J.; Comadran, J.; Schnaithmann, F.; Pillen, K.; Kilian, B.; Cattivelli, L.; Thomas, W.T.B.; et al. Genome-Wide Association Analysis of Grain Yield-Associated Traits in a Pan-European Barley Cultivar Collection. Plant Genome 2018, 11, 170073. [Google Scholar] [CrossRef] [PubMed]
  31. Francia, E.; Tondelli, A.; Rizza, F.; Badeck, F.W.; Nicosia, O.L.D.; Akar, T.; Grando, S.; Al-Yassin, A.; Benbelkacem, A.; Thomas, W.T.B.; et al. Determinants of barley grain yield in a wide range of Mediterranean environments. Field Crops Res. 2011, 120, 169–178. [Google Scholar] [CrossRef]
  32. Cammarano, D.; Ceccarelli, S.; Grando, S.; Romagosa, I.; Benbelkacem, A.; Akar, T.; Al-Yassin, A.; Pecchioni, N.; Francia, E.; Ronga, D. The impact of climate change on barley yield in the Mediterranean basin. Eur. J. Agron. 2019, 106, 1–11. [Google Scholar] [CrossRef]
  33. Cuesta-Marcos, A.; Casas, A.M.; Hayes, P.M.; Gracia, M.P.; Lasa, J.M.; Ciudad, F.; Codesal, P.; Molina-Cano, J.L.; Igartua, E. Yield QTL afected by heading date in Mediterranean grown barley. Plant Breed. 2019, 128, 46–53. [Google Scholar] [CrossRef]
  34. Börner, A.; Worland, A.J.; Plaschke, J.; Schumann, E.; Law, C.N. Pleiotropic effects of genes for reduced height (Rht) and day-length insensitivity (Ppd) on yield and its components for wheat grown in middle Europe. Plant Breed. 1993, 111, 204–216. [Google Scholar] [CrossRef]
  35. Waugh, R.; Jannink, J.-L.; Muehlbauer, G.J.; Ramsey, L. The emergence of whole genome association scans in barley. Curr. Opin. Plant Biol. 2009, 12, 218–222. [Google Scholar] [CrossRef] [PubMed]
  36. Genievskaya, Y.; Almerekova, S.; Sariev, B.; Chudinov, V.; Tokhetova, L.; Sereda, G.; Ortaev, A.; Tsygankov, V.; Blake, T.; Chao, S.; et al. Marker-trait associations in two-rowed spring barley accessions from Kazakhstan and the USA. PLoS ONE 2018, 13, e0205421. [Google Scholar] [CrossRef] [PubMed]
  37. Almerekova, S.; Sariev, B.; Abugalieva, A.; Chudinov, V.; Sereda, G.; Tokhetova, L.; Ortaev, A.; Tsygankov, V.; Blake, T.; Chao, S.; et al. Association mapping for agronomic traits in six–rowed spring barley from the USA harvested in Kazakhstan. PLoS ONE 2019, 14, e0221064. [Google Scholar] [CrossRef] [PubMed]
  38. Genievskaya, Y.; Zatybekov, A.; Abugalieva, S.; Turuspekov, Y. Identification of Quantitative Trait Loci Associated with Powdery Mildew Resistance in Spring Barley under Conditions of Southeastern Kazakhstan. Plants 2023, 12, 2375. [Google Scholar] [CrossRef] [PubMed]
  39. Genievskaya, Y.; Almerekova, S.; Abugalieva, S.; Abugalieva, A.; Sato, K.; Turuspekov, Y. Identification of SNPs associated with grain quality traits in spring barley collection grown in southeastern Kazakhstan. Agronomy 2023, 13, 1560. [Google Scholar] [CrossRef]
  40. Dospekhov, B.A. Methodology of Filed Experiments, 4th ed.; Agropromizdat: Moscow, Russia, 1985; pp. 241–263. [Google Scholar]
  41. Villanueva, R.A.M.; Chen, Z.J. ggplot2: Elegant Graphics for Data Analysis (2nd ed.). Meas. Interdiscip. Res. Perspect. 2019, 17, 160–167. [Google Scholar] [CrossRef]
  42. Wei, T.; Simko, V. R package ‘corrplot’: Visualization of a Correlation Matrix. (Version 0.92). Available online: https://github.com/taiyun/corrplot (accessed on 28 April 2024).
  43. Yu, G.; Hatta, A.; Periyannan, S.; Lagudah, E.; Wulff, B.B.H. Isolation of Wheat Genomic DNA for Gene Mapping and Cloning. In Wheat Rust Diseases. Methods in Molecular Biology; Periyannan, S., Ed.; Humana Press: New York, NY, USA, 2017; pp. 124–140. [Google Scholar]
  44. Bayer, M.M.; Rapazote-Flores, P.; Ganal, M.; Hedley, P.E.; Macaulay, M.; Plieske, J.; Ramsay, L.; Russell, J.; Shaw, P.D.; Thomas, W.; et al. Development and Evaluation of a Barley 50k iSelect SNP Array. Front. Plant Sci. 2017, 8, 1792. [Google Scholar] [CrossRef]
  45. Pritchard, J.K.; Stephens, M.; Donnelly, P. Inference of population structure using multilocus genotype data. Genetics 2000, 155, 945–959. [Google Scholar] [CrossRef]
  46. Kopelman, N.M.; Mayzel, J.; Jakobsson, M.; Rosenberg, N.A.; Mayrose, I. Clumpak: A program for identifying clustering modes and packaging population structure inferences across K. Mol. Ecol. Resour. 2015, 15, 1179–1191. [Google Scholar] [CrossRef] [PubMed]
  47. Bradbury, P.J.; Zhang, Z.; Kroon, D.E.; Casstevens, T.M.; Ramdoss, Y.; Buckler, E.S. TASSEL: Software for association mapping of complex traits in diverse samples. Bioinformatics 2007, 23, 2633–2635. [Google Scholar] [CrossRef]
  48. Letunic, I.; Bork, P. Interactive Tree of Life (iTOL) v6: Recent updates to the phylogenetic tree display and annotation tool. Nucleic Acids Res. 2024, 52, 78–82. [Google Scholar] [CrossRef]
  49. Segura, V.; Vilhjálmsson, B.; Platt, A.; Korte, A.; Seren, Ü.; Long, Q.; Nordborg, M. An efficient multi-locus mixed-model approach for genome-wide association studies in structured populations. Nat. Genet. 2012, 44, 825–830. [Google Scholar] [CrossRef] [PubMed]
  50. Li, Y.; Cao, K.; Zhu, G.; Fang, W.; Chen, C.; Wang, X.; Zhao, P.; Guo, J.; Ding, T.; Guan, L.; et al. Genomic analyses of an extensive collection of wild and cultivated accessions provide new insights into peach breeding history. Genome Biol. 2019, 20, 36. [Google Scholar] [CrossRef] [PubMed]
  51. Yin, L.; Zhang, H.; Tang, Z.; Xu, J.; Yin, D.; Zhang, Z.; Yuan, X.; Zhu, M.; Zhao, S.; Li, X.; et al. rMVP: A memory-efficient, visualization-enhanced, and parallel-accelerated tool for genome-wide association study. Genom. Proteom. Bioinform. 2021, 19, 619–628. [Google Scholar] [CrossRef]
  52. Szűcs, P.; Blake, V.C.; Bhat, P.R.; Chao, S.; Close, T.J.; Cuesta-Marcos, A.; Muehlbauer, G.J.; Ramsay, L.; Waugh, R.; Hayes, P.M. An integrated resource for barley linkage map and malting quality QTL alignment. Plant Genome 2009, 2, 134–140. [Google Scholar] [CrossRef]
  53. Bretani, G.; Shaaf, S.; Tondelli, A.; Cattivelli, L.; Delbono, S.; Waugh, R.; Thomas, W.; Russell, J.; Bull, H.; Igartua, E.; et al. Multi-environment genome-wide association mapping of culm morphology traits in barley. Front. Plant Sci. 2022, 13, 926277. [Google Scholar] [CrossRef]
  54. Dang, V.H.; Hill, C.B.; Zhang, X.Q.; Angessa, T.T.; McFawn, L.A.; Li, C. Multi-locus genome-wide association studies reveal novel alleles for flowering time under vernalisation and extended photoperiod in a barley MAGIC population. Theor. Appl. Genet. 2022, 135, 3087–3102. [Google Scholar] [CrossRef]
  55. Cosenza, F.; Shrestha, A.; Van Inghelandt, D.; Casale, F.A.; Wu, P.-Y.; Weisweiler, M.; Li, J.; Wespel, F.; Stich, B. Genetic mapping reveals new loci and alleles for flowering time and plant height using the double round-robin population of barley. J. Exp. Bot. 2024, 75, 2385–2402. [Google Scholar] [CrossRef]
  56. Voorrips, R.E. MapChart: Software for the graphical presentation of linkage maps and QTLs. J. Hered. 2002, 93, 77–78. [Google Scholar] [CrossRef] [PubMed]
  57. Ensembl Plants: Barley. Available online: https://plants.ensembl.org/Hordeum_vulgare/Info/Index (accessed on 28 April 2024).
  58. Porter, J.R.; Gawith, M. Temperatures and the growth and development of wheat: A review. Eur. J. Agron. 1999, 10, 23–36. [Google Scholar] [CrossRef]
  59. Eliş, S.; Yıldırım, M. Dual-purpose ability of barley and wheat at drought and heat stress conditions. J. Arid. Agric. 2021, 7, 103–108. [Google Scholar] [CrossRef]
  60. Rollins, J.A.; Habte, E.; Templer, S.E.; Colby, T.; Schmidt, J.; von Korff, M. Leaf proteome alterations in the context of physiological and morphological responses to drought and heat stress in barley (Hordeum vulgare L.). J. Exp. Bot. 2013, 64, 3201–3212. [Google Scholar] [CrossRef] [PubMed]
  61. Hemming, M.N.; Walford, S.A.; Fieg, S.; Dennis, E.S.; Trevaskis, B. Identification of high-temperature-responsive genes in cereals. Plant Physiol. 2012, 158, 1439–1450. [Google Scholar] [CrossRef] [PubMed]
  62. Ejaz, M.; von Korff, M. The genetic control of reproductive development under high ambient temperature. Plant Physiol. 2017, 173, 294–306. [Google Scholar] [CrossRef] [PubMed]
  63. Wallwork, M.A.B.; Jenner, C.F.; Logue, S.J.; Sedgley, M. Effect of high temperature during grain-filling on the structure of developing and malted barley grains. Ann. Bot. 1998, 82, 587–599. [Google Scholar] [CrossRef]
  64. Sakata, T.; Takahashi, H.; Nishiyama, I.; Higashitani, A. Effects of high temperature on the development of pollen mother cells and microspores in barley Hordeum vulgare L. J. Plant Res. 2000, 113, 395–402. [Google Scholar] [CrossRef]
  65. Rezaei, E.E.; Webber, H.; Gaiser, T.; Naab, J.; Ewert, F. Heat stress in cereals: Mechanisms and modelling. Eur. J. Agron. 2015, 64, 98–113. [Google Scholar] [CrossRef]
  66. Malysheva-Otto, L.V.; Ganal, M.W.; Röder, M.S. Analysis of molecular diversity, population structure and linkage disequilibrium in a worldwide survey of cultivated barley germplasm (Hordeum vulgare L.). BMC Genet. 2006, 7, 6. [Google Scholar] [CrossRef]
  67. Hamblin, M.T.; Close, T.J.; Bhat, P.R.; Chao, S.; Kling, J.G.; Abraham, K.J.; Blake, T.; Brooks, W.S.; Cooper, B.; Griffey, C.A.; et al. Population structure and linkage disequilibrium in US barley germplasm: Implications for association mapping. Crop Sci. 2010, 50, 556–566. [Google Scholar] [CrossRef]
  68. Pang, Y.; Liu, C.; Wang, D.; St. Amand, P.; Bernardo, A.; Li, W.; He, F.; Li, L.; Wang, L.; Yuan, X.; et al. High-resolution genome-wide association study identifies genomic regions and candidate genes for important agronomic traits in wheat. Mol. Plant. 2020, 13, 1311–1327. [Google Scholar] [CrossRef]
  69. Almerekova, S.; Genievskaya, Y.; Abugalieva, S.; Sato, K.; Turuspekov, Y. Population Structure and Genetic Diversity of Two-Rowed Barley Accessions from Kazakhstan Based on SNP Genotyping Data. Plants 2021, 10, 2025. [Google Scholar] [CrossRef] [PubMed]
  70. Turuspekov, Y.; Sariev, B.; Chudinov, V.; Sereda, G.; Tokhetova, L.; Ortaev, A.; Tsygankov, V.; Doszhanov, M.; Volis, S.; Abugalieva, S. Genotype×environment interaction patterns for grain yield of spring barley in different regions of Kazakhstan. Russ. J. Genet. 2013, 49, 196–205. [Google Scholar] [CrossRef]
  71. Karsai, I.; Szucs, P.; Meszaros, K.; Filichkina, T.; Hayes, P.M.; Skinner, J.S.; Láng, L.; Bedő, Z. The Vrn-H2 locus is a major determinant of flowering time in a facultative x winter growth habit barley (Hordeum vulgare L.) mapping population. Theor. Appl. Genet. 2005, 110, 1458–1466. [Google Scholar] [CrossRef] [PubMed]
  72. Schilling, S.; Kennedy, A.; Pan, S.; Jermiin, L.S.; Melzer, R. Genome-wide analysis of MIKC-type MADS-box genes in wheat: Pervasive duplications, functional conservation and putative neofunctionalization. New Phytol. 2020, 225, 511–529. [Google Scholar] [CrossRef] [PubMed]
  73. Zhu, B.; Choi, D.-W.; Fenton, R.; Close, T.J. Expression of the barley dehydrin multigene family and the development of freezing tolerance. Mol. Gen. Genet. MGG 2000, 264, 145–153. [Google Scholar] [CrossRef] [PubMed]
  74. Yang, Y.; Al-Baidhani, H.H.J.; Harris, J.; Riboni, M.; Li, Y.; Mazonka, I.; Bazanova, N.; Chirkova, L.; Hussain, S.S.; Hrmova, M.; et al. DREB/CBF expression in wheat and barley using the stress-inducible promoters of HD-Zip I genes: Impact on plant development, stress tolerance and yield. Plant Biotechnol. J. 2020, 18, 829–844. [Google Scholar] [CrossRef] [PubMed]
  75. Li, Q.; Pan, Z.; Liu, J.; Deng, G.; Long, H.; Zhang, H.; Liang, J.; Zeng, X.; Tang, Y.; Tashi, N.; et al. A mutation in Waxy gene affects amylose content, starch granules and kernel characteristics of barley (Hordeum vulgare). Plant Breed. 2019, 138, 513–523. [Google Scholar] [CrossRef]
  76. Breitling, R.; Li, Y.; Tesson, B.M.; Fu, J.; Wu, C.; Wiltshire, T.; Gerrits, A.; Bystrykh, L.V.; de Haan, G.; Su, A.I.; et al. Genetical genomics: Spotlight on QTL hotspots. PLoS Genet. 2008, 4, e1000232. [Google Scholar] [CrossRef]
  77. Jia, Y.; Westcott, S.; He, T.; McFawn, L.A.; Angessa, T.; Hill, C.; Tan, C.; Zhang, X.; Zhou, G.; Li, C. Genome-wide association studies reveal QTL hotspots for grain brightness and black point traits in barley. Crop J. 2021, 9, 154–167. [Google Scholar] [CrossRef]
  78. Kochevenko, A.; Jiang, Y.; Seiler, C.; Surdonja, K.; Kollers, S.; Reif, J.C.; Korzun, V.; Graner, A. Identification of QTL hot spots for malting quality in two elite breeding lines with distinct tolerance to abiotic stress. BMC Plant Biol. 2018, 18, 106. [Google Scholar] [CrossRef] [PubMed]
  79. Ceccarelli, S.; Grando, S.; Baum, M.; Udupa, S.M. Breeding for drought resistance in a changing climate. Chall. Strateg. Dryland Agric. 2004, 32, 167–190. [Google Scholar]
Figure 1. The amount of precipitation and the average temperature per plant growth stage and the whole vegetation period at two experimental fields for three years. (A) Karabalyk Agricultural Experimental Station. (B) Kazakh Research Institute of Agriculture and Plant Growing.
Agronomy 14 01478 g001
Figure 2. Box plots of six phenotypic traits assessed in 273 two-row spring barley germplasm collection at two experimental fields over three years.
Agronomy 14 01478 g002
Figure 3. Average Pearson correlation coefficients (r) for three years of the experiment. Coefficients with p < 0.05 are shown. Red indicates a negative correlation, and blue indicates a positive correlation. (A) Karabalyk Agricultural Experimental Station. (B) Kazakh Research Institute of Agriculture and Plant Growing.
Agronomy 14 01478 g003
Figure 4. Distribution and density of SNP markers on 7 chromosomes of the studied barley collection. The number of SNPs per chromosome is indicated on the right of each bar (chromosome). The scale on the right demonstrates the number of SNPs within 1 Mb.
Agronomy 14 01478 g004
Figure 5. Genetic structure of 273 spring barley accessions based on the analysis of 26,529 SNPs. (A) Delta-K values. (B) Distribution of barley accessions by K-values. Numbers inside circles indicate the number of accessions per origin. (C) NJ tree. (D) Heatmap of kinship matrix. (E) PCoA plot. (F) PCA plot.
Agronomy 14 01478 g005
Figure 6. Physical map of genes for flowering, plant height, and physiological processes of barley and QTLs associated with flowering time traits, morphological traits, and grain yield identified in the GWAS (chromosomes 1H, 2H, 3H, and 4H). The positions (bp) are shown on the left side of the chromosome bar; the SNP, gene names, and QTLs are on the right side. Potentially novel QTLs are marked with *.
Agronomy 14 01478 g006
Figure 7. Physical map of genes for flowering, plant height, and physiological processes of barley and QTLs associated with flowering time traits, morphological traits, and grain yield identified in the GWAS (chromosomes 5H, 6H, and 7H). The positions (bp) are shown on the left side of the chromosome bar; the SNP, gene names, and QTLs are on the right side. Potentially novel QTLs are marked with *.
Agronomy 14 01478 g007
Table 1. ANOVA results of phenotypic traits between two locations.
Heading Time (HT, Days)
dfSSMSVarianceF-Valuep-ValueH2 (%)
Genotype21612,944609.9490.4711.005.5
Region1109,479109,47984.149860.3432.11 × 10−21
Genotype × Region2163901182.9980.1421.00
Residuals867110,32712784.801
Total variance 181.899
Heading-Maturity Time (HMT, Days)
dfSSMSVarianceF-Valuep-ValueH2(%)
Genotype2163564162.7390.2841.005.9
Region1322932292.48155.6332.12 × 10−13
Genotype × Region2162967142.2800.2371.00
Residuals86750,3295838.684
Total variance 46.186
Vegetation Period (VP, Days)
dfSSMSVarianceF-Valuep-ValueH2(%)
Genotype2167735365.9450.3471.004.4
Region175,10375,10357.727727.8854.22 × 10−20
Genotype × Region2162288111.7580.1031.00
Residuals86789,45610368.759
Total variance 134.190
Plant Height (PH, cm)
dfSSMSVarianceF-Valuep-ValueH2(%)
Genotype21622,16710317.0380.7290.99813.6
Region1810081006.22557.5698.41 × 10−14
Genotype × Region21610,913518.3880.3591.00
Residuals867121,99114193.767
Total variance 125.419
Peduncle Length (PL, cm)
dfSSMSVarianceF-Valuep-ValueH2(%)
Genotype216869640.36.6842.4623.14 × 10−1731.1
Region130293028.82.328185.1992.99 × 10−17
Genotype × Region21620459.51.5710.5791.00
Residuals86714,17916.410.898
Total variance 21.482
Yield per m2 (YM2, g/m2)
dfSSMSVarianceF-Valuep-ValueH2(%)
Genotype2165,552,99325,7084268.2510.421.008.2
Region16,048,3236,048,3234648.98298.7321.55 × 10−17
Genotype × Region2163,358,65215,5492581.5930.2541.00
Residuals86752,867,29161,26040,635.890
Total variance 52,134.711
Notes: df, degree of freedom; SS, sum of squares; MS, mean squares; H2, broad-sense heritability.
Table 2. The list of potentially novel QTLs identified for six agronomic traits of barley using GWAS.
QTLPeak SNPChr.Peak Pos. (bp)Interval (bp)MAFAllelep-ValueEffect 1Env.
QTL_VP_01JHI-Hv50k-2016-2523851H13,354,4778,586,441–21,024,5050.121T1.89 × 10−41.81633
QTL_YM2_01JHI-Hv50k-2016-129261H13,732,326946,031–13,732,3260.125G4.14 × 10−526.29075
QTL_HMT_01JHI-Hv50k-2016-166251H24,658,01624,658,016–38,812,6000.151T1.79 × 10−41.84082
QTL_HT_01JHI-Hv50k-2016-185741H41,433,22841,433,228–59,789,3970.155C9.44 × 10−51.38242
QTL_VP_02JHI-Hv50k-2016-186061H41,441,32035,971,057–41,441,3200.151A3.78 × 10−41.11472
QTL_VP_03JHI-Hv50k-2016-196691H71,853,55969,604,346–71,853,5590.214C1.35 × 10−41.49891
QTL_HMT_02JHI-Hv50k-2016-230641H313,902,731290,624,056–313,902,7310.200C7.99 × 10−51.78961
QTL_HMT_03JHI-Hv50k-2016-255611H351,780,525340,908,307–351,780,5250.109G3.66 × 10−52.37042
QTL_PL_03JHI-Hv50k-2016-675122H15,345,00215,345,002–19,619,9400.296G6.14 × 10−40.61142
QTL_HT_03JHI-Hv50k-2016-806322H67,504,94547,473,212–67,722,9200.162T1.80 × 10−51.39372
QTL_HMT_05JHI-Hv50k-2016-806902H67,705,04967,516,405–67,722,9200.171A1.35 × 10−40.78001
QTL_VP_05SCRI_RS_124922H543,450,750532,288,289–546,728,2060.170A4.83 × 10−52.25331
QTL_PL_07JHI-Hv50k-2016–1563613H16,388,92115,509,320–16,388,9210.375T1.51 × 10−40.58971
QTL_YM2_06JHI-Hv50k-2016-1824333H474,425,171444,743,836–47,7051,1440.172G3.03 × 10−475.44313
QTL_VP_10JHI-Hv50k-2016-1830283H487,517,028482,733,343–487,517,0280.196C1.48 × 10−41.26951
QTL_HT_10BOPA1_8984-5793H608,636,481608,142,120–608,636,4810.115C1.17 × 10−41.05281
QTL_HMT_08JHI-Hv50k-2016-2008773H611,779,208605,213,263–611,857,9140.105A9.97 × 10−52.96693
QTL_VP_11JHI-Hv50k-2016-2027033H621,964,596604,674,979–622,000,2700.283G1.38 × 10−41.50843
QTL_PH_03JHI-Hv50k-2016-2034533H624,910,313598,829,887–625,131,6770.285G2.35 × 10−42.43553
QTL_PL_08JHI-Hv50k-2016-2213883H684,467,546684,258,655–705,215,1460.398G5.24 × 10−50.70312
QTL_HT_11JHI-Hv50k-2016-2309334H16,473,6819,847,402–16,473,6810.347C3.70 × 10−40.80971
QTL_VP_14JHI-Hv50k-2016-2524024H540,116,318522,567,921–541,553,9800.121G1.89 × 10−41.81631
QTL_HT_12JHI-Hv50k-2016-2569604H57,4131,430569,982,311–577,122,3970.169C2.24 × 10−42.12701
QTL_VP_15JHI-Hv50k-2016-2780635H3,438,5332,438,132–3,438,9020.324C1.69 × 10−42.05972
QTL_PL_10JHI-Hv50k-2016-3046435H447,605,897446,644,533–45,138,98930.102C2.94 × 10−41.05061
QTL_HMT_12JHI-Hv50k-2016-3090345H497,103,609497,101,566–499,580,0550.117G3.69 × 10−42.24631
QTL_VP_16JHI-Hv50k-2016-3090555H497,440,394497,440,394–500,496,4510.102C5.53 × 10−41.29832
QTL_HMT_15JHI-Hv50k-2016-3623025H659,419,522659,417,722–659,422,0730.117C2.67 × 10−41.79521
QTL_PH_06JHI-Hv50k-2016-3781956H18,912,15011,583,956–38,574,6100.174A2.27 × 10−43.17483
QTL_PL_12JHI-Hv50k-2016-4050716H420,155,207417,602,169–420,155,2070.151A2.37 × 10−41.51961
QTL_VP_19JHI-Hv50k-2016-4070756H460,162,406460,088,561–460,162,4060.137G1.86 × 10−41.26061
QTL_YM2_10SCRI_RS_1381886H553,764,030552,273,422–559,065,5430.426C1.56 × 10−436.00782
QTL_HT_17JHI-Hv50k-2016–4215416H554,873,294552,901,600–555,717,2710.143A1.61 × 10−42.10182
QTL_PH_07JHI-Hv50k-2016–4232516H559,845,481546,897,277–569,259,5690.324C8.67 × 10−51.47813
QTL_VP_20JHI-Hv50k-2016–4282466H572,790,688569,743,557–582,529,8730.100T2.06 × 10−42.48723
QTL_YM2_12SCRI_RS_2304877H59,806,70359,719,498–68,752,6320.354C1.06 × 10−434.72882
QTL_PL_13JHI-Hv50k-2016-4669757H65,594,44465,594,444–65,632,3920.199C1.56 × 10−40.88791
QTL_HMT_20SCRI_RS_1346407H575,017,311575,017,311–584,089,1130.188A1.58 × 10−41.89301
Notes: 1—the effect of QTL’s allele is quantified in the units of measurement relevant to the trait; Chr., chromosome; pos., physical position; MAF, minor allele frequency; Env., number of environments where the QTL was identified; HT, heading time; HMT, heading-maturity time; VP, vegetation period; PH, plant height; PL, peduncle length; YM2, grain yield per m2.
Table 3. Novel QTL hotspots for 6 studied agronomic traits of barley using GWAS.
Chr.QTL HotspotInterval (bp)Size (Mb)Co-Localized QTLsNumber of Protein-Coding Genes [57]
1HqHv_FT_1H13,354,477–41,441,32028.1QTL_VP_01
QTL_YM2_01
QTL_HMT_01
QTL_HT_01
QTL_VP_02
885
3HqHv_FT_3H608,636,481–624,910,31316.3QTL_HT_10
QTL_HMT_08
QTL_VP_11
QTL_PH_03
308
6HqHv_FT_6H553,764,030–572,790,68819.0QTL_YM2_10
QTL_HT_17
QTL_PH_07
QTL_VP_20
461
Disclaimer/Publisher’s Note: The statements, opinions and data contained in all publications are solely those of the individual author(s) and contributor(s) and not of MDPI and/or the editor(s). MDPI and/or the editor(s) disclaim responsibility for any injury to people or property resulting from any ideas, methods, instructions or products referred to in the content.

