Article

Evaluation of Grain Moisture Content at Maturity and Screening for Identification Indexes of Maize Inbred Lines

by
Yuqian Gao
1,2,†,
Jianping Li
1,†,
Ruiyao Ning
1,
Yunxiao Zheng
1,3,
Weibin Song
3,
Peng Hou
4,
Liying Zhu
1,
Xiaoyan Jia
1,
Yongfeng Zhao
1,
Wei Song
2,
Rui Guo
2,* and
Jinjie Guo
1,*
1
State Key Laboratory of North China Crop Improvement and Regulation, North China Key Laboratory for Crop Germplasm Resources of Education Ministry, Hebei Sub-Center of National Maize Improvement Center of China, College of Agronomy, Hebei Agricultural University, Baoding 071051, China
2
Key Laboratory of Crop Genetics and Breeding of Hebei Province, Institute of Cereal and Oil Crops, Hebei Academy of Agriculture and Forestry Sciences, Shijiazhuang 050051, China
3
State Key Laboratory of Maize Bio-Breeding, National Maize Improvement Center, Department of Plant Genetics and Breeding, China Agricultural University, Beijing 100193, China
4
Key Laboratory of Crop Physiology and Ecology, Ministry of Agriculture and Rural Affairs, Institute of Crop Sciences, Chinese Academy of Agricultural Sciences, Beijing 100193, China
*
Authors to whom correspondence should be addressed.
These authors contributed equally to this study.
Agronomy 2024, 14(7), 1480; https://doi.org/10.3390/agronomy14071480
Submission received: 19 May 2024 / Revised: 2 July 2024 / Accepted: 6 July 2024 / Published: 9 July 2024
(This article belongs to the Section Crop Breeding and Genetics)

Abstract

:
The grain moisture content of maize inbred lines at maturity is one of the most important indicators for mechanical harvesting of kernels. In this study, 116 maize inbred lines from a wide range of sources were used as research materials and 30 traits of grain moisture content were analyzed using multivariate statistical analysis. The results showed that all 30 traits had some correlations. Principal component analysis downscaled the 30 traits into 10 principal component factors, reflecting 77.674% of the information in the original traits. Cluster analysis categorized the 116 inbred lines into 5 major groups containing 26, 29, 31, 16 and 14 inbred lines. Based on the D value of the overall evaluation, discriminant analysis reclassified the maize inbred lines by principal component scores and 98 maize inbred lines were correctly discriminated with a probability of 84.48%, which can be regarded as a relatively reliable clustering result. The stepwise regression method was further used to screen seven traits: GMC2, GDR1, HMC3, NH, GDR2, CD and EL and to establish a comprehensive evaluation model for the grain moisture content of maize inbred lines. Among 116 maize inbred lines, 14, represented by H21 and MS71, had the lowest grain moisture content at maturity.

1. Introduction

Maize (Zea mays L.) is one of the most important cereals in the world. With the progress and development of science and technology, the degree of mechanization of maize planting management and harvesting is increasing. Lower grain moisture content at harvest is necessary for mechanized production of maize [1]. Additionally, grain moisture content is critical for yield, quality, transportation and storage of maize after machine harvesting [2]. Low grain moisture content at harvest is a new breeding goal; therefore, evaluation of grain moisture content at maturity and screening for associated identification indexes in maize inbred lines is one of the key tasks in the current breeding work.
Many scholars have conducted studies on the water content of maize kernels at maturity. The results of Brooking [3] showed that the irrigating rate, grain moisture content and the rate of grain dehydration together determine the water content of maize kernels at maturity; the results of Liu [4] showed that the water content of maize kernels at harvest depended on the water content of kernels and the rate of grain dehydration at the physiological maturity stage. Both of them are quantitative traits controlled by multiple quantitative trait loci that are highly susceptible to environmental influences. It is generally believed that grain moisture content and grain dehydration rate at maturity cannot be improved at the same time; however, Liu [4] found that simultaneous improvement of both grain moisture content and dehydration rate is achievable and is consistent with the results of a previous study by Li [5]. In addition, Wang [6] showed that grain dehydration rate is a key determinant of grain moisture content. Kang [7] found a highly significant positive correlation between maize husk moisture content and grain moisture content. It is generally recognized that maize varieties with thin and long cob axes, fewer husks and less tightly wrapped leaves are more suitable for mechanical harvesting in the field. Higher maize grain moisture content during mechanical harvesting leads to kernel breakage and it has been shown that the lowest breakage rates occur when the grain moisture content is between 18% and 23% [8,9]. In addition to broken kernels, high grain moisture content can lead to many other problems, for example, high moisture content kernels are more susceptible to germination, rot and mold in warm and humid environments [10,11,12,13]. High moisture content in seeds can also lead to delayed harvesting and is highly susceptible to seed shedding, germination of the ears and bird pecking [14,15]. In addition, kernels with high moisture content increase costs associated with drying and storage [16,17]. To reduce grain moisture content at harvest, farmers harvest maize late; however, this comes at the cost of delaying the sowing of the next crop. Most studies have shown that grain moisture content is closely associated with kernel-, husk- and ear-related traits; therefore, further exploration and analysis of traits that are closely associated with grain moisture content are of practical significance for creating low-moisture content maize varieties and advancing the development of mechanical harvesting.
The amount of grain moisture content plays a key role in mechanical harvesting in the field and as well as the quality of the grain after machine harvesting. Many factors influence the level of grain moisture content in maize production. Genetic factors as well as complex and changeable environmental factors affect the level of grain moisture content. At present, due to the limited technology, research at the molecular level is still relatively limited. This paper took maize inbred lines with different genetic backgrounds as materials and analyzed their grain moisture contents based on changes in maize traits by measuring two years’ worth of data from the field.

2. Materials and Methods

2.1. Plant Materials

The experimental materials were 116 maize inbred lines from a wide range of sources provided by the National Maize Improvement Center, Hebei Branch Center, Hebei Agricultural University. They mainly consisted of temperate germplasm; the names of the inbred lines and their genealogical sources are detailed in Supplementary Table S1 [18,19]. The 116 maize inbred lines were planted at the experimental base of the Hebei Branch of the National Maize Improvement Center of Hebei Agricultural University (115.48° E, 38.85° N) in early May 2022 and 2023. In this study, a completely randomized experimental design was adopted and each inbred line was planted in a plot with a row length of 4 m and a spacing of 60 cm. Single rows were planted at a spacing of 25 cm and protected rows were planted around the planting area. Water and fertilizer management was equivalent to that used under field production.

2.2. Determination of Water Content in Kernels

In this experiment, 30 traits associated with grain moisture content were analyzed. They included seed-related traits, husk-related traits and ear-related traits. The specific measurement methods were as follows:
Single plants with the same growth trend were selected and isolated in uniform sets of sulfate paper bags before silking. All plants were self-pollinated by hand. Each self-pollinated line was pollinated on the same day, and the pollination dates for different self-pollinated lines were recorded to keep track of sampling time. Plants at the beginning and the end of the rows were not sampled [18].
Two ears with the same growth were sampled at 7:00–8:00 a.m. and quickly threshed 10, 20, 30, 40 and 50 days after pollination. The drying method was used to measure the indicators of the test. Briefly, a total of 100 seeds were taken from the middle of the ear, their fresh weight was measured and they were then quickly transferred to a 106 °C oven where they were dried until a constant dry weight was reached. The GMC and GDR formulas were: GMC (grain moisture content, %) = (fresh weight per time − dry weight per time)/fresh weight per time × 100% and GDR (grain dehydration rate, %) = (moisture content of the previous sample − moisture content of the next sample)/sampling time interval. The number of husks (NH), husk moisture content (HMC), cob length (mm) (CL), cob diameter (mm) (CD), cob moisture content (%) (CMC), cob dehydration rate (%) (CDR) and the rate of dewatering of the husks were also calculated. Ear length (mm) (EL), ear diameter (mm) (ED), row number per ear (RN) and kernel number per row (KN) were measured for the kernel test materials; area of grain (mm2) (AG), perimeter of grain (mm) (PG), grain length (mm) (GL), grain width (mm) (GW), length/width ratio (R) and 100-grain weight (g) (HGW) were investigated using the Liang Tian high-flying camera (Shenzhen Liangtian Technology Co., Ltd., Shenzhen, China). Each trait was measured by taking two biological replicates and three technical replicates.
A total of 30 traits associated with grain moisture content were analyzed. Seed-related traits, including grain moisture content (GMC) and grain dehydration rate (GDR), were calculated using the dry and fresh weights of the seeds; area of grain (AG), perimeter of grain (PG), grain length (GL), grain width (GW), grain length/width ratio (R) and 100-grain weight (HGW) were investigated using the Liang Tian high-flying camera. Husk-related traits (number of husks (NH) and husk moisture content (HMC)) were calculated in the same way as the seed-related traits. Finally, ear-related traits (cob length (CL), cob diameter (CD), cob moisture content (CMC), cob dehydration rate (CDR), ear length (EL), ear diameter (ED), row number per ear (RN) and kernel number per row (KN)) were also calculated.

2.3. Data Collation and Statistical Analysis

All data were collated and preliminarily analyzed in Microsoft Excel 2021, with subsequent analysis in IBM SPSS Statistics 26 and R-4.3.3 [20].

2.3.1. Values of Comprehensive Character Functions of Each Maize Inbred Line

First, in order to eliminate the influence of raw data on different dimensions, the Z-score was measured in the IBM SPSS Statistics 26 software to obtain standardized data; the standardized data were analyzed by applying relevant formulas [20].
U ( X j ) = ( X j X m i n ) ( X m a x X m i ) × 100 ,   j = 1 , 2 n
In Formula (1), Xj represents the jth comprehensive trait, U(Xj) represents the membership function value of the jth comprehensive trait and Xmin and Xmax represent the minimum and maximum values of the jth comprehensive trait, respectively [21].

2.3.2. Weight of Each Comprehensive Trait

In Formula (2), Wj represents the importance of the jth comprehensive trait among all comprehensive traits, that is, the weight; Pj represents the contribution rate of the jth comprehensive trait of each maize inbred line obtained using principal component analysis (PCA) [20].
W j = P j / j = 1 n P j ,   j = 1 , 2 n

2.3.3. Comprehensive Evaluation of Grain Moisture Content in Maize Inbred Lines

In Formula (3), D is the comprehensive evaluation value of grain moisture content for each maize inbred line at maturity [22,23].
D = j = 1 n [ U ( X j ) W j ] ,   j = 1 , 2 n
Correlation analysis of 30 traits of the 116 inbred lines was carried out in R-4.3.3 using the corrplot package and principal component analysis was performed in IBM SPSS Statistics 26 software. Cluster analysis and validation of the cluster results were performed in R-4.3.3 using the hclust and MASS functions [24], respectively. Finally, stepwise regression analysis of the traits of maize inbred lines conducted using the SPSS software yielded the regression of water content in grain.

3. Results

3.1. Variability in Grain Moisture Content Traits

The results of the descriptive statistical analysis of 30 traits in 116 inbred lines conducted in SPSS are shown in Supplementary Table S2, from which it can be seen that the range of variation of grain water-content-related traits was 2.15–49.79%, the range of variation of husk water-content-related traits was 3.46–45.48% and the range of variation of ear-related traits was 11.18–154.11%. Based on the statistical analysis of the data, it can be concluded that the range of variation of the 30 traits was large, indicating that each trait is an important factor that affects the evaluation of the water content of seeds at maturity.

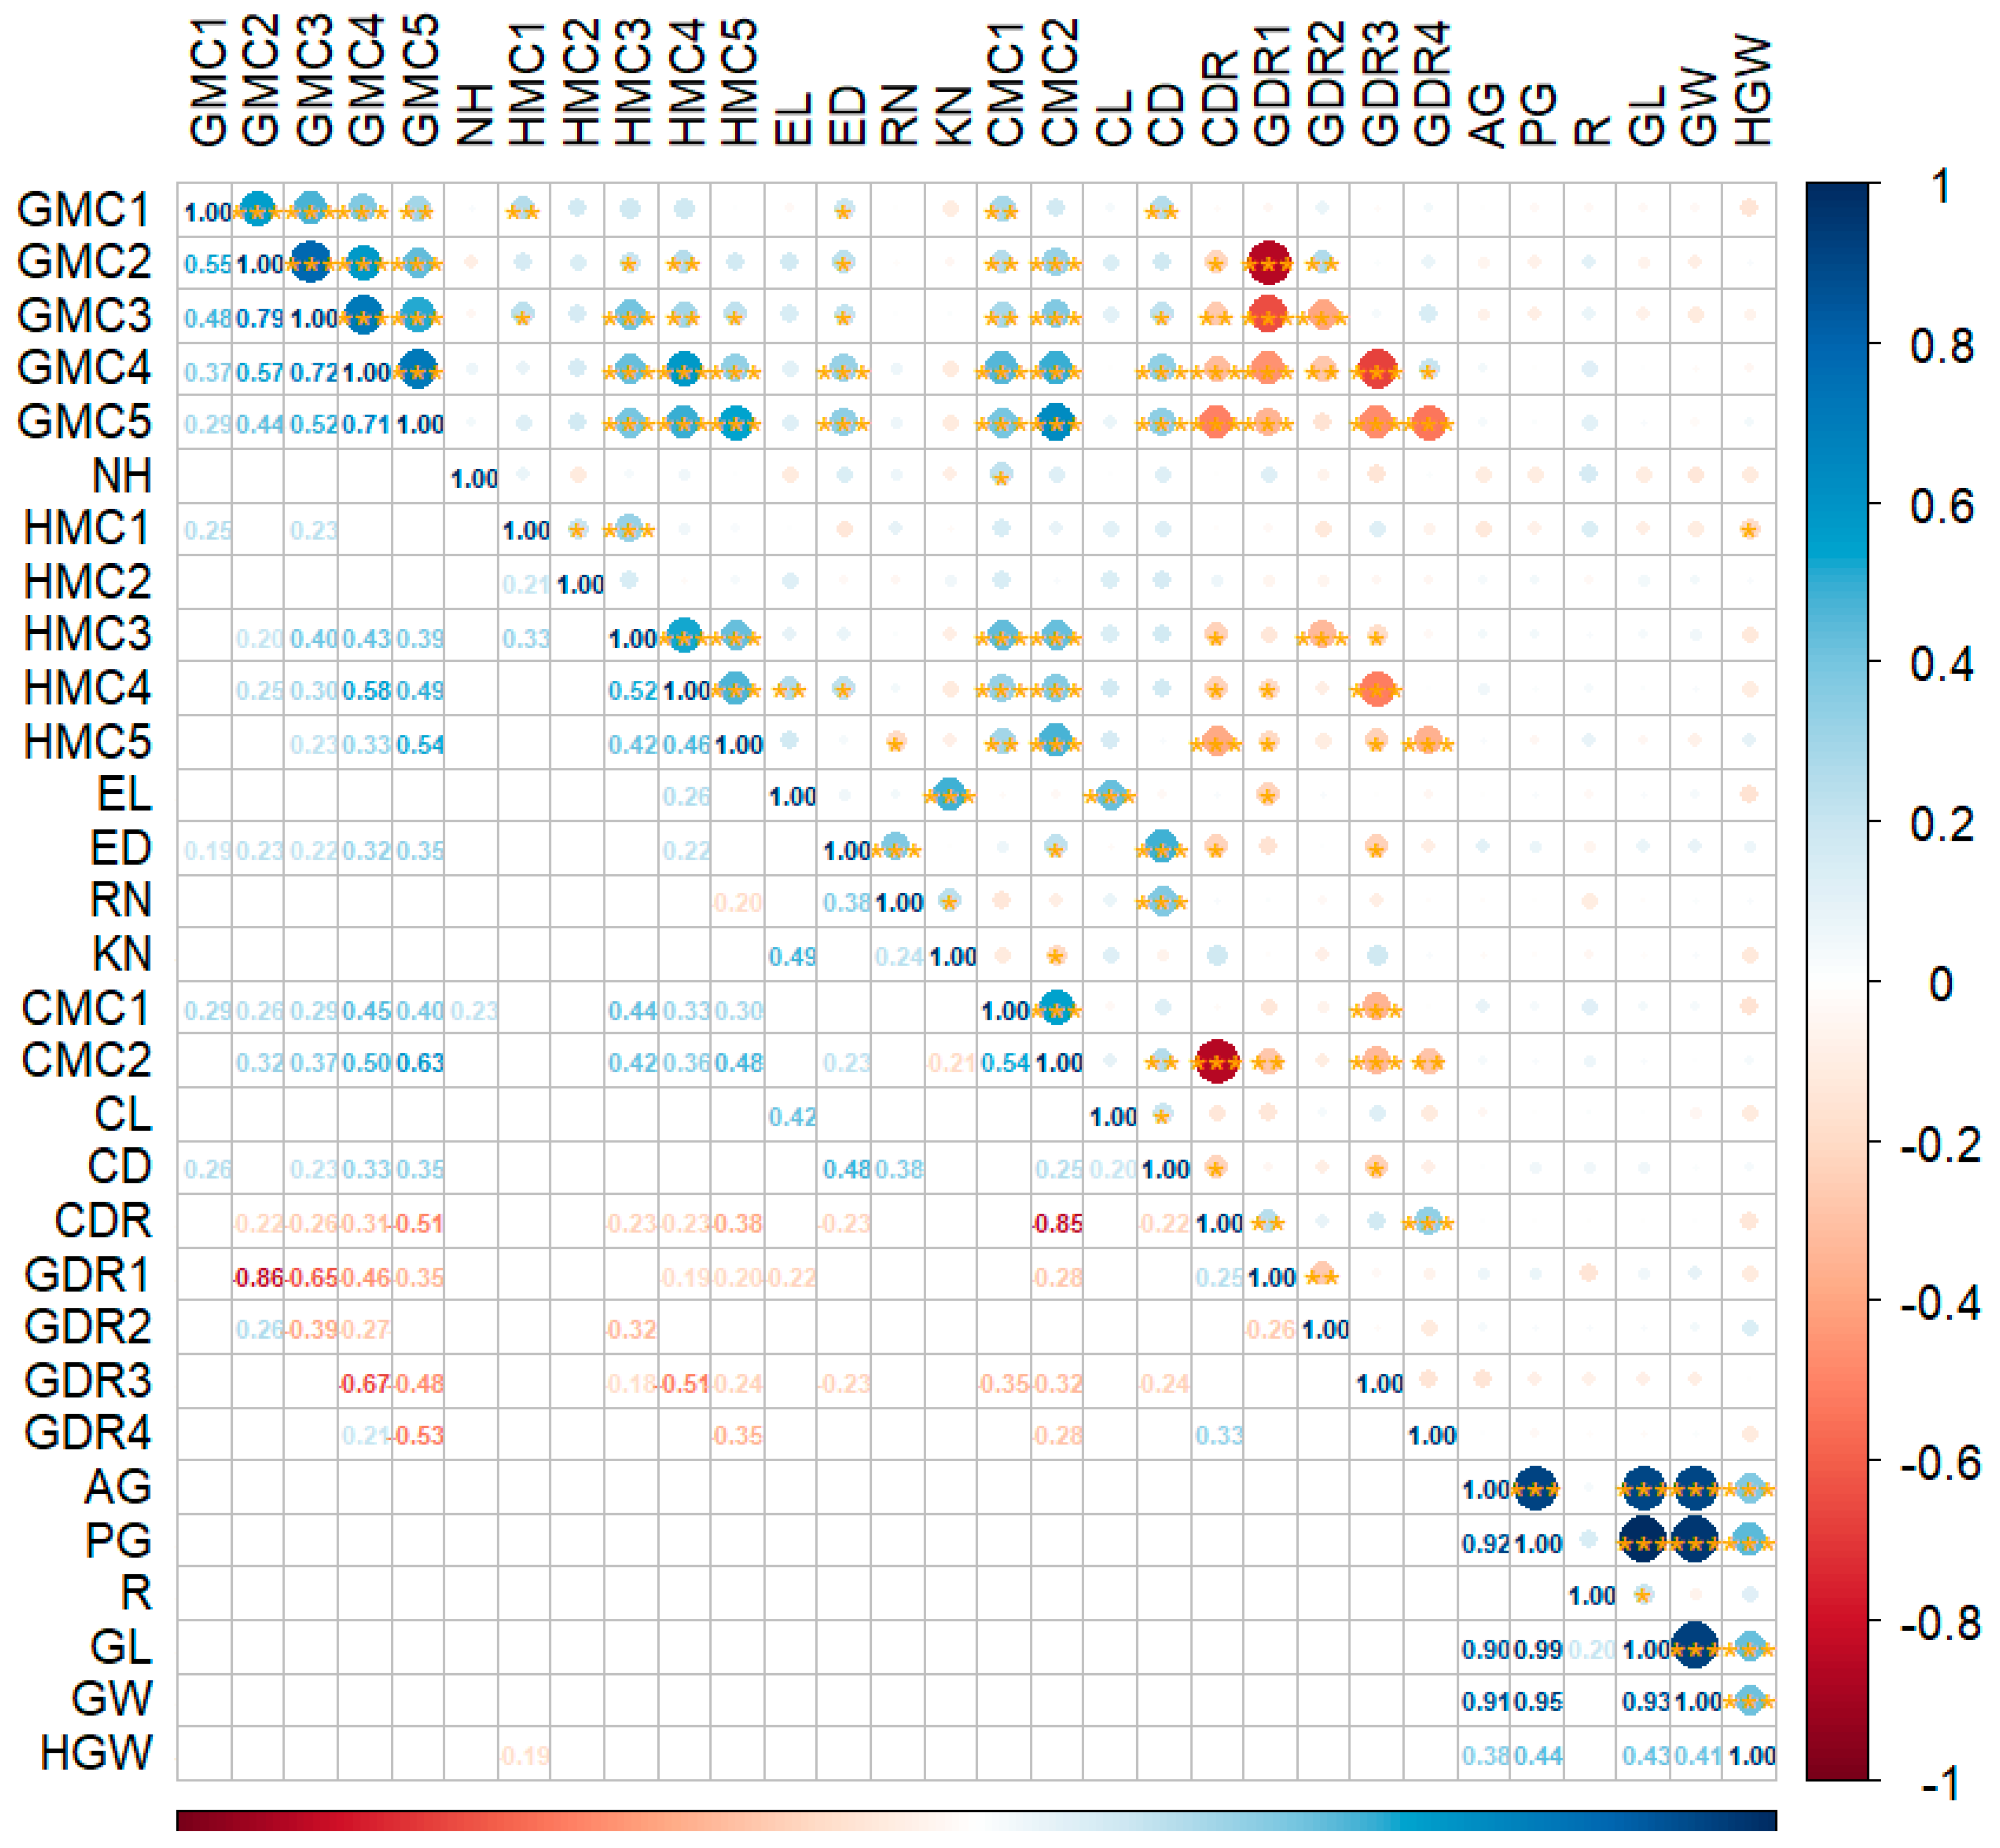
3.2. Analysis of Correlations between the Various Traits

Correlation analysis of the 30 traits revealed that the water content traits of the grains at maturity were correlated to varying degrees (Figure 1). Based on Person’s correlation analysis, 69 correlation coefficients were highly significant at p > 0.001, 18 correlation coefficients were highly significant at p > 0.01, and 30 correlation coefficients were significant at p > 0.05. Further analysis of the significantly correlated coefficients showed that among the 117 correlation coefficients, cob dehydration rate and grain dehydration rate were negatively correlated with other traits, the row number per ear was negatively correlated with 50-day husk moisture content, the kernel number per row was negatively correlated with 50-day cob moisture content and the 100-grain weight was negatively correlated with 10-day husk moisture content. Area of grain was extremely significantly positively correlated with perimeter of grain (r = 0.92), grain length (r = 0.90) and grain width (r = 0.91); perimeter of grain was positively correlated with grain length (r = 0.99) and grain width (r = 0.95); and grain length was positively correlated with grain width (r = 0.93). In contrast, there were highly significant negative correlations between the 10-day grain dehydration rate and 20-day grain moisture content (r = −0.86) and cob dehydration rate and 50-day cob moisture content (r = −0.85). Since the 30-day maturity grain water content traits were correlated to different degrees, these traits would partially overlap or under-estimate the overall evaluation of water content at kernel maturity. Therefore, we performed principal component analysis, cluster analysis, discriminant analysis and regression analysis on these data to generate a comprehensive evaluation of maize grain moisture content at maturity.

3.3. Principal Component Analysis

Principal component analysis was performed in SPSS software for 30 grain water content-related traits, and the number of PCs was determined by examining feature values greater than 1 [25]. Supplementary Table S3 shows that the 30 traits were downscaled to 10 components based on eigenvalues greater than 1 and the cumulative contribution rate of these 10 principal components reached 77.674%, indicating that these 10 principal components encompassed most of the traits as the basis of judgment for subsequent analysis. Principal components 1, 2, 3, 8, 9 and 10 contained most of the information on water-content-related traits of grains; principal components 4 and 5 covered information on ear-related traits; and principal components 6 and 7 contained information on husk water-content-related traits. Therefore, the principal components obtained from this dimensionality reduction analysis were representative and can lay the foundation for subsequent analysis.

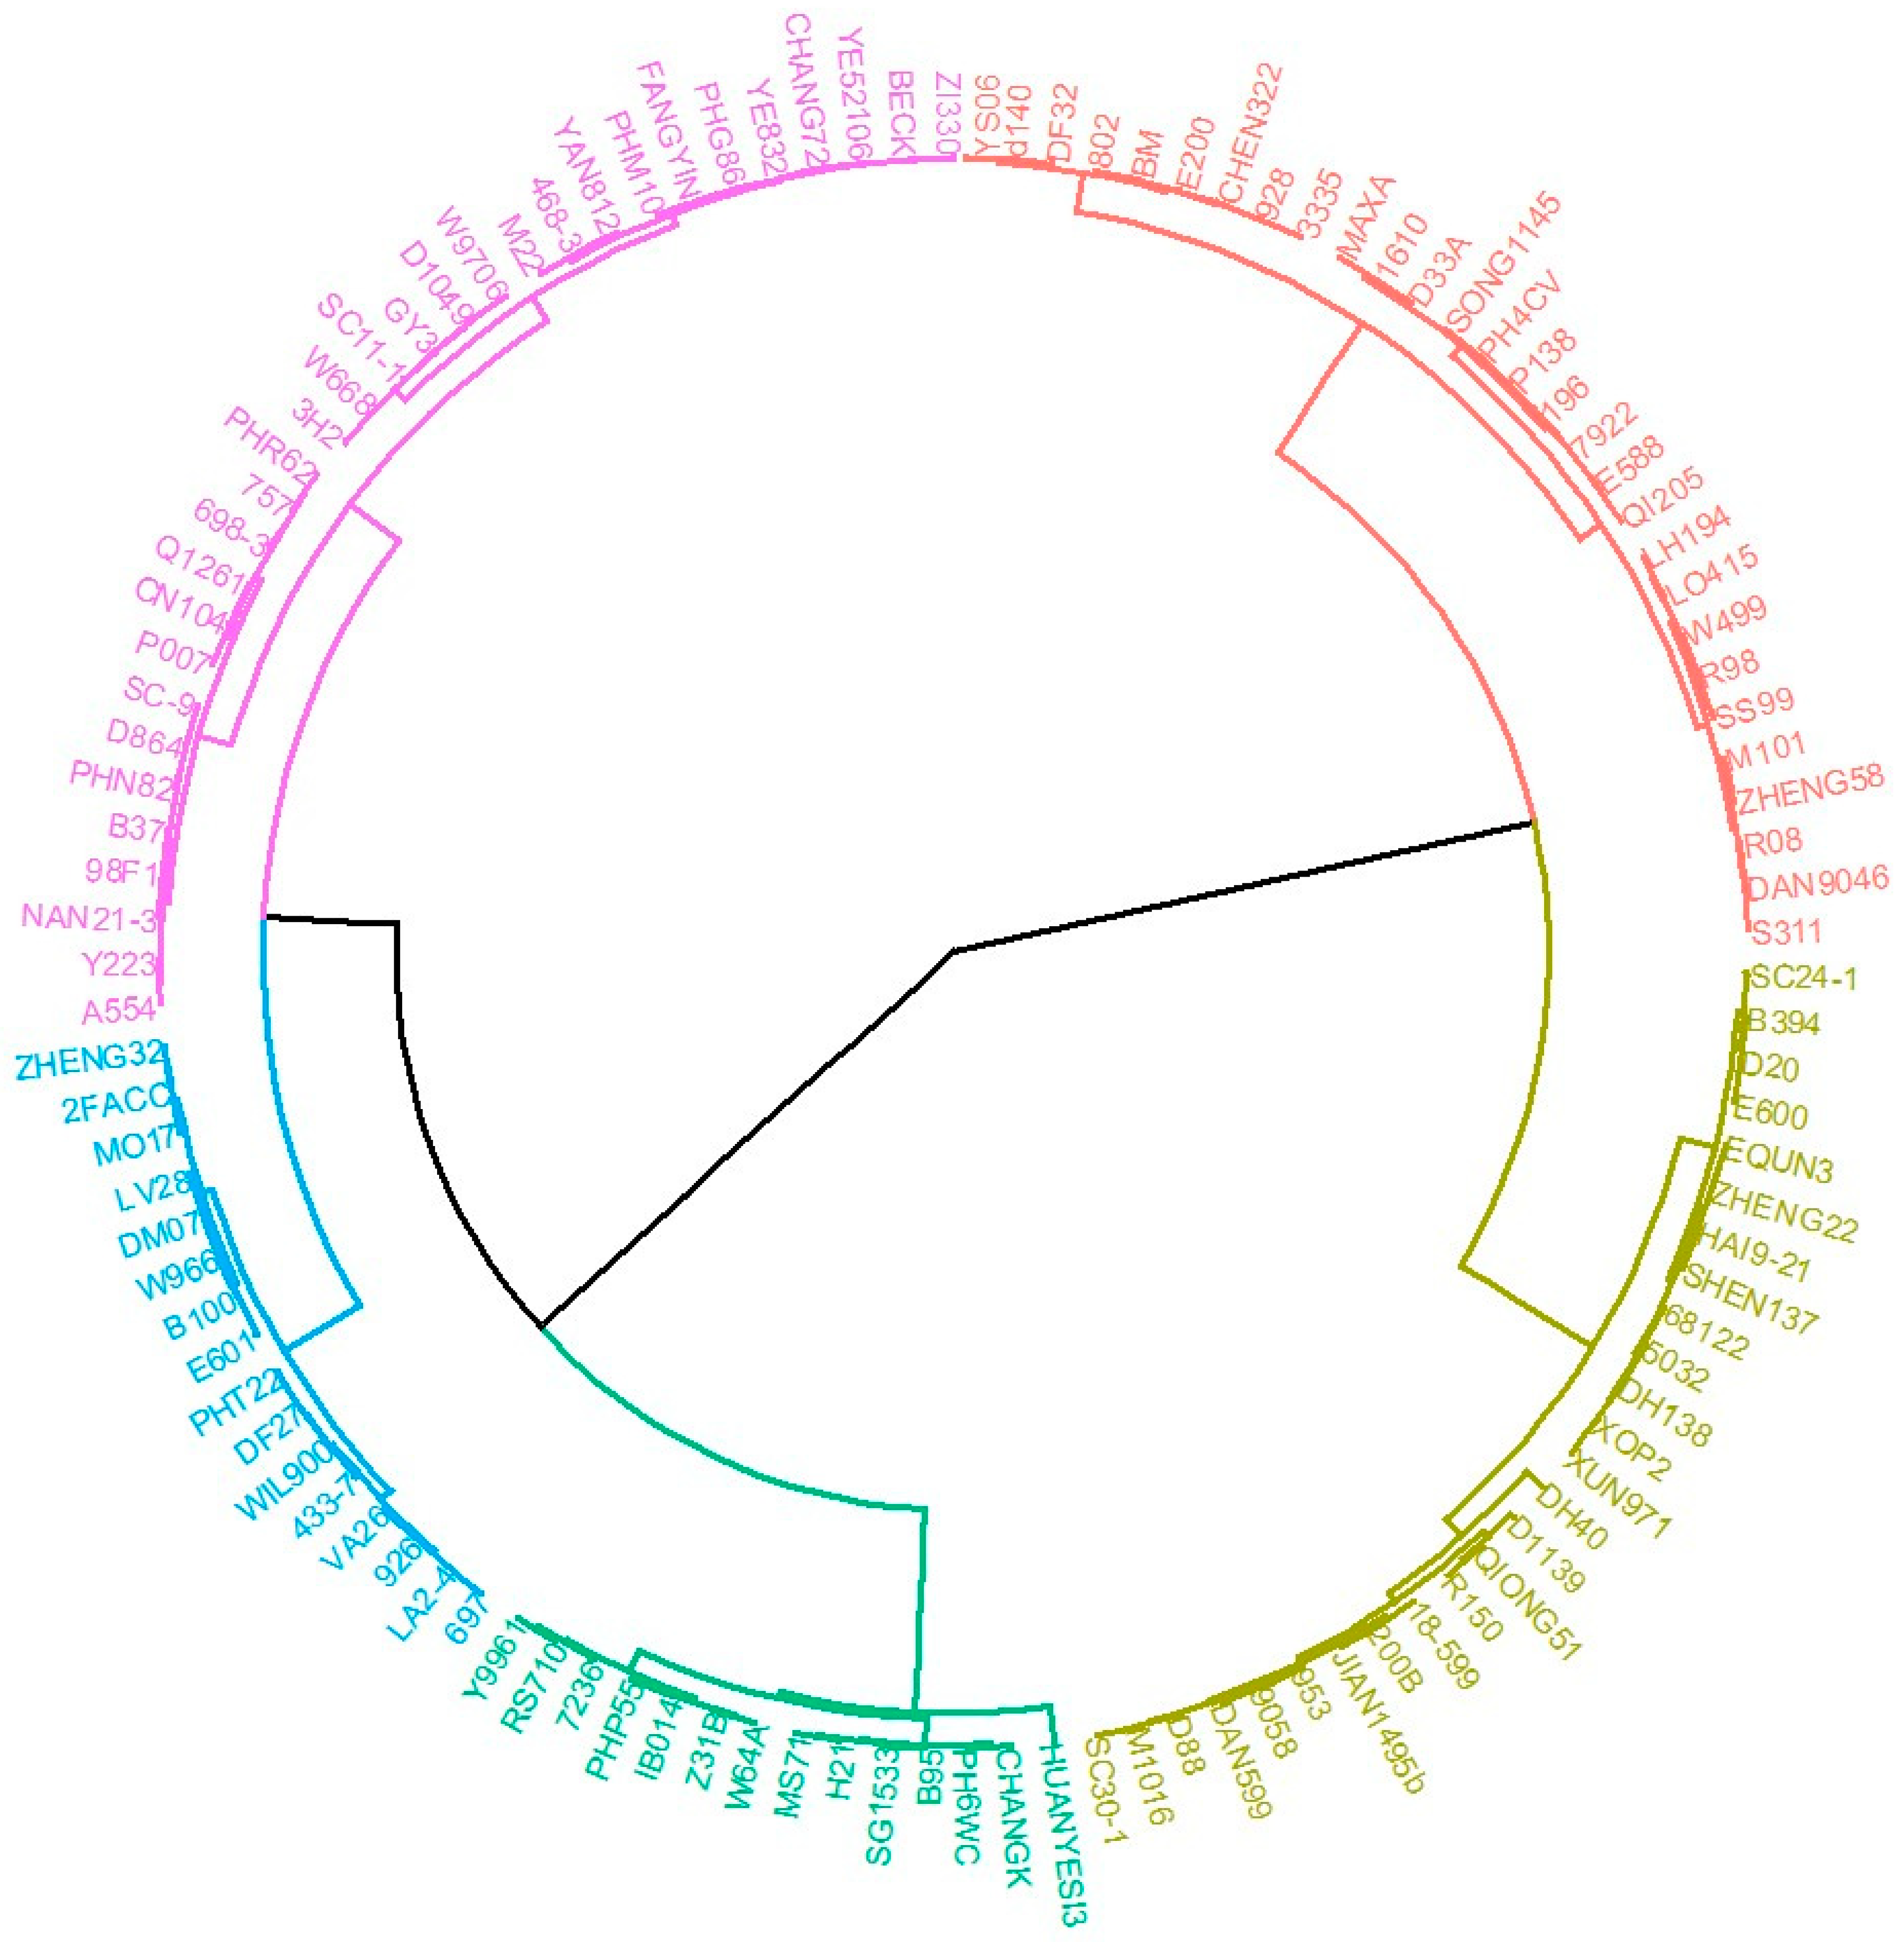
3.4. Cluster Analysis

Based on the D value of the comprehensive evaluation index of grain moisture content at maturity derived from the affiliation function, hierarchical clustering analysis was carried out using the hclust function based on the Euclidean distance in R. As can be seen in Figure 2, the 116 maize inbred lines clustered into 5 categories; the first category included 26 maize inbred lines with higher water content; the second, third and fourth categories included 29, 31 and 16 maize inbred lines, respectively; and the fifth category consisted of 14 maize inbred lines with lower water content, and most were U.S. maize inbred lines (Supplementary Table S4).

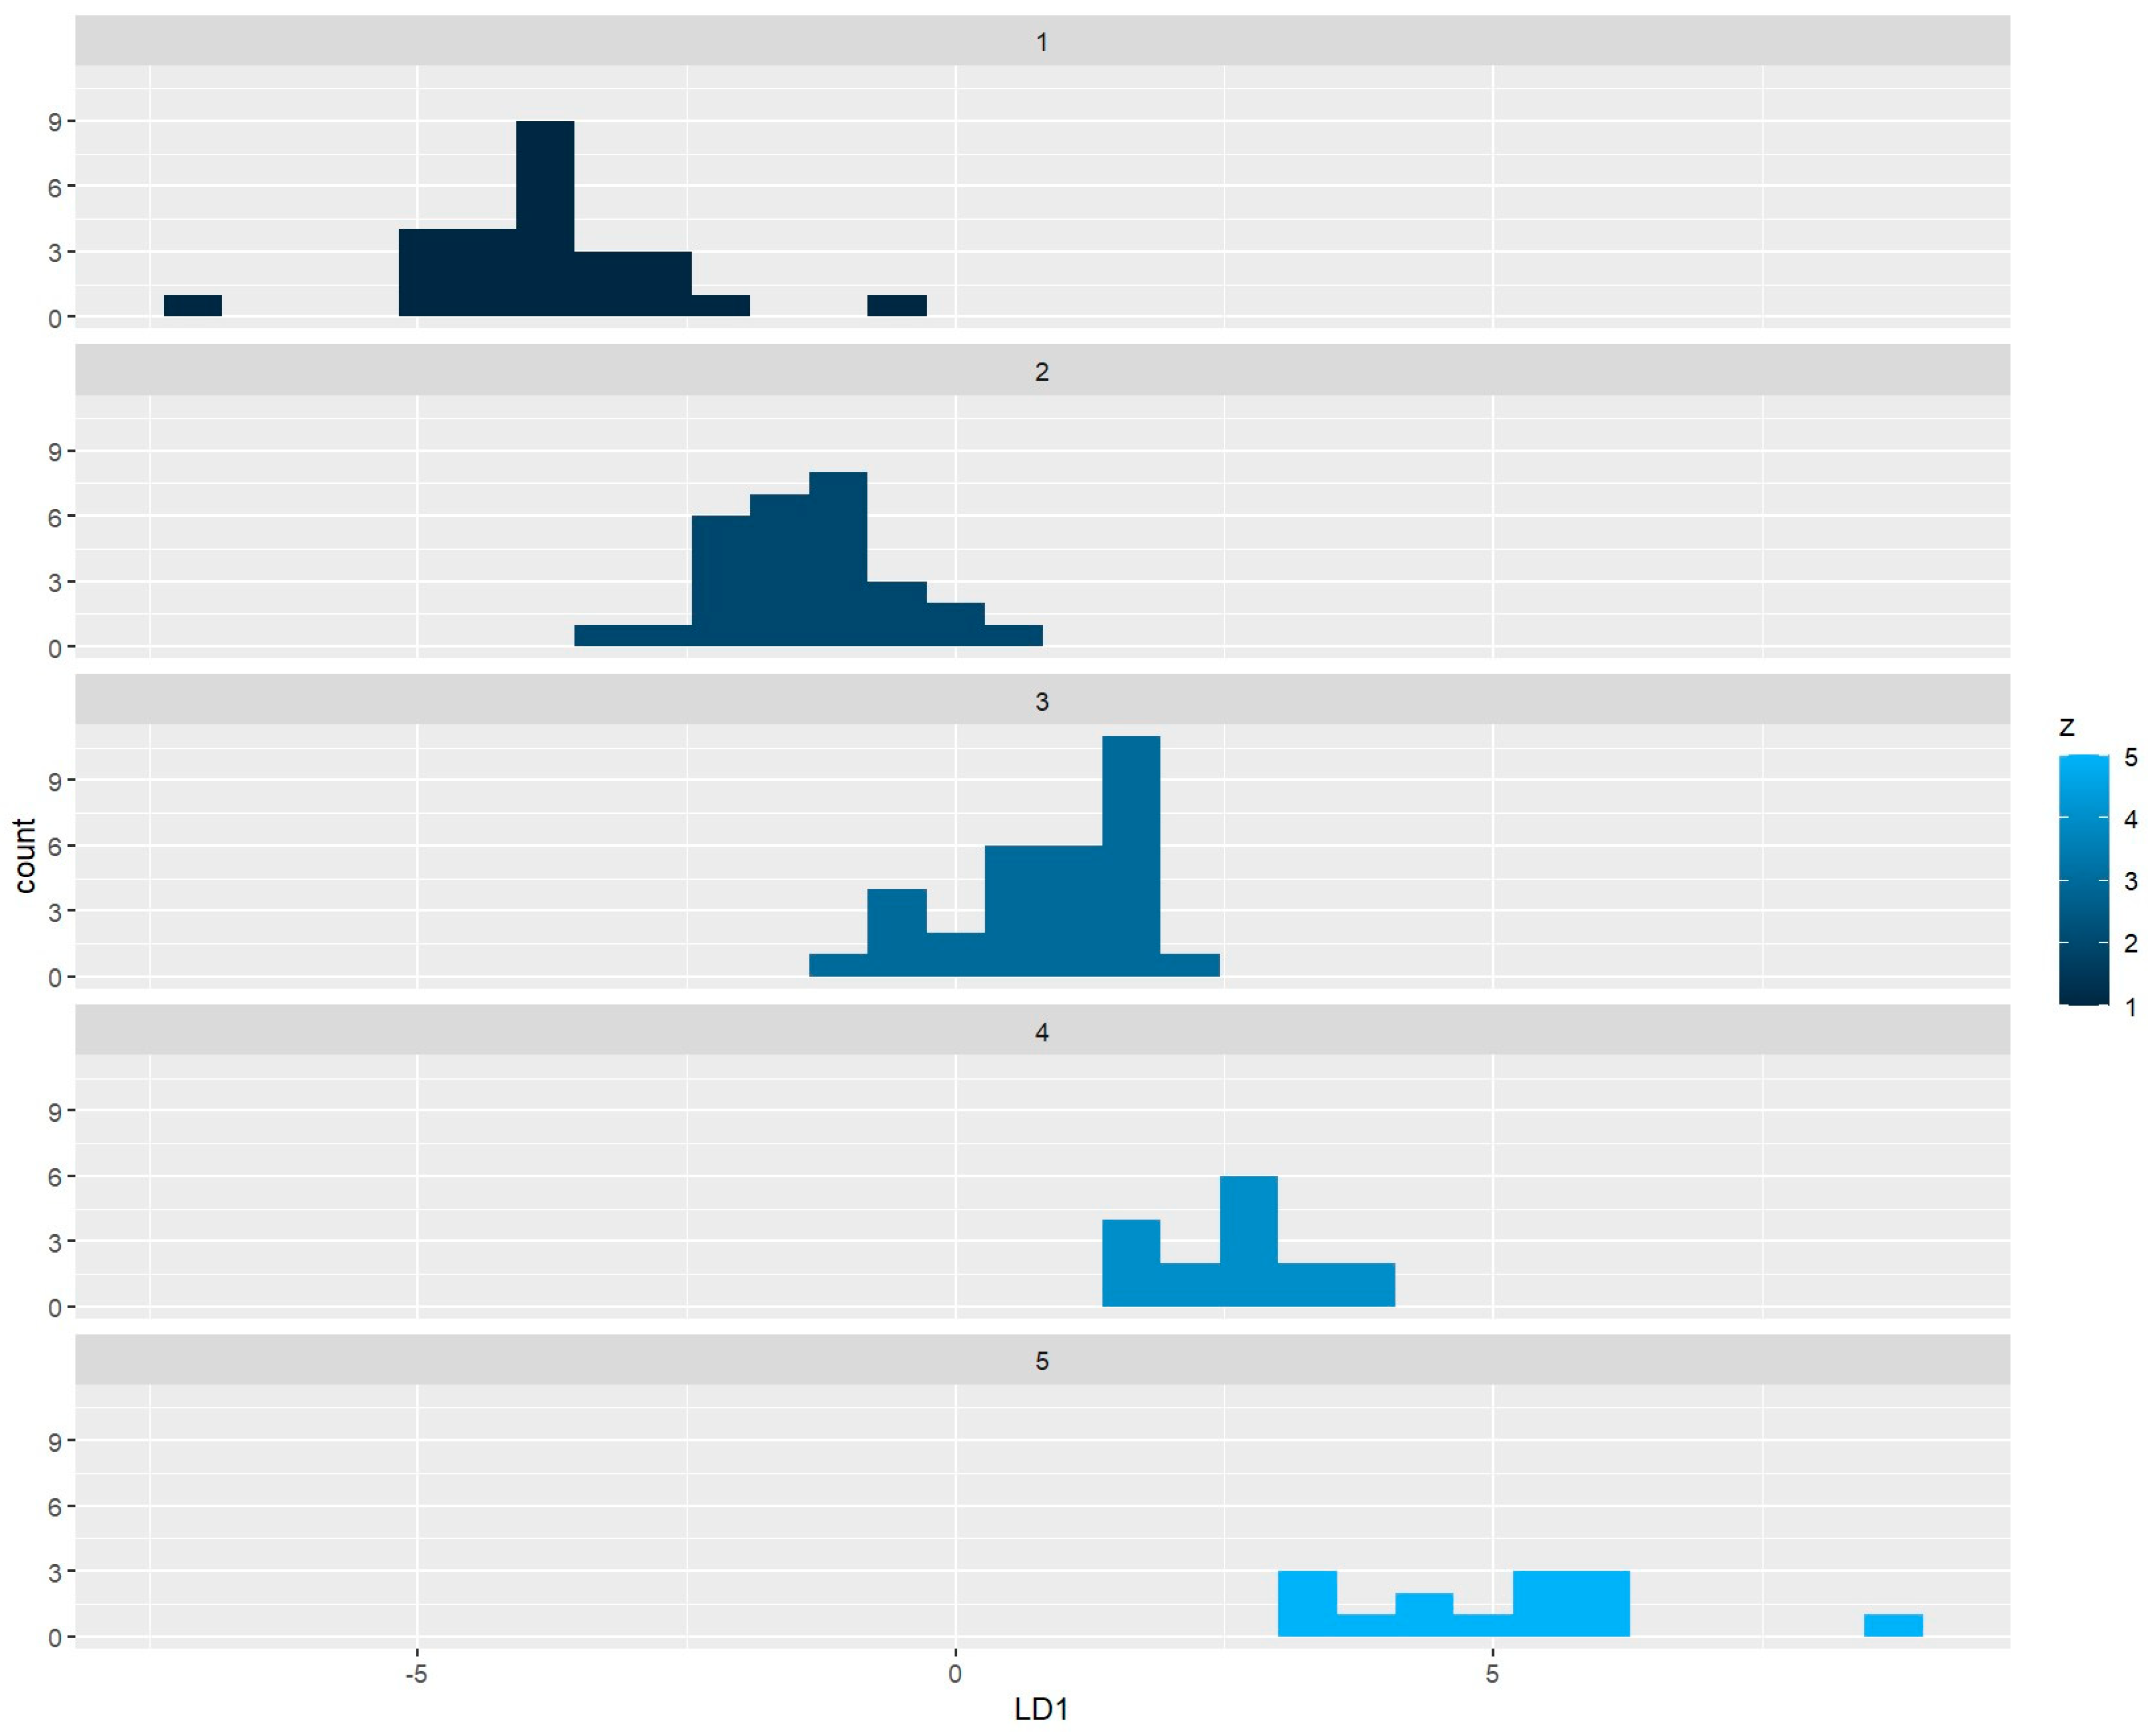
3.5. Discriminant Analysis

Linear discriminant analysis is a generalization of Fischer’s linear discriminant method that allows for better dimensionality reduction for subsequent classification. The dimensionality reduction method of linear discriminant analysis was used to verify the clustering results obtained using 10 principal components as discriminant variables in the MASS function in R-4.3.3 [26]. The LD discriminant was reclassified according to the LD value of each maize inbred line (Figure 3, Supplementary Table S5). The LD1 value, which had a retrospective rate of 95.36% and was the main basis for discrimination, showed that 18 maize inbred lines were classified incorrectly. The probability of right judgment was 84.48%, thus the clustering results were more reliable.

3.6. Regression Model Establishment and Verification

In order to screen traits to measure the grain moisture content of maize inbred lines at maturity, a mathematical model for accurately evaluating grain moisture content was developed using stepwise regression analysis. A stepwise regression equation was constructed using the integrated value of grain moisture content (D value) of maize inbred lines as the dependent variable, and the main traits with high contributions in the principal components and the main judgment traits of grain moisture content in the field as the independent variables. The final regression equation was D = 0.596 + 0.701 × GMC2 + 0.347 × GDR1 + 0.118 × HMC3 + 0.078 × NH-0.08 × GDR2 + 0.067 × CD + 0.065 × EL, with a coefficient of determination of the equation R2 = 0.939 and adjusted R2 = 0.935, F = 236.857, p = 0.00 < 0.01, indicating that there was a highly significant linear relationship between the D value and 20-day grain moisture content, 10–20-day grain dehydration rate, 30-day husk water content, number of husks, 20–30-day grain dehydration rate, cob diameter and ear length, indicating that the equation could be used to determine the grain moisture content capacity of maize inbred lines at maturity. Seven standardized traits were inserted into the regression equation to calculate the regression D value, and the root mean square error between the two was calculated as RMSE = 0.131; the regression value was more in line with the original value, indicating that the regression equation established in this study has high accuracy and can be used for comprehensive evaluation of grain moisture content.

3.7. Comparison of Grain Moisture Content Characteristics of Maize Inbred Lines at Maturity

The grain moisture content capacity of maize inbred lines at maturity was further evaluated by comparing the five groups of clusters using cluster analysis and regression analysis (Table 1). GROUP 1 contained 26 maize inbred lines, accounting for 22.41% of the total number, with 20-day grain moisture content, number of husks, cob diameter, and ear length values being highest among the five groups, and 10–20-day grain dehydration rate being lowest among the five groups; GROUP 2 contained 29 maize inbred lines, accounting for 25% of the total number, with 30-day husk moisture content being highest among the five groups and 20–30-day grain dehydration rate being lowest among the five groups; GROUP 3 contained 31 maize inbred lines, accounting for 26.72% of the total, with the value of each trait being intermediate among the five groups; GROUP 4 contained 16 maize inbred lines, accounting for 13.79% of the total, with the number of husks being lowest among the five groups; and GROUP 5 contained 14 inbred lines, accounting for 12.08% of the total, with 10–20-day and 20–30-day grain dehydration rates being highest among the five groups and 20-day grain moisture content, 30-day husk moisture content, cob diameter and ear length being the lowest among the five groups.

4. Discussion

4.1. Analysis of Maize Grain Moisture-Content-Related Traits and Evaluation Indexes

Many methods have been explored to measure grain moisture content. Examples include a moisture meter that measures moisture content by detecting changes in capacitance, the SK-300 moisture meter, a digital wood hygrometer (model BLD5601; General Electric, Lewiston, PA, USA), a wood hygrometer voltage process FM-200 moisture content meter (G WON Company, Seoul, South Korea), a grain hygrometer with a microwave attenuation of 10.5 GHz and a handheld hygrometer [27,28,29,30,31,32]. Although the instruments have been able to effectively measure the magnitude of moisture content, their accuracies are still not human-controlled. The traditional oven drying method is time-consuming and laborious, but the magnitude of water content is more accurate than other methods [14,33,34,35,36,37]. Therefore, the oven drying method was adopted in this experiment to determine the water content of the relevant traits. The accuracy of the data was within the tolerance of error because all destructive tests were used during data collection. Most of the variability in the related traits was within a reasonable range. The reason for the large variation in the cob dehydration rate may be due to the irreparable error caused by the destructive test; however, this also shows that the cob dehydration rate is very likely to affect the grain moisture content. A comparison of maize grain moisture content characteristics also found low grain moisture content in the maize inbred lines, with the fastest rate of dehydration, water content, cob diameter and ear length being lowest. This is highly consistent with the results of the study on the fast rate of dehydration of the grain [38,39,40].
Maize kernel moisture at harvest is influenced by kernel moisture at physiological maturity and by the field dehydration rate. Kernel moisture is critical in determining the timing of physiological maturity, but it is difficult to estimate this parameter accurately [2]. Saeed [41] used correlation, principal component and cluster analyses to evaluate disease resistance, fiber quality and some yield-related traits of cotton leafroll virus. Zheng [42] developed a regression model for accurately evaluating maize resistance to inverting by using correlation, principal component, cluster and ridge regression analyses for inverting related traits in 220 maize inbred lines. Zarei [43] used multivariate analysis such as simple correlation analysis, path coefficient analysis, stepwise regression, factor analysis and cluster analysis to evaluate the relationship between flint kernel yield and related traits under drought conditions.
We collected, processed and analyzed field data and used multiple regression to derive a mathematical model for grain moisture content that can provide a reference for subsequent measurement of grain moisture content in maize inbred lines.
In this study, 30 traits associated with grain moisture content were analyzed using multivariate statistics, and a regression model was established based on a comprehensive evaluation of the main traits derived from principal component analysis of agronomic traits in the field. Seven traits that were closely associated with grain moisture content (GMC2, GDR1, HMC3, NH, GDR2, CD and EL) were evaluated in a comprehensive manner with the grain moisture content to further accurately estimate the maize grain moisture content so that it can be expressed using simple and easy-to-measure traits.

4.2. Evaluation of Water Holding Capacity and Genetic Improvement of Maize Grains

With the current improvements in technology and people’s living standards, the demand for high-yield breeding has become greater, and high-quality maize has become one of the trends in maize breeding. Further research on the moisture content of maize grains can promote the development of the maize industry [18]. Maize is a model crop that utilizes hybrid advantage and is one of the best crops in the world to utilize hybrid advantage, thus selecting and breeding superior inbred lines to formulate hybrids is the main task of maize breeding [44]. The establishment of a mathematical model to more accurately evaluate the grain moisture content of maize inbred lines is of great significance for breeding new maize varieties for mechanical harvesting. Currently, less than 10% of maize kernels are mechanically harvested in China [45,46], with grain moisture content being one of the main reasons limiting the mechanical harvesting of maize. Agronomic trait profiling of maize grain moisture content can facilitate the judgment of maize inbred lines’ grain moisture content.
The grain moisture content at maturity is one of the prerequisites for the promotion of mechanized harvesting, hence it is essential to focus on grain moisture content when developing new maize varieties. Grain moisture at maturity is genetically controlled but also influenced by environmental factors; the final moisture of maize kernels at harvest is determined by two factors: the initial moisture content at physiological maturity and the drying rate in the field environment [14,47,48,49,50,51]. In this study, 30 agronomic traits associated with grain moisture content were subjected to multivariate statistical analysis, and 7 traits were selected to establish a regression model with an integrated value for comprehensive evaluation of grain moisture content, based on which the 7 traits can be used to evaluate moisture contents of maize inbred lines that will improve the efficiency of field measurement of grain moisture content and at the same time provide a theoretical basis for the selection of excellent maize inbred lines in the field.
Based on this study, a total of 14 maize inbred lines with low grain moisture content at maturity, represented by H21 and MS71, were screened. These can provide a genetic basis for the subsequent creation of excellent maize inbred lines. Based on the results of pre-laboratory and research analysis by Liu [18,52,53], of these 14 low grain moisture content maize inbred lines, 35.71% were from Lancaster, 28.58% were from P group, 21.43% were from TangSipingtou group and 14.39% were from Reid. Therefore, importance should be given to the utilization of the two dominant taxa, Lancaster and P Group, in the selection and breeding of maize inbred lines with low grain moisture content.
By comprehensively evaluating grain moisture content, husk moisture content and ear moisture content, and screening related indicators to establish a comprehensive evaluation model, we aimed to reduce the task of measuring grain moisture content at maturity and efficiently predict grain moisture content of maize inbred lines at maturity so as to provide a scientific basis and theoretical foundation for scientific judgment of maize grain moisture content and selection of high-quality maize inbred lines. The mathematical model we developed is statistically significant and can be used in future production practices to estimate the level of grain moisture content by analyzing seven trait indexes (GMC2, GDR1, HMC3, NH, GDR2, CD, and EL) and thus the level of grain moisture content. However, due to the environment and other complex factors being uncontrollable, it can be used as a reference to evaluate production practices.

5. Conclusions

In this study, 116 maize inbred lines were classified into 5 categories using multivariate statistical analysis of 30 traits associated with grain moisture content at maturity, and a mathematical model of grain moisture content was developed with 20-day grain moisture content, 10–20-day grain dehydration rate, 30-day husk water content, number of husk, 20–30-day grain dehydration rate, cob diameter and ear length as independent variables. Among the 14 maize inbred lines with low grain moisture content, emphasis should be placed on the use of Lancaster and P Group to select maize lines with low grain moisture content and create superior maize varieties. Screening and characterization of grain moisture-content-related trait indexes provide a scientific basis for the determination of grain moisture content in the field with a view to creating varieties more suitable for mechanization and thus providing a reference for promoting the course of mechanization. The results of this study provide a scientific reference for screening maize inbred lines for grain moisture content evaluation indexes at maturity and for determining grain moisture content in the field, resulting in the development of maize varieties with low grain moisture content that are suitable for mechanized planting.

Supplementary Materials

The following supporting information can be downloaded at: https://www.mdpi.com/article/10.3390/agronomy14071480/s1, Table S1. The name and pedigree or origin of 116 maize inbred lines. Table S2. Variability in grain moisture traits. Table S3. Eigenvectors and percentages of accumulated contribution of principal components. Table S4. Classification of 116 maize inbred line. Table S5. Discriminant analysis of 116 maize inbred line.

Author Contributions

J.G., R.G., W.S. (Wei Song), W.S. (Weibin Song) and P.H. designed the study; J.L., W.S. (Weibin Song), Y.Z. (Yunxiao Zheng), X.J. and Y.Z. (Yongfeng Zhao) developed the populations; Y.G., R.N. and J.L. generated the data; Y.G., R.N., X.J., Y.Z. (Yunxiao Zheng) and L.Z. analyzed the data; Y.G. and J.L. drafted the manuscript; Y.G., J.L., P.H., Y.Z. (Yunxiao Zheng), W.S. (Wei Song), R.G. and J.G. revised the manuscript. All authors have read and agreed to the published version of the manuscript.

Funding

This research was funded by the Science and Technology Innovation Team of Maize Modern Seed Industry in Hebei (Grant/Award Number: 21326319D); the National Natural Science Foundation of China (Grant/Award Number: 32272021); the State Key Laboratory of North China Crop Improvement and Regulation (Grant/Award Number: NCCIR2021ZZ-10).

Data Availability Statement

All the data used in this study are included in this manuscript.

Acknowledgments

We thank Jinsheng Lai of the National Maize Improvement Center, College of Agronomy, China Agricultural University, for providing the maize population.

Conflicts of Interest

The authors declare no conflicts of interest.

References

  1. Dong, Y.; Feng, Z.Q.; Ye, F.; Li, T.; Li, G.L.; Li, Z.S.; Hao, Y.C.; Zhang, X.H.; Liu, W.X.; Xue, J.Q.; et al. Genome-wide association analysis for grain moisture content and dehydration rate on maize hybrids. Mol. Breed. 2023, 43, 5. [Google Scholar] [CrossRef]
  2. Li, W.; Yu, Y.; Wang, L.; Luo, Y.; Peng, Y.; Xu, Y.; Liu, X.; Wu, S.; Jian, L.; Xu, J.; et al. The genetic architecture of the dynamic changes in grain moisture in maize. Plant Biotechnol. J. 2021, 19, 1195–1205. [Google Scholar] [CrossRef]
  3. Brooking, I.R. Maize ear moisture during grain-filling, and its relation to physiological maturity and grain-drying. Field Crops Res. 1990, 23, 55–68. [Google Scholar] [CrossRef]
  4. Liu, J.; Yu, H.; Liu, Y.; Deng, S.; Liu, Q.; Liu, B.; Xu, M. Genetic dissection of grain water content and dehydration rate related to mechanical harvest in maize. BMC Plant Biol. 2020, 20, 118. [Google Scholar] [CrossRef]
  5. Li, Y.L.; Dong, Y.B.; Yang, M.L.; Wang, Q.L.; Shi, Q.L.; Zhou, Q.; Deng, F.; Ma, Z.Y.; Qiao, D.H.; Xu, H. QTL detection for grain water relations and genetic correlations with grain matter accumulation at four stages after pollination in maize. Plant Biochem. Physiol. 2014, 2, 1000121–1000129. [Google Scholar]
  6. Wang, W.; Ren, Z.; Li, L.; Du, Y.; Zhou, Y.; Zhang, M.; Li, Z.; Yi, F.; Duan, L. Meta-QTL analysis explores the key genes, especially hormone related genes, involved in the regulation of grain water content and grain dehydration rate in maize. BMC Plant Biol. 2022, 22, 346. [Google Scholar] [CrossRef]
  7. Kang, M.S.; Zuber, M.S.; Colbert, T.R. Effects of certain agronomic traits on and relationship between rates of grain-moisture reduction and grain fill during the filling period in maize. Field Crops Res. 1986, 14, 339–347. [Google Scholar] [CrossRef]
  8. Waelti, H.; Buchele, W.F. Factors affecting corn kernel damage combine cylinders. Trans. ASAE 1969, 12, 55–59. [Google Scholar]
  9. Plett, S. Corn kernel breakage as a function of grain moisture at harvest in a prairie environment. Can. J. Plant Sci. 1994, 74, 543–544. [Google Scholar] [CrossRef]
  10. Capelle, V.; Remoué, C.; Moreau, L.; Reyss, A.; Mahé, A.; Massonneau, A.; Falque, M.; Charcosset, A.; Thévenot, C.; Rogowsky, P.; et al. QTLs and candidate genes for desiccation and abscisic acid content in maize kernels. BMC Plant Biol. 2010, 10, 2. [Google Scholar]
  11. Baute, T.; Hayes, A.; McDonald, I.; Reid, K. Agronomy guide for field crops. Ont. Minist. Agric. Food Rural. Aff. 2002, 811, 31–34. [Google Scholar]
  12. Kebebe, A.Z.; Reid, L.M.; Zhu, X.; Wu, J.; Woldemariam, T.; Voloaca, C.; Xiang, K. Relationship between kernel dry down rate and resistance to Gibber Ella ear rot in maize. Euphytica 2015, 201, 79–88. [Google Scholar] [CrossRef]
  13. Xiang, K.; Reid, L.M.; Zhang, Z.M.; Zhu, X.Y.; Pan, G.T. Characterization of correlation between grain moisture and ear rot resistance in maize by QTL meta-analysis. Euphytica 2012, 183, 185–195. [Google Scholar] [CrossRef]
  14. Purdy, J.L.; Crane, P.L. Inheritance of drying rate in “mature” corn (Zea mays L.). Crop Sci. 1967, 7, 294–297. [Google Scholar] [CrossRef]
  15. Kang, M.S.; Zuber, M.S.; Horrocks, R.D. An electronic probe for estimating ear moisture content of maize. Crop Sci. 1978, 18, 1083–1084. [Google Scholar] [CrossRef]
  16. Zhang, D.L.; Sun, Y.J.; Zhao, H.G. Design and experiment of the self-propelled combine harvester for corn and stalk. Trans. Chin. Soc. Agric. Eng. 2005, 21, 79–82. (In Chinese) [Google Scholar]
  17. Tong, P.Y. Corn grain mechanized harvesting. Agric. Technol. Equip. 2015, 4, 4–6. (In Chinese) [Google Scholar]
  18. Zheng, Y.; Yuan, F.; Huang, Y.; Zhao, Y.; Jia, X.; Zhu, L.; Guo, J. Genome-wide association studies of grain quality traits in maize. Sci. Rep. 2021, 11, 9797. [Google Scholar]
  19. Zheng, Y.; Hou, P.; Zhu, L.; Song, W.; Liu, H.; Huang, Y.; Wang, H.; Guo, J. Genome-Wide Association Study of Vascular Bundle-Related Traits in Maize Stalk. Front. Plant Sci. 2021, 12, 699486. [Google Scholar] [CrossRef]
  20. Zheng, Y.; Gao, X.; Yuan, F.; Liu, Q.; Huang, Y.; Zhao, Y.; Jia, X.; Zhu, L.; Chen, J.; Guo, J. Genome-wide association studies of grain quality traits in maize. Seed 2021, 40, 29–34. (In Chinese) [Google Scholar] [CrossRef]
  21. Xue, Y.; Warburton, M.L.; Sawkins, M.; Zhang, X.; Setter, T.; Xu, Y.; Grudloyma, P.; Gethi, J.; Ribaut, J.M.; Li, W.; et al. Genome-wide association analysis for nine agronomic traits in maize under well-watered and water-stressed conditions. Theor. Appl. Genet. 2013, 126, 2587–2596. [Google Scholar] [CrossRef]
  22. Dai, H.F.; Wu, H.; Maimaitiali, A.; Wang, L.H.; Apizi, M.; Zhang, J.S. Analysis of salt-tolerance and determination of salt tolerant evolution indicators in cotton seedlings of different genotypes. Sci. Agric. Sin. 2014, 47, 1290–1300. [Google Scholar]
  23. Danojevi, D.; Živko, U.I.; Nagl, N.; Taški-Ajdukovi, K.; Anski, J.B. Evaluation of sugar beet genotypes for root traits by principal component analysis and cluster analysis. Genetika 2016, 48, 339–348. [Google Scholar] [CrossRef]
  24. R Core Team. R: A Language and Environment for Statistical Computing; R Foundation for Statistical Computing: Vienna, Austria, 2015; Volume 14, pp. 12–21. [Google Scholar]
  25. Patto, M.C.V.; Alves, M.L.; Almeida, N.F.; Santos, C.; Moreira, P.M.; Satovic, Z.; Brites, C. Is the bread making technological ability of Portuguese traditional maize landraces associated with their genetic diversity? Maydica 2009, 54, 297–311. [Google Scholar]
  26. Kiani, S.; Jafari, A. Crop detection and positioning in the field using discriminant analysis and neural networks based on shape features. J. Agric. Sci. Technol. 2012, 14, 755–765. [Google Scholar]
  27. Reid, L.M.; Zhu, X.; Morrison, M.J.; Woldemariam, T.; Voloaca, C.; Wu, J.H.; Xiang, K. A non-destructive method for measuring maize kernel moisture in a breeding program. Maydica 2012, 55, 163–171. [Google Scholar]
  28. Qian, Y.L.; Zhang, X.Q.; Wang, L.F.; Chen, J.; Chen, B.R.; Lv, G.H.; Wu, Z.C.; Guo, J.; Wang, J.; Qi, Y.C. Detection of QTLs controlling fast kernel dehydration in maize (Zea mays L.). Genet. Mol. Res. 2016, 15, 3. [Google Scholar] [CrossRef]
  29. Yang, J.; Carena, M.J.; Uphaus, J. Area under the dry down curve (AUDDC): A method to evaluate rate of dry down in maize. Crop Sci. 2010, 50, 2347–2354. [Google Scholar] [CrossRef]
  30. Filipenco, A.; Mandache, V.; Valsan, G.; Ivan, F.; Ciocazanu, I. Inheritance of grain dry-down in corn (Zea mays L.). Agriculture 2013, 70, 223–226. [Google Scholar] [CrossRef]
  31. Kim, K.B.; Noh, S.H.; Kim, J.H. Development of grain moisture meter using microwave attenuation at 10.5 GHz and moisture density. IEEE Trans. Instrum. Meas. 2000, 51, 72–77. [Google Scholar]
  32. Freppon, J.T.; Martin, S.K.S.; Pratt, R.C.; Henderlong, P.R. Section for low ear moisture in corn, using a hand-held meter. Crop Sci. 1992, 32, 1062–1064. [Google Scholar] [CrossRef]
  33. Prado, S.A.; López, C.G.; Gambín, B.L.; Abertondo, V.J.; Borrás, L. Dissecting the genetic basis of physiological processes determining maize kernel weight using the IBM (B73×Mo17) Syn4 population. Field Crops Res. 2013, 145, 33–43. [Google Scholar] [CrossRef]
  34. Sala, R.G.; Andrade, F.H.; Camadro, E.L.; Cerono, J.C. Quantitative trait loci for grain moisture at harvest and field grain drying rate in maize (Zea mays L.). Theor. Appl. Genet. 2006, 112, 462–471. [Google Scholar] [CrossRef] [PubMed]
  35. Wang, Z.; Zhang, L.; Liu, X.; Hong, D.; Li, T.; Jin, X. QTL underlying field grain drying rate after physiological maturity in maize (Zea mays L.). Euphytica 2012, 185, 521–528. [Google Scholar] [CrossRef]
  36. Borrás, L.; Westgate, M.; Otegui, M. Control of kernel weight and kernel water relations by post-flowering source-sink ratio in maize. Ann. Bot. 2003, 91, 857–867. [Google Scholar] [CrossRef] [PubMed]
  37. Sala, R.G.; Andrade, F.H.; Westgate, M.E. Maize kernel moisture at physiological maturity as affected by the source-sink relationship during grain filling. Crop Sci. 2007, 47, 711–714. [Google Scholar]
  38. Zhang, L.; Fan, Q.; Chen, X.; Li, B.; Zhang, Y.; Xiu, L. Correlation analysis of grain dehydration rate and major agronomic traits after physiological ripening in maize. Agric. Sci. 2012, 3, 1–2. (In Chinese) [Google Scholar]
  39. Gambin, B.L.; Borras, L.; Otegui, M.E. Kernel water relations and duration of grain filling in maize temperate hybrids. Field Crops Res. 2007, 101, 1–9. [Google Scholar] [CrossRef]
  40. Maiorano, A.; Fanchini, D.; Donatelli, M. MIMYCS. Moisture, a process-based model of moisture content in developing maize kernels. Eur. J. Agron. 2014, 59, 86–95. [Google Scholar]
  41. Saeed, F.; Farooq, J.; Mahmood, A.; Riaz, M.; Hussain, T.; Majeed, A. Assessment of genetic diversity for cotton leaf curl virus CLCuD, fiber quality and some morphological traits using different statistical procedures in Gossypium hirsutum L. Aust. J. Crop Sci. 2014, 8, 442–447. [Google Scholar]
  42. Zheng, Y.X.; Hou, P.; Jia, X.Y.; Zhu, L.Y.; Zhao, Y.F.; Song, W.B.; Song, W.; Guo, J.J. Evaluation of the lodging resistance and the selection of identification indexes of maize inbred lines. Food Energy Secur. 2023, 12, 5. [Google Scholar] [CrossRef]
  43. Zarei, L.; Cheghamirza, K.; Farshadfar, E. Evaluation of grain yield and some agronomic characters in durum wheat (Triticum turgidum L.) under rainfed conditions. Aust. J. Crop Sci. 2013, 7, 609–617. [Google Scholar]
  44. Li, K.; Yan, J.; Li, J.; Yang, X. Genetic architecture of rind penetrometer resistance in two maize recombinant inbred line populations. BMC Plant Biol. 2014, 14, 152. [Google Scholar] [CrossRef] [PubMed]
  45. Li, S.; Wang, K.; Xie, R.; Ming, B. Mechanical grain harvest promotes the transformation of corn production mode. Agric. Sci. China 2018, 51, 1842–1844. (In Chinese) [Google Scholar]
  46. Guo, Y. Analysis of the Factors Affecting the Quality of Corn Mechanical Grain Harvest and Farmers’ Mechanical Harvest Behavior; Chinese Academy of Agricultural Sciences: Beijing, China, 2015. (In Chinese) [Google Scholar]
  47. Chase, S.S. Relation of yield and number of days from planting to flowering in early maturity maize hybrids of equivalent grain moisture at harvest. Crop Sci. 1964, 4, 111–112. [Google Scholar] [CrossRef]
  48. Cross, H.Z. A selection procedure for ear drying-rates in maize. Euphytica 1985, 34, 409–418. [Google Scholar] [CrossRef]
  49. DeJager, B.; Roux, C.Z.; Kvhn, H.C. An evaluation of two collections of South African maize (Zea mays L.) germplasm: 2. The genetic basis of dry-down rate. S. Afr. J. Plant Soil. 2004, 21, 120–122. [Google Scholar] [CrossRef]
  50. Magari, R.; Kang, M.; Zhang, Y. Genotype by environment interaction for ear moisture loss rate in corn. Crop Sci. 1997, 37, 774–779. [Google Scholar] [CrossRef]
  51. Zhang, Y.; Kang, M.S.; Magari, R. A diallel analysis of ear moisture loss rate in maize. Crop Sci. 1996, 36, 1140–1144. [Google Scholar] [CrossRef]
  52. Liu, Y.; Guo, J.J.; Zhang, D.M.; Zhao, Y.F.; Zhu, L.Y.; Huang, Y.Q.; Chen, J.T. Genetic diversity and linkage disequilibrium estimation among the maize breeding germplasm for association mapping. Int. J. Agric. Biol. 2014, 16, 851–861. [Google Scholar]
  53. Liu, Z.Z.; Wu, X.; Liu, H.L.; Li, Y.X.; Li, Q.Z.; Wang, F.G.; Shi, Y.S.; Song, Y.C.; Song, W.B.; Zhao, J.R.; et al. Genetic diversity and population structure of 820 important inbred Chinese maize lines revealed based on 40 core SSR markers. China Agric. Sci. 2012, 45, 2107–2138. (In Chinese) [Google Scholar]
Figure 1. Correlation coefficients of traits associated with grain water content. GMC1-5, NH, HMC1-5, EL, ED, RN, KN, CMC1-2, CL, CD, CDR, GDR1-4, AG, PG, R, GL, GW and HGW stand for 10, 20, 30, 40, 50-day grain moisture content, number of husks, 10, 20, 30, 40, 50-day husk moisture content, ear length, ear diameter, row number per ear, kernel number per row, 40, 50-day cob moisture content, cob length, cob diameter, 40–50-day cob dehydration rate, 10–20, 20–30, 30–40, 40–50-day grain dehydration rate, area of grain, perimeter of grain, length/width ratio, grain length, grain width and hundred-grain weight, respectively. * Significant at 0.05 probability level, ** Significant at 0.01 probability level, *** Significant at 0.001 probability level.
Agronomy 14 01480 g001
Figure 2. Hierarchical clustering of D values of grain moisture content indexes of maize inbred lines at maturity. Green, blue, purple, red, and army green represent the results of clustering and classifying the inbred lines with the lowest to the highest grain moisture content, respectively.
Agronomy 14 01480 g002
Figure 3. LD1 discriminant plots of 116 maize inbred lines. Counts 1, 2, 3, 4 and 5 represent the number of discrimination groups. LD1 stands for linear discriminant analysis statistical values.
Agronomy 14 01480 g003
Table 1. Description of each group in hierarchical cluster results.
GROUPGMC2GDR1HMC3NHGDR2CDEL
I66.94 1.97 71.24 10.19 1.62 24.99 13.11
II63.95 2.17 72.59 9.76 1.54 23.49 12.59
III62.58 2.19 59.81 9.45 1.59 22.43 12.42
IV61.31 2.25 51.63 9.06 1.56 21.16 12.77
V58.07 2.45 50.07 9.86 1.74 20.69 11.81
Disclaimer/Publisher’s Note: The statements, opinions and data contained in all publications are solely those of the individual author(s) and contributor(s) and not of MDPI and/or the editor(s). MDPI and/or the editor(s) disclaim responsibility for any injury to people or property resulting from any ideas, methods, instructions or products referred to in the content.

