Article

Effects of Drip Irrigation Flow Rate and Layout Designs on Soil Salt Leaching and Cotton Growth under Limited Irrigation

by
Yurong Chang
1,
Dongwei Li
2,* and
Shuai He
3,4,*
1
College of Water Conservancy and Architectural Engineering, Shihezi University, Shihezi 832000, China
2
Farmland Irrigation Research Institute, Chinese Academy of Agricultural Sciences, Xinxiang 453002, China
3
Institute of Farmland Water Conservancy and Soil Fertility, Xinjiang Academy of Agricultural Reclamation Sciences, Shihezi 832000, China
4
Northwest Oasis Water-Saving Agriculture Key Laboratory, Ministry of Agriculture and Rural Affairs of the People’s Republic of China, Shihezi 832000, China
*
Authors to whom correspondence should be addressed.
Agronomy 2024, 14(7), 1499; https://doi.org/10.3390/agronomy14071499
Submission received: 4 June 2024 / Revised: 3 July 2024 / Accepted: 8 July 2024 / Published: 10 July 2024
(This article belongs to the Special Issue Influence of Irrigation and Water Use on Agronomic Traits of Crop)

Abstract

:
Optimal drip irrigation management in shallow groundwater areas needs to clarify the effects of flow rate and layout designs on the soil moisture, salt distribution, cotton root length density, plant height, leaf area, and yield. In this study, a one-year field experiment was conducted from April to October 2018 in the fifth company of the 16th Regiment in Alar City, Xinjiang, to investigate the effects of various drip flow rates and layout designs of cotton growth. Two drip flow rates (2.8 and 5.6 L·h−1) and two layout designs (one film, two drip tapes, and six rows; one film, three drip tapes, and six rows) were applied to explore the optimal combination, resulting in a total of four treatments that were irrigated three times in the whole growth period. Soil moisture, salt distribution, cotton root length density, plant height, and leaf area were measured. The main results were as follows: (1) Under the same layout designs, the soil moisture content was higher and the soil salinity was lower when the drip flow rate was 5.6 L·h−1, and the cotton root length density, plant height, leaf area, and yield were significantly higher than that of 2.8 L·h−1. (2) Under the same drip flow rate, the soil desalination rate, cotton growth indexes, and yield under the three-tapes treatment were significantly higher than the values of the two-tapes treatment. The actual yield of treatment D was 21.56%, 19.23%, and 11.71% higher than that of treatments A, B, and C, respectively. (3) The crop evapotranspiration of cotton during the two irrigation cycles showed an increasing trend, and the groundwater contribution showed a smaller and then increasing trend. Overall, the combination of three tapes and a drip flow rate of 5.6 L·h−1 had the highest cotton yield and net income, which were 6211.36 kg·hm−2 and 4820.21 kg·hm−2 for the theoretical and actual yields. The results of this study can provide a reference for the management of limited irrigation leaching soil salinity and cotton cultivation in shallow groundwater areas.

1. Introduction

Irrigation plays a key role in agricultural production in arid and semi-arid regions globally [1], and water use for irrigated agriculture accounts for up to 70 per cent of available water resources [2,3,4,5]. In order to guarantee world food security and the sustainable development of agriculture, the adoption of limited irrigation methods and the effective use and management of water resources are important initiatives to cope with the water crisis [6,7], especially in irrigated agricultural areas close to reservoirs, rivers, and other areas with a shallow groundwater table. However, limited irrigation will cause the redistribution of soil moisture and salt in farmland [8,9]. It is necessary to find out the influence of soil salt transport to ensure the stable output of agriculture.
The southern Xinjiang region is the main cotton-producing area in China. Due to extreme drought and the high salt content of the soil parent material, the degree of salinization of cultivated land in southern Xinjiang is significantly higher than that in northern Xinjiang [10], and the efficiency of irrigation water is also lower than that in northern Xinjiang [11]. Therefore, the optimization of drip irrigation technical parameters is an urgent issue. The irrigation frequency of conventional cotton fields under drip irrigation in southern Xinjiang is usually 7–10 times, and the irrigation quota is 300–500 mm [12,13]. However, the soil desalting area formed by large drip flow rates is wide and shallow, and the soil moisture content is high. Moreover, the shallow fine roots of cotton mainly concentrate at a shallow depth, and under suitable groundwater burial depth conditions, groundwater significantly reduces the amount and irrigation frequency in agricultural fields by recharging the soil moisture in the root zone of the crop [14,15]. In addition, water-limited irrigation will promote a change in the crop root architecture and guide crops to absorb and utilize groundwater. Some crop roots can even extend to 2 m below the ground [16,17]. Therefore, reasonable technical parameters of drip irrigation under film are applied under the limited irrigation conditions in the area with the shallow groundwater level buried. This can not only promote crops to make full use of groundwater and reduce irrigation water, but also achieve the purpose of salt pressure and water and fertilizer application. This is of great significance for the sustainable development of agriculture in arid areas.
Previous studies have shown that soil desalination can be controlled by regulating the drip flow rate or drip irrigation tape-laying pattern, which is conducive to the uniform growth of the crop root system and achieves the purpose of enhancing the crop yield [18,19,20]. This would form two desalination zones in the shallow layer (0–40 cm) of soil, and the distribution of crop roots will be looser and more uniform. The soil desalting zone formed by small drip flow rates is narrow and deep, and the crop root distribution is denser with a poor uniformity, which is not conducive to crop growth and development [21,22]. The deployment method of drip irrigation tapes also affects the distribution of soil water, heat, and salt and crop growth under drip irrigation with mulch. In Xinjiang, the commonly used machine-harvested cotton film width is 2.05 m. Under the planting mode of onefilm and two tapes with six rows (drip irrigation tapes are laid out in wide rows), the soil under the film will form two desalination zones [23]. Under this arrangement, the soil in the root zone of the cotton line is prone to salinity accumulation, which will affect the growth of cotton. With a layout of one film, three tapes, and six rows of drip irrigation tape (drip irrigation tapes are laid out in narrow rows), three desalination zones will be formed in the cotton root zone. Compared with the mode of one film and two tapes with six rows, the mode with one film, three tapes, and six rows has more advantages considering the soil salt leaching effect, nutrient retention, cotton growth uniformity, and yield in the root layer [24,25]. Some studies have also found that, under the conditions of one film and three tapes, the emergence rate and soil water utilization rate of cotton were higher, which was more suitable for the growth and development of cotton [26]. Therefore, when formulating the technical parameters of mulch drip irrigation in saline farmland with a shallow groundwater depth in Xinjiang, the desalination range of soil under mulch and the requirements of salt distribution should be considered at the same time. Current research results on this aspect are still lacking and the degree of attention is not high.
However, the effects of various drip flow rates and layout designs on soil salinity, seed cotton yield, and cotton water use efficiency are not clear. More importantly, the soil water and salt in saline–alkali soil in shallow groundwater areas are affected by groundwater, which affects the parameter design of the drip irrigation strategy. It is necessary to further quantitatively explore the effects of the combination of both on the soil water and salt changes and seed cotton yield, and find out the best combination parameters. Therefore, the objectives of this study are: (1) to study the effects of various drip flow rates and layouts on the distribution of soil moisture and salt in the root zone; and (2) to explore effects of various drip flow rates and layouts on groundwater utilization, cotton root distribution, plant growth, and yield. This can provide a theoretical reference for the selection of the appropriate irrigation parameters for drip irrigation under film in areas with a shallow groundwater depth.

2. Materials and Methods

2.1. Site Description

The test was conducted from April to October, 2018, in the 16th Regiment of Aral City, 1st Division, Xinjiang (80°50′ E, 40°29′ N). The test site is adjacent to Aksu River in the north, Shengli Reservoir in the east, and Upstream Reservoir in the west. It is a multi-year drip-irrigated cotton field, which belongs to a typical extreme arid climate zone, with average annual sunshine of 2556.3–2991.8 h. This site has an altitude of 1025 m, average annual precipitation of 40.1–82.5 mm, and average annual evapotranspiration of 1976.6–2558.9 mm. Groundwater is found at a depth of 0.6–1.0 m (Figure 1). The total precipitation of cotton during the whole growth period was 93.0 mm, and there were 6 effective periods of precipitation greater than 5 mm. The average daily maximum temperature was 38.2 °C, and the average daily minimum temperature was 4.1 °C (Figure 2). The physical and hydraulic properties of soil are shown in Table 1.

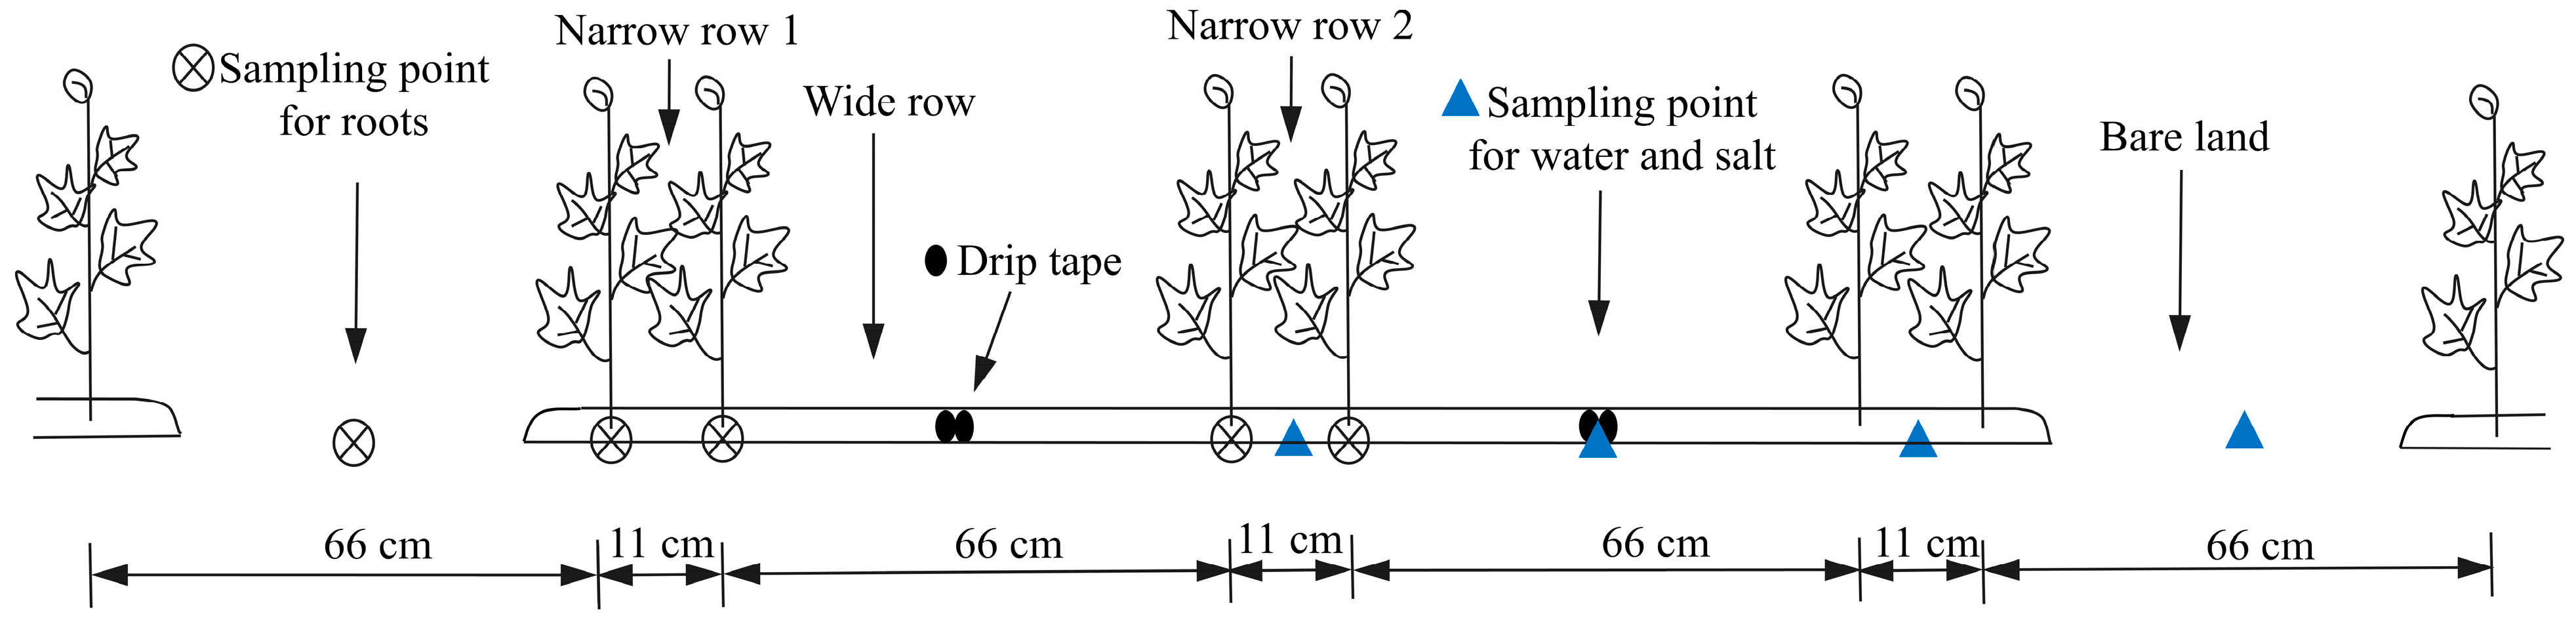
2.2. Experiment Design

The cotton variety for the test was “Xinluzhong 35”, which is widely promoted and applied in the local area, and was sown on 22 April 2018. The planting pattern was 1 film and 6 rows, wide–narrow row (66 + 11) cm planting, a plant spacing of 11 cm, a film width of 205 cm, and a film spacing of 40 cm. The labyrinth thin-walled drip irrigation tape produced by Xinjiang Tianye Plasticization Group was used. The drip spacing was 30 cm and the maximum drip flow rate was 2.8 L·h−1. Different water distribution under the film was obtained by regulating the drip flow rate and layout design. There were two treatments for the drip flow rate. The first was a single drip irrigation tape with a drip flow rate of 2.8 L·h−1. The second was a combination of the two drip irrigation tapes to work together to obtain a drip flow rate of 5.6 L·h−1 (Figure 3). Two treatments were also set up for the layout design, the cotton planting model with one film, two drip tapes, and six rows and the cotton planting model with one film, three drip tapes, and six rows. The treatments were labelled as A (1 film, 2 tapes, drip flow rate of 2.8 L·h−1), B (1 film, 3 tapes, drip flow rate of 2.8 L·h−1), C (1 film, 2 tapes, drip flow rate of 5.6 L·h−1), and D (1 film, 3 tapes, drip flow rate of 5.6 L·h−1), with a total of 4 treatments. The effects of the different treatments on the distribution of soil moisture and salt in the cotton root zone, cotton growth (root length density, plant height, and leaf area), and yield were observed.
Each treatment was arranged with 7 films (area of 350 m2), and the total area of the test area was 1400 m2. Due to the frequent precipitation in the test year, the widespread planting of rice around the test site, and the influence of being close to the river channel, the soil moisture conditions in the plough layer were better. Therefore, the irrigation in the test area is mainly used for leaching salt and is conducive to fertilization. A total of 3 periods of irrigation occurred during the growth period. The irrigation water in the test area was river water, and the electrical conductivity was lower than 0.8 dS/cm. The irrigation days were 28 June, 10 July, and 25 July, respectively. The irrigation quotas were 37.5 mm, 45 mm, and 45 mm, respectively.

2.3. Test Indicators and Methodology

2.3.1. Soil Moisture and Salt Content

The soil moisture content was determined by a drying method. Seven sampling points were selected for each treatment, which were 0 cm (bare land), 38 cm (narrow row 1 center), 76 cm (wide row center), and 115 cm (narrow row 2 center) from the center of bare land outside the film, and the sampling depths were 0, 10, 20, 30, 40, 60, 80, and 100 cm, respectively. Tests were performed before and after irrigation.
The relationship between the soil salt content and electrical conductivity was determined by the leaching solution conductivity method.
C g = 0.0002 E c + 0.23 ( R 2 = 0.918 , n = 23 )
where Cg is the soil salt content (g kg−1), Ec is the conductivity (μS cm−1), and n is the number of samples.
The soil desalination rate calculation formula is:
C R = ( C g 0 C g 1 ) / C g 0 × 100 %  
where CR is the soil desalination rate (%), Cg0 is the soil salt content before irrigation (g kg−1), and Cg1 is the soil salt content after irrigation (g kg−1).

2.3.2. Root Length Density

Cotton root samples were taken by the root drilling method during cotton bolling (15 September). According to the drilling depth, one layer was taken every 15 cm, and the sampling depth was 60 cm. A total of 4 layers were repeated twice. The sampling positions were the center of the bare ground outside the film, the two rows of cotton in narrow row 1, the center of the wide row under film, and the narrow row 2 (Figure 2). The cotton roots were soaked in water for 24 h, and the cotton root segments were picked up with a 0.5 mm aperture sieve, dried to a constant weight at 65 °C, and then the roots were laid on a white paper with a 20 cm control line for photographing. The root length was calculated by R2v 5.5 and Photoshop 2017 software, and the root length density was obtained by dividing the volume of each layer of soil sample.

2.3.3. Plant Height, Leaf Area, and Yield

Five representative cotton rows were selected in each treatment, and the plant height and leaf area were observed. Observation was conducted once at the seedling stage, and once every 20 days from flowering to maturity.
The number of cotton plants in different treatments was counted at maturity, and three 11.4 m2 quadrants were selected in each treatment for the artificial harvesting of cotton to measure its actual yield. The number of cotton bolls in each treatment within 34.2 m2 was counted, and the average number of bolls per plant was calculated. Thirty cotton bolls were randomly picked in each cotton row to obtain the average single boll weight of cotton, and the theoretical yield of cotton in different treatments was calculated.

2.3.4. Irrigation Water Use Efficiency and Crop Water Use Efficiency

Because the groundwater depth was shallow, it was difficult to divide the groundwater and irrigation water. Therefore, the ratio of the seed cotton yield to the irrigation quota is used to evaluate the use efficiency of the irrigation water. The calculation formula is:
IWUE = Y/10I
where Y is the seed cotton yield (kg·hm−2) and I is the irrigation quota (mm).
The crop water use efficiency of cotton is the ratio of the seed cotton yield to the water consumption, and the calculation formula is:
CWUE = Y/10ETc
where ETc is the crop’s evapotranspiration (mm·d−1).
Due to the shallow groundwater depth, cotton is not susceptible to water stress, and its water consumption can be estimated by Equation (4).
ETc = Kc × ET0
where ET0 is the reference crop evapotranspiration (mm·d−1), which is calculated using the Penman–Monteith formula, as shown in Formula (6). Kc is the cotton crop coefficient. It is determined according to the cotton growth stage to be 0.60 (seedling: 1–26 June), 1.15 (flowering to bolling: 27 June–10 August), and 0.58 (bolling to maturity: 11–30 August).
E T 0 = 0.408 Δ ( R n G ) + γ 900 T + 273 u 2 ( e s e a ) Δ + γ ( 1 + 0.34 u 2 )
where Rn is the input canopy net radiation (MJ·m−2·d−1), G is the soil heat flux (MJ·m−2·d−1), T is the daily average temperature (°C) at a 2 m height, u2 is the wind speed at a 2 m height (m·s−1), es is the average saturated vapor pressure (kPa), ea is the actual water vapor pressure (kPa), Δ is the slope of the saturated water vapor pressure and temperature curve (kPa·°C−1), and γ is the dry and wet thermometer constant (kPa·°C−1).
The calculation formula of the net irrigation requirement (NIR) is:
NIR = ETcR
where R is the effective precipitation (mm).

2.4. Statistical Analysis

The data were compared with one-way ANOVAs using SPSS 24.0 software (SPSS Inc., Chicago, IL, USA) and with Duncan’s multiple range test with a significance level of p < 0.05. Graphics were drawn using OriginPro 2020 and Microsoft Office 2016.

3. Results and Discussion

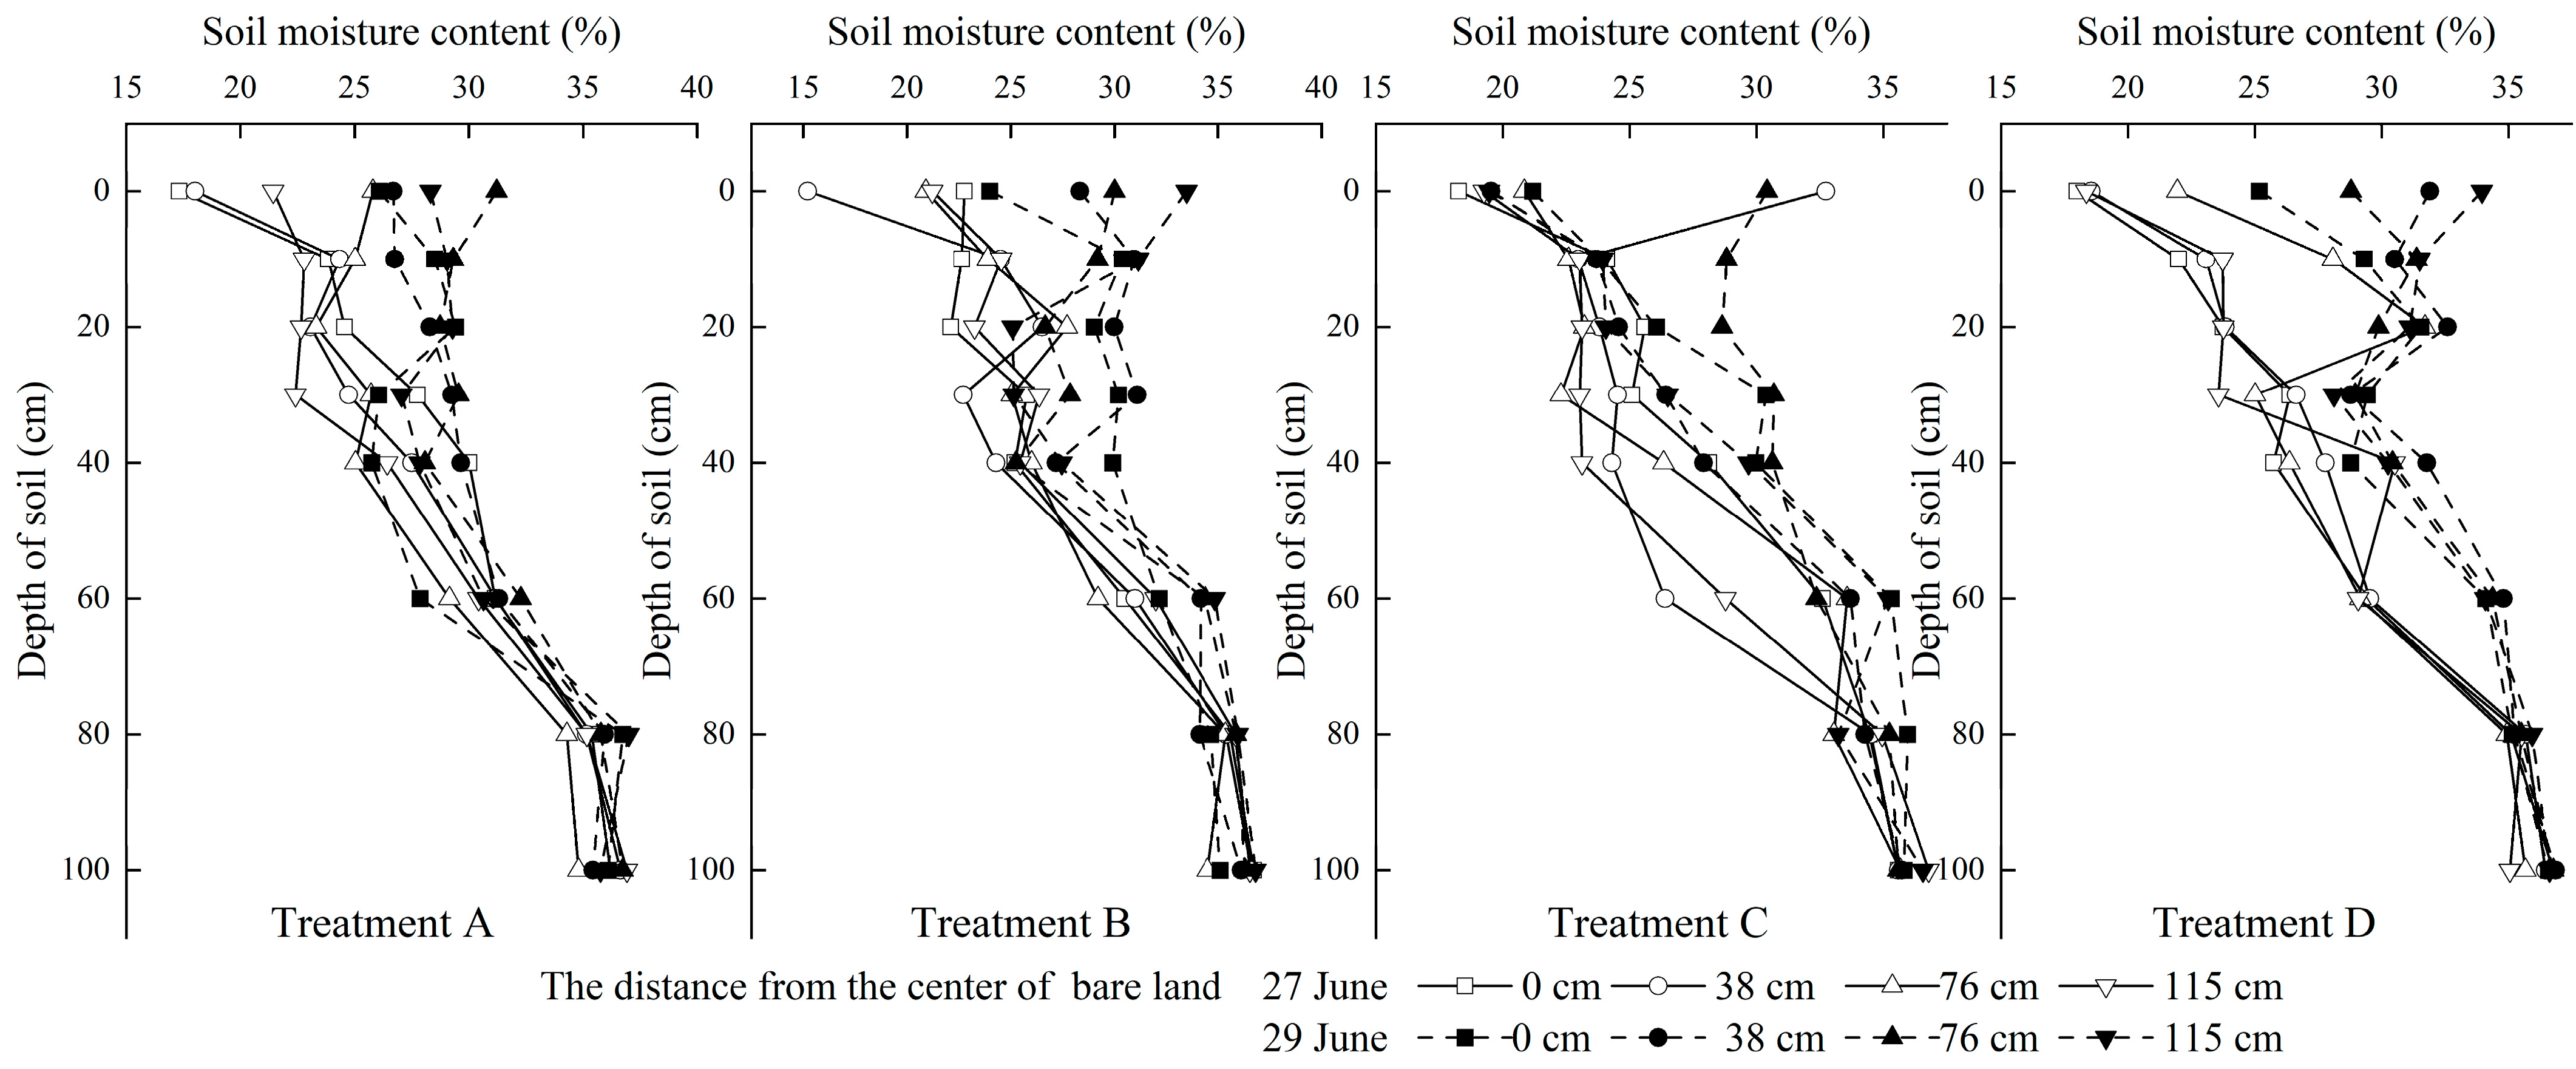
3.1. Soil Moisture Distribution

For local irrigation, under the conditions of the same irrigation quota, the vertical infiltration and horizontal distribution characteristics of the soil moisture in the root zone were mainly affected by the drip flow rate. Under the same drip flow rate, the soil moisture content of one film, three tapes, and six rows was higher than that of one film and two tapes with six rows (B treatment > A treatment, D treatment > C treatment). Under the conditions of the same layout design, the soil moisture content increased with an increase in the drip flow rate. Figure 4 shows the distribution of the soil moisture content before (27 June) and after irrigation (29 June) on 28 June.
As shown in Figure 4, the soil moisture content of the 0~40 cm shallow soil layer of each treatment was higher than 75% (21.04%) of the field moisture capacity on 27 June (before irrigation), and all treatments were close to the saturated moisture content (35.73~36.13%) at the depth of 80 cm. On 29 June (after irrigation), the soil moisture content (27.88%) of treatment C exceeded the field moisture capacity at a depth of 30 cm, while treatments A, B, and D exceeded the field moisture capacity in the surface soil (30.29%). The depth of the saturated soil layer in the deep soil of each treatment was also inconsistent. Treatments B, C, and D were close to the soil saturated moisture content (35.31~36.24%) at 60 cm, while treatment A was close to the saturated water content at 80 cm. The effects of different irrigation treatments on the spatial distribution of soil moisture in the 0~40 cm shallow soil were explored. Under the same drip flow rate (5.6 L·h−1, for example), the soil moisture content of one film, three tapes, and six rows was higher. The soil moisture content of treatment D before and after irrigation increased by 5.01% and 16.44%, respectively, compared with that of treatment C. Under the same layout design (one film, three tapes, and six rows, for example), the soil moisture content increased with an increase in the drip flow rate. The soil moisture content of treatment D increased by 4.31% and 7.30%, respectively, compared with that of treatment B. This indicates that the soil moisture content of treatment D was more uniform.

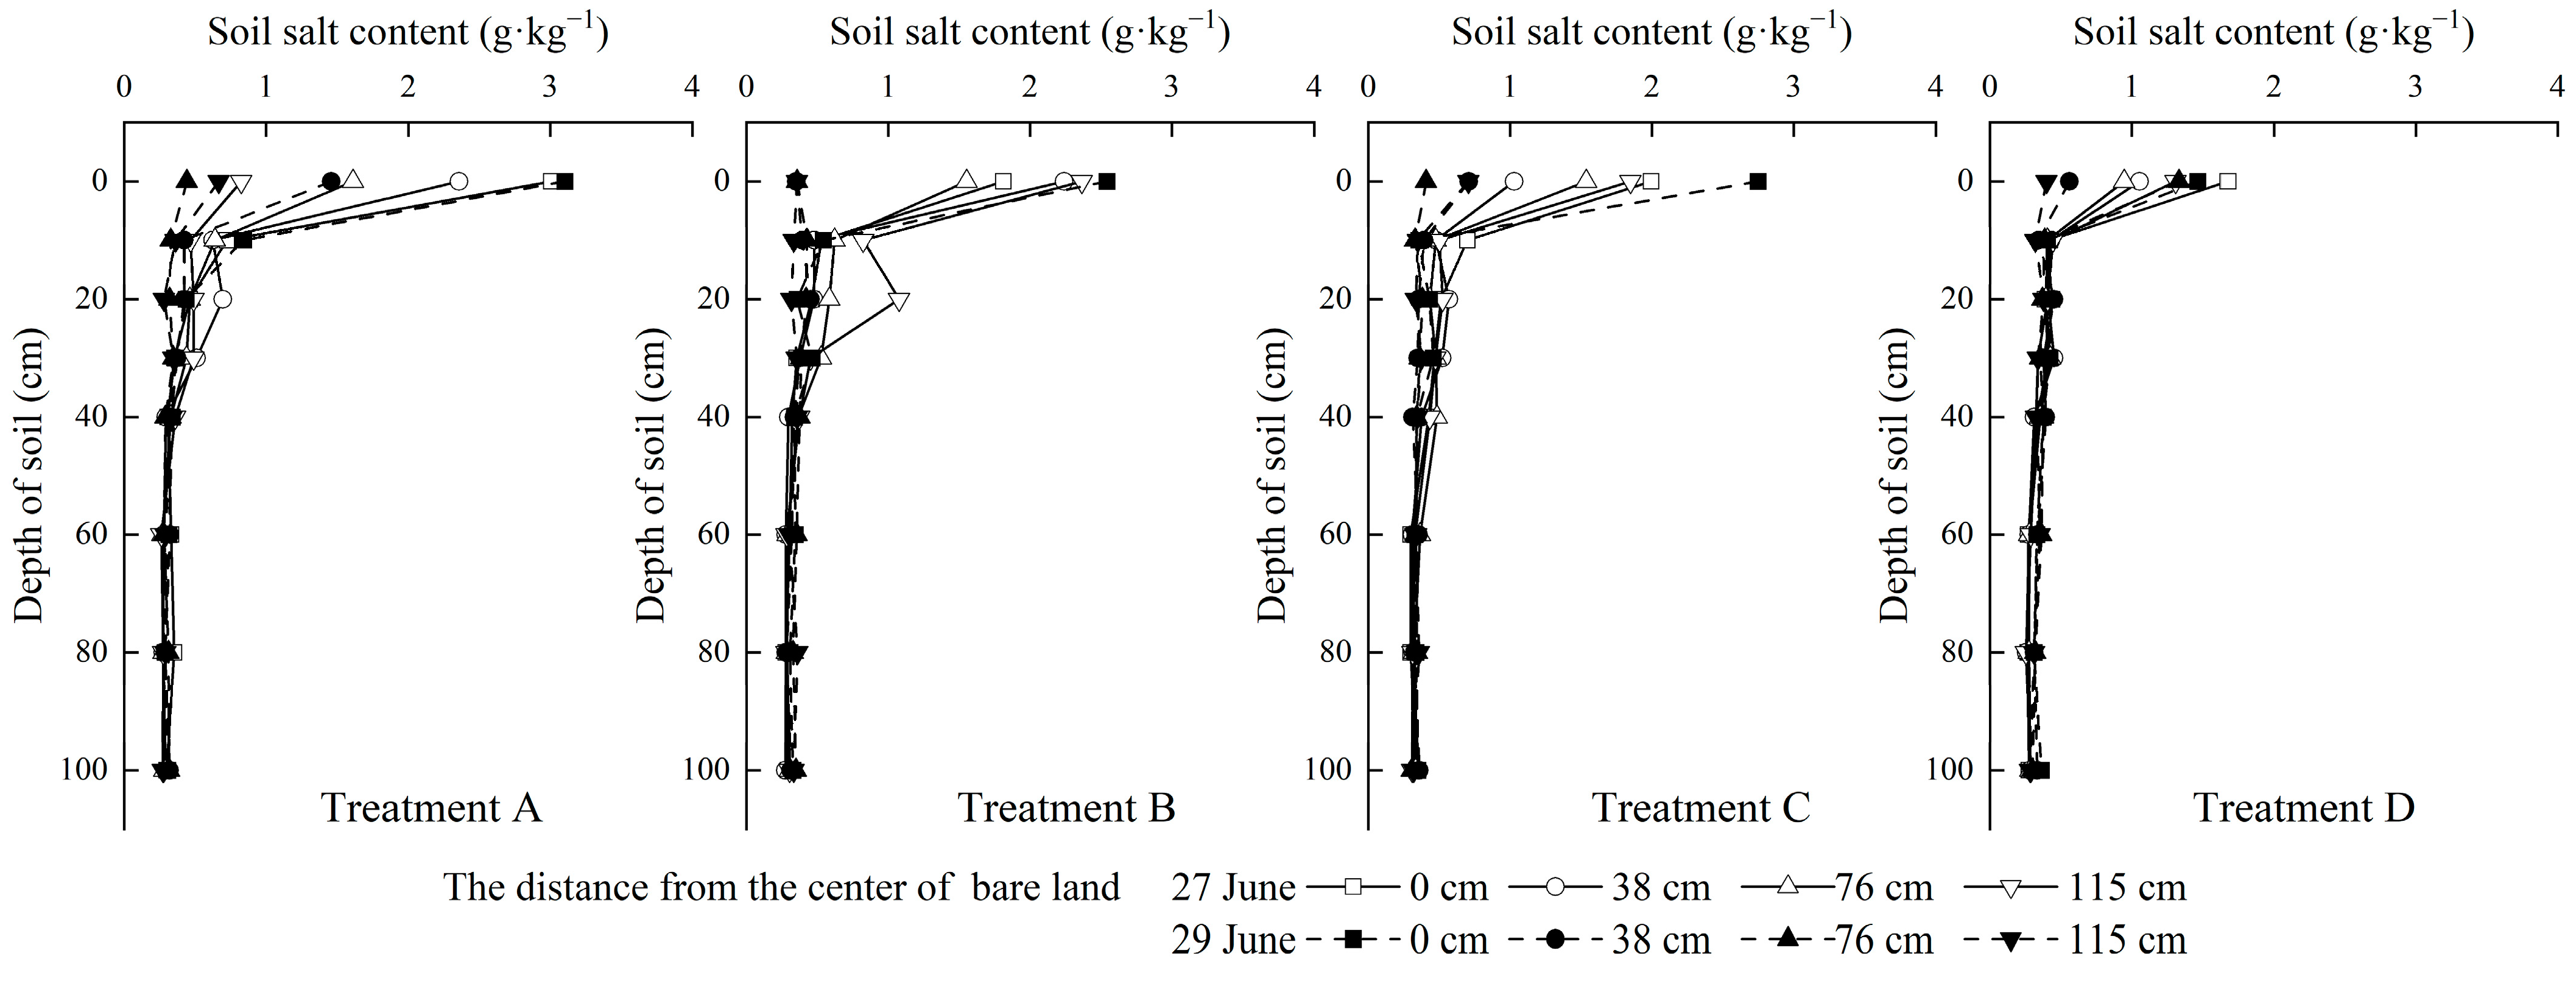
3.2. Soil Salt Distribution

The drip flow rate and layout design significantly affected the distribution of the soil salt content under film. When drip flow rate was the same, the soil salt content was lower under the layout design of one film, three tapes, and six rows. When the laying mode of the drip irrigation tape was the same, the soil salt content decreased with an increase in the drip flow. In addition, the soil salinity inside and outside the film gathered on the surface, while the soil salinity at the depth of 40~100 cm was vertically distributed, which was far less than the soil salinity at the depth of 0~40 cm. The changes in the soil salt content before (27 June) and after irrigation (29 June) in each treatment are shown in Figure 5.
The salt distribution on 29 June (after irrigation) was compared with that on 27 June (before irrigation). It was found that the soil of each treatment was desalted after irrigation (Figure 5). The desalination rates of the 0–40 cm soil layers of treatments A, B, C, and D were 23.60%, 38.83%, 27.15%, and 12.63%, respectively. However, before irrigation, the soil salt content of treatment D was 37.37%, 42.98%, and 26.72% lower than that of treatments A, B, and C, respectively. After irrigation, the soil salt content of treatment D was 20.12%, 0.10%, and 5.67% lower than that of treatments A, B, and C, respectively. This shows that, with an increase in the drip flow or the number of drip irrigation tapes, the soil wetting range was expanded, promoting the overall desalination of the soil under film.
There was a decrease in the soil salinity before and after irrigation on 28 June and during the irrigation cycle from 28 June to 9 July (Table 2). The soil salinity in the root zone of treatment A, treatment B, and treatment C decreased greatly, and the average decrease in soil salinity in the plough layer was 30.5%, 25.7%, and 44.7%, respectively. Treatment D had the lowest decrease in soil salinity in the subintimal root zone at only 5.1%.
Figure 6 shows the distribution of the soil salt content on 9 July. The decrease in soil salinity in the root zone of treatment D before (27 June) and after irrigation (29 June) was low, but the soil salinity remained in the process of reduction from 29 June to 9 July, and the average soil salinity reduction rate was 6.31%. The soil salt content in the center of narrow row 2 under film increased, but the soil salt content was low and would not affect the growth of cotton. Although the soil salt in the topsoil of treatments A and B decreased significantly after irrigation, the soil salt was in the growth stage with influences of cotton transpiration and soil evaporation. The average increases in soil salt in the root zone under the film of treatments A and B were 102.13% and 122.21%, respectively, and the salt accumulation was obvious. The soil salinity in the root zone of treatment C under mulch was in the process of decreasing, providing a good growth environment for cotton.
The experimental results showed that the difference in drip flow rate significantly affected the soil water and soil salinity distribution under mulched drip irrigation. The large drip flow rate made the horizontal desalination range of the soil under mulch wider, while the small drip flow rate promoted the vertical transport of soil salt under mulch [27,28]. Under the same drip irrigation layout design, the large drip flow rate (5.6 L·h−1) increased the wetted area of the soil surface under mulch, met the water demand of the root zone of the side crop, and promoted salt leaching. References [17,28,29] found that the large drip flow treatment had a more obvious effect on the uniformity of the soil moisture content and salt leaching by comparing different drip flow rates, consistent with the results of this experimental study. In contrast, the soil salt transport in the horizontal direction under the condition of a low drip flow rate (2.8 L·h−1) was limited and could not be transported with water to the bare ground outside mulch. The effect of salt compression was poor and cotton in the side rows under mulch was affected by soil moisture and salt stress [30,31,32]. Under the same drip flow rate, the layout design of one film and three tapes was closer to the crop root system, which was beneficial for the soil salt transport in the cotton root zone. It was easy for the crop rhizosphere soil to form a salt desalination zone and the irrigation time was shorter. However, due to the increase in the drip flow rate, soil moisture migration transport under the film of treatment D was greater than that of treatment C, and surface water was obviously caused by the limitation of the soil infiltration capacity, which caused an ineffective loss of water. In addition, by regulating the drip flow rate of one film and two strips, the soil salt leaching effect under mulch could still be guaranteed, which can save investment while ensuring crop yield [33]. Studies have shown that [34], due to surface water accumulation during drip irrigation under mulch, the salt leaching effect of a large drip flow is worse than that of a small drip flow. Due to the different soil texture, it is slightly different from the results of this experiment.

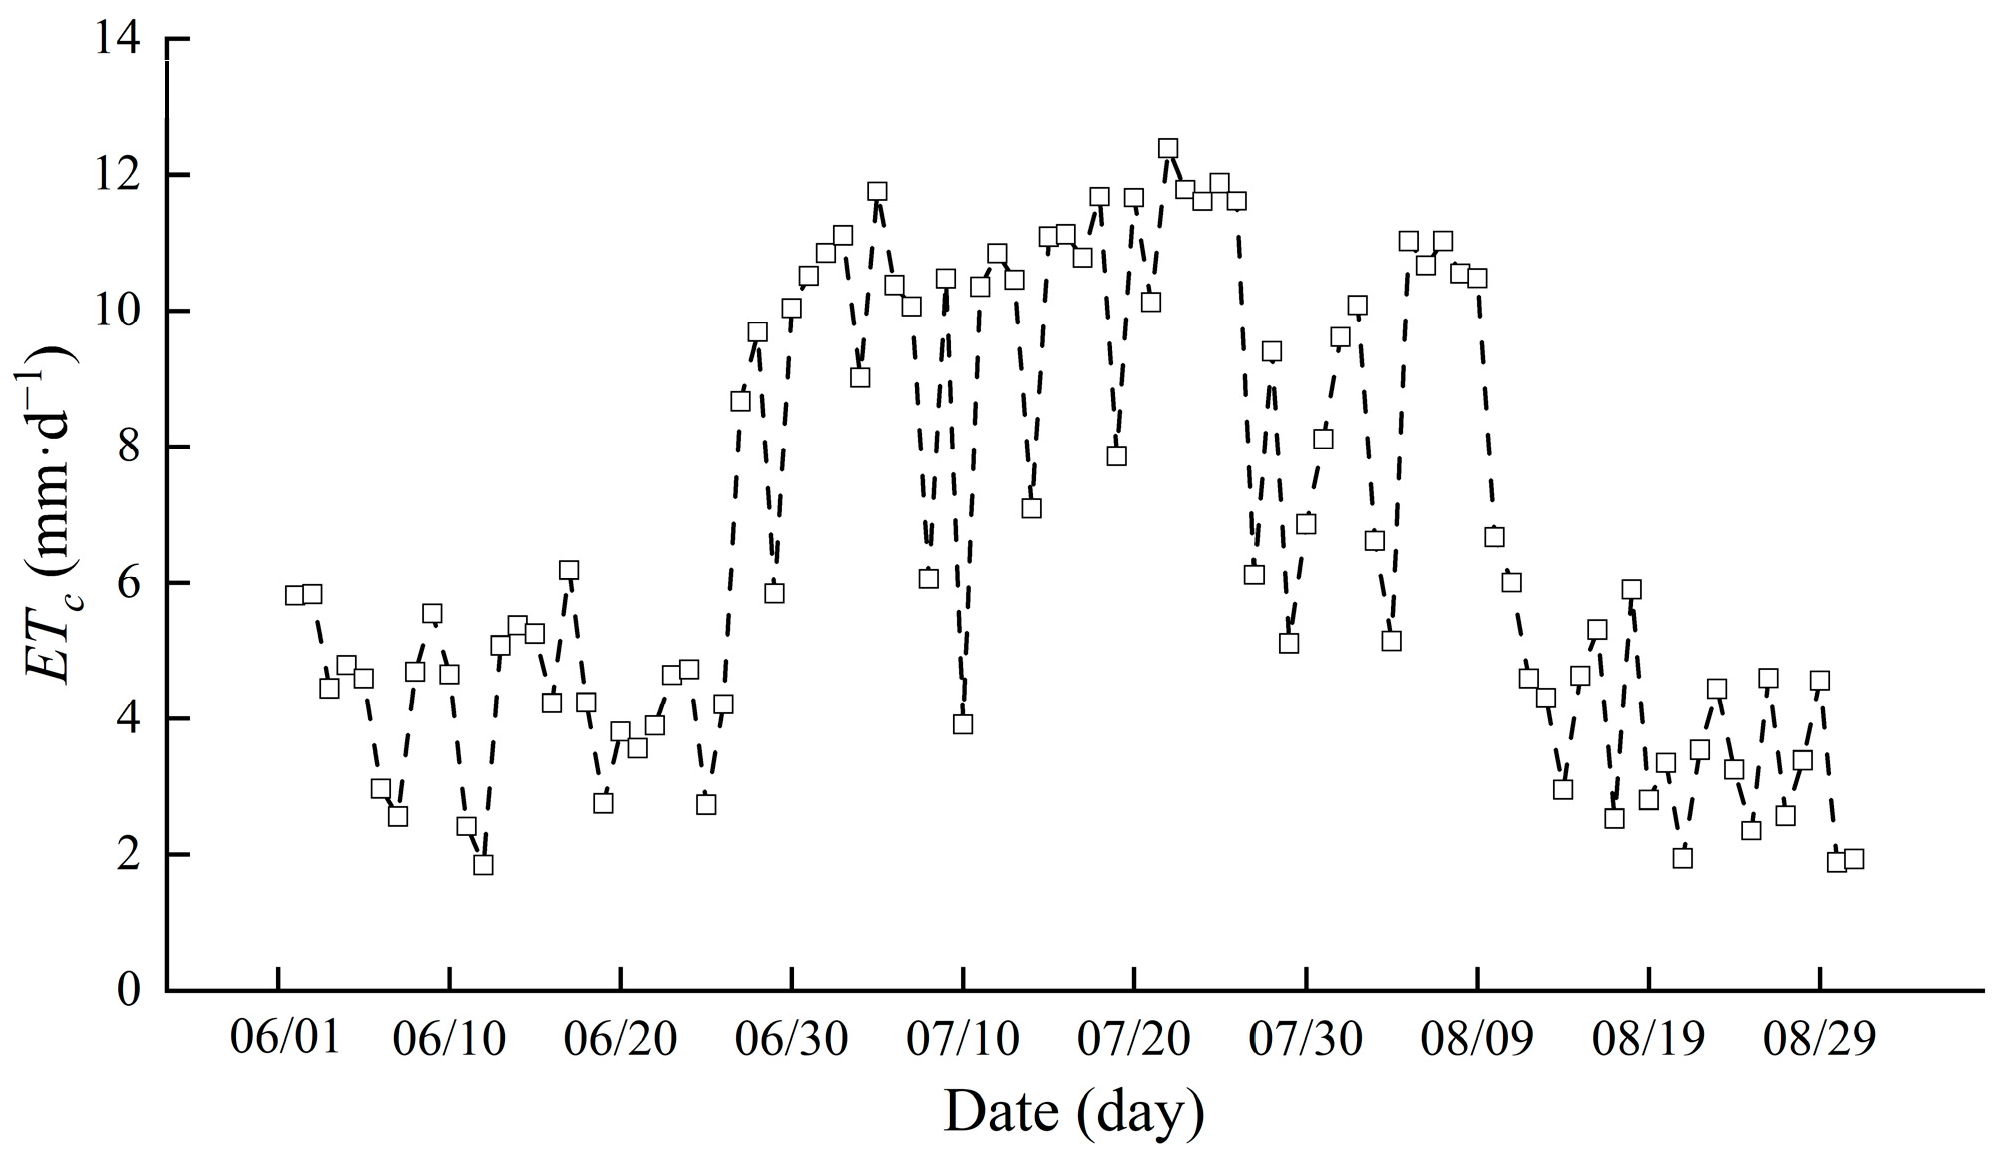
3.3. Crop’s Evapotranspiration and Groundwater Recharge during Cotton Growth Period

According to the local meteorological data, the potential evapotranspiration ET0 of the reference crop in 2018 was calculated (Figure 7). The average ET0 from June to August in this area was 7.49 mm/d. The crop evapotranspiration (ETc) of cotton in each growth stage is shown in Figure 8. It can be seen that the crop’s evapotranspiration in July was higher.
Due to the use of drip irrigation under film, ignoring the evaporation. According to Figure 8 to calculate the crop evapotranspiration of cotton and groundwater recharge in each irrigation cycle. The results are shown in Table 3.
In this experiment, only three periods of drip irrigation were carried out during the growth period of cotton. The results of the previous analysis of soil moisture content (Figure 4) showed that deep leakage occurred after irrigation. According to the water balance relationship, it was found that there was always groundwater recharge from June to August (Table 3). This shows that there is a process of irrigation water infiltration–groundwater recharge for cotton root water absorption, and the growth of cotton basically depends on the recharging of groundwater. In this experiment, only three periods of drip irrigation were carried out during the growth period of cotton. The results of the previous analysis of soil moisture content (Figure 4) showed that deep leakage occurred after irrigation. According to the water balance relationship, it was found that there was always groundwater recharge from June to August (Table 3). This shows that that there is a process of irrigation water infiltration–groundwater recharge for cotton root water absorption, and except for effective precipitation from 6 July to 31 August, NIR of cotton was the same as the cotton evapotranspiration in other irrigation cycles. The amount of irrigation was less than the evapotranspiration of cotton. This showed that the growth of cotton basically depended on groundwater recharge.

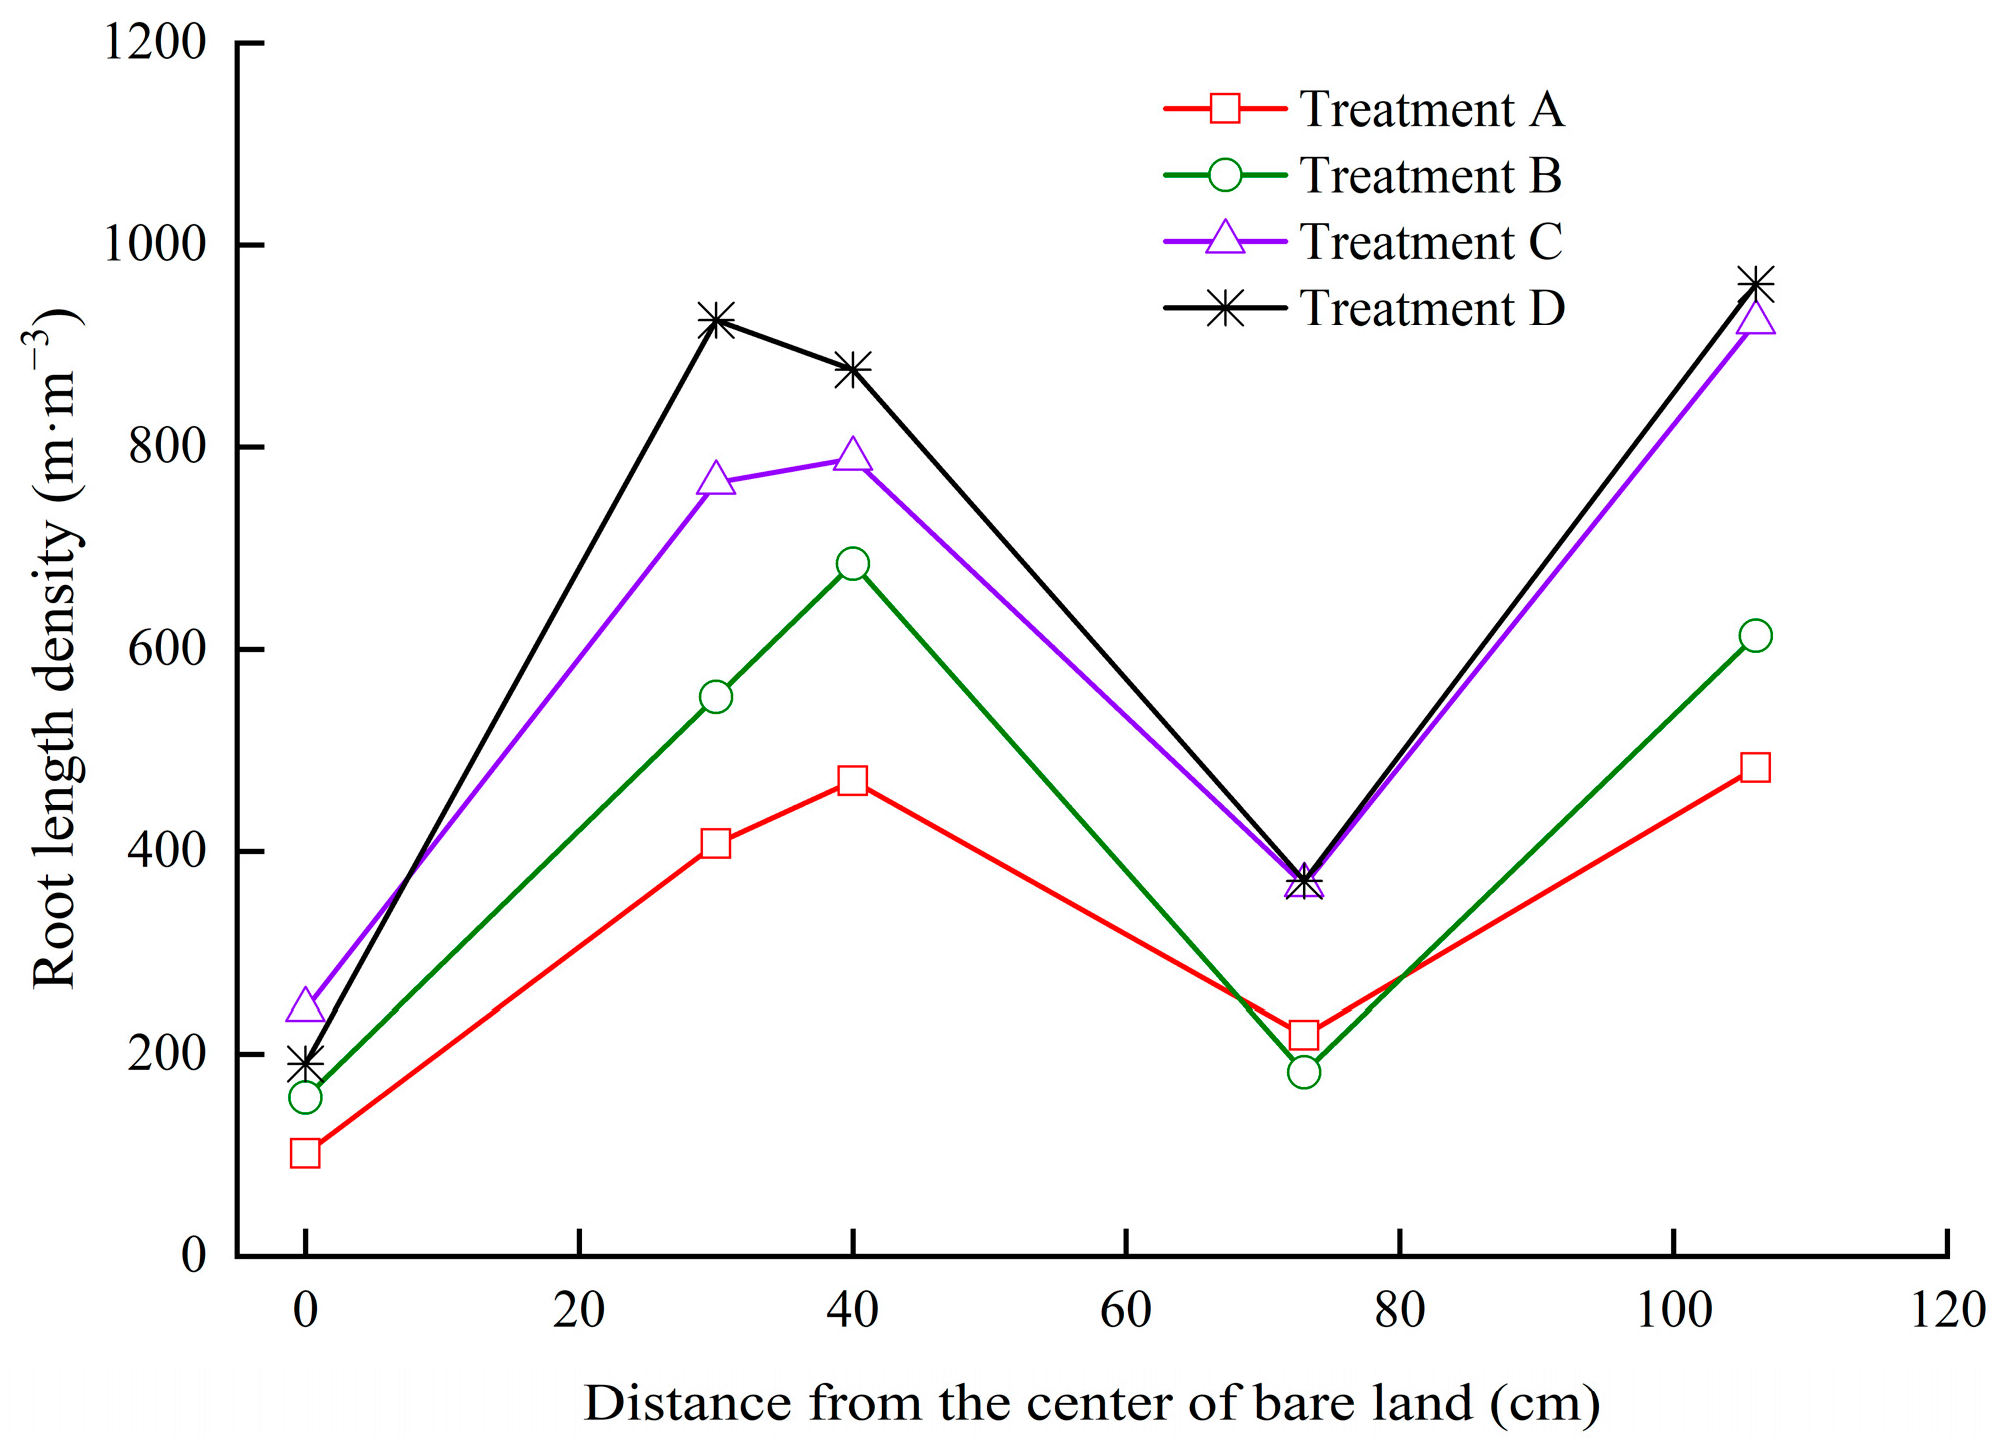
3.4. Cotton Root Length Density

Cotton roots were sampled on September 15th (maturity), and the distribution of the total root length density in the 0–60 cm soil layer under different treatments was analyzed by root length density distribution (RLD), (Figure 9). The results showed that the root length density of each measuring point in treatment A was the smallest. This was mainly because the distribution area of the cotton roots under different soil moistures and salt distributions of the drip irrigation of cotton under film was different, and the uniformity of the root distribution of each row of cotton controlled by drip irrigation tape was also different. This ultimately affected the growth of the aboveground canopy. The root length density value of treatment D was the largest, which was 328.95, 227.03, and 47.33 m·m−3 higher than that of treatments A, B, and C, respectively. This shows that, with an increase in the drip flow rate and drip irrigation point, the soil moisture and salt environment in the root zone under the film were relatively close, providing the basic conditions for the uniform growth of cotton plants between rows. Therefore, the distribution of cotton roots between rows was more uniform.
The roots are an important organ for crops to absorb water and fertilizer. They are distributed in the soil and play an important role in crop growth and development, dry matter accumulation, and yield formation. The results showed that the arrangement of drip irrigation tape under mulched drip irrigation had little effect on the root length density of cotton, while the drip flow rate significantly affected the root growth of crops. This was because the distribution of water and salt in the root zone of the crops affected the root configuration and root length density [35,36], crop root length density is a key factor affecting root water absorption intensity, and there is a positive correlation between them [37,38]. In this experiment, the root length density of cotton was always small under the condition of a small drip flow (2.8 L·h−1). On the one hand, because of the poor aeration of deep soil, the growth of the cotton roots was inhibited. Because the number of roots in the shallow soil was small, the main root of the plant elongated to the deep soil and the lateral root became shorter. On the other hand, cotton roots were subjected to salt stress, which changed the osmotic adjustment ability of the roots and inhibited the absorption and utilization of soil moisture and fertilizer by roots. This led to changes in the distribution of the crop roots. Under the condition of a large drip flow rate (5.6 L·h−1), the root length density of cotton was always larger, because the crop rhizosphere was in the low-salt area and most of the roots were concentrated in the shallow soil. The shallow soil had good aeration, a high soil temperature, wide and shallow roots, and the root length density increased, thus improving the absorption efficiency of water and fertilizer by the cotton roots, which was consistent with the literature [39,40].

3.5. Cotton Plant Height and Leaf Area

Plant height and leaf area are important indicators reflecting the growth of cotton. It was found in the experiment that, with the advancement of the growth period, the growth trend of the plant height and leaf area of cotton under different treatments was the same. However, after irrigation on 28 June, the plant height and leaf area of cotton between treatment A and treatment B began to show significant differences (Figure 10). The plant height and leaf area of cotton in treatment C were significantly higher than those in other treatments. The differences in plant height between treatment C and treatments A, B, and D were 12.7, 7.1 and 1.5 cm, respectively. The differences in leaf area between treatment C and treatment A, treatment B, and treatment D were 896.7, 280.6, and 79.2 cm2, respectively. The uniformity of the plant height and leaf area of cotton in treatment D was lower than that in treatment C, which may be related to soil permeability.
In this experiment, it was found that, when the drip flow was large, the plant height and leaf area of cotton were larger than those under the condition of a small drip flow. This was because, with an increase in drip flow, the ability of the root system to absorb water was enhanced, which promoted the growth and development of cotton [39,41]. In addition, during the whole growth period of cotton, it was found that the plant height and leaf area of cotton under the condition of a small drip flow (2.8 L·h−1) and narrow row layout of drip irrigation tape were better than those under the wide row layout (treatment B > treatment A), which indicated that, under the treatment of a low drip flow, the narrow row layout of drip irrigation tape could effectively reduce the soil salt concentration of crop roots. The layout design of one film and three tapes under a small drip flow rate was beneficial for the absorption of water and fertilizer by roots. Under a large drip flow (5.6 L·h−1,), the drip irrigation bandwidth row layout was better than the narrow row layout (treatment C > treatment D), and the cotton plant height and leaf area under the treatment C condition were the first to reach the peak compared with treatment D. The leaf area changes may have been due to the leaf senescence and shedding before treatment D decreased, which may have been because the treatment D soil moisture content was too high, resulting in poor ventilation and reducing the root activity, thus affecting photosynthesis. The wider the soil wetting range, the slower the decrease in cotton leaf area [41].

3.6. Cotton Yield, IWUE, and WUE

The number of bolls, single boll weight, theoretical yield, and water use efficiency of cotton under different treatments are shown in Table 4. It can be seen from the table that the boll number and single boll weight of the cotton plants under treatment A were significantly lower than those of other treatments, resulting in a significantly lower theoretical yield of cotton than other treatments. The theoretical yield of treatment B was not significantly different from that of treatments C and D, and increased by 1.96%, 8.82%, and 21.57%, respectively, compared with that of treatment A. The cotton grew evenly between rows in treatment D, and the single boll weight of cotton was the highest. The actual yield was 21.56%, 19.23%, and 11.71% higher than that of treatments A, B, and C, respectively.
The effects of different drip flow rates and drip irrigation tape layouts on the cotton IWUE and CWUE were analyzed. It was found that, when layout design was the same, IWUE and WUE increased with an increase in the drip flow rate. When the drip flow rate was the same, the values of IWUE and CWUE were higher under the layout of one film, three tapes, and six rows.
Under the same layout design, the number of cotton bolls, single boll weight, yield, and WUE increased with an increase in the drip flow. Under the same drip flow rate, the cotton yield under the condition of one film, three tapes, and six rows was higher than that under the condition of one film, two tapes, and six rows. The soil moisture distribution under drip irrigation under film affected the spatial distribution of soil nutrients in the cotton root zone and the effect of soil salt leaching, thus affecting the root growth and dry matter accumulation of cotton plants, ultimately changing the cotton yield [42,43].
The economic cost difference in the drip irrigation system was mainly reflected in the number of drip irrigation tapes. According to the local drip irrigation tape price of 0.025 USD·m−1 [44], the calculation results are shown in Table 5.
From Table 5, it can be seen that, under the same layout design, the input of drip irrigation tape and net income increased with an increase in drip discharge; under the same dripper flow rate, the input of drip irrigation tape and net income with one film and three tapes was higher than with the layout design of one film and two tapes. In general, the economic income of each treatment was A < B < C < D. Therefore, it is more profitable to choose a dripper flow rate of 5.6 g·L−1, with one film, three tapes, and six rows.
It is worth noting that this experiment covered only one field season, limiting the long-term trend of the test results. At the same time, we did not consider the effect of limited irrigation on the groundwater quality and soil microbial diversity. These are what we need to focus on in the follow-up study.

4. Conclusions

Implementing limited irrigation in shallow groundwater burial areas is an important measure for agricultural water conservation and salt suppression in arid zones. This paper observes and analyzes the effects of the drip flow rate and layout design on soil moisture and salt distribution, cotton growth, yield, and water use efficiency in cotton fields in shallow groundwater burial zones with only three irrigations, and draws the following main conclusions:
(1)
When the layout design was the same and the drip flow rate was 5.6 L·h−1, the soil moisture distribution was more uniform and the soil salinity was lower. When the drip flow rate was the same, soil salt content of the one film, three tapes, and six rows layout was lower than that of the one film, two tapes, and six rows layout. The soil moisture content was higher, the range of soil desalination was larger, and the growth of cotton was promoted more under the combination of one film, three tapes, six rows, and drip flow rate of 5.6 L·h−1.
(2)
When layout design was the same, cotton root length density, plant height, leaf area, and yield increased with an increase in the drip flow rate. When the drip flow rate was the same, the root length density, plant height, leaf area, and yield of cotton in the one film, three tapes, and six rows layout were higher than those in the one film, two tapes, and six rows layout. Therefore, with one film, three tapes, six rows, and a drip flow rate of 5.6 L·h−1, the cotton yield was the highest, with a theoretical yield and actual yield of 6211.36 kg·hm−2 and 4820.21 kg·hm−2 respectively, making it the most suitable combination of drip irrigation technology parameters.

Author Contributions

Conceptualization, D.L.; Investigation, D.L.; Data curation, Y.C.; Writing—original draft, Y.C.; Writing—review & editing, D.L.; Visualization, S.H.; Supervision, S.H. All authors have read and agreed to the published version of the manuscript.

Funding

This study was supported by the National Key R&D Program of China (No. 2021YFD1900805) and Financial Science and Technology Plan of Xinjiang Corps (No. 2021AB009).

Data Availability Statement

The original contributions presented in the study are included in the article, further inquiries can be directed to the corresponding authors.

Conflicts of Interest

The authors declare no conflict of interest.

References

  1. Li, P.; Ren, L. Evaluating the effects of limited irrigation on crop water productivity and reducing deep groundwater exploitation in the North China Plain using an agro-hydrological model: I. Parameter sensitivity analysis, calibration and model validation. J. Hydrol. 2019, 574, 497–516. [Google Scholar] [CrossRef]
  2. Galán-Martín, Á.; Vaskan, P.; Antón, A.; Esteller, L.J.; Guillén-Gosálbez, G. Multi-objective optimization of rainfed and irrigated agricultural areas considering production and environmental criteria: A case study of wheat production in Spain. J. Clean. Prod. 2017, 140, 816–830. [Google Scholar] [CrossRef]
  3. FAO (Food and Agriculture Organization). QQUASTAT Database; FAO: Rome, Italy, 2014. [Google Scholar]
  4. Siebert, S.; Burke, J.; Faures, J.M.; Frenken, K.; Hoogeveen, J.; Döll, P.; Portmann, F.T. Groundwater use for irrigation—A global inventory. Hydrol. Earth Syst. Sci. 2010, 14, 1863–1880. [Google Scholar] [CrossRef]
  5. Li, Z.; Zhang, Q.; Li, Z.; Qiao, Y.; Du, K.; Yue, Z.; Li, F. Different responses of agroecosystem greenhouse gas emissions to tillage practices in a Chinese wheat–maize cropping system. Carbon Res. 2023, 2, 7. [Google Scholar] [CrossRef]
  6. Kijine, J.W.; Barker, R.; Molden, D. Water Productivity in Agriculture: Limits and Opportunities for Improvement; CABI Publishing: Cambridge, MA, USA, 2003. [Google Scholar]
  7. Kisekka, I.; Schlegel, A.; Ma, L.; Gowda, P.H.; Prasad, P.V.V. Optimizing preplant irrigation for maize under limited water in the High Plain. Agric. Water Manag. 2017, 187, 154–163. [Google Scholar] [CrossRef]
  8. Singh, A. Soil salinization management for sustainable development: A review. J. Environ. Manag. 2021, 277, 111383. [Google Scholar] [CrossRef] [PubMed]
  9. Cuevas, J.; Daliakopoulos, I.N.; Del Moral, F.; Hueso, J.J.; Tsanis, I.K. A review of soil-improving cropping systems for soil salinization. Agronomy 2019, 9, 295. [Google Scholar] [CrossRef]
  10. Zhuang, Q.W.; Wu, S.X.; Yang, Y.; Ya, X.N.; Yu, Y.Y. Spatiotemporal characteristics of different degrees of salinized cultivated land in Xinjiang in recent ten years. J. Univ. Chin. Acad. Sci. 2021, 38, 341–349. [Google Scholar]
  11. Ran, G.Y.; Wang, G.Y.; Du, H.J. Spatial and Temporal Patterns of Agroecological Water use Efficiency in Arid Zones Under the Framework of SDGs and the Influencing Factors. Water Sav. Irrig. 2023, 11, 1–10. [Google Scholar]
  12. Wang, Y.F.; Lin, T. Effects of Different Degradable Film and Irrigation Quota on Soil Hydrothermal Characteristics in Cotton Field. Crops 2023, 11, 1–11. [Google Scholar]
  13. Wang, H.B.; Li, G.H.; Xu, X.W. Assessing the Sustainability of Cotton Production under Climate Change Based on the AquaCrop Model. Chin. J. Agrometeorol. 2023, 44, 588–598. [Google Scholar]
  14. Chen, Z.; Niu, Y.; Zhao, R.; Han, C.; Luo, H. The combination of limited irrigation and high plant density optimizes canopy structure and improves the water use efficiency of cotton. Agric. Water Manag. 2019, 218, 139–148. [Google Scholar] [CrossRef]
  15. Lavers, D.A.; Hannah, D.M.; Bradley, C. Connecting large-scale atmospheric circulation, river flow and groundwater levels in a chalk catchment in southern England. J. Hydrol. 2015, 523, 179–189. [Google Scholar] [CrossRef]
  16. Xu, C.; Tao, H.; Tian, B.; Gao, Y.; Ren, J.; Wang, P. Limited-irrigation improves water use efficiency and soil reservoir capacity through regulating root and canopy growth of winter wheat. Field Crops Res. 2016, 196, 268–275. [Google Scholar] [CrossRef]
  17. Yang, C.J.; Luo, Y.; Sun, L.; Wu, W. Effect of deficit irrigation on the growth, water use characteristics and yield of cotton in arid Northwest China. Pedosphere 2015, 25, 910–924. [Google Scholar] [CrossRef]
  18. Thorburn, P.J.; Cook, F.J.; Bristow, K.L. Soil-dependent wetting from trickle emitters: Implications for system design and management. Irrig. Sci. 2003, 22, 121–127. [Google Scholar] [CrossRef]
  19. Cook, F.J.; Thorburn, P.J.; Fitch, P.; Bristow, K.L. WetUp: A software tool to display approximate wetting patterns from drippers. Irrig. Sci. 2003, 22, 129–134. [Google Scholar] [CrossRef]
  20. Badr, M.A.; Taalab, A.S. Effect of drip irrigation and discharge rate on water and solute dynamics in sandy soil and tomato yield. J. Basic Appl. Sci. 2007, 1, 545–552. [Google Scholar]
  21. Chen, W.; Jin, M.; Ferré, T.P.; Liu, Y.; Huang, J.; Xian, Y. Soil conditions affect cotton root distribution and cotton yield under mulched drip irrigation. Field Crops Res. 2020, 249, 107743. [Google Scholar] [CrossRef]
  22. Vishwakarma, D.K.; Kumar, R.; Kumar, A.; Kushwaha, N.L.; Kushwaha, K.S.; Elbeltagi, A. Evaluation and development of empirical models for wetted soil fronts under drip irrigation in high-density apple crop from a point source. Irrig. Sci. 2022, 41, 1–24. [Google Scholar] [CrossRef]
  23. Wang, M.; Lv, T.; He, X.; Cao, Y.; Wang, D. Effects of drip-irrigated planting modes on soil water, temperature, salt and cotton growth. Agric. Res. Arid Areas 2018, 36, 176–186. [Google Scholar]
  24. Wang, D.; Wang, Z.; Lv, T.; Zong, R.; Zhu, Y.; Zhang, J.; Wang, T. Effects of drip tape modes on soil hydrothermal conditions and cotton yield (Gossypium hirsutum L.) under machine-harvest patterns. PeerJ 2021, 9, e12004. [Google Scholar] [CrossRef] [PubMed]
  25. Wang, J.; Du, G.; Tian, J.; Jiang, C.; Zhang, Y.; Zhang, W. Mulched drip irrigation increases cotton yield and water use efficiency via improving fine root plasticity. Agric. Water Manag. 2021, 255, 106992. [Google Scholar] [CrossRef]
  26. Li, X.; Liu, H.; Gong, P.; Hou, M. Numerical simulation of soil moisture distribution of different planting modes under drip irrigation under film. Water Sav. Irrig. 2018, 8, 23–29. [Google Scholar]
  27. Kilic, M. Analytical description of the wetting pattern in a drip irrigation system by a new method, simultaneous double parabola design. I: Method. In Proceedings of the 1st International Congress on Agricultural Structures and Irrigation, Antalya, Turecko, 26–28 September 2018; pp. 365–375. [Google Scholar]
  28. Zhang, A.; Zheng, C.; Li, K.; Dang, H.; Cao, C.; Rahma, A.E.; Feng, D. Responses of soil water-salt variation and cotton growth to drip irrigation with saline water in the low plain near the bohai sea. Irrig. Drain. 2020, 69, 448–459. [Google Scholar] [CrossRef]
  29. Danierhan, S.; Shalamu, A.; Tumaerbai, H.; Guan, D. Effects of emitter discharge rates on soil salinity distribution and cotton (Gossypium hirsutum L.) yield under drip irrigation with plastic mulch in an arid region of Northwest China. J. Arid. Land 2013, 5, 51–59. [Google Scholar] [CrossRef]
  30. Wang, Z.; Fan, B.; Guo, L. Soil salinization after long-term mulched drip irrigation poses a potential risk to agricultural sustainability. Eur. J. Soil Sci. 2019, 70, 20–24. [Google Scholar] [CrossRef]
  31. Zhai, Y.M.; Yang, Q.; Wu, Y.Y. Soil salt distribution and tomato response to saline water irrigation under straw mulching. PLoS ONE 2016, 11, e0165985. [Google Scholar] [CrossRef] [PubMed]
  32. Abou Lila, T.S.; Berndtsson, R.; Persson, M.; Somaida, M.; El-Kiki, M.; Hamed, Y.; Mirdan, A. Numerical evaluation of subsurface trickle irrigation with brackish water. Irrig. Sci. 2013, 31, 1125–1137. [Google Scholar] [CrossRef]
  33. Huang, Z.Z.; Liu, G.M.; Li, J.B.; Chen, J.L.; Feng, W.H.; Tian, S.Y.; Wang, Y. Effect of layout of drip irrigation belt and irrigation quota on soil properties and cotton yield. Chin. J. Soil Sci. 2020, 51, 325–331. [Google Scholar]
  34. Hu, Y.; Shao, G.C.; Jiang, A.; Zhang, Y.; Shang, L.X. Research on the effect of drip irrigation flow on moisture and salt transport in different texture soils. China Rural. Water Hydropower 2021, 466, 133–139. [Google Scholar]
  35. Coelho, E.F.; Or, D. Root distribution and water uptake patterns of corn under surface and subsurface drip irrigation. Plant Soil 1999, 206, 123–136. [Google Scholar] [CrossRef]
  36. Suralta, R.R.; Kano-Nakata, M.; Niones, J.M.; Inukai, Y.; Kameoka, E.; Tran, T.T.; Yamauchi, A. Root plasticity for maintenance of productivity under abiotic stressed soil environments in rice: Progress and prospects. Field Crops Res. 2018, 220, 57–66. [Google Scholar] [CrossRef]
  37. Chen, W.L.; Jin, M.G.; Ferré, T.P.A.; Liu, Y.F.; Xian, Y.; Shan, T.R.; Ping, X. Spatial distribution of soil moisture, soil salinity, and root density beneath a cotton field under mulched drip irrigation with brackish and fresh water. Field Crops Res. 2018, 215, 207–221. [Google Scholar] [CrossRef]
  38. Uddin, S.; Löw, M.; Parvin, S.; Fitzgerald, G.; Bahrami, H.; Tausz-Posch, S.; Tausz, M. Water use and growth responses of dry land wheat grown under elevated [CO2] are associated with root length in deeper, but not upper soil layer. Field Crops Res. 2018, 224, 170–181. [Google Scholar] [CrossRef]
  39. Ding, H.; Li, M.S.; Sun, H. Effects of the drip irrigation wetting pattern on the cotton growth and yield. J. Irrig. Drain. 2009, 28, 42–45. [Google Scholar]
  40. Feng, S.; Gu, S.; Zhang, H.; Wang, D. Root vertical distribution is important to improve water use efficiency and grain yield of wheat. Field Crops Res. 2017, 214, 131–141. [Google Scholar] [CrossRef]
  41. Li, M.S.; Kang, S.Z.; Yang, H.M. Effects of plastic film mulch on the soil wetting pattern, water consumption and growth of cotton under drip irrigation. Trans. Chin. Soc. Agric. Eng. 2007, 6, 49–54. [Google Scholar]
  42. Wang, D.W.; Wang, Z.H.; Zhang, J.Z.; Lv, T.B.; Zhou, B.; Li, W.H. Effects of drip tape modes on machine-harvest cotton growth and soil water, heat and salt distribution in Northern Xinjiang of China. Trans. Chin. Soc. Agric. Eng. 2022, 38, 76–86. [Google Scholar]
  43. Liu, M.X.; Yang, J.S.; Li, X.M.; Mei, Y.U.; Jin, W.A.N.G. Effects of irrigation water quality and drip tape arrangement on soil salinity, soil moisture distribution, and cotton yield (Gossypium hirsutum L.) under mulched drip irrigation in Xinjiang, China. J. Integr. Agric. 2012, 11, 502–511. [Google Scholar] [CrossRef]
  44. Wang, Y.; Shen, X.M.; Ma, X.P. Problems and countermeasures in the development of drip irrigation belt production. Agric. Sci. Technol. Commun. 2020, 9, 191–194. [Google Scholar]
Figure 1. Groundwater level change.
Agronomy 14 01499 g001
Figure 2. Max temperature, minimum temperature, and rainfall.
Agronomy 14 01499 g002
Figure 3. Schematic diagram of cotton mulched cultivation raw distances, layout design, and sampling points of water and salts (the presented example is for C treatment).
Agronomy 14 01499 g003
Figure 4. Distribution of soil moisture content under different treatments.
Agronomy 14 01499 g004
Figure 5. Distribution of soil salt content before and after irrigation under different treatments.
Agronomy 14 01499 g005
Figure 6. Distribution of soil salt content under different treatments on 9 July.
Agronomy 14 01499 g006
Figure 7. Reference crop evapotranspiration in researched region during cotton growing.
Agronomy 14 01499 g007
Figure 8. Crop’s evapotranspiration during cotton growth period.
Agronomy 14 01499 g008
Figure 9. Distribution of root length density under different treatments.
Agronomy 14 01499 g009
Figure 10. Change of plant height and leaf area under different treatments.
Agronomy 14 01499 g010
Table 1. Physical and hydraulic properties of soil.
Depth of Soil (cm)Volumetric Weight (g·cm−3)Saturated Moisture Content (% vol.)Field Moisture
Capacity (% vol.)
Soil Texture
0–201.5134.1126.25sandy loam
20–401.4834.0327.06sandy loam
40–601.4336.8830.83sandy loam
60–801.3437.7132.31sand
80–1001.3637.8933.68sand
Table 2. Reduction in soil salinity under different treatments (%).
The Distance from the Center of Bare Land (cm)27–29 June29 June–9 July
0387611503876115
Treatment A−11.928.260.445.2−5.5−77.5−122.4−203.0
Treatment B−22.115.645.464.018.1−263.4−158.6−84.1
Treatment C21.147.654.955.12.4−13.931.711.3
Treatment D−10.33.2−2.430.1−24.249.918.7−19.0
Table 3. Crop’s evapotranspiration and supplement from ground water.
Irrigation CycleCrop’s Evapotranspiration (mm)Groundwater Recharge (mm)NIR
(mm)
1–27 June112.26112.26112.26
28 June–10 July122.0584.55122.05
11–25 July156.71111.71156.71
26 July–31 August220.89175.89208.09
Table 4. Cotton yields under different treatments.
TreatmentsBoll Number per PlantBoll Weight (g) Theoretical Yield (kg·hm−2)Actual Output (kg·hm−2)IWUE (kg·m−3)CWUE (kg·m−3)
A6.29 ± 1.85 c3.46 ± 0.25 c4893.06 ± 1456.23 c3965.013.84 b0.8 b
B7.24 ± 1.35 a3.70 ± 0.32 b6018.81 ± 1256.45 b4042.764.72 a0.98 a
C6.98 ± 1.24 b3.94 ± 0.16 a6170.87 ± 1026.94 a4314.874.84 a1.01 a
D6.69 ± 1.11 b4.14 ± 0.14 a6211.36 ± 1135.75 a4820.214.87 a1.02 a
Different letters indicate a significant difference based on Duncan test (p < 0.05).
Table 5. Cost difference of cotton drip irrigation system.
TreatmentsNumber of Single-Film
Drip Tapes
Drip Tape, Plug
(USD·hm−2)
Seed Cotton
Income (USD·hm−2)
Net Income
(USD·hm−2)
A22164090.453874.45
B33244170.663846.66
C44324451.274019.27
D66484972.714324.71
Disclaimer/Publisher’s Note: The statements, opinions and data contained in all publications are solely those of the individual author(s) and contributor(s) and not of MDPI and/or the editor(s). MDPI and/or the editor(s) disclaim responsibility for any injury to people or property resulting from any ideas, methods, instructions or products referred to in the content.

