
Nutritional Diagnosis of Potato Crops Using the Multivariate Method

 ,
,  , , , , ,
Abstract
:1. Introduction
2. Materials and Methods
2.1. Database
2.2. Foliar Diagnosis and Tuber Yield
2.3. Obtaining the Norms Using the CND-ilr Method
3. Results
CND-ilr, Norms, Sequential Binary Partition, and Cate–Nelson Partition
4. Discussion
5. Conclusions
Author Contributions
Funding
Data Availability Statement
Acknowledgments
Conflicts of Interest
References
- Çalışkan, M.E.; Yousaf, M.F.; Yavuz, C.; Zia, M.A.B.; Çalışkan, S. History, Production, Current Trends, and Future Prospects. In Potato Production Worldwide; Elsevier: Amsterdam, The Netherlands, 2023; pp. 1–18. [Google Scholar]
- FAOSTAT. Production: Crops. Available online: https://www.fao.org/faostat/en/#data/QCL (accessed on 12 March 2024).
- ABBA (Associação Brasileira da Batata). Previsão Consumo de Batata. Batata Show. Available online: https://www.abbabatatabrasileira.com.br/revista/edicao-58/ (accessed on 15 March 2024).
- IBGE (Instituto Brasileiro de Geografia e Estatística). Levantamento Sistemático da Produção Agrícola. Available online: https://biblioteca.ibge.gov.br/visualizacao/periodicos/2415/epag_2021_dez.pdf (accessed on 15 March 2024).
- Salvador, C.A.; Pereira, J.R. Prognóstico Agropecuário de Olericultura 2021/2022, 37th ed.; Governo do Estado do Paraná: Amsterdam, The Netherlands, 2021; ISBN 2764-2887. [Google Scholar]
- EMBRAPA. Sistema de Produção de Batata. Available online: https://ainfo.cnptia.embrapa.br/digital/bitstream/item/132923/1/Sistema-de-Producao-da-Batata.pdf (accessed on 13 December 2023).
- CEPEA (Centro de Estudos Avançados em Economia Aplicada). PIB Do Agronegócio. CEPEA/ESALQ/USP. Available online: https://www.cepea.esalq.usp.br/br/categoria/batata-cepea.aspx (accessed on 20 February 2024).
- Esteves, E.; Locatelli, G.; Bou, N.A.; Ferrarezi, R.S. Sap Analysis: A Powerful Tool for Monitoring Plant Nutrition. Horticulturae 2021, 7, 426. [Google Scholar] [CrossRef]
- Parent, L.E.; Dafir, M. A Theoretical Concept of Compositional Nutrient Diagnosis. J. Am. Soc. Hortic. Sci. 1992, 117, 239–242. [Google Scholar] [CrossRef]
- Egozcue, J.J.; Pawlowsky-Glahn, V.; Mateu-Figueras, G.; Barceló-Vidal, C. Isometric Logratio Transformations for Compositional Data Analysis. Math. Geol. 2003, 35, 279–300. [Google Scholar] [CrossRef]
- Parent, L.-É. Diagnosis of the Nutrient Compositional Space of Fruit Crops. Rev. Bras. Frutic. 2011, 33, 321–334. [Google Scholar] [CrossRef]
- Dias, J.R.M.; Wadt, P.G.S.; Partelli, F.L.; Espindula, M.C.; Perez, D.V.; Souza, F.R.; Bergamin, A.C.; Delarmelinda, E.A. Normal Nutrient Ranges and Nutritional Monitoring of ‘Pêra’ Orange Trees Based on the CND Method in Different Fruiting Stages. Pesqui. Agropecuária Bras. 2017, 52, 776–785. [Google Scholar] [CrossRef]
- Parent, L.E.; Natale, W.; Ziadi, N. Compositional Nutrient Diagnosis of Corn Using the Mahalanobis Distance as Nutrient Imbalance Index. Can. J. Soil Sci. 2009, 89, 383–390. [Google Scholar] [CrossRef]
- Parent, S.-É.; Parent, L.E.; Rozane, D.E.; Natale, W. Plant Ionome Diagnosis Using Sound Balances: Case Study with Mango (Mangifera Indica). Front. Plant Sci. 2013, 4, 449. [Google Scholar] [CrossRef] [PubMed]
- Aguinis, H.; Gottfredson, R.K.; Joo, H. Best-Practice Recommendations for Defining, Identifying, and Handling Outliers. Organ. Res. Methods 2013, 16, 270–301. [Google Scholar] [CrossRef]
- Urano, E.O.M.; Kurihara, C.H.; Maeda, S.; Vitorino, A.C.T.; Gonçalves, M.C.; Marchetti, M.E. Determinação de Teores Ótimos de Nutrientes em Soja Pelos Métodos Chance Matemática, Sistema Integrado de Diagnose e Recomendação e Diagnose da Composição Nutricional. Rev. Bras. Ciência Solo 2007, 31, 63–72. [Google Scholar] [CrossRef]
- Souza, E.D.F.C.D. Fontes e Manejo de Nitrogênio Na Cultura da Batata Em Solos Arenosos. Ph.D. Thesis, Universidade Estadual Paulista “Júlio de Mesquita Filho”, São Paulo, Brazil, 2014. [Google Scholar]
- Modesto, V.C.; Parent, S.-É.; Natale, W.; Parent, L.E. Foliar Nutrient Balance Standards for Maize (Zea Mays L.) at High-Yield Level. Am. J. Plant Sci. 2014, 5, 497–507. [Google Scholar] [CrossRef]
- Parent, L.E.; Cambouris, A.N.; Muhawenimana, A. Multivariate Diagnosis of Nutrient Imbalance in Potato Crops. Soil Sci. Soc. Am. J. 1994, 58, 1432–1438. [Google Scholar] [CrossRef]
- Ganeshamurthy, A.N.; Govindakrishnan, P.; Raghupathi, H.B.; Mahendra Kumar, M.B. Compositional Nutrient Diagnosis (CND) Norms and Indices for Potato (Solanum Tuberosum L.). J. Hortic. Sci. 2019, 14, 142–148. [Google Scholar]
- Khiari, L.; Parent, L.-É.; Tremblay, N. The Phosphorus Compositional Nutrient Diagnosis Range for Potato. Agron. J. 2001, 93, 815–819. [Google Scholar] [CrossRef]
- Bendaly, L.M.; Khiari, L.; Gallichand, J.; Kebede, F.; Kadri, N.; Ben Ammar, N.; Ben Hmida, F.; Ben Mimoun, M. Nutrient Diagnosis Norms for Date Palm (Phoenix dactylifera L.) in Tunisian Oases. Agronomy 2020, 10, 886. [Google Scholar] [CrossRef]
- Rozane, D.E.; Parent, L.E.; Natale, W. Evolution of the Predictive Criteria for the Tropical Fruit Tree Nutritional Status. Científica 2015, 44, 102. [Google Scholar] [CrossRef]
- Nakagawa, S.; Yang, Y.; Macartney, E.L.; Spake, R.; Lagisz, M. Quantitative Evidence Synthesis: A Practical Guide on Meta-Analysis, Meta-Regression, and Publication Bias Tests for Environmental Sciences. Environ. Evid. 2023, 12, 8. [Google Scholar] [CrossRef]
- Fernandes, F.M. Produtividade de Tubérculos e Acúmulo, Partição e Exportação de Nutrientes Em Duas Cultivares de Batata Sob Influência Do Manejo Do Nitrogênio. Ph.D. Thesis, Universidade Estadual Paulista “Júlio de Mesquita Filho”, São Paulo, Brazil, 2021. [Google Scholar]
- Fernandes, A.M. Adubação Fosfatada Em Cultivares de Batata (Solanum Tuberosum L.). Ph.D. Thesis, Universidade Estadual Paulista “Júlio de Mesquita Filho”, São Paulo, Brazil, 2013. [Google Scholar]
- Job, A.L.G. Doses e Parcelamento Da Adubação Potássica Na Cultura Da Batata (Solanum Tuberosum L.). Ph.D. Thesis, Universidade Estadual Paulista “Júlio de Mesquita Filho”, São Paulo, Brazil, 2014. [Google Scholar]
- Nascimento, C.S. Yield and Quality of Potato Tubers in Response to Nitrogen Management. Ph.D. Thesis, Universidade Estadual Paulista “Júlio de Mesquita Filho”, São Paulo, Brazil, 2022. [Google Scholar]
- Ribeiro, G.H.M.R.; Samartini, C.Q.; Silva, L.F.L.; Vieira, S.D.; Resende, L.V. Cultivares. In Batata do Plantio à Colheita; Nich, C., Borém, A., Eds.; Universidade de Viçosa: Viçosa, Brazil, 2017; pp. 77–93. ISBN 9788572695756. [Google Scholar]
- Pereira, A.M.; da Silva Guimarães, M.E.; da Silva Galdino, A.G.; de Paula Gomes, M.; Cruz, R.R.P.; Ribeiro, F.C.S.; Ribeiro, W.S.; Finger, F.L. Potato Cultivars Evaluation for Processing Industry. Res. Soc. Dev. 2020, 9, e7291210803. [Google Scholar] [CrossRef]
- Gonçalves, D.N.; Pereira, A.M.; Soares, L.G.; da Silva Guimarães, M.E.; Petrucci, K.P.D.O.S.; de Oliveira, L.S.; de Mendonça Neto, A.B.; Finger, F.L. Post-Harvest Quality of Cv. Markies Potatoes Submited to Mechancial Damages. J. Agric. Sci. 2020, 12, 124. [Google Scholar] [CrossRef]
- Köppen, W.; Geiger, R. Klima Der Erde (Climate of the Earth). Wall Map 1:16 Mill. Available online: http://koeppen-geiger.vu-wien.ac.at/koeppen.htm (accessed on 10 March 2024).
- EMBRAPA. A Cultura da Batata. Available online: https://www.embrapa.br/hortalicas/batata/clima (accessed on 10 November 2023).
- Lorenzini, J.O.; Monteiro, P.A.; Miranda Filho, H.S.; Raij, B. Raízes e Tubérculos. In Recomendação de Adubação e Calagem para o Estado de São Paulo; Van Raij, B., Cantarela, H., Quaggio, J.A., Furlani, A.M.C., Eds.; Instituto Agronômico de Campinas: Campinas, Brazil, 1997; pp. 221–229. ISBN 0100-3100. [Google Scholar]
- Malavolta, E.; Vitti, G.C.; Oliveira, S.A.D. Avaliação Do Estado Nutricional Das Plantas: Princípios e Aplicações, 1st ed.; Associação Brasileira para Pesquisa da Potassa e do Fosfato, Ed.; Potafos: Piracicaba, Brazil, 1997. [Google Scholar]
- Rousseeuw, P.J.; Croux, C. Explicit Scale Estimators with High Breakdown Point. In L1-Statistical Anal. Relat. Methods; North Holland: Amsterdam, The Netherlands, 1992; Volume 1, pp. 77–92. [Google Scholar]
- Hair, J.J.F.; Black, W.C.; Sant’Anna, A.S. Análise Multivariada de Dados, 6th ed.; Grupo A—Bookman: Porto Alegre, Brazil, 2005; ISBN 9788577805341. [Google Scholar]
- Aitchison, J. The Statistical Analysis of Compositional Data, 1st ed.; Chapman and Hall: London, UK, 1986. [Google Scholar]
- Marchand, S.; Parent, S.-É.; Deland, J.-P.; Parent, L.-É. Nutrient Signature of Quebec (Canada) Cranberry (Vaccinium macrocarpon Ait.). Rev. Bras. Frutic. 2013, 35, 292–304. [Google Scholar] [CrossRef]
- Alemayehu, M.; Jemberie, M.; Yeshiwas, T.; Aklile, M. Integrated Application of Compound NPS Fertilizer and Farmyard Manure for Economical Production of Irrigated Potato (Solanum Tuberosum L.) in Highlands of Ethiopia. Cogent Food Agric. 2020, 6, 1724385. [Google Scholar] [CrossRef]
- Silva, J.G.; França, M.G.C.; Gomide, F.T.F.; Magalhaes, J.R. Different Nitrogen Sources Affect Biomass Partitioning and Quality of Potato Production in a Hydroponic System. Am. J. Potato Res. 2013, 90, 179–185. [Google Scholar] [CrossRef]
- Hawkesford, M.; Horst, W.; Kichey, T.; Lambers, H.; Schjoerring, J.; Møller, I.S.; White, P. Functions of Macronutrients. In Mineral Nutrition of Higher Plants; Marschner, H., Ed.; Academic Press: Amsterdam, The Netherlands, 2012; pp. 135–189. ISBN 978-0-12-384905-2. [Google Scholar]
- Kyveryga, P.M.; Caragea, P.C.; Kaiser, M.S.; Blackmer, T.M. Predicting Risk from Reducing Nitrogen Fertilization Using Hierarchical Models and On-farm Data. Agron. J. 2013, 105, 85–94. [Google Scholar] [CrossRef]
- De Lima Neto, A.J.; Natale, W.; de Deus, J.A.L.; Rozane, D.E. Establishment of Critical Nutrient Levels in the Soil and Leaf of ‘Prata’ Banana Using the Boundary Line. Sci. Hortic. 2024, 328, 112923. [Google Scholar] [CrossRef]
- Koch, M.; Busse, M.; Naumann, M.; Jákli, B.; Smit, I.; Cakmak, I.; Hermans, C.; Pawelzik, E. Differential Effects of Varied Potassium and Magnesium Nutrition on Production and Partitioning of Photoassimilates in Potato Plants. Physiol. Plant. 2019, 166, 921–935. [Google Scholar] [CrossRef] [PubMed]


| Id. 1 | Municipality | Cultivar | Nutrient Studied | Growing Season |
|---|---|---|---|---|
| 1 | São Manuel | Agata | N | 9 May to 20 August 2011 |
| 2 | São Manuel | Agata | N | 9 May to 20 August 2011 |
| 3 | Avaré | Agata | N | 9 May to 20 August 2011 |
| 4 | São Manuel | Agata | N | 9 May to 20 August 2011 |
| 5 | São Manuel | Agata | N | 9 May to 20 August 2011 |
| 6 | Avaré | Agata | N | 9 May to 20 August 2011 |
| 7 | Botucatu | Agata | N | 13 May to 20 August 2011 |
| 8 | Botucatu | Agata | N | 6 August to 6 November 2016 |
| 9 | Botucatu | Agata | N | 27 July to 4 November 2017 |
| 10 | Botucatu | Electra | N | 13 May to 20 August 2016 |
| 11 | Botucatu | Electra | N | 6 August to 6 November 2016 |
| 12 | Botucatu | Electra | N | 27 July to 4 November 2017 |
| 13 | Avaré | Agata, Asterix, Atlantic, Markies, and Mondial | P | 28 April to 18 August 2011 |
| 14 | Itaí | Agata, Asterix, Atlantic, Markies, and Mondial | P | 20 April to 23 July 2011 |
| 15 | Cerqueira | Agata, Asterix, Atlantic, Markies, and Mondial | P | 20 May to 25 August 2011 |
| 16 | Taquarituba | Agata and Mondial | P | 17 June to 24 September 2012 |
| 17 | Taquarituba | Agata | K | 15 June to 22 September 2012 |
| 18 | Bernardino | Agata | K | 18 April to 20 July 2013 |
| 19 | Botucatu | Agata | K | 12 July to 13 November 2013 |
| 20 | Jaboticabal | Asterix | N | 16 April to 11 July 2019 |
| 21 | Jaboticabal | Agata | N | 16 April to 4 July 2019 |
| ilr | Balances | N | K | P | S | Ca | Mg | B | Cu | Zn | Mn | Fe | Fv | r | s |
|---|---|---|---|---|---|---|---|---|---|---|---|---|---|---|---|
| 1 | [N|K] | −1 | 1 | 0 | 0 | 0 | 0 | 0 | 0 | 0 | 0 | 0 | 0 | 1 | 1 |
| 2 | [N, K|Mg] | −1 | −1 | 0 | 0 | 0 | 1 | 0 | 0 | 0 | 0 | 0 | 0 | 1 | 2 |
| 3 | [Ca|Zn] | 0 | 0 | 0 | 0 | −1 | 0 | 0 | 0 | 1 | 0 | 0 | 0 | 1 | 1 |
| 4 | [Fe|Mn] | 0 | 0 | 0 | 0 | 0 | 0 | 0 | 0 | 0 | 1 | −1 | 0 | 1 | 1 |
| 5 | [Mg, N, K|Ca, Zn] | −1 | −1 | 0 | 0 | 1 | −1 | 0 | 0 | 1 | 0 | 0 | 0 | 2 | 3 |
| 6 | [S|B] | 0 | 0 | 0 | −1 | 0 | 0 | 1 | 0 | 0 | 0 | 0 | 0 | 1 | 1 |
| 7 | [P|Fe, Mn] | 0 | 0 | −1 | 0 | 0 | 0 | 0 | 0 | 0 | 1 | 1 | 0 | 2 | 1 |
| 8 | [Cu|S, B] | 0 | 0 | 0 | 1 | 0 | 0 | 1 | −1 | 0 | 0 | 0 | 0 | 2 | 1 |
| 9 | [Mg, N, K, Ca, Zn|Cu, S, B] | −1 | −1 | 0 | 1 | −1 | −1 | 1 | 1 | −1 | 0 | 0 | 0 | 3 | 5 |
| 10 | [P, Fe, Mn|Mg, N, K, Ca, Zn, Cu, S, B] | 1 | 1 | −1 | 1 | 1 | 1 | 1 | 1 | 1 | −1 | −1 | 0 | 8 | 3 |
| 11 | [Fv|P, Fe, Mn, Mg, N, K, Ca, Zn, Cu, S, B] | 1 | 1 | 1 | 1 | 1 | 1 | 1 | 1 | 1 | 1 | 1 | −1 | 11 | 1 |
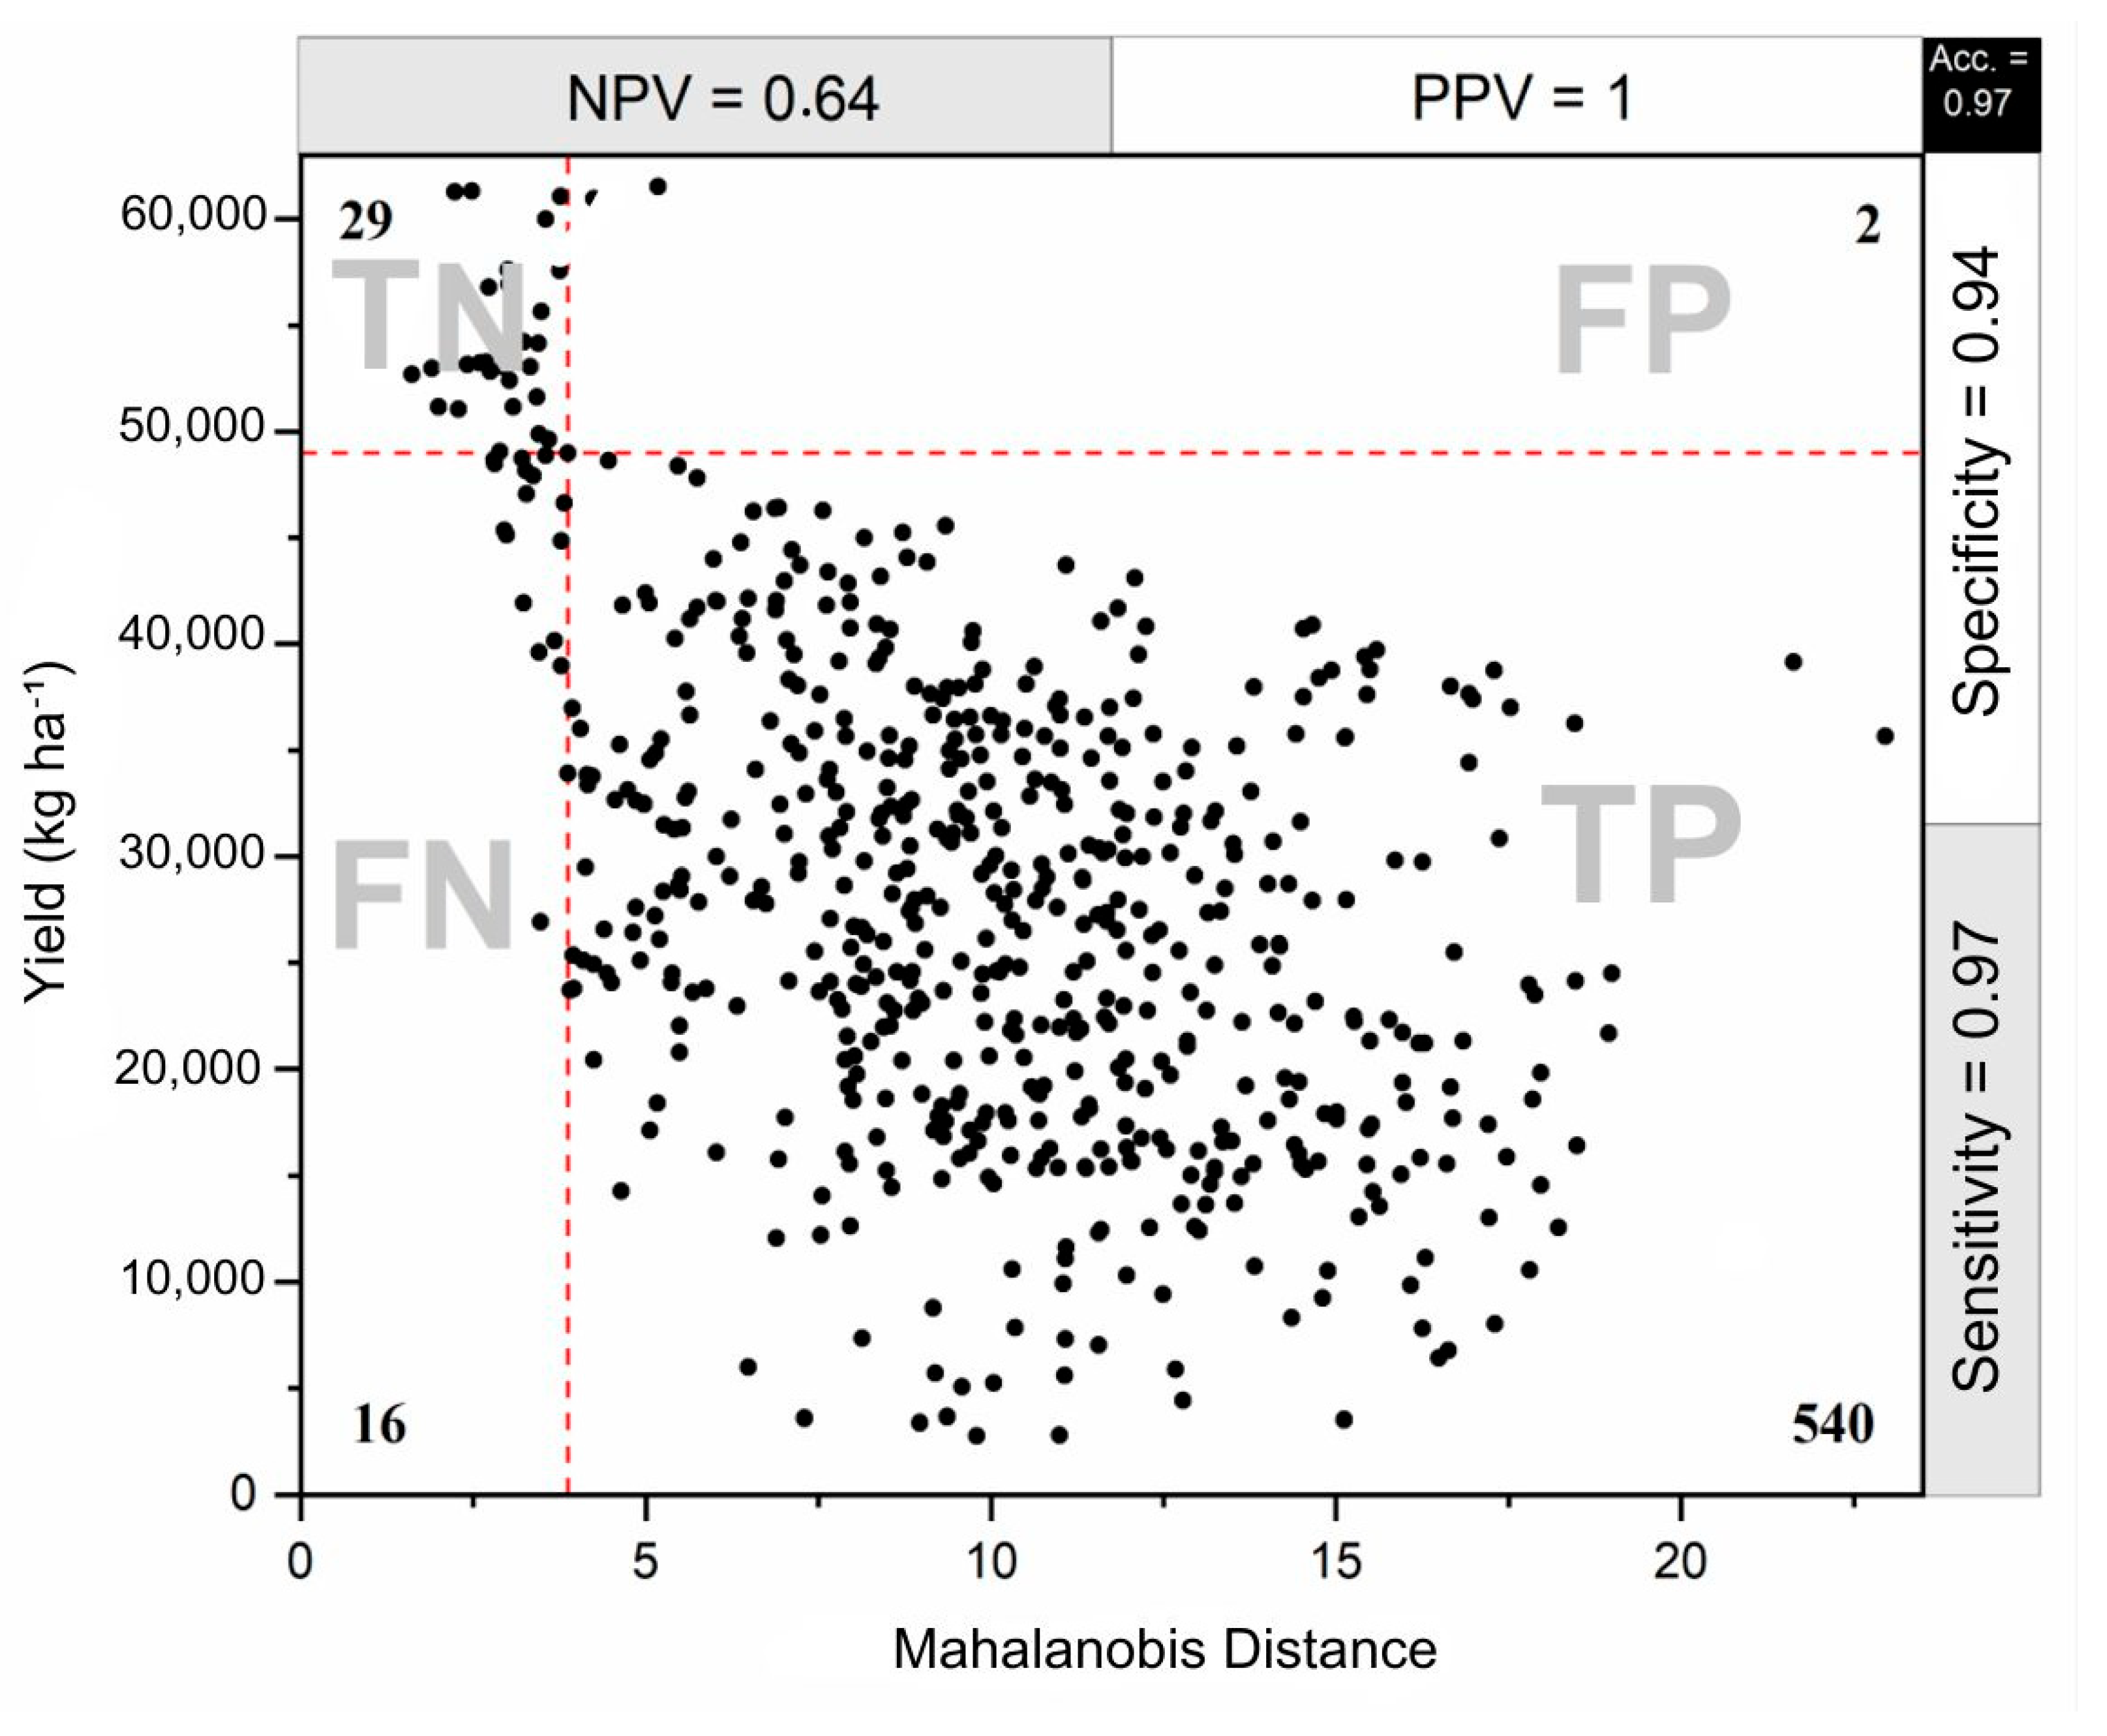
| Quadrants | Number of Experimental Samples | Total of Samples | % | ||
|---|---|---|---|---|---|
| N | P | K | |||
| TN | 20 | 9 | 0 | 29 | 5.0 |
| TP | 148 | 318 | 74 | 540 | 92.0 |
| FP | 2 | 0 | 0 | 2 | 0.3 |
| FN | 6 | 10 | 0 | 16 | 2.7 |
| Total | 176 | 337 | 74 | 587 | 100.0 |
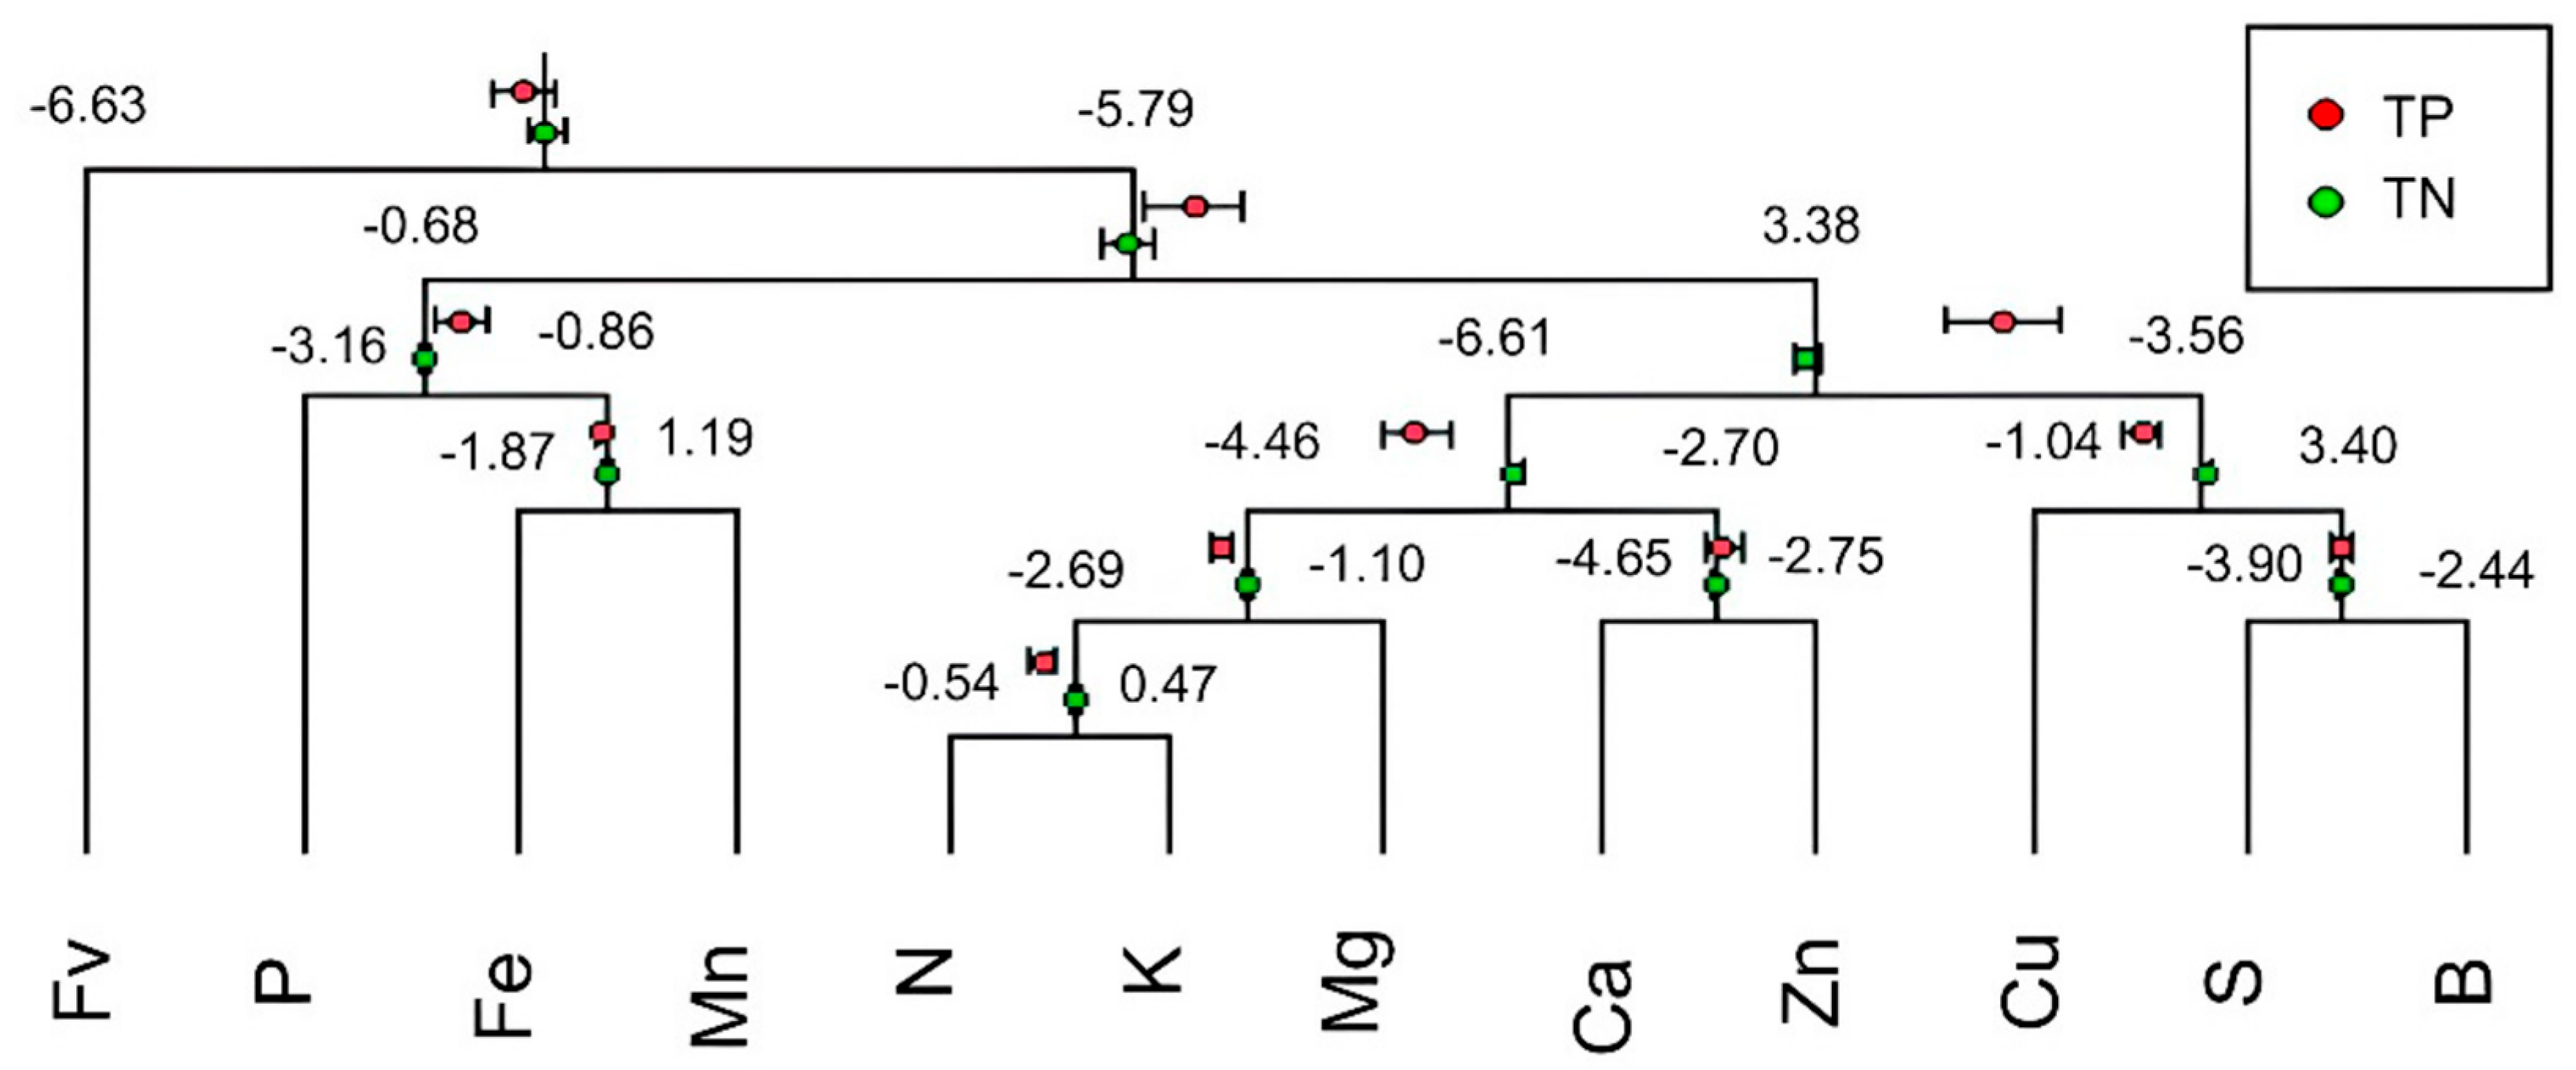
| ilr | Balances | TN | TP | FN | FP |
|---|---|---|---|---|---|
| 1 | [N|K] | −0.10 | 0.03 ** | −0.01 ns | −0.27 ns |
| 2 | [N, K|Mg] | −1.91 | −1.80 ** | −1.88 ns | −1.86 ns |
| 3 | [Ca|Zn] | −3.54 | −3.66 ns | −3.30 ns | −3.77 ns |
| 4 | [Fe|Mn] | −0.71 | −0.66 ns | −0.76 ns | −0.68 ns |
| 5 | [Mg, N, K|Ca, Zn] | −3.78 | −3.46 ** | −3.44 * | −3.95 ns |
| 6 | [S|B] | −3.29 | −3.28 ns | −3.38 * | −3.03 ns |
| 7 | [P|Fe, Mn] | −1.99 | −2.25 * | −2.33 ns | −1.64 ns |
| 8 | [Cu|S, B] | 0.56 | 1.46 ** | 0.96 ns | 0.63 ns |
| 9 | [Mg, N, K, Ca, Zn|Cu, S, B] | −4.49 | −5.30 ** | −4.96 * | −4.75 ns |
| 10 | [P, Fe, Mn|Mg, N, K, Ca, Zn, Cu, S, B] | 1.62 | 1.37 ** | 1.84 ns | 0.89 * |
| 11 | [Fv|P, Fe, Mn, Mg, N, K, Ca, Zn, Cu, S, B] | −6.28 | −6.27 ns | −6.22 * | −6.33 ns |
| ilr1 | ilr2 | ilr3 | ilr4 | ilr5 | ilr6 | ilr7 | ilr8 | ilr9 | ilr10 | ilr11 | |
|---|---|---|---|---|---|---|---|---|---|---|---|
| ilr1 | 0.0307 | ||||||||||
| ilr2 | 0.0097 | 0.0209 | |||||||||
| ilr3 | 0.0533 | 0.0371 | 0.1758 | ||||||||
| ilr4 | −0.0121 | −0.0026 | −0.0280 | 0.0391 | |||||||
| ilr5 | 0.0545 | 0.0362 | 0.1537 | −0.0126 | 0.1659 | ||||||
| ilr6 | −0.0120 | −0.0085 | −0.0425 | −0.0010 | −0.0373 | 0.0332 | |||||
| ilr7 | −0.0782 | −0.0524 | −0.2000 | 0.0363 | −0.1844 | 0.0421 | 0.3075 | ||||
| ilr8 | 0.1078 | 0.0629 | 0.2691 | −0.0479 | 0.2572 | −0.0707 | −0.3835 | 0.6397 | |||
| ilr9 | −0.1058 | −0.0714 | −0.2590 | 0.0425 | −0.2568 | 0.0484 | 0.3757 | −0.5579 | 0.5553 | ||
| ilr10 | 0.0651 | 0.0411 | 0.1493 | −0.0122 | 0.1562 | −0.0442 | −0.2097 | 0.2538 | −0.2549 | 0.2095 | |
| ilr11 | 0.0084 | 0.0041 | 0.0249 | −0.0062 | 0.0252 | −0.0032 | −0.0258 | 0.0318 | −0.0345 | 0.0221 | 0.0059 |
| Average * | −0.0974 | −1.9180 | −3.5445 | −0.7164 | −3.7686 | −3.2896 | −2.0332 | 0.6681 | −4.5701 | 1.5875 | −6.2811 |
Disclaimer/Publisher’s Note: The statements, opinions and data contained in all publications are solely those of the individual author(s) and contributor(s) and not of MDPI and/or the editor(s). MDPI and/or the editor(s) disclaim responsibility for any injury to people or property resulting from any ideas, methods, instructions or products referred to in the content. |
© 2024 by the authors. Licensee MDPI, Basel, Switzerland. This article is an open access article distributed under the terms and conditions of the Creative Commons Attribution (CC BY) license (https://creativecommons.org/licenses/by/4.0/).
Share and Cite
Passos, D.d.R.C.; Cecílio Filho, A.B.; Soratto, R.P.; Rozane, D.E.; Yamane, D.R.; Fernandes, A.M.; Souza, E.d.F.C.d.; Fernandes, F.M.; Job, A.L.G.; Nascimento, C.S. Nutritional Diagnosis of Potato Crops Using the Multivariate Method. Agronomy 2024, 14, 1500. https://doi.org/10.3390/agronomy14071500
Passos DdRC, Cecílio Filho AB, Soratto RP, Rozane DE, Yamane DR, Fernandes AM, Souza EdFCd, Fernandes FM, Job ALG, Nascimento CS. Nutritional Diagnosis of Potato Crops Using the Multivariate Method. Agronomy. 2024; 14(7):1500. https://doi.org/10.3390/agronomy14071500
Chicago/Turabian StylePassos, Danilo dos Reis Cardoso, Arthur Bernardes Cecílio Filho, Rogério Peres Soratto, Danilo Eduardo Rozane, Danilo Ricardo Yamane, Adalton Mazetti Fernandes, Emerson de Freitas Cordova de Souza, Fabiana Morbi Fernandes, André Luiz Gomes Job, and Camila Seno Nascimento. 2024. "Nutritional Diagnosis of Potato Crops Using the Multivariate Method" Agronomy 14, no. 7: 1500. https://doi.org/10.3390/agronomy14071500