Article

A Deeper Insight into the Yield Formation of Winter and Spring Barley in Relation to Weather and Climate Variability

by
Ali Yiğit
1,2,* and
Frank-M. Chmielewski
1
1
Agricultural Climatology, Faculty of Life Sciences, Humboldt-University of Berlin, Albrecht-Thaer-Weg 5, 14195 Berlin, Germany
2
Department of Field Crops, Faculty of Agriculture, Aydın Adnan Menderes University, Aydın 09100, Türkiye
*
Author to whom correspondence should be addressed.
Agronomy 2024, 14(7), 1503; https://doi.org/10.3390/agronomy14071503
Submission received: 12 June 2024 / Revised: 4 July 2024 / Accepted: 9 July 2024 / Published: 11 July 2024
(This article belongs to the Section Crop Breeding and Genetics)

Abstract

:
This study used descriptive statistical methods to investigate how the yield development of winter and spring barley was affected by annual weather variability within the vegetative, ear formation, anthesis, and grain-filling phases. Meteorological, phenological, and yield data from the agrometeorological field experiment in Berlin-Dahlem (Germany) between 2009 and 2022 were used. The results show that the lower yield variability in winter barley (cv = 18.7%) compared to spring barley (cv = 32.6%) is related to an earlier start and longer duration of relevant phenological phases, so yield formation is slower under generally cooler weather conditions. The significantly higher yield variability in spring barley was mainly the result of adverse weather conditions during ear formation and anthesis. In both phases, high temperatures led to significant yield losses, as has often been the case in recent years. In addition, a pronounced negative climatic water balance during anthesis was also a contributing factor. These meteorological parameters explained 82% of the yield variability in spring barley. New strategies for spring barley production are needed to avoid further yield losses in the future. Rising temperatures due to climate change could probably allow an earlier sowing date so that ear formation and anthesis take place in a generally cooler and wetter period, as shown for 2014.

1. Introduction

Climate change is one of the most important environmental issues of our time, and its impacts on global food production and food security are being closely monitored by researchers and governments. Climatic events such as floods, droughts, and changing weather patterns are reducing crop production and complicating the use and distribution of food around the world [1,2,3,4]. Extreme events (heat waves, droughts, and floods) that occur during crop development have multiple impacts on crop production and pose a major threat to yield security, as they can lead to yield and quality losses [5]. There is clear evidence of increasing temperatures and winter precipitation in northern and central Europe, while summer precipitation is decreasing significantly, leading to changes in annual precipitation patterns, such as the frequency of spring droughts. Increasing extremes, including erratic precipitation and prolonged water scarcity, are expected to have long-term impacts on crop production in the face of climate change in Germany [6,7,8].
Barley (Hordeum vulgare L.) is the second most widely grown cereal for animal feed and brewing in Europe, with consistently higher yields than in other countries. It has adapted well during evolution to a wide range of environmental conditions and is grown under rainfed conditions [9]. However, given the effects of climate change, rainfed barley production is threatened by future decreases in precipitation and increases in mean air temperature. This is particularly true for spring barley cultivation, where extreme weather conditions occur during the growing season and crop productivity is highly dependent on the amount and distribution of precipitation [10].
Drought stress, caused by water scarcity, prolonged heat waves, and increasing evapotranspiration rates, is one of the most prominent impacts of climate change on crop production. It is predicted to occur not only in arid and semi-arid regions but also in temperate regions, increasingly affecting barley productivity. As mentioned by Benito-Verdugo et al. [11], this is a worrying sign in areas where water was not actually the dominant yield-limiting factor (Germany) and soil moisture was not previously considered as a continuous limiting factor. Here, increasing water stress can lead to yield losses in wheat and barley (around 5%), while in the southern regions of Spain, yield losses in cereals can increase to over 30% in rainfed agriculture. This situation can lead to high economic losses for farmers and problems in providing sufficient quantities of feed and malting barley [12].
The negative effects of climatic extremes on barley production have already been investigated by Beillouin et al. [13], who found that recent years in Germany have been characterized by drought, especially between March and August [14], resulting in above-average barley crop losses since 1994. This drought was caused by a combination of extreme weather conditions (heat waves in spring and summer), which was accompanied by the highest temperature records of the last 138 years [15,16]. In light of these climatic changes, Weimar [17] investigated a new approach to the fall sowing of spring barley, which can secure the yield potential before a pronounced early-summer drought occurs. Compared with spring sowing, the fall sowing of spring barley systematically produced higher yields with equivalent quality characteristics.
Many climatic factors that lead to yield reductions are related to adverse weather conditions during critical development phases and the length of these phases [18,19]. In addition to management strategies (variety, sowing date, irrigation, etc.), the effects of changing weather conditions lead to yield reductions in spring barley due to a shortening of the crop’s growth cycle as a result of rising temperatures [20]. Cereals respond differently to changes in environmental temperature and water stress. For instance, the timing of anthesis is delayed in maize and rice with the exposure of drought while hastened in wheat and barley. Adverse environmental conditions lead to an early switch in plant development from the vegetative to the reproductive phase [21]. This response is manifested by accelerated senescence with reduced rates of photosynthesis and nutrient uptake due to shortened reproductive and grain-filling times under high temperatures and limited water availability [22,23].
Determining the timing and duration of the critical developmental phases from emergence to anthesis and maturity provides an opportunity to counteract yield and quality losses in barley production. Heading time is controlled by complex genetic mechanisms and modified by environmental conditions. The heading time of barley is an important indicator for the adaptation of barley varieties to drought and stress conditions [24,25,26]. Faster-growing varieties have the advantage of reaching heading and maturity earlier, protecting plants from pre-summer drought and allowing them to grow under cooler weather conditions. Early-summer drought can occur rapidly when heat is combined with high evapotranspiration rates [27]. There are many studies on the sensitivity of reproductive organs to increases in ambient temperature and drought, which adversely affect inflorescence development, resulting in the abnormalities of regenerative organs (deformed and smaller anthers), infertility, and losses in grain number and ear yield (almost up to −60%) [28,29,30,31]. On the other hand, water deficit and heat stress in the post-anthesis phase lead to a shortening of the grain-filling phase, indicating a reduction in nutrient accumulation in the grain. This situation leads to a decrease in grain size and volume (width and length), resulting in quality and yield losses that are critical for the feed and malting industries. Prolonged adverse climatic conditions (the lack of water) reduce grain weight and thus grain yield [32,33,34].
Air temperature and precipitation are two important weather elements that determine crop yield and its variability. Both parameters are important predictors of yield in the phenological phases of plant development, described above [35]. The yields of oats and barley have been reported to be influenced by changes in temperature and precipitation, especially during the generative phase. Nearly 60% of the variability in the grain yield of spring barley and oats in northeastern Germany can be explained by meteorological variables [36]. Local climate changes were observed through temporal and spatial variations in air temperature. Plant phenology is a sensitive indicator that shows a strong response to this meteorological parameter. Increasing spring temperatures lead to an earlier onset of critical phenological stages (e.g., anthesis) [37]. Phenological observations provide useful information and better management strategies: determine the exact growing season, select varieties well adapted to the site, ensure the accurate knowledge of crop management (sowing date, fertilization, irrigation, and the application of crop protection measures), and understand the phenological stages relevant to yield formation. By adapting and aligning phenology with these strategies, farmers and scientists can gain an advantage in the face of climate change [24,38].
In the context of ongoing climate change, this study aims to contribute to a deeper understanding of the weather-related yield development of winter and spring barley in northeastern Germany based on crop yields between 2009 and 2022 from a long-term field experiment. The objectives of this study were as follows:
(i) To investigate the weather-related yield variability in winter and spring barley;
(ii) To determine the critical phenological phases in the yield formation of barley and to identify the weather parameters that significantly influence the yield formation in these phases;
(iii) To derive possible management strategies for spring barley production, considering the climatic extremes of recent years.

2. Materials and Methods

2.1. Study Site and Data Base

For this study, crop yields, meteorological, and phenological data from the agrometeorological field experiment in Berlin-Dahlem (52.47° N, 13.3° E, 51 m altitude) were used. The field experiment was established in the fall of 1952 to study the relationship between weather and the yield development of eight different field crops: potato, winter rye, field bean, oat, sugar beet, corn, spring barley, and yellow lupine [39]. With the exception of unavoidable varietal changes, management practices (crop rotation, soil tillage, sowing density, and fertilization) were applied consistently so that differences in crop development and yield from year to year could be attributed almost exclusively to annual weather conditions. There was no irrigation in the trial. In fall 2008 and spring 2009, some of the trial crops were replaced, with winter barley, forage peas, and winter wheat replacing oats, field beans, and yellow lupine. As a result, the pre-crop of winter barley was now forage pea, and for spring barley always sugar beet. At the same time, the level of mineral NPK fertilization was adjusted according to current knowledge. For this reason, we were only able to use the data between 2009 and 2022 in this study. The average air temperature at the study site for the reference period 1991–2020 was 10.4 °C with an annual precipitation of 562 mm. During the study period 2009–2022, some very extreme years with high air temperatures and low precipitation occurred (Figure S1). The strongest temperature anomalies between March and July of ΔT = 3 °C occurred in 2018 and 2019, and the lowest precipitations were observed in 2020 and 2022 (ΔP = −44% and −57%). In the last two dry years, the mean air temperature anomaly was also more than 2 °C.
The predominant soil type is parabrown with weak traces of light soil (albic luvisol). The topsoil to a depth of 0.30 m is loamy sand with 72.6% sand, 19.7% silt, and 7.7% clay with an available field capacity of 14.8 Vol.%. In the underlying horizons, the clay content increases to about 10%. The organic carbon content of the topsoil is Corg = 1.01% and in the deeper horizons, it is about 0.13%. The pH-value of the soil is 6.1, which is common for this type of soil.

2.2. Barley Yields and Yield Parameters

Yield data for spring and winter barley have been available in parallel since 2009, with no variety changes. The two-row spring variety Scarlett was grown as malting barley and the six-row winter variety Lomerit as feed barley. Both the crops were integrated into the crop rotation of the agrometeorological field trial (Figure 1). Each crop was grown on plots of approximately 215 m2 at a seeding density of 350 seeds/m2 (Lomerit) and 420 seeds/m2 (Scarlett). The time of sowing varied each year depending on the weather conditions, considering the prevailing air temperature and soil moisture. The average sowing dates for winter and spring barley during the study period were 28 September (271 ± 6 DOY; day of the year) and 25 March (84 ± 12 DOY), and the average harvest dates were 30 June (181 ± 5) DOY and 19 July (200 ± 10) DOY, respectively.
The total amount of mineral fertilizer NPK is 50, 20, and 80 kg/ha for “Scarlett” and 80, 25, and 100 kg/ha for “Lomerit”. The fertilizer was applied once a year, for spring barley immediately before sowing and for winter barley at the beginning of the growing season in early spring, on average on 12 March (71 ± 11.6 DOY).
In addition to annual grain yield (YG at 86% dry weight, dt/ha), crop density (CD, ears/m2), number of grains per ear (GN, grains/ear), and grain weight (GW at 86% dry weight, mg/grain) were measured. In the center of each plot, there are two harvesting areas of 2 × 25 m2 to determine YG, GN, and GW. In addition, there are four row segments of 1 m each, distributed throughout the field, which are used to count the total number of germinated plants about two weeks after germination and the final number of ears just before harvest to calculate the germination density (number of plants/m2) and CD. The annual grain yield (YG) is the product of the three yield components (CD, GN, and GW, Equation (1)).
Y G = C D   ( ears m 2 ) G N ( grains ear ) G W ( mg grain ) 10 4   in   dt / ha
Next to these yield components, further yield parameters such as the grain density (GD, grains/m2, the product of CD and GN), the ear yield (YE, g/ear, the product of GW and GN), and the number of ears per plant (EP, ears/plant, the quotient of CD and GD) were used in this study.

2.3. Phenological Data

In parallel with the yield surveys, comprehensive phenological observations were made for spring and winter barley in the field trial from sowing to harvest. Phenological observations were made at least twice a week during the growing season. The annual timing of the phenological phases was recorded and determined according to the BBCH scale [41,42] (BBCH 00-09: emergence, BBCH 10-19: leaf development, BBCH 20-29: tillering, BBCH 30-39: stem elongation, BBCH 40-49: booting, BBCH 50-59: heading, BBCH 60-69: flowering, BBCH 70-79: development of fruit, BBCH 80-89: ripening, and BBCH 90-99: senescence).

2.4. Meteorological Data

The climate station is located in the center of the field experiment (Figure 1) and records numerous meteorological parameters, which are stored at 15 min intervals. The data were then aggregated into daily values so that the daily values of maximum temperature (Tx, °C), minimum temperature (Tn, °C), daily mean temperature (T, °C), precipitation (P, mm/d), potential evapotranspiration of a grass reference area according to Haude [43] (ETp, mm/d), global radiation (Gr, Wm−2/d), sunshine duration (Sd, h/d), and climatic water balance (CWB = P − ETp, mm/d) were available for the investigations. The potential evapotranspiration according to Haude is an easy-to-calculate approach (Equation (2)) which is suitable for the climatic conditions of the site, where f is the so-called Haude parameter (f, mm/hPa) and (E − e)14 is the daily water vapor saturation deficit at 2 pm in hPa. The Haude parameters [44] are monthly values for grass and various field crops in order to calculate ETp on a crop-specific basis. However, the correlation coefficients between YG and ETp, CWB, did not improve significantly when we used the crop-specific Haude parameters for winter and spring barley compared to the parameter for grass. For this reason, we finally used ETp(grass) in this study.
ET P = f ( E e ) 14     in     mm
In this study, the meteorological data (daily means for T, Tx, Tn, Gr, Sd, P) and related climatic characteristics (ETp and CWB) were calculated within the relevant phenological phases. This allowed us to understand and describe the influence of the weather on the yield development of barley.

2.5. Description of Weather/Yield Relationships

To describe the relationships between the 8 meteorological parameters (predictors) and grain yield or the respective yield component (predictand), a correlation analysis was performed between the mean weather conditions within the phenological phases and the target value. First, all the observed phenological phases (10 in total) between sowing and harvest were included in the analysis. Then, the phenological phases were adapted to the extended BBCH scale and divided into four main developmental phases: vegetative phase (BBCH 00-29), ear formation phase (BBCH 30-49), anthesis phase (BBCH 50-69), and grain-filling phase (BBCH 70-99), which are undoubtedly of agronomic importance for yield formation [40]. The variables with the highest correlation coefficients were used to represent the relationship between weather and yield in a multiple linear regression equation. Since the sample size (n) was only 14 years in total (2009–2022), it was not possible to split the dataset into different years for model optimization and validation. Therefore, the cross-validation technique was applied by developing the model for n − 1 years and validating it for the remaining year. This procedure was repeated a total of 14 times, and the adjusted R2 value, the mean absolute error (MAE, Equation (3)), and the root mean square error (RMSE, Equation (4)) were used to evaluate the model [45]. In Equations (3) and (4), n = 14 is the sample size, and Y G cal k the calculated and Y G obs k the observed grain yield in the year k.
MAE = 1 n k = 1 n | Y G cal k Y G obs k |     in     dt / ha
RMSE = 1 n     k = 1 n ( Y G cal k Y G obs k ) 2     in     dt / ha

2.6. Performing the Statistical Analysis

Descriptive statistics and multiple linear regression were analyzed using the IBM SPSS V20 software. The significance level of the differences between the mean meteorological conditions within the phenological phases was analyzed by using the univariate two-sample t-test. Multivariate data analysis, including the principal component analysis (PCA), was performed in R studio (Boston, MA, USA), using the packages “factoextra” [46] and “factoMineR” [47]. In addition, the correlogram was performed in R studio using the “metan” package [48].

3. Results

3.1. Observed Grain Yields and Yield Parameters for Winter and Spring Barley

Grain yield depends on many agronomic factors. In this experiment, these factors were fixed so that the variability in yield was strongly related to the annual weather variability. The mean grain yield for winter barley (Lomerit) and spring barley (Scarlett) in the period 2009–2022 was YG = 61.5 dt/ha and YG = 35.6 dt/ha, respectively (Figure 2, Table 1 and Table 2). Compared to winter barley (cv = 18.7%), spring barley (cv = 32.6%) showed a much higher annual yield variability with extreme values in 2014 (60.0 dt/ha) and 2018 (13.5 dt/ha). In contrast, the grain yield of winter barley was relatively stable, especially between 2012 and 2022. The absolute difference between the highest and the lowest grain yield of winter and spring barley was 37.0 dt/ha and 46.5 dt/ha, respectively.
Table 1 and Table 2 additionally show the statistical values of the three yield components (CD, GN, and GW) and other considered yield parameters (EP, YE, and GD) for both barley varieties. Spring barley tends to have a higher variability (cv) of the yield components and yield parameters, except for GN, compared to winter barley. This is due to the six-row winter barley phenotype, which has almost double the number of grains per ear (GN) compared to the two-row spring barley variety. This mainly explains the almost double grain yield of winter barley, as crop density (CD) and grain weight (GW) were almost identical for both crops. Among the yield parameters, GW had the lowest cv values for both varieties. On the other hand, winter and spring barley showed the highest variability in grain density (GD), which is the product of CD and GN. Apart from GD, the variability in CD (cv = 26.8%) and EP (cv = 27.7%) was much higher in spring barley than in winter barley. Similar results were observed for the ear yield (YE), which, similar to grain yield, was two times lower in spring barley than in winter barley (0.77 g/ear vs. 1.53 g/ear) with a distinctly higher variability (cv = 21.8% vs. 14.9%).

3.2. Relationships between Grain Yield and Yield Parameters

Figure 3 shows the relationships between the grain yield of winter and spring barley and its yield components and other yield parameters for the period 2009–2022.
For the grain yield (YG), which is the product of the three yield components CD, GN, and GW, winter and spring barley showed a significant positive correlation with CD of r = 0.67 ** and r = 0.70 **, respectively. Besides CD, GN was the second yield component that showed a significant positive correlation with the grain yield of winter barley (r = 0.66 *), while for spring barley, this coefficient was not significant (r = 0.44 ns). However, there was no significant (ns) relationship between YG and GW for both varieties. As a result, grain density (GD = CD · GN) influenced the grain yield more distinctly than other yield parameters for both crops (r = 0.93 *** and r = 0.85 ***). The second dominant yield parameter influencing YG of winter and spring barley was the number of ears per plant (EP) with significant correlation coefficients of 0.73 ** and 0.74 **, respectively. In addition, YG was similarly related to the ear yield (YE) for both varieties with r = 0.57 * (winter barley) and r = 0.58 * (spring barley). In summary, YG for winter and spring barley was mainly influenced by GD, EP, CD, and YE with decreasing strength.
In both winter and spring barley, a higher number of grains per ear (GN) had a positive effect on the ear yield (YE) (r = 0.86 ** and r = 0.77 **). In addition, a high number of ears per plant (EP) was favorable for a high crop density (CD) in both varieties (r = 0.90 *** and r = 0.93 ***) and is thus the dominant yield parameter. Significant negative correlation coefficients, describing compensatory effects between grain weight (GW) and grain density (r = −0.71 **) as well as grain number (r = −0.57 *), were found only for winter barley. Conversely, a statistically significant correlation between GW and YE (r = 0.68 **) was found exclusively for spring barley.
According to the PCA analysis for winter barley, two principal components explained 86.5% of the total variation (Dim1: 58.5% and Dim2: 28.0%, Figure 4). It can be seen that the lowest grain yields for winter barley were observed in the first three years 2009–2011 (YG = 42.8 dt/ha on average), as well as slightly below average values in 2013 (YG = 59.2 dt/ha) and 2020 (YG = 58.8 dt/ha). These low yields were mainly caused by lower CD and EP values, while lower GN and YE values were the main reason for the yield losses in 2020, visualized by an opposite vector orientation to the evaluated years. In the years with low grain yield (YG), grain weight (GW) reached higher values, while other yield parameters (e.g., GD) had their lowest values.
In 2015, the highest grain yield of winter barley (YG = 76.3 dt/ha) was a combination of high CD and EP values (same direction of vectors). The combination of above-normal yield parameters for YE and GN also contributed to high grain yields for winter barley as can be seen for the years 2012, 2014, 2016, 2019, and 2021 (YG = 68.8 dt/ha on average). Thus, there are two combinations of yield parameters that contribute to high grain yields. The first group consists of the parameters YE and GN and the second group consists of CD and EP (Figure 4).
Figure 5 shows the principal component analysis for spring barley. Two principal components explain 83.1% of the total variation (Dim1: 51.8% and Dim2: 31.3%). For spring barley, GW has slightly positive effects on yield formation, which has the same direction together with YE and GN, in contrast to winter barley. The years located on the left side of the plot can be grouped as years with low grain yields, which were mainly observed in the last years of the study period (2011, 2015, 2017, 2018, 2019, 2020, and 2022, YG = 26.4 dt/ha on average). All these years are located on the opposite side of the yield component and yield parameter vectors. In 2015, 2020, and 2022 (YG = 28.4 dt/ha on average), the main reason for the low grain yields can be attributed to the lowest YE and GN values among all the studied years (orientation to the opposite side of the vectors). Similarly, the lowest values of CD and EP were observed in 2011, 2017, 2018, and 2019, resulting in yield reductions (YG = 24.8 dt/ha on average). The absolute lowest grain yield was observed in 2018 (YG = 13.6 dt/ha) as a result of low values of CD, EP, YE, and GW.
The years on the right side of the plot, oriented in the same direction as the grain yield, yield component, and yield parameter vectors, can be identified as a high yield group (YG = 44.9 dt/ha on average). The highest grain yield was observed in 2014 (YG = 60.1 dt/ha). It is located on the same right side as the YG vector and was the result of high CD, YE, and GN values.

3.3. Mean Growing Time for Winter and Spring Barley

The average growing time between sowing and harvest for winter and spring barley was significantly different at 268 and 111 days, respectively, with a winter rest of 96 days for winter barley. This results in an effective growing time of 172 days for the winter variety (Figure 6).
The vegetative phase P1 (BBCH 00-BBCH 29) for winter barley lasts on average from 28 September to 9 April (271-99 DOY) and lasts 98 days without winter rest, of which 62 days belong to the previous year and 36 days to the year of harvest. The vegetative phase of spring barley is only 50% of that of winter barley, lasting only 49 days from 25 March to 12 May (84-132 DOY). Compared to the following phenological phases, P1 is the longest for both varieties. The ear formation phase, P2 (BBCH 30-BBCH 49), marks the beginning of the reproductive phase and lasts on average 25 days from 9 April to 4 May (99-124 DOY) for winter barley and 17 days from 12 May to 30 May (132-150 DOY) for spring barley. After ear formation, anthesis phase P3 begins, which lasts 10 days from 7 May to 17 May (127-137 DOY) for winter barley and only 7 days from 2 June to 9 June (153-160 DOY) for spring barley. While phase P3 occurs in early May for winter barley, it occurs almost a month later for spring barley, in early June, a time when air temperature is generally higher. Although the average duration of P3 is almost identical for both varieties, the phase in spring barley shows much greater annual variability, ranging from 2 to 13 days in the years studied. The crop development cycle finally ends with the grain-filling phase P4 (BBCH 70-99), which is also almost identical for both varieties. It lasts 39 days for winter barley, between 22 May and 30 June (142-181 DOY), and 38 days for spring barley, between 12 June and 19 July (163-200 DOY), while the start of the phase differs by 3 weeks.

3.4. Weather Conditions within Phenological Phases for Winter and Spring Barley

The mean weather conditions and observed linear trends between 2009 and 2022 within the four relevant development phases of winter and spring barley are shown in Table 3 and Table 4.
There were several significant (p ≤ 0.05) differences in meteorological conditions between winter and spring barley, mainly within the first three phenological phases. In general, air temperature (Tx, Tn, T) was significantly higher for spring barley compared to winter barley in almost all the phenological phases. This probably explains the generally shorter duration of the spring barley phases. Daily global radiation (Gr) and sunshine duration (Sd) were also significantly higher from the vegetative phase to anthesis, with only one exception (Sd during ear formation). Daily precipitation showed a rather heterogeneous behavior, with slightly higher values during the anthesis phase of spring barley. The higher temperatures during the development phases of spring barley also lead to higher average daily evaporation rates (ETp), ranging from 2.8 mm/d (vegetative phase) to 5.4 mm/d (anthesis). However, the climatic water balance is only significantly higher and even positive during the vegetative phase of winter barley, which ends on average on 9 April.
While in winter barley (Table 3) significant trends were found only in the grain-filling phase for Tx, T, Gr, and ETp, in spring barley (Table 4), significant trends occurred in ear formation and anthesis. Clear trends were found for Tx with 5.63 °C/14a (ear formation) and 8.0 °C/14a (anthesis). Other significant trends during ear formation were for ETp and CWB.

3.5. Relationships between Weather and Yield Parameters for Winter and Spring Barley

The results of the correlation analysis between weather parameters and YG and the three yield components of winter and spring barley are presented in Table 5 and Table 6. Tables S1 and S2 additionally show the correlation coefficients between weather elements and further yield parameters (GD, YE, and EP).
The results of the correlation analysis between the weather conditions in the phenological phases and the grain yield and its components show large differences between the two barley varieties. For winter barley, few significant correlation coefficients were found between weather and yield (Table 5). This underlines the lower weather dependency and thus a significantly higher yield stability of winter barley compared to spring barley. The grain yield of winter barley was only negatively correlated with mean temperature (r = −0.54 *) in the ear formation phase and precipitation (r = −0.55 *) at anthesis (Table 5). For the correlation between the yield components and weather conditions, only a weakly significant correlation (r = −0.56 *) was found between the climatic water balance and the crop density (CD) at anthesis.
Also, few statistically reliable relationships were found between weather conditions and the other yield parameters. For example, high maximum temperatures during ear formation (r = −0.54 *) and higher solar radiation during anthesis (Gr: r = −0.53 *, Sd: r = −0.54 *) caused YE reductions in winter barley, but this was not clearly reflected in grain yield (Table S1).
Compared to winter barley, there were much more significant correlation coefficients between weather elements and spring barley yield (Table 6), indicating significantly higher yield variability. For spring barley, significant correlation coefficients were found between grain yield (YG) and air temperature and climatic water balance during the two reproductive phases. In particular, high maximum temperatures during ear formation (r= −0.66 *) and anthesis (r = −0.79 **) cause yield losses in spring barley. In addition, climatic water balance (CWB) during anthesis was positively related to the grain yield in spring barley (r = 0.57 **). In conclusion, below-normal temperatures during these two reproductive stages and sufficient soil water availability during anthesis are crucial for high yields of spring barley.
In spring barley, all the yield parameters were clearly influenced by the weather conditions in the relevant phenological phases. As expected, CD was significantly influenced by Tx (r = −0.57 *) and P (r = 0.56 *) in the vegetative phase and additionally by Tx during ear formation (r = −0.58 **), representing the negative effect of high maximum temperatures in the first two developmental phases and the effect of water shortage during ear formation. GN was mainly favored by days with high global radiation (r = 0.70 **) between BBCH 30-49. In the vegetative phase, however, high sunshine duration (r = −0.59 *) and potential evapotranspiration (r = −0.55 *) had a negative effect on grain number. Grain weight (GW) was found to have significant correlation coefficients with weather elements, especially in the reproductive phases (anthesis and grain filling). For a high GW, a good water supply during the anthesis phase is particularly beneficial (P: r = 0.56 and CWB: r = 0.55 *). On the other hand, sunny days during the grain-filling phase (Gr: r = 0.63 * and Sd: r = 0.58 *) additionally promoted GW (Table 6).
Among the other yield parameters for spring barley (Table S2), the highest correlation coefficients were found between ear yield (YE) and the meteorological variables P (r = 0.82 **) and CWB (r = 0.74 **) at anthesis. In this phase, a good water supply to the crop is crucial for a high ear yield. Grain density (GD) is positively correlated with precipitation (r = 0.57 *) and climatic water balance (r = 0.56 *) in the vegetative phase, which can be attributed to a high crop density during vegetative development (Figure 3, r(GD,CD) = 0.81 ***). Finally, the number of ears per plant (EP) also shows a significant correlation with the mean daily precipitation during the vegetative phase (r = 0.54 *), as sufficient moisture is beneficial for ear establishment.
Lastly, Table 7 provides a deeper insight into the yield formation and its annual variability in spring barley between 2009 and 2022 in relation to the maximum temperature (Tx) during ear formation and Tx and climatic water balance (CWB) during anthesis. These meteorological elements were closely related to the yield of spring barley (Table 6).
The duration (D) of anthesis, which lasts only 7 days on average, shows a high annual variability (cv = 47.5%) compared to the ear formation phase (cv = 29.1%). Among the relevant meteorological variables, CWB shows the highest annual variability (s = 23.9 mm). To determine the effect of extreme weather conditions in the relevant phenological phases on spring barley yields, it is necessary to study the yield formation in the years (2011, 2015, 2017, 2018, 2019, 2020, and 2022), which were already indicated as years with low yields in the principal component analysis (Figure 5). All these years, except 2019, had a CWB below normal (x = −18.4 mm) at anthesis. The lowest grain yield in 2018 (YG = 13.5 dt/ha) was mainly related to an extremely high maximum temperature at anthesis (Tx = 33.9 °C, 9.2 °C above average), which shortened this phase to 2 days, combined with a CWB slightly below average. As the result for EP, the lowest value (EP = 0.68 ears per plant) was observed in this year. In general, the majority of years with low grain yield were years with a low ear yield (YE) and a reduced number of ears per plant (EP). Yield losses in 2019 (ΔYG = −7.2 dt/ha) were also associated with a low number of ears per plant (EP = 0.76) and above normal maximum temperatures during ear formation (ΔTx = +3.8 °C) and anthesis (ΔTx = +3.7 °C).
In contrast, the highest yield (YG = 60.0 dt/ha) was achieved in 2014. Due to very mild February temperatures (ΔT = 3.1 °C above normal) in this year, spring barley was already sown on 28 February, 25 days earlier than normal. As a result, all the developmental phases started significantly earlier (vegetative phase: −25 d, ear formation phase: −17 d, anthesis: −9 d, and grain-filling phase: −10 d) and lasted at generally lower temperatures (vegetative phase: ΔTx = −2.3 °C, ear formation phase: ΔTx = −3.8 °C, anthesis: ΔTx = −5.1 °C, and grain-filling phase ΔTx = −2.0 °C) slightly longer than normal (vegetative phase: ΔD = +8 d, ear formation phase: ΔD = +8 d, and grain-filling phase ΔD = +5 d). Only the anthesis phase (ΔD = −1 d) was close to the 14-year average. As a result, a maximum crop density of CD = 600 ears/m2 was observed in 2014. The number of ears per plant (ΔEP = +0.26 ears/m2), the grain number (ΔGN = +4.9 grains/ear), and the ear yield (ΔYE = +0.24 g/ear) were all above the 14-year average, resulting in the highest grain yield between 2009 and 2022 (Table 7).

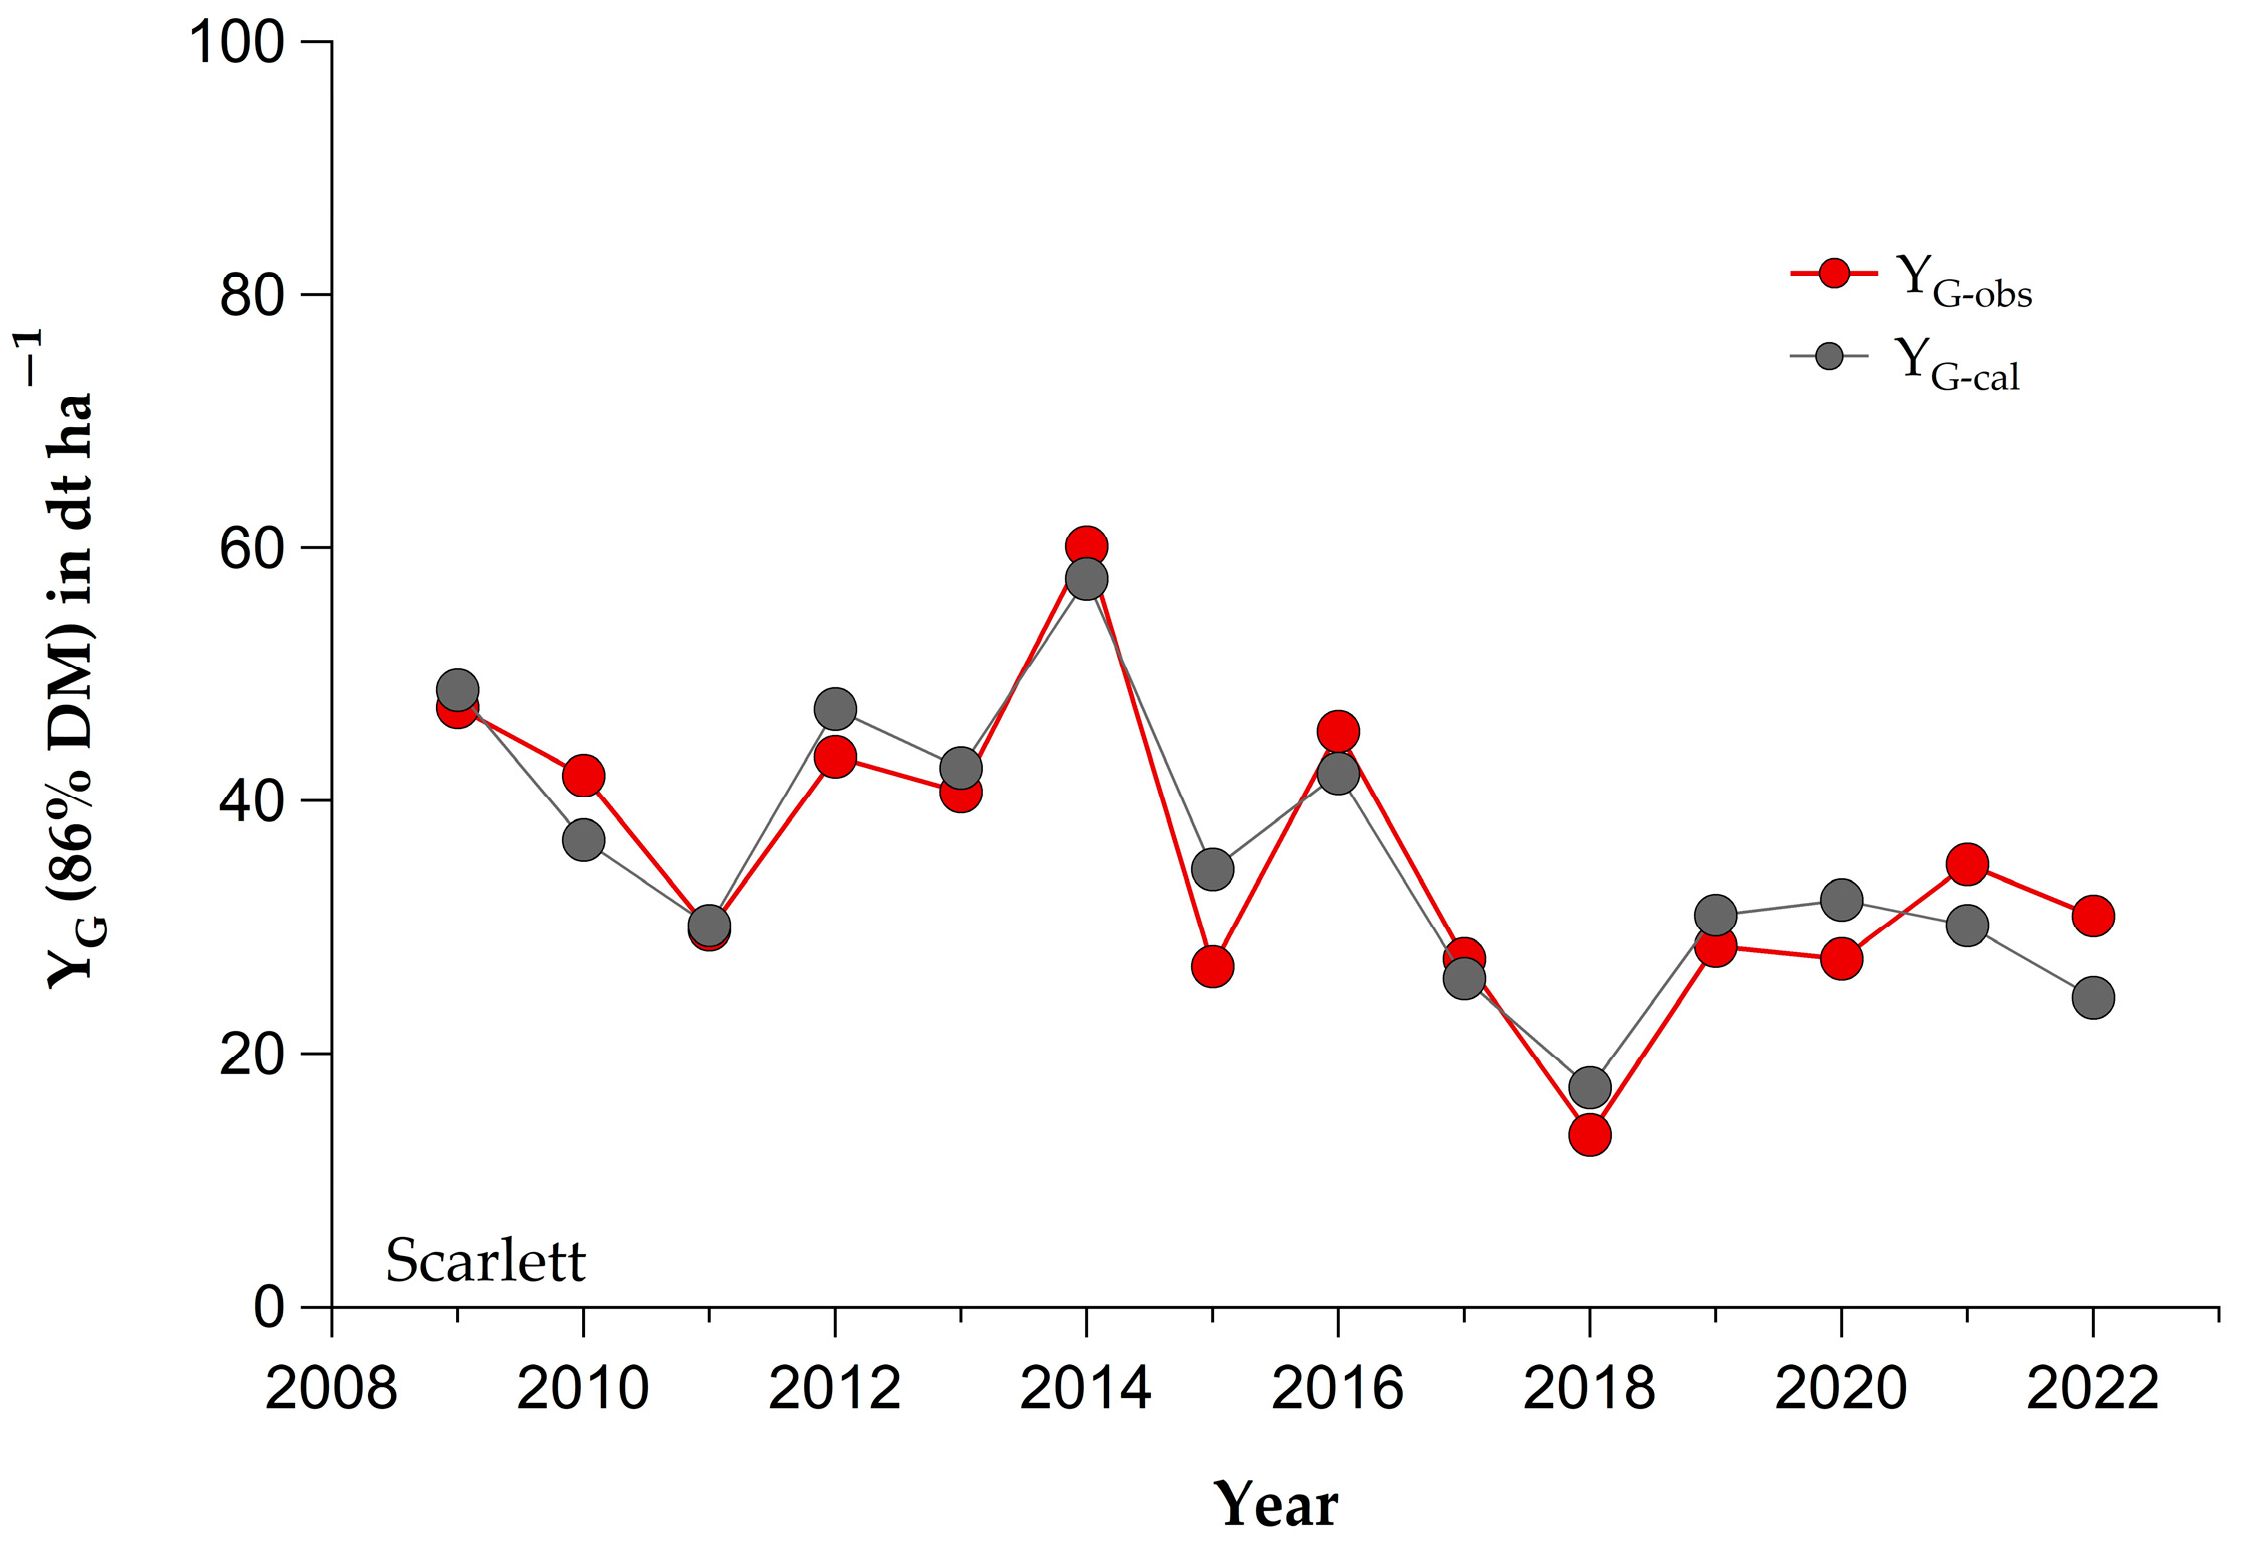
3.6. Statistical Yield Model for the Grain Yield of Spring Barley

The last step in this study was to describe the influence of weather on the yield of spring barley (YG) based on a multiple linear regression model. Table 6 already showed that ear formation and anthesis were the most important phases in which there were significant correlation coefficients between YG and weather elements. Based on these correlation coefficients, a multiple regression model (Table 8) was developed using the backward selection procedure.
Maximum temperatures during ear formation (r = −0.66 *) and anthesis (r = −0.79 **) were identified as one of the most important elements influencing the grain yield of spring barley. In addition, the climatic water balance during anthesis (r = 0.57 **) was the third parameter that remained a significant variable in the model. The model explains 82% of the yield variability by these three parameters with a mean absolute error (MAE = 3.54 dt/ha) and a root mean square error (RMSE = 4.08 dt/ha). The cross-validation of the model slightly increased the model error to MAE = 5.07 dt/ha and RMSE = 5.80 dt/ha, but the regression constant and regression coefficients varied only slightly between years, indicating a relatively robust equation (Table S3). The annual yield variability was well captured by the simple model (Figure 7), indicating the importance of the pre-anthesis and anthesis phases for the spring barley grain yield.

4. Discussion

4.1. Variability in Grain Yields and Yield Components of Winter and Spring Barley

The increasing trends of global warming reveal unfavorable conditions for cereal production and cause yield reductions in rainfed agriculture. This is particularly the case for spring cereals grown in Mediterranean climates, characterized by decreasing and irregular rainfall distribution in spring and summer, but it is also the case in many regions of Europe [49,50,51]. The results of this study suggest that winter barley has a higher yield stability than spring barley. As noted by Döring and Reckling [52], we can confirm that spring crops tend to have higher yield variability due to a shorter growing season and are more dependent on spring water availability. These findings were also highlighted by Macholdt et al. [53], who found higher temporal yield variability in spring barley and mentioned that understanding trends in yield variability is crucial to capturing the potential impacts of climate change.
The level of grain yield between winter and spring barley (Table 1 and Table 2) can firstly be attributed to morphological differences between the two varieties. The differences in row types (2 vs. 6) influence the fertility of the florets located in the central and lateral spikelet of the ear and result in significantly higher values for GN and YE in winter barley [34,54,55]. The annual variability in grain yield in spring barley, which was described by the weather conditions in the corresponding phenological phases, can be well related to the variability in the individual yield components and other yield parameters derived from them. CD and GW were found to be the almost identical yield components for both barley varieties rather than GN and YE. Spring barley had a slightly higher CD than winter barley because the two-row barley variety has a greater ability to establish fertile tillers (better tillering performance) than the six-row variety [56]. The third yield component, GW, which is mainly genetically controlled, showed less variation in both varieties. Two-row barley has an advantage in producing better grain size uniformity due to the plumper grain in the lateral sides, which is more preferred by the malting industry than six-row varieties [57]. This situation is reflected in the formation of heavier grains, although it has a disadvantage in terms of GN compared to winter barley. With the contribution of these two yield components, spring barley is expected to be able to close the yield gap with winter barley.
However, it should be noted that the higher grain number, the longer growing time, and the better use of winter precipitation increased the yield performance and yield stability of winter barley. Due to the phenotypic differences in the row types of both varieties, GD showed the highest annual variability and the strongest correlation with weather elements of all the yield parameters studied (Figure 3). Thus, GD is the most dominant yield parameter influencing the grain yield [58]. GD is the product of CD and GN, where CD is determined earlier in the growing season than GN [59]. Among all the yield components, CD has the highest annual variability and is, therefore, the most important component for grain yield in spring barley.
In addition, the number of ears per plant (EP) was strongly related to YG, as evidenced by higher correlation coefficients after GD in winter and spring barley [60]. This shows the importance of fertile tillering and ear establishment in contributing to a higher number of ears per plant in winter and spring barley. The final number of fertile tillers reaches a maximum around the onset of generative development, followed by a period of tillering death, leading to a reduction in CD and EP [61]. Among the other parameters relevant to yield formation, YE and GN in particular show a significant correlation with grain yield. Therefore, they are the second most important parameters identified in the principal component analysis that influence YG (Figure 4 and Figure 5). Grain number is mainly influenced by the development and survival of the florets. To determine the surviving proportion of the florets, also known as maximizing yield potential, it is important to focus on the development and survival aspects [62]. This study provides further evidence that high yields in winter and spring barley are associated with good ear formation (CD and EP) and achieving higher grain numbers (GN and YE) [63,64,65,66].

4.2. Impact of Weather on Yield Formation of Winter and Spring Barley

Compared to spring barley, the relevant phenological phases of winter barley, including the maturity phase, occurred significantly earlier (Figure 6), i.e., in the periods of lower temperatures and better soil water conditions after winter, and thus lasted longer, which is generally beneficial for a uniform yield development, including its components [50,67,68]. This explains the higher yield stability of winter barley and its lower dependence on weather conditions. The duration of the anthesis phase was found to be almost identical for both varieties, while spring barley showed greater annual variability in the duration of this phase, as it often coincided with warmer periods.
The overall effect of weather on the yield formation in winter and spring barley was shown in the correlation analysis for different phenological phases (Table 5, Table 6, Tables S1 and S2). Among the weather elements, air temperature, especially daily maximum temperature, has the greatest influence on the yield development of spring barley, which also influences the soil water content through daily evapotranspiration rates. This result is confirmed by the significantly positive trends of the Tx parameters in both phases (Table 4). Together with low precipitation and high values of Gr, Sd, and ETp, a strong negative climatic water balance was observed in Berlin-Dahlem in the most recent years (2017, 2018, 2020, 2021, and 2022), especially during anthesis, which is the critical phase for barley productivity [69,70]. The year 2021 showed that a very high crop density (maximum in the study period) can compensate for the effects of a negative CWB during anthesis, even if the grain weight is very low (lowest value in the study period) so that an almost average grain yield was observed in this year.
In contrast to winter barley, spring barley showed a stronger relationship between weather and the development of yield components. Lower temperatures (mainly Tx) and humid weather conditions during the vegetative phase promoted CD and EP to ensure better ear establishment [36]. With sufficient soil water content in the vegetative phase, GD tended to increase as a function of P and CWB. These weather elements were also found to be related to YE and GW in the anthesis phase, where an adequate water supply was also conducive to the development of the yield parameters.
As already seen in Section 3.1 and Section 3.5, extreme grain yields were observed in 2014 and 2018. In 2018, with record temperatures during anthesis and only 25% of the normal precipitation in May and June, the lowest grain yield was observed. In this year, the anthesis phase was the shortest within the study period, which probably caused pollen sterility and indirectly affected the ear yield (YE), resulting in significantly smaller and deformed anthers [31,64]. The highest yield in 2014 shows the advantage of early sowing in order to avoid unfavorable weather conditions during ear formation and anthesis. In this year, the lowest temperatures (Tx) during these phases and even a positive CWB during anthesis were observed. The early sowing resulted in a shift of these relevant phases to cooler periods. As a result, the development phases of spring barley lasted longer than normal. It also allowed the crop to make better use of winter precipitation.

4.3. Calculated Weather Dependency of Spring Barley Yields

The multiple regression model showed which developmental phases and which weather elements most influenced the yield of spring barley. The results indicate that the two main reproductive phases, ear formation (stem elongation to the first visible awns) and anthesis (heading to the end of anthesis), were the most important phases in relation to grain yield of spring barley, explaining 82% of the annual yield variability. In the first phase, the daily maximum temperature (Tx) and in the second phase, the combination of Tx and climatic water balance (CWB) were most related to the grain yield. This confirms the results of Paredes et al. [71], who found that anthesis and ear formation, or the time from double ridge to anthesis, were the most critical phases in the yield formation of spring barley. Rötter et al. [18] also found that the most critical developmental phases in barley were pre-anthesis and post-anthesis, and that significant yield losses during these phases occurred at temperatures above 28–30 °C. Previous studies have also identified heading date as the most important developmental phase related to adaptation to escape terminal drought stress and to determine grain establishment [72,73]. Anthesis is associated with the onset of floret development, which is responsible for the fertility and sterility of pollen or stigma. A short period of heat stress during early floret development results in yield losses due to smaller and deformed anthers [31]. Therefore, water deficit at anthesis and increasing maximum temperature will limit barley growth and ultimately reduce yield (also YE and GN).
It has been found that many weather conditions that cause yield reduction are related to the timing and length of critical phases. Our results suggest that the yield potential of spring barley decreases with exposure to increasing temperatures during ear formation and anthesis. Rising temperatures due to climate change are expected to damage the reproductive organs and accelerate the maturity of barley [74]. The combined effects of rising temperatures and decreasing precipitation may intensify droughts that cause yield losses in spring barley production under rainfed conditions [11]. For this reason, combined weather elements based on precipitation and potential evapotranspiration, such as CWB, provide some rough information on plant water status and is a useful parameter to assess the impact of weather on barley production [75].

4.4. Adaptation Strategies for Spring Barley Production Due to Climate Change

In general, shifting the sowing date can help to minimize the dependence of yield formation on weather conditions in the face of climate change [76,77]. The 2014 results confirmed that early sowing could be a useful strategy for spring barley production in Germany to avoid adverse weather conditions during the most weather-sensitive phases of barley production. Of course, the weather pattern in late winter or early spring has to be considered. On the one hand, it may be impossible to get tractors into the field for soil tillage and sowing after high winter precipitation (e.g., wet soils as in the winter 2023/24 in Germany) [78], and on the other hand, severe frost events shortly after sowing may damage young plants.
Despite these obvious limitations, a comparative field trial of fall- and spring-sown spring barley was conducted at different locations in Thuringia, Germany. Although frost caused some leaf freeze damage and individual plant losses, drought had a much greater effect on the spring-sown barley. The fall-sown crop reached the heading stage relatively early and continued with the early onset of reproductive phases. However, it could not compensate for the grain yield reduction in the spring-sown barley, which was limited by lower CD and GN values compared to the fall-sown barley [79]. This also confirms the importance of these two parameters in our study.
In the future, genetically controlled early anthesis mechanisms could be used by breeders to modify the timing of anthesis to escape dry and warm summer conditions [80]. In this way, newly adapted spring barley cultivars may provide a good opportunity to maintain the yield and quality potential of spring barley under climate change conditions.

5. Conclusions

This study has clearly demonstrated the impact of weather on the yield development of winter and spring barley. Winter barley is more likely to remain a viable crop with less yield variability and less susceptibility to weather conditions compared to spring barley. This is due to the longer growing cycle of winter barley, with the critical stages (ear formation and anthesis) occurring in a significantly cooler weather period and therefore lasting longer. The study also showed that the annual weather conditions cause shifts in the timing and duration of critical phenological phases responsible for yield formation, resulting in yield losses in spring-sown barley. Consequently, adjusting the sowing date, such as early sowing, emerges as a potential solution, referred to as an “escape strategy”, to mitigate yield losses in spring barley. Furthermore, in order to increase the productivity of spring barley and adapt it to climate change, advanced soil moisture conservation strategies, especially for sandy soils, will be needed in the future in addition to sowing time adjustment and breeding studies, such as pre-crop selection, soil cover by residues, etc.

Supplementary Materials

The following supporting information can be downloaded at: https://www.mdpi.com/article/10.3390/agronomy14071503/s1, Figure S1. Anomalies of air temperature (ΔT in °C) and total precipitation (ΔP in %) between March and July in Berlin-Dahlem compared to the climatic reference period 1991–1990, n: number of years; Table S1: Correlation coefficients between weather elements and further yield parameters of winter barley in different phenological phases, significant correlations at * p ≤ 0.05. For abbreviations, see Section 2; Table S2: Correlation coefficients between weather elements and further yield parameters of spring barley in different phenological phases, significant correlations at * p ≤ 0.05, and ** p ≤ 0.01. For abbreviations, see Section 2; Table S3: Cross-validation of the multiple regression model (Table 8) for the period 2009–2022.

Author Contributions

Conceptualization, F.-M.C.; data processing, A.Y.; methodology, F.-M.C. and A.Y.; investigation, A.Y. and F.-M.C.; writing—original draft preparation, F.-M.C. and A.Y.; writing—review and editing, F.-M.C. and A.Y. All authors have read and agreed to the published version of the manuscript.

Funding

This research was not externally funded.

Data Availability Statement

The data presented in this study are available on request from the corresponding author.

Acknowledgments

A.Y. is grateful for the support of a post-doctoral fellowship from The Scientific and Technological Research Council of Türkiye (TÜBİTAK) for the financial support under the 2219 program. The authors are grateful to Susanne Moryson (Humboldt-University of Berlin) for technical assistance with all the field and weather observations. We would also like to thank the Teaching and Research Station for Crop Sciences at the Berlin-Dahlem site, in particular Jörg Schmidt and his colleagues, for the decades of precise experimental work in the agrometeorological field experiment. We sincerely thank Klaus-Peter Götz for his valuable scientific comments and contributions to the study. We would like to thank the reviewers and the editorial team for their valuable comments, suggestions, and extensive support during the publication process.

Conflicts of Interest

The authors declare no conflicts of interest.

References

  1. Porter, J.R.; Xie, L.; Challinor, A.J.; Cochrane, K.; Howden, S.M.; Iqbal, M.M.; Lobell, D.B.; Travasso, M.I. Food security and food production systems. In Climate Change 2014: Impacts, Adaptation, and Vulnerability. Part A: Global and Sectoral Aspects. Contribution of Working Group II to the Fifth Assessment Report of the Intergovernmental Panel on Climate Change; Field, C.B., Barros, V.R., Dokken, D.J., Mach, K.J., Mastrandrea, M.D., Bilir, T.E., Chatterjee, M., Ebi, K.L., Estrada, Y.O., Genova, R.C., et al., Eds.; Cambridge University Press: Cambridge, UK; New York, NY, USA, 2014; pp. 485–533. [Google Scholar]
  2. Brown, M.E.; Antle, J.M.; Backlund, P.; Carr, E.R.; Easterling, W.E.; Walsh, M.K.; Ammann, C.; Attavanich, W.; Barrett, C.B.; Bellemare, M.F.; et al. Key Concepts and Definitions. In Climate Change, Global Food Security, and the U.S. Food System; U.S. Global Change Research Program: Washington, DC, USA, 2015; pp. 17–23. [Google Scholar] [CrossRef]
  3. Wang, J.; Vanga, S.; Saxena, R.; Orsat, V.; Raghavan, V. Effect of Climate Change on the Yield of Cereal Crops: A Review. Climate 2018, 6, 41. [Google Scholar] [CrossRef]
  4. Al-Bakri, J.; Farhan, I.; Al-Qinna, M.; Al-Karablieh, E.; Bergouli, K.; McDonnell, R. Assessment of Climate Changes and Their Impact on Barley Yield in Mediterranean Environment Using NEX-GDDP Downscaled GCMs and DSSAT. Earth Syst. Environ. 2021, 5, 751–766. [Google Scholar] [CrossRef]
  5. Fahad, S.; Bajwa, A.A.; Nazir, U.; Anjum, S.A.; Farooq, A.; Zohaib, A.; Sadia, S.; Nasim, W.; Adkins, S.; Saud, S.; et al. Crop Production under Drought and Heat Stress: Plant Responses and Management Options. Front. Plant Sci. 2017, 8, 1147. [Google Scholar] [CrossRef] [PubMed]
  6. Bindi, M.; Olesen, J.E. The Responses of Agriculture in Europe to Climate Change. Reg. Environ. Chang. 2011, 11, 151–158. [Google Scholar] [CrossRef]
  7. Olesen, J.E.; Trnka, M.; Kersebaum, K.C.; Skjelvåg, A.O.; Seguin, B.; Peltonen-Sainio, P.; Rossi, F.; Kozyra, J.; Micale, F. Impacts and Adaptation of European Crop Production Systems to Climate Change. Eur. J. Agron. 2011, 34, 96–112. [Google Scholar] [CrossRef]
  8. Donmez, C.; Schmidt, M.; Cilek, A.; Grosse, M.; Paul, C.; Hierold, W.; Helming, K. Climate Change Impacts on Long-Term Field Experiments in Germany. Agric. Syst. 2023, 205, 103578. [Google Scholar] [CrossRef]
  9. Zhou, M.X. Barley production and consumption. In Genetics and Improvement of Barley Malt Quality; Zhang, G., Li, C., Eds.; Advanced Topics in Science and Technology in China; Zhejiang University Press: Hangzhou, China; Springer: Dordrecht, The Netherlands, 2009; pp. 1–16. ISBN 978-3-642-01278-5. [Google Scholar]
  10. Daničić, M.; Zekić, V.; Mirosavljević, M.; Lalić, B.; Putnik-Delić, M.; Maksimović, I.; Dalla Marta, A. The Response of Spring Barley (Hordeum vulgare L.) to Climate Change in Northern Serbia. Atmosphere 2019, 10, 14. [Google Scholar] [CrossRef]
  11. Benito-Verdugo, P.; Martínez-Fernández, J.; González-Zamora, Á.; Almendra-Martín, L.; Gaona, J.; Herrero-Jiménez, C.M. Impact of Agricultural Drought on Barley and Wheat Yield: A Comparative Case Study of Spain and Germany. Agriculture 2023, 13, 2111. [Google Scholar] [CrossRef]
  12. Yawson, D.O.; Adu, M.O.; Armah, F.A. Impacts of Climate Change and Mitigation Policies on Malt Barley Supplies and Associated Virtual Water Flows in the UK. Sci. Rep. 2020, 10, 376. [Google Scholar] [CrossRef]
  13. Beillouin, D.; Schauberger, B.; Bastos, A.; Ciais, P.; Makowski, D. Impact of Extreme Weather Conditions on European Crop Production in 2018. Phil. Trans. R. Soc. B 2020, 375, 20190510. [Google Scholar] [CrossRef]
  14. Toreti, A.; Belward, A.; Perez-Dominguez, I.; Naumann, G.; Luterbacher, J.; Cronie, O.; Seguini, L.; Manfron, G.; Lopez-Lozano, R.; Baruth, B.; et al. The Exceptional 2018 European Water Seesaw Calls for Action on Adaptation. Earth’s Future 2019, 7, 652–663. [Google Scholar] [CrossRef]
  15. Bindereif, S.G.; Rüll, F.; Kolb, P.; Köberle, L.; Willms, H.; Steidele, S.; Schwarzinger, S.; Gebauer, G. Impact of Global Climate Change on the European Barley Market Requires Novel Multi-Method Approaches to Preserve Crop Quality and Authenticity. Foods 2021, 10, 1592. [Google Scholar] [CrossRef] [PubMed]
  16. Appiah, M.; Abdulai, I.; Schulman, A.H.; Moshelion, M.; Dewi, E.S.; Daszkowska-Golec, A.; Bracho-Mujica, G.; Rötter, R.P. Drought Response of Water-Conserving and Non-Conserving Spring Barley Cultivars. Front. Plant Sci. 2023, 14, 1247853. [Google Scholar] [CrossRef] [PubMed]
  17. Weimar, S. Herbstaussaat von Sommerbraugerste-Untersuchungen zum Ertragspotenzial von Sommerbraugerste in Abhängigkeit von dem Aussaattermin und der N-Düngung. Phänologie J. 2023, 61, 1–11. [Google Scholar]
  18. Rötter, R.P.; Palosuo, T.; Kersebaum, K.C.; Angulo, C.; Bindi, M.; Ewert, F.; Ferrise, R.; Hlavinka, P.; Moriondo, M.; Nendel, C.; et al. Simulation of Spring Barley Yield in Different Climatic Zones of Northern and Central Europe: A Comparison of Nine Crop Models. Field Crop. Res. 2012, 133, 23–36. [Google Scholar] [CrossRef]
  19. Jampoh, E.A.; Sáfrán, E.; Babinyec-Czifra, D.; Kristóf, Z.; Krárné Péntek, B.; Fábián, A.; Barnabás, B.; Jäger, K. Morpho-Anatomical, Physiological and Biochemical Adjustments in Response to Heat and Drought Co-Stress in Winter Barley. Plants 2023, 12, 3907. [Google Scholar] [CrossRef] [PubMed]
  20. Trnka, M.; Dubrovský, M.; Žalud, Z. Climate Change Impacts and Adaptation Strategies in Spring Barley Production in the Czech Republic. Clim. Chang. 2004, 64, 227–255. [Google Scholar] [CrossRef]
  21. Farooq, M.; Hussain, M.; Wahid, A.; Siddique, K.H.M. Drought Stress in Plants: An Overview. In Plant Responses to Drought Stress, From Morphological to Molecular Features; Aroca, R., Ed.; Springer: Berlin/Heidelberg, Germany, 2012; pp. 1–33. ISBN 978-3-642-32652-3. [Google Scholar]
  22. Farooq, M.; Bramley, H.; Palta, J.A.; Siddique, K.H.M. Heat Stress in Wheat during Reproductive and Grain-Filling Phases. Crit. Rev. Plant Sci. 2011, 30, 491–507. [Google Scholar] [CrossRef]
  23. Olesen, J.E.; Børgesen, C.D.; Elsgaard, L.; Palosuo, T.; Rötter, R.P.; Skjelvåg, A.O.; Peltonen-Sainio, P.; Börjesson, T.; Trnka, M.; Ewert, F.; et al. Changes in Time of Sowing, Flowering and Maturity of Cereals in Europe under Climate Change. Food Addit. Contam. Part A 2012, 29, 1527–1542. [Google Scholar] [CrossRef] [PubMed]
  24. Ibrahim, A.; Harrison, M.; Meinke, H.; Zhou, M. Barley Phenology: Physiological and Molecular Mechanisms for Heading Date and Modelling of Genotype-Environment-Management Interactions. In Plant Growth; Rigobelo, E.C., Ed.; InTech: Houston, TX, USA, 2016; pp. 175–202. ISBN 978-953-51-2771-0. [Google Scholar]
  25. Alqudah, A.M.; Schnurbusch, T. Heading Date Is Not Flowering Time in Spring Barley. Front. Plant Sci. 2017, 8, 896. [Google Scholar] [CrossRef]
  26. Sato, K.; Ishii, M.; Takahagi, K.; Inoue, K.; Shimizu, M.; Uehara-Yamaguchi, Y.; Nishii, R.; Mochida, K. Genetic Factors Associated with Heading Responses Revealed by Field Evaluation of 274 Barley Accessions for 20 Seasons. iScience 2020, 23, 101146. [Google Scholar] [CrossRef]
  27. Appiah, M.; Bracho-Mujica, G.; Ferreira, N.C.R.; Schulman, A.H.; Rötter, R.P. Projected Impacts of Sowing Date and Cultivar Choice on the Timing of Heat and Drought Stress in Spring Barley Grown along a European Transect. Field Crop. Res. 2023, 291, 108768. [Google Scholar] [CrossRef]
  28. Porter, J.R.; Semenov, M.A. Crop Responses to Climatic Variation. Phil. Trans. R. Soc. B 2005, 360, 2021–2035. [Google Scholar] [CrossRef] [PubMed]
  29. Craufurd, P.Q.; Wheeler, T.R. Climate Change and the Flowering Time of Annual Crops. J. Exp. Bot. 2009, 60, 2529–2539. [Google Scholar] [CrossRef] [PubMed]
  30. Cai, K.; Chen, X.; Han, Z.; Wu, X.; Zhang, S.; Li, Q.; Nazir, M.M.; Zhang, G.; Zeng, F. Screening of Worldwide Barley Collection for Drought Tolerance: The Assessment of Various Physiological Measures as the Selection Criteria. Front. Plant Sci. 2020, 11, 1159. [Google Scholar] [CrossRef] [PubMed]
  31. Callens, C.; Fernandez-Goméz, J.; Tucker, M.R.; Zhang, D.; Wilson, Z.A. Heat Stress Responses Vary during Floret Development in European Spring Barley Cultivars. Front. Plant Sci. 2023, 13, 918730. [Google Scholar] [CrossRef] [PubMed]
  32. Dupont, F.M.; Altenbach, S.B. Molecular and Biochemical Impacts of Environmental Factors on Wheat Grain Development and Protein Synthesis. J. Cereal Sci. 2003, 38, 133–146. [Google Scholar] [CrossRef]
  33. Samarah, N.H.; Alqudah, A.M.; Amayreh, J.A.; McAndrews, G.M. The Effect of Late-terminal Drought Stress on Yield Components of Four Barley Cultivars. J Agron. Crop Sci. 2009, 195, 427–441. [Google Scholar] [CrossRef]
  34. Hoyle, A.; Brennan, M.; Rees, L.; Jackson, G.; Hoad, S. Post-Anthesis Water-Stressed Barley Maintains Grain Specific Weight Through Altered Grain Composition and Plant Architecture. Plants 2020, 9, 1564. [Google Scholar] [CrossRef]
  35. Thai, T.H.; Bellingrath-Kimura, S.D.; Hoffmann, C.; Barkusky, D. Effect of Long-Term Fertiliser Regimes and Weather on Spring Barley Yields in Sandy Soil in North-East Germany. Arch. Agron. Soil Sci. 2020, 66, 1812–1826. [Google Scholar] [CrossRef]
  36. Chmielewski, F.-M.; Köhn, W. Impact of Weather on Yield Components of Spring Cereals over 30 Years. Agric. For. Meteorol. 1999, 96, 49–58. [Google Scholar] [CrossRef]
  37. Waldau, T.; Chmielewski, F. Spatial and Temporal Changes of Spring Temperature, Thermal Growing Season and Spring Phenology in Germany 1951–2015. Meteorol. Z. 2018, 27, 335–342. [Google Scholar] [CrossRef]
  38. Chmielewski, F.M. Phenology in Agriculture and Horticulture. In An Integrative Environmental Science, 2nd ed.; Schwartz, M.D., Ed.; Kluwer Academic Publishers: Dordrecht, The Netherlands, 2012; pp. 1–23. [Google Scholar]
  39. Chmielewski, F.-M.; Köhn, W. The long-term agrometeorological field experiment at Berlin-Dahlem, Germany. Agric. For. Meteorol. 1999, 96, 39–48. [Google Scholar] [CrossRef]
  40. Alley, M.M.; Brann, D.E.; Stromberg, E.L.; Hagood, E.S.; Herbert, A.; Jones, E.C.; Griffith, W.K. Intensive Soft Red Winter Wheat Production: A Management Guide; Virginia Tech Cooperative Extension Publication: Washington, VA, USA, 1993; pp. 424–803. [Google Scholar]
  41. Strauβ, R.; Bleiholder, H.; van den Bomm, T.; Buhr, L.; Hack, H.; Heb, M.; Klose, R.; Meier, U.; Weber, E. Einheitliche Codierung der Phänologischen Entwicklungsstadien Mono-Und dikotyler Pflanzen; Erweiterte BBCH-Skala: Basel, Switzerland, 1994. [Google Scholar]
  42. Meier, U. Growth Stages of Mono- and Dicotyledonous Plants; BBCH-Monograph Blackwell: Berlin, Germany, 1997. [Google Scholar]
  43. Haude, W. Verdunstungsmenge und Evaporationskraft eines Klimas. Ber. Dt. Wetterd. US Zone 1952, 42, 225–229. [Google Scholar]
  44. Löpmeier, F.-J. Berechnung der Bodenfeuchte und Verdunstung mittels agrarmeteorologischer Modelle. Z. Für Bewässerungswirtschaft 1994, 29, 157–167. [Google Scholar]
  45. Picard, R.R.; Cook, R.D. Cross-Validation of Regression Models. J. Am. Stat. Assoc. 1984, 79, 575–583. [Google Scholar] [CrossRef]
  46. Kassambara, A.; Mundt, F. Factoextra: Extract and Visualize the Results of Multivariate Data Analyses, R Package Version 1.0.7. 2020. Available online: https://CRAN.R-project.org/package=factoextra (accessed on 1 August 2023).
  47. Husson, F.; Josse, J.; Le, S.; Mazet, J. FactoMineR: Multivariate Exploratory Data Analysis and Data Mining, R Package Version 2.8. 2017. Available online: http://factominer.free.fr (accessed on 1 August 2023).
  48. Olivoto, T.; Lúcio, A.D. Metan: An R Package for Multi-environment Trial Analysis. Methods Ecol. Evol. 2020, 11, 783–789. [Google Scholar] [CrossRef]
  49. Moore, F.C.; Lobell, D.B. The Fingerprint of Climate Trends on European Crop Yields. Proc. Natl. Acad. Sci. USA 2015, 112, 2670–2675. [Google Scholar] [CrossRef]
  50. Yang, C.; Fraga, H.; Van Ieperen, W.; Trindade, H.; Santos, J.A. Effects of Climate Change and Adaptation Options on Winter Wheat Yield under Rainfed Mediterranean Conditions in Southern Portugal. Clim. Chang. 2019, 154, 159–178. [Google Scholar] [CrossRef]
  51. Hossain, A.; Sabagh, A.E.; Barutcular, C.; Bhatt, R.; Çiğ, F.; Seydoşoğlu, S.; Turan, N.; Konuskan, O.; Iqbal, M.A.; Abdelhamid, M.; et al. Sustainable Crop Production to Ensuring Food Security under Climate Change: A Mediterranean Perspective. Aust. J. Crop Sci. 2020, 14, 439–446. [Google Scholar] [CrossRef]
  52. Döring, T.F.; Reckling, M. Detecting Global Trends of Cereal Yield Stability by Adjusting the Coefficient of Variation. Eur. J. Agron. 2018, 99, 30–36. [Google Scholar] [CrossRef]
  53. Macholdt, J.; Hadasch, S.; Piepho, H.-P.; Reckling, M.; Taghizadeh-Toosi, A.; Christensen, B.T. Yield Variability Trends of Winter Wheat and Spring Barley Grown during 1932–2019 in the Askov Long-Term Experiment. Field Crop. Res. 2021, 264, 108083. [Google Scholar] [CrossRef]
  54. González, A.; Martín, I.; Ayerbe, L. Response of Barley Genotypes to Terminal Soil Moisture Stress: Phenology, Growth, and Yield. Aust. J. Agric. Res. 2007, 58, 29. [Google Scholar] [CrossRef]
  55. Dodig, D.; Kandić, V.; Zorić, M.; Nikolić-Đorić, E.; Nikolić, A.; Mutavdžić, B.; Perović, D.; Šurlan-Momirović, G. Comparative Kernel Growth and Yield Components of Two- and Six-Row Barley (Hordeum vulgare) under Terminal Drought Simulated by Defoliation. Crop Pasture Sci. 2018, 69, 1215. [Google Scholar] [CrossRef]
  56. Alvarez Prado, S.; Gallardo, J.M.; Kruk, B.C.; Miralles, D.J. Strategies for Yield Determination of Bread Wheat and Two-Row Barley Growing under Different Environments: A Comparative Study. Field Crop. Res. 2017, 203, 94–105. [Google Scholar] [CrossRef]
  57. Vahamidis, P.; Stefopoulou, A.; Kotoulas, V.; Bresta, P.; Nikolopoulos, D.; Karabourniotis, G.; Mantonanakis, G.; Vlachos, C.; Dercas, N.; Economou, G. Grain Size Variation in Two-Rowed Malt Barley under Mediterranean Conditions: Phenotypic Plasticity and Relevant Trade-Offs. Field Crop. Res. 2022, 279, 108454. [Google Scholar] [CrossRef]
  58. Thirulogachandar, V.; Koppolu, R.; Schnurbusch, T. Strategies of Grain Number Determination Differentiate Barley Row Types. J. Exp. Bot. 2021, 72, 7754–7768. [Google Scholar] [CrossRef] [PubMed]
  59. Miralles, D.J.; Abeledo, L.G.; Prado, S.A.; Chenu, K.; Serrago, R.A.; Savin, R. Barley. In Crop Physiology Case Histories for Major Crops; Elsevier: Amsterdam, The Netherlands, 2021; pp. 164–195. ISBN 978-0-12-819194-1. [Google Scholar]
  60. Ruzdik, N.M.; Valcheva, D.; Vulchev, D.; Mihajlov, L.; Karov, I.; Ilieva, V. Correlation between Grain Yield and Yield Components in Winter Barley Varieties. Agric. Sci. Technol. 2015, 7, 40–44. [Google Scholar]
  61. Kennedy, S.P.; Bingham, I.J.; Spink, J.H. Determinants of Spring Barley Yield in a High-Yield Potential Environment. J. Agric. Sci. 2017, 155, 60–80. [Google Scholar] [CrossRef]
  62. Thirulogachandar, V.; Schnurbusch, T. ‘Spikelet Stop’ Determines the Maximum Yield Potential Stage in Barley. J. Exp. Bot. 2021, 72, 7743–7753. [Google Scholar] [CrossRef]
  63. Rajala, A.; Hakala, K.; Mäkelä, P.; Peltonen-Sainio, P. Drought Effect on Grain Number and Grain Weight at Spike and Spikelet Level in Six-Row Spring Barley: Drought Effect on Grain Number and Grain Weight. J. Agron. Crop Sci. 2011, 197, 103–112. [Google Scholar] [CrossRef]
  64. Hakala, K.; Jauhiainen, L.; Rajala, A.A.; Jalli, M.; Kujala, M.; Laine, A. Different Responses to Weather Events May Change the Cultivation Balance of Spring Barley and Oats in the Future. Field Crop. Res. 2020, 259, 107956. [Google Scholar] [CrossRef]
  65. Eroshenko, L.M.; Levakova, O.V.; Gladysheva, O.V.; Gureeva, E.V.; Romakhin, M.M.; Dedushev, I.A. The Elements of Productivity and Their Contribution to High Level of Crop Yield (Based on Spring Barley Researches). IOP Conf. Ser. Earth Environ. Sci. 2021, 843, 012005. [Google Scholar] [CrossRef]
  66. Serrago, R.A.; García, G.A.; Savin, R.; Miralles, D.J.; Slafer, G.A. Determinants of Grain Number Responding to Environmental and Genetic Factors in Two- and Six-Rowed Barley Types. Field Crop. Res. 2023, 302, 109073. [Google Scholar] [CrossRef]
  67. Wahbi, A.; Sinclair, T.R. Simulation Analysis of Relative Yield Advantage of Barley and Wheat in an Eastern Mediterranean Climate. Field Crop. Res. 2005, 91, 287–296. [Google Scholar] [CrossRef]
  68. Dawson, I.K.; Russell, J.; Powell, W.; Steffenson, B.; Thomas, W.T.B.; Waugh, R. Barley: A Translational Model for Adaptation to Climate Change. New Phytol. 2015, 206, 913–931. [Google Scholar] [CrossRef] [PubMed]
  69. Surma, M.; Kuczyńska, A.; Mikołajczak, K.; Ogrodowicz, P.; Adamski, T.; Ćwiek-Kupczyńska, H.; Sawikowska, A.; Pecio, A.; Wach, D.; Józefaciuk, G.; et al. Barley Varieties in Semi-controlled and Natural Conditions—Response to Water Shortage and Changing Environment. J Agron. Crop Sci. 2019, 205, 295–308. [Google Scholar] [CrossRef]
  70. Jacott, C.N.; Boden, S.A. Feeling the Heat: Developmental and Molecular Responses of Wheat and Barley to High Ambient Temperatures. J. Exp. Bot. 2020, 71, 5740–5751. [Google Scholar] [CrossRef]
  71. Paredes, P.; Rodrigues, G.C.; Cameira, M.D.R.; Torres, M.O.; Pereira, L.S. Assessing Yield, Water Productivity and Farm Economic Returns of Malt Barley as Influenced by the Sowing Dates and Supplemental Irrigation. Agric. Water Manag. 2017, 179, 132–143. [Google Scholar] [CrossRef]
  72. Al-Ghzawi, A.L.A.; Al-Ajlouni, Z.I.; Sane, K.O.A.; Bsoul, E.Y.; Musallam, I.; Khalaf, Y.B.; Al-Hajaj, N.; Al-Tawaha, A.R.; Aldwairi, Y.; Al-Saqqar, H. Yield stability and adaptation of four spring barley (Hordeum vulgare L.) cultivars under rainfed conditions. Res. Crop. 2019, 20, 10–18. [Google Scholar]
  73. Cammarano, D.; Ronga, D.; Francia, E.; Akar, T.; Al-Yassin, A.; Benbelkacem, A.; Grando, S.; Romagosa, I.; Stanca, A.M.; Pecchioni, N. Genetic and Management Effects on Barley Yield and Phenology in the Mediterranean Basin. Front. Plant Sci. 2021, 12, 655406. [Google Scholar] [CrossRef] [PubMed]
  74. Kim, Y.-G.; Park, H.-H.; Lee, H.-J.; Kim, H.-K.; Kuk, Y.-I. Growth, Yield, and Grain Quality of Barley (Hordeum vulgare L.) Grown across South Korean Farmlands with Different Temperature Distributions. Agronomy 2022, 12, 2731. [Google Scholar] [CrossRef]
  75. Jurečka, F.; Fischer, M.; Hlavinka, P.; Balek, J.; Semerádová, D.; Bláhová, M.; Anderson, M.C.; Hain, C.; Žalud, Z.; Trnka, M. Potential of Water Balance and Remote Sensing-Based Evapotranspiration Models to Predict Yields of Spring Barley and Winter Wheat in the Czech Republic. Agric. Water Manag. 2021, 256, 107064. [Google Scholar] [CrossRef]
  76. Yawson, D.; Ball, T.; Adu, M.; Mohan, S.; Mulholland, B.; White, P. Simulated Regional Yields of Spring Barley in the United Kingdom under Projected Climate Change. Climate 2016, 4, 54. [Google Scholar] [CrossRef]
  77. Fatima, Z.; Ahmed, M.; Hussain, M.; Abbas, G.; Ul-Allah, S.; Ahmad, S.; Ahmed, N.; Ali, M.A.; Sarwar, G.; Haque, E.U.; et al. The Fingerprints of Climate Warming on Cereal Crops Phenology and Adaptation Options. Sci. Rep. 2020, 10, 18013. [Google Scholar] [CrossRef] [PubMed]
  78. Marcinkowski, P.; Piniewski, M. Effect of Climate Change on Sowing and Harvest Dates of Spring Barley and Maize in Poland. Int. Agrophysics 2018, 32, 265–271. [Google Scholar] [CrossRef]
  79. Freistaat Thüringen Landesamt für Landwirtschaft und Ländlichen Raum. Sortenversuche in Thüringen Sommerbraugerste in Herbstaussaat Versuchsbericht. 2023. Available online: www.tlllr.thueringen.de (accessed on 13 March 2024).
  80. Mao, C.; Xu, J.; Wang, H.; Chen, T.; Bian, H.; You, E.; Shen, Y.; Wang, L. Mechanism of Early Flowering in a Landrace Naked Barley Eam8.l Mutant. Agronomy 2022, 12, 2137. [Google Scholar] [CrossRef]
Figure 1. Workflow and statistical analysis pathway scheme (modified from Alley et al. [40]). Red boxes show the locations of winter and spring barley in the field trial.
Agronomy 14 01503 g001
Figure 2. Observed grain yields (YG) for winter (a) and spring barley (b), 2009–2022. The error bars represent the standard deviation between the two harvesting areas.
Agronomy 14 01503 g002
Figure 3. Correlation matrix showing relationships between the grain yield (YG) and the three yield components (CD, GN, and GW) and further yield parameters (EP, YE, and GD) of winter barley (a) and spring barley (b) in the period 2009–2022. The results of the correlation analysis have been scaled by a color gradient that goes from blue (positive correlations) to red (negative correlations) by increasing color density, significant correlation coefficients at * p ≤ 0.05, ** p ≤ 0.01, and *** p ≤ 0.001. For abbreviations, see Section 2.
Agronomy 14 01503 g003
Figure 4. Principal component analysis (correlation scores distance-based biplot) of grain yield (YG) and yield components (CD, GN, and GW) and yield parameters (EP, YE, and GD) for winter barley in the period 2009–2022. For abbreviations, see Section 2.
Agronomy 14 01503 g004
Figure 5. Principal component analysis (correlation scores distance-based biplot) of grain yield (YG) and yield components (CD, GN, and GW) and yield parameters (EP, YE, and GD) for spring barley in the period 2009–2022. For abbreviations, see Section 2.
Agronomy 14 01503 g005
Figure 6. Average timing and duration of the phenological phases (P1–P4) in the period 2009–2022 for winter barley (outer circle) and spring barley (inner circle).
Agronomy 14 01503 g006
Figure 7. Observed (YG-obs) and calculated (YG-cal) grain yields for spring barley, 2009–2022.
Agronomy 14 01503 g007
Table 1. Statistical values for the grain yield (YG), yield components (CD, GN, and GW), and yield parameters (EP, YE, and GW) of winter barley, 2009–2022. x: mean (bold numbers); max: highest value; min: lowest value; s: standard deviation; cv: coefficient of variation in %. For abbreviations, see Section 2.
ParametersYGCDGNGWEPYEGD
dt/haears/m2grains/earmg/grainears/plantg/eargrains/m2
x61.5405.831.448.91.541.5312,759.6
max76.3545.040.254.92.011.9315,849.8
min39.3311.621.641.91.111.197157.8
s11.569.65.614.380.260.232952.5
cv18.717.117.88.9517.014.923.1
Table 2. Statistical values for the grain yield (YG), yield components (CD, GN, and GW), and yield parameters (EP, YE, and GW) of spring barley, 2009–2022. x: mean (bold numbers); max: highest value; min: lowest value; s: standard deviation; cv: coefficient of variation in %. For abbreviations, see Section 2.
ParametersYGCDGNGWEPYEGD
dt/haears/m2grains/earmg/grainears/plantg/eargrains/m2
x35.6468.817.543.51.410.778040.2
max60.0679.422.452.51.951.0613,473.7
min13.5224.412.429.70.680.523798.1
s 11.6125.72.746.050.390.172780.9
cv32.626.815.613.827.721.834.5
Table 3. Mean (x) meteorological conditions within phenological phases (±standard deviation, s) for winter barley and 14-year linear trend, 2009–2022. For abbreviations, see Section 2. Different letters for the means indicate significant differences (t-test, p ≤ 0.05) between the mean weather conditions in the same development phases between winter and spring barley, a significantly lower values, b significantly higher values compared to spring barley, significant linear trends at * p ≤ 0.05 and ** p ≤ 0.01.
ParameterVegetative Phase  Ear Formation    Anthesis   Grain Filling
x ± sTrend  x ± sTrend    x ± sTrend   x ± sTrend
Tx in °C12.9 ± 1.20 a−0.59  17.6 ± 2.26 a+0.25     20.8 ± 2.68 a+2.64   24.6 ± 2.38 a+5.67 **
Tn in °C5.10 ± 0.96 a−1.26  6.66 ± 1.60 a−1.57    8.71 ± 2.37 a−1.51   12.8 ± 1.25 a+1.76
T in °C8.65 ± 0.94 a−0.97  12.1 ± 1.86 a−0.53    14.8 ± 2.34 a+0.92   19.1 ± 1.93 a+4.11 *
Gr in Wm−2/d6.76 ± 1.17 a−2.21  16.3 ± 2.97 a−1.09    19.4 ± 5.66 a+2.77   20.5 ± 2.30 a−2.22 *
Sd in h/d3.73 ± 0.68 a−0.36  7.57 ± 1.82 a+0.90    8.11 ± 2.95 a+3.51   8.56 ± 1.24 a+1.19
P in mm/d1.35 ± 0.45 b−0.36  0.96 ± 0.57 a−0.08    1.11 ± 0.78 a−0.98   1.81 ± 1.11 a−0.50
ETp in mm/d1.24 ± 0.19 a−0.18  3.10 ± 0.73 a+0.24    3.70 ± 1.39 a+1.45   4.47 ± 0.96 a+2.24 **
CWB in mm/d0.10 ± 0.56 b−0.18 −2.14 ± 1.09 a−0.32   −2.58 ± 1.68 a−2.44  −2.65 ± 1.74 a−2.74
Table 4. Mean (x) meteorological conditions within phenological phases (±standard deviation, s) for spring barley and 14-year linear trend, 2009–2022. For abbreviations, see Section 2. Different letters for the means indicate significant differences (t-test, p ≤ 0.05) between the mean weather conditions in the same development phases between winter and spring barley, a significantly lower values, b significantly higher values compared to winter barley, significant linear trends at * p ≤ 0.05 and ** p ≤ 0.01.
ParameterVegetative Phase  Ear Formation    Anthesis   Grain Filling
x ± sTrend  x ± sTrend    x ± sTrend   x ± sTrend
Tx in °C 17.0 ± 2.27 b−0.84  22.0 ± 2.86 b+5.36 *    24.7 ± 3.92 b+8.00 *   26.0 ± 2.24 b+2.99
Tn in °C 5.93 ± 1.69 a−2.47  10.0 ± 1.52 b+0.83    12.9 ± 2.29 b+3.75   14.5 ± 1.37 b−0.24
T in °C 11.3 ± 2.04 b−1.64  16.2 ± 2.03 b+3.56    19.1 ± 3.00 b+6.42 *   20.3 ± 1.95 a+1.62
Gr in Wm−2/d 15.2 ± 2.62 b−1.97  20.1 ± 2.28 b+1.27    24.0 ± 4.83 b+1.32   20.2 ± 2.60 a−3.47
Sd in h/d 7.13 ± 1.43 b+0.39  8.28 ± 1.73 a+2.54    10.0 ± 2.71 b+3.46   8.32 ± 1.47 a−0.09
P in mm/d 0.87 ± 0.29 a−0.28  1.58 ± 1.18 a−1.49    2.47 ± 2.46 b−0.74   2.33 ± 1.93 a−0.10
ETp in mm/d 2.76 ± 0.61 b−0.02  4.04 ± 0.94 b+2.07 **    5.42 ± 2.21 b+3.70   4.49 ± 1.10 a+0.99
CWB in mm/d−1.89 ± 0.72 a−0.26 −2.45 ± 1.93 a−3.56 *   −2.94 ± 3.71 a−4.43  −2.16 ± 2.71 a−1.09
Table 5. Correlation coefficients between weather elements and the grain yield of winter barley (YG) and yield components (CD, GN, GW) in different phenological phases, significant correlation coefficients (bold numbers) at * p ≤ 0.05. For abbreviations, see Section 2.
ParametersVegetative PhaseEar FormationAnthesisGrain Filling
YG (86% DW, dt/ha)
Tx in °C0.29−0.50−0.090.07
Tn in °C−0.00−0.50−0.02−0.07
T in °C0.13−0.54 *−0.080.07
Gr in Wm−2/d−0.24−0.04−0.11−0.04
Sd in h/d0.33−0.07−0.050.11
P in mm/d−0.38−0.15−0.55 *0.05
ETp in mm/d0.41−0.21−0.040.28
CWB in mm/d−0.510.21−0.28−0.08
CD (ears/m2)
Tx in °C0.36 −0.70 0.17 0.12
Tn in °C0.12 −0.40 −0.26 −0.05
T in °C0.06 −0.21 0.03 0.06
Gr in Wm−2/d0.14 0.04 0.30 −0.06
Sd in h/d−0.25 0.22 0.38 0.14
P in mm/d0.03 −0.01 −0.44 −0.37
ETp in mm/d−0.21 0.07 0.36 0.37
CWB in mm/d−0.07 −0.05 −0.56 *−0.43
GN (grains/ear)
Tx in °C0.35 −0.50 −0.14 0.22
Tn in °C−0.12 −0.20 0.23 0.23
T in °C0.12 −0.43 −0.01 0.28
Gr in Wm−2/d0.35 −0.16 −0.40 −0.12
Sd in h/d0.36 −0.40 −0.38 −0.04
P in mm/d−0.39 0.40 −0.38 0.29
ETp in mm/d0.50 −0.39 −0.34 0.15
CWB in mm/d−0.56 0.46 0.08 0.15
GW (86% DW, mg)
Tx in °C−0.17 0.13 −0.31 −0.48
Tn in °C−0.03 0.08 −0.09 −0.46
T in °C−0.01 0.13 −0.29 −0.48
Gr in Wm−2/d−0.37 0.21 −0.02 0.31
Sd in h/d−0.37 0.25 −0.10 0.10
P in mm/d−0.06 −0.43 0.47 0.23
ETp in mm/d−0.43 0.26 −0.16 0.33
CWB in mm/d0.13 −0.40 0.40 0.31
Table 6. Correlation coefficients between weather elements and the grain yield of spring barley (YG) and yield components (CD, GN, and GW) in different phenological phases, significant correlation coefficients (bold numbers) at * p ≤ 0.05 and ** p ≤ 0.01. For abbreviations, see Section 2.
ParametersVegetative PhaseEar FormationAnthesisGrain Filling
YG (86% DW, dt/ha)
Tx in °C−0.45 −0.66 *−0.79 **−0.24
Tn in °C−0.09 −0.22 −0.63 **0.06
T in °C−0.34 −0.58 *−0.75 **−0.12
Gr in Wm−2/d−0.04 0.26 −0.05 0.40
Sd in h/d−0.21 −0.12 −0.22 0.19
P in mm/d0.19 0.45 0.37 0.05
ETp in mm/d−0.30 −0.24 −0.39 −0.02
CWB in mm/d0.31 0.47 0.57 **0.05
CD (ears/m2)
Tx in °C−0.57 *−0.58 **−0.53 0.12
Tn in °C−0.36 −0.03 −0.51 0.42
T in °C−0.53 −0.50 −0.44 0.23
Gr in Wm−2/d0.16 0.10 0.06 0.02
Sd in h/d−0.03 −0.17 −0.16 −0.08
P in mm/d0.56 *0.32 −0.14 0.01
ETp in mm/d−0.09 −0.28 −0.28 −0.04
CWB in mm/d0.30 0.40 0.06 0.02
GN (grains/ear)
Tx in °C−0.08 −0.15 −0.17 −0.21
Tn in °C0.26 −0.22 0.08 −0.12
T in °C0.06 −0.16 −0.14 −0.14
Gr in Wm−2/d−0.48 0.70 **0.04 0.12
Sd in h/d−0.59 *0.47 −0.01 0.01
P in mm/d0.13 0.07 0.52 −0.03
ETp in mm/d−0.55 *0.46 −0.13 −0.14
CWB in mm/d0.49 −0.20 0.51 0.01
GW (86% DW, mg)
Tx in °C0.02 −0.05 −0.48 −0.31
Tn in °C0.13 −0.06 −0.44 −0.28
T in °C0.07 0.06 −0.53 −0.33
Gr in Wm−2/d−0.01 −0.01 −0.29 0.63 *
Sd in h/d0.07 −0.23 −0.18 0.58 *
P in mm/d−0.66 *0.29 0.56 *0.25
ETp in mm/d0.00 −0.21 −0.14 0.41
CWB in mm/d−0.26 0.34 0.55 *0.13
Table 7. Annual grain yields (YG; dt/ha), yield components (CD; ears/m2, GN; grains/ear, and GW; g/grain), and selected yield parameters (EP; number and YE; g/ear) for spring barley; mean maximum temperature (Tx; °C) during ear formation BBCH 30-49 and anthesis BBCH 50-69; total climatic water balance (CWB; mm) during anthesis BBCH 50-69; and duration (D; day) of ear formation and anthesis phase, 2009–2022. x: mean (bold numbers); s: standard deviation; cv: coefficient of variation in %. For abbreviations, see Section 2.
YearsYGCDGNGWEPYETX
(30–49)
TX
(50–69)
CWB
(50–69)
D
(30–49)
D
(50–69)
200947.3502.217.952.51.820.9421.619.68.91411
201041.9533.319.141.11.680.7917.922.9−52.42513
201129.8396.119.239.11.200.7521.925.0−40.8128
201243.5494.418.946.41.390.8821.418.8−2.2175
201340.6521.116.048.71.740.7919.924.7−6.6233
201460.0600.022.444.51.671.0018.219.619.1256
201526.8431.015.639.91.360.6218.824.1−49.81611
201645.5549.017.347.71.730.8321.525.88.4145
201727.4375.015.646.91.170.7326.425.4−22.6194
201813.5224.417.234.90.680.6026.433.9−20.7182
201928.4268.322.048.10.761.0625.828.46.21910
202027.5417.214.445.71.100.6621.623.9−39.6710
202135.0679.417.329.71.950.5222.326.7−30.4205
202230.9572.712.443.51.500.5424.526.9−36.3147
x35.6468.917.543.51.410.7622.024.7−18.417.37.1
s11.6125.72.746.040.390.162.863.9223.95.063.39
cv32.626.815.613.827.721.812.915.8-29.147.5
Table 8. Multiple linear regression model for the grain yield of spring barley (YG) including the maximum temperature (Tx) during ear formation (BBCH 30-49) and Tx and climatic water balance (CWB) during anthesis (BBCH 50-69). Significant regression coefficients at * p ≤ 0.05, and ** p ≤ 0.01. Regression equation: YG = 107.25 − 1.840 Tx(30-49) − 1.069 Tx(50-69) + 0.247 CWB(50-69).
PhaseRegression ConstantRegression Coefficients
with Significance Level p
Standardized Regression
Coefficients
107.25TxCWBTxCWB
Ear formation −1.840 *
p = 0.020
−0.452
Anthesis −1.069 *
p = 0.050
0.247 **
p = 0.002
−0.3600.508
Model development: MAE = 3.54 dt/ha, RMSE = 4.08 dt/ha, and R2adj = 0.82; cross-validation: MAE = 5.07 dt/ha and RMSE = 5.80 dt/ha.
Disclaimer/Publisher’s Note: The statements, opinions and data contained in all publications are solely those of the individual author(s) and contributor(s) and not of MDPI and/or the editor(s). MDPI and/or the editor(s) disclaim responsibility for any injury to people or property resulting from any ideas, methods, instructions or products referred to in the content.

